 Open Access Article
Creative Commons Attribution 3.0 Unported Licence
Inverse design of porous materials: a diffusion model approach†
Junkil
Park
 a,
Aseem Partap Singh
Gill
 b,
Seyed Mohamad
Moosavi
b and
Jihan
Kim
*a
aDepartment of Chemical and Biomolecular Engineering, Korea Advanced Institute of Science and Technology (KAIST), 291 Daehak-ro, Yuseong-gu, Daejeon 34141, Republic of Korea
bChemical Engineering & Applied Chemistry, University of Toronto, Toronto, Ontario M5S 3E5, Canada
First published on 16th February 2024
Abstract
The success of diffusion models in the field of image processing has propelled the creation of software such as Dall-E, Midjourney and Stable Diffusion, which are tools used for text-to-image generation. Mapping this workflow onto material discovery, a new diffusion model was developed for the generation of pure silica zeolite, marking one of the first applications of diffusion models to porous materials. Our model demonstrates the ability to generate novel crystalline porous materials that are not present in the training dataset, while exhibiting exceptional performance in inverse design tasks targeted on various chemical properties including the void fraction, Henry coefficient and heat of adsorption. Comparing our model with a Generative Adversarial Network (GAN) revealed that the diffusion model outperforms the GAN in terms of structure validity, exhibiting an over 2000-fold improvement in performance. We firmly believe that diffusion models (along with other deep generative models) hold immense potential in revolutionizing the design of new materials, and anticipate the wide extension of our model to other classes of porous materials.
1. Introduction
In recent years, the field of computer vision1,2 and natural language processing3,4 has witnessed remarkable progress with the emergence of deep generative models. Among the various types of deep generative models, diffusion models5 have gained attention as a promising method that addresses the limitations faced by pre-existing generative models such as Generative Adversarial Networks (GANs).5,6 In particular, diffusion models have demonstrated outstanding performance in image generation tasks and have been leveraged in the development of cutting-edge text-to-image generators such as Dall-E,7,8 Midjourney,9 and Stable Diffusion.10 These methods enable generating user-desired images based on the given input prompts (e.g., “draw me an armchair in the shape of avocado”) with the help of the diffusion model.Given its success in various image generation applications, the usage of diffusion models has expanded to other applications including material discovery. This extension involves mapping the conventional image generation tasks based on the provided text to the material generation tasks guided by specified chemical properties. As such, various classes of materials including small molecules,11,12 proteins,13–15 and crystalline materials16–18 have been explored within this context. However, despite these strides, the generation of porous materials using diffusion models remains unexplored due to several challenges arising from the relatively large number of atoms, and the difficulty in capturing the essential topological features for generating porous materials. Consequently, to date, the application of diffusion models for porous material generation remains an untapped opportunity.
In this work, for the first time, porous materials were successfully generated using a diffusion model. Specifically, pure silica zeolites that consist of silicon and oxygen atoms were targeted for the generation. Among the previous attempts made with regard to the design of zeolites and other porous materials,19–31 it must be stated that Deem and coworkers32,33 have employed the Monte Carlo approach, and Kim et al.34 used the GAN architecture to generate new zeolite structures. However, Deem's approach lacked the ability to generate structures with user-desired properties, while the structures generated using Kim's GAN architecture exhibited poor structural validity. In contrast, our diffusion model has successfully generated structures with high validity while exhibiting exceptional capabilities in inverse design at the same time. Specifically, quantitative comparisons with GAN demonstrated that the diffusion model outperforms GAN by more than 2000 times in terms of structure validity, revealing that diffusion models outperform GANs not only in image processing but also in material generation. Furthermore, the ability of our diffusion model to extend to inverse design for various properties such as void fraction, Henry coefficient and heat of adsorption demonstrates the potential of this model to significantly reduce time in user-desired material discovery.
2. Results
2.1. ZeoDiff: a diffusion model for zeolite generation
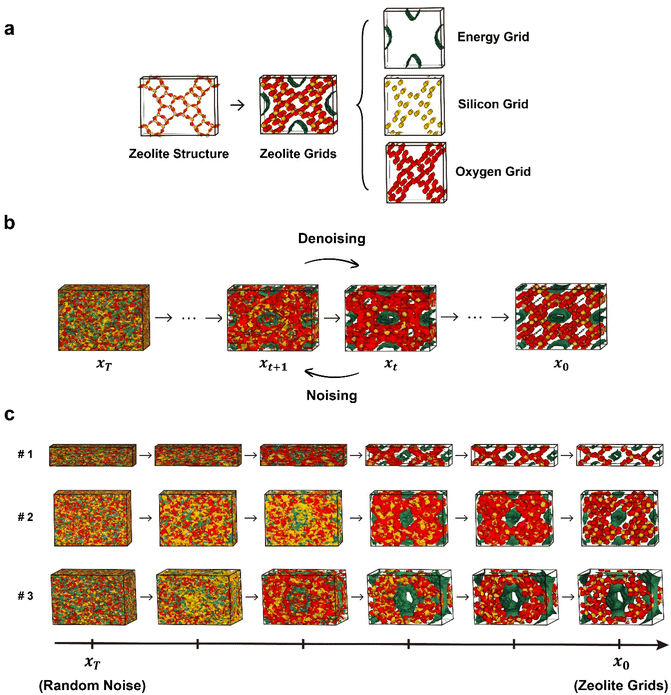
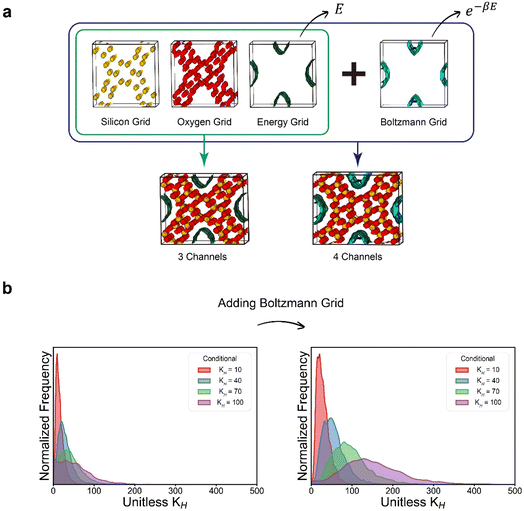
The diffusion models generally operate in the following manner. During the noising process, noise is gradually introduced to a given data point, resulting in its perturbation. Conversely, in the denoising process, which is the reverse of the noising process, the model is trained to remove the introduced noise, allowing for the generation of new samples from random noises.35 In particular, among the various types of diffusion models, the Denoising Diffusion Probabilistic Model (DDPM)35 has played an important role in the widespread adoption of diffusion models by greatly simplifying the loss term of the training process. In this work, on the top of the original DDPM workflow, we developed a new diffusion model named zeolite diffusion (ZeoDiff) with the goal of generating pure silica zeolites.Zeolite structures are represented by three-dimensional grids composed of energy, silicon and oxygen channels akin to RGB channels of an image (Fig. 1a). The energy grid was prepared using methane as a probe gas and calculating the interaction energy between methane and the zeolite framework. On the other hand, the silicon and oxygen grids were prepared by applying Gaussian functions centered at the positions of zeolite atoms. To ensure consistency in the input dimensionality across different zeolite structures, the size of each grid was fixed as 32 × 32 × 32 by using fractional coordinates. Altogether, the three grids (energy/silicon/oxygen) were combined and used as the input representation for ZeoDiff, which is trained to generate new realistic zeolites through the sampling (denoising) process (Fig. 1b). In addition, since the information about the shape of the unit cell is not included in the generated grids, an additional network that uses the correlation between the lattice constants and grid representation was implemented to predict the lattice parameters. To train the models, structures from International Zeolite Association (IZA) and Predicted Crystallography Open Database (PCOD)33 were used. More detailed information on data preparation and training process can be found in the Methods section and ESI Section 1.†
2.2. Generation of zeolites and comparative analysis with GAN
A total of 10![[thin space (1/6-em)]](https://www.rsc.org/images/entities/char_2009.gif) 000 new zeolite grids were generated using ZeoDiff, where the progressive denoising processes of selected samples are illustrated in Fig. 1c. It is evident that as the denoising process proceeds, the overlap amongst the three grids gradually disappears and each colored grid localizes into its own independent regions, and thus morphing into shapes similar to a typical zeolite structure (see ESI Video†).
000 new zeolite grids were generated using ZeoDiff, where the progressive denoising processes of selected samples are illustrated in Fig. 1c. It is evident that as the denoising process proceeds, the overlap amongst the three grids gradually disappears and each colored grid localizes into its own independent regions, and thus morphing into shapes similar to a typical zeolite structure (see ESI Video†).
From the generated zeolite grids, various chemical properties can be directly computed as detailed in the Methods section.36 The void fraction, methane Henry coefficient and isosteric methane heat of adsorption were calculated for the 10![[thin space (1/6-em)]](https://www.rsc.org/images/entities/char_2009.gif) 000 generated samples, and their distributions were compared to the structures comprising the training dataset (Fig. S5†). Two sets of data exhibited similar distributions for all three properties, implying that ZeoDiff had learned the distribution of the realistic zeolites contained in the IZA and PCOD database.
000 generated samples, and their distributions were compared to the structures comprising the training dataset (Fig. S5†). Two sets of data exhibited similar distributions for all three properties, implying that ZeoDiff had learned the distribution of the realistic zeolites contained in the IZA and PCOD database.
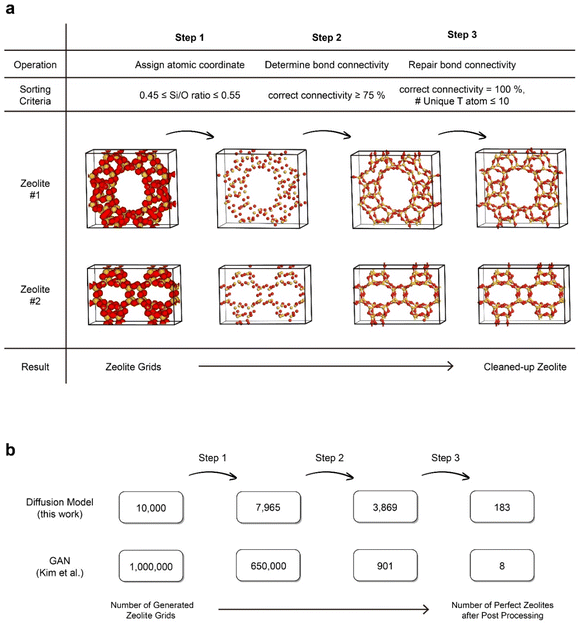
A notable distinction between the generation of visual images and materials lies in the consequences of inaccuracies at the lowest level. While the incorrect coloration of a single pixel in an image of a cat may not pose a significant problem, when considering materials, even the presence of a single atom with disrupted connectivity invalidates the entire structure. Therefore, a post-processing procedure was conducted to obtain zeolite structures with the correct Si/O atom ratio and accurate connectivity. This procedure consists of three steps: atom coordination assignment, bond connectivity determination, and bond connectivity restoration, as illustrated in Fig. 2a. Further details regarding the post-processing steps can be found in ESI Section 2.†
Prior to this work, ZeoGAN34 was developed in our group that used GAN to generate pure silica zeolites and exhibited the ability to generate samples with user-desired properties. To make fair comparisons between the two models, we deliberately aimed to employ the same data representation, training dataset and post-processing procedures as ZeoGAN. In Fig. 2b, the performance of ZeoDiff and ZeoGAN was compared in terms of the percentage of valid zeolite structures generated using the models. Taking the ratio between the perfect zeolite structures generated (after post-processing) to the total number of generated grids, ZeoDiff demonstrated over a 2000-fold improvement compared to ZeoGAN (ZeoDiff: 1.83%, ZeoGAN: 0.0008%). This implies that ZeoDiff possesses a superior capability to generate realistic samples when compared to ZeoGAN, highlighting that the advantage of the diffusion models seen in image processing also extends to material generation.
In Fig. 3, a sample subset collection of cleaned-up zeolite structures generated by ZeoDiff is illustrated. Out of 183 perfect zeolite structures obtained after post-processing, 102 structures were identified as geometrically unique. Among these unique structures, 9 structures were present in the training dataset, another 9 structures were present in the test dataset, while the remaining structures were entirely new. The generated zeolite structures, along with the corresponding zeolites from IZA and PCOD databases, are shown in Fig. S7 and S8.† Furthermore, it is noteworthy that the average number of atoms comprising the unit cell of generated structures was 159.1. This value represents a significant increase compared to precedent studies that utilized diffusion models to generate other crystalline materials16,17 where the number of atoms comprising the unit cell is generally limited (e.g., fewer than 52 for CrysTens16 and ∼20 for CDVAE17), validating ZeoDiff's ability to handle more intricate and complex structures.
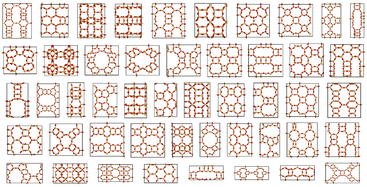 | ||
| Fig. 3 Cleaned-up zeolites generated using ZeoDiff. A sample collection of generated zeolite samples after post-processing. The generated structures exhibited diverse pore structures and topologies. | ||
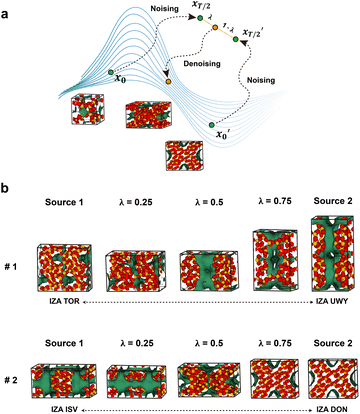
Given its facility to generate new zeolite structures, we pondered on whether the model can be used to generate a new material that consists of a linear combination of two different materials. Image interpolation is a widely employed technique in face morphing35,37 and style transfer38,39 which allows for smooth transitions and blending of visual attributes between images. To achieve image interpolation, generative models can be used to learn the underlying distribution of data and generate new samples by linearly interpolating in the latent space. In this work, for selected zeolite structures from the IZA database, noise was added independently on two of the structures from t = 0 (pristine zeolite) to t = T/2 (half of the fully noisy state). And then, the grids of the two structures at t = T/2 were interpolated within the latent space and were subsequently denoised back to t = 0 (Fig. 4a). Noise was only applied until t = T/2 since it loses all its information if extended to t = T. As depicted in Fig. 4b, the interpolated structures with different interpolation factors (λ) exhibited gradual transformations between two distinct structures, as evidenced by the smooth variation in visual characteristics such as the shape of the energy grid and lattice parameters. Notably, defining an average or intermediate for molecules or crystalline materials is inherently challenging in materials science. In this context, interpolation techniques utilizing generative models offer a potential solution to address this issue.
2.3. Inverse design through conditional generation
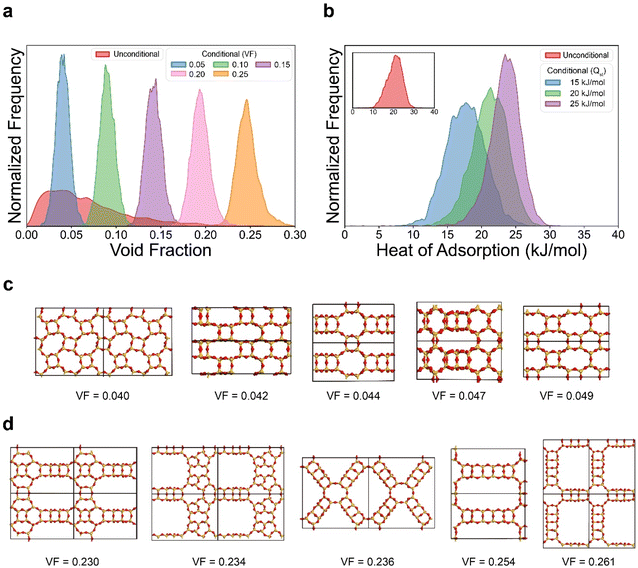
Next, we tested the ability of our model to generate structures with user-desired properties (known as conditional generation). Extension of our model for inverse design was made by using a straightforward approach introduced by Hoogeboom et al.12 This method involves creating an additional input tensor that is composed of the target value and concatenating this with the zeolite grid tensor. The process of inverse design does not alter the behavior of the model, as it only introduces a change in the dimensionality of the input data. The identical dataset with the previous section was used for the training. A detailed explanation on inverse design and conditional generation can be found in ESI Section S4.†The inverse design process of ZeoDiff was first tested for generating zeolites with user-desired void fraction. In the evaluation, 5000 new samples were generated for each of the target void fraction values of 0.05, 0.10, 0.15, 0.20, and 0.25 (see Fig. 5a). Notably, the conditionally generated samples exhibited distinct distributions with their peaks located close to the targeted values. It is noteworthy that samples with a target void fraction value of 0.25 were successfully generated even though the training set lacked sufficient data with high void fraction. In the case of samples generated unconditionally (red in Fig. 5a), their average void fraction was 0.069, and only 0.51% of them exhibited a void fraction greater than 0.25. However, for the samples generated conditionally at 0.25 (yellow in Fig. 5a), they exhibited an average void fraction of 0.247 with 35.8% of the samples showing a void fraction greater than 0.25. Similar results were obtained for inverse design with methane heat of adsorption, where the generated samples with target values of 15, 20, and 25 kJ mol−1 showed distributions with the peaks aligned with the respective targeted value (Fig. 5b). Furthermore, some of the representative samples were examined for void fraction values of 0.05 (Fig. 5c) and 0.25 (Fig. 5d) as a sanity check for the inverse design procedure. From these figures, it can be visually verified that the structures generated with a target value of 0.25 possess larger pore structures compared to those generated with a target value of 0.05.
On the other hand, in the case of the Henry coefficient, the performance of inverse design was not as prominent as that of void fraction and heat of adsorption. The generated samples with different target values (10, 40, 70, and 100) did not exhibit distinct distributions as observed in the void fraction or the heat of adsorption. As can be seen from the equation of the Henry coefficient (see eqn (7)), the Henry coefficient does not directly utilize the energy values from the energy grid, but instead employs its exponential Boltzmann factor. Since the Boltzmann factor is not readily provided within zeolite grids, achieving inverse design for the Henry coefficient can be more challenging. Although the Boltzmann factor is also used in calculating the heat of adsorption (eqn (8)), its ratio weighted on absolute energy is employed thus somewhat “cancelling” the effect of the Boltzmann factors.
To improve the performance of inverse design for the Henry coefficient, an additional 32 × 32 × 32 channel that consists of the Boltzmann factors (called the Boltzmann grid in this work) was added to the existing three girds. Subsequently, inverse design was conducted both with and without the Boltzmann grid, and the generated samples were examined. As depicted in Fig. 6, the generated samples with the supplementary Boltzmann grid exhibited more distinct distributions of the targeted Henry coefficient values. This can be attributed to the fact that the Boltzmann grid provides more straightforward information that enables the neural network to learn the correlation between the zeolite structures and their Henry coefficients. This suggests that, depending on the target properties, users can enhance the overall quality of the inverse design process by integrating an additional channel that is closely relevant to the property of interest.
3. Conclusions
In this work, we developed a diffusion model for the generation of pure silica zeolite, marking the first application of diffusion models to porous materials. Our model successfully generated new zeolite structures unseen during the training phase, and demonstrates over 2000-fold improvement over the GAN model under the same conditions. Moreover, the inverse design of samples with user-desired properties was also achieved through conditional generation and clearly shows vast improvement compared to the unconditional generation case.It should be mentioned that the ZeoDiff model was developed specifically for pure silica zeolites, but extending its application to other classes of porous materials can be readily made by utilizing appropriate atom channels. As materials become more complex, the dimension of the data representation (i.e., number of atom channels) would also increase, making it potentially challenging to utilize the diffusion model for materials such as MOFs and COFs. Nevertheless, we want to note that the increased complexity does not necessarily lead to difficulties in the generation process as it provides additional information on chemical characteristics through inter-channel correlations. One of the other possible approaches is to utilize different variances for different atoms, which would enable the distinction of different atoms even though all of them are placed in a single channel.
One of the potential future directions is to utilize different types of gas probes. We employed a methane energy grid as a case study to represent the property space for the zeolite structures, but users have the flexibility to utilize any other gas probe depending on their specific property of interest. Moreover, the slow sampling speed of diffusion models restricted our exploration of a larger number of generation attempts. However, incorporating more efficient diffusion algorithms40 could reduce computation costs, potentially enabling the construction of a new database with a significantly larger number of structures.
The integration of diffusion models, along with other generative models, holds great promise for driving significant breakthroughs in the field of material discovery and we hope that this work serves as a cornerstone for achieving this.
4. Materials and methods
4.1. ZeoDiff algorithm
ZeoDiff was developed based on the framework of Denoising Diffusion Probabilistic Model (DDPM). Noising process (q) is defined as a Markov chain that adds Gaussian noise to the zeolite grids with pre-defined variances of β1, β2, …, βT | (1) |
Since all noising processes are in the form of Gaussian, noising from pristine zeolite grids (x0) to noisy grids at certain time step t (xt) can be arranged as
 | (2) |
On the other hand, the denoising process (p) is defined as its reverse process, which gradually removes noise and obtains new zeolite grids.
| pθ(xt−1|xt) := N(xt−1;μθ(xt,t), Σθ(xt,t)) | (3) |
One key idea of DDPM is that we can greatly simplify the training process by setting the variance (Σθ) of the denoising process with regard to the variance of the noising process (βt).
 | (4) |
By doing so, the mean (μθ) of the denoising process becomes the only target for the training process. Training is aimed for optimizing the variational bound on negative log likelihood. After organizing the equation, final loss function becomes as follows:
 | (5) |
More detailed explanation on the training process and loss function can be found in Ho et al.35
4.2. Zeolite databases
To train ZeoDiff, zeolite structures with sufficient methane accessibility were selected from the IZA and the PCOD database. The methane Henry coefficient served as the metric for evaluating methane accessibility, and a total of 99![[thin space (1/6-em)]](https://www.rsc.org/images/entities/char_2009.gif) 362 structures with a Henry coefficient greater than 10−6 mol kg−1 Pa−1 were selected. Among these selected structures, 63
362 structures with a Henry coefficient greater than 10−6 mol kg−1 Pa−1 were selected. Among these selected structures, 63![[thin space (1/6-em)]](https://www.rsc.org/images/entities/char_2009.gif) 426 structures (102 from IZA and 63
426 structures (102 from IZA and 63![[thin space (1/6-em)]](https://www.rsc.org/images/entities/char_2009.gif) 324 from PCOD) with orthogonal cell angles were further refined and utilized. The structures were randomly divided into two sets (31
324 from PCOD) with orthogonal cell angles were further refined and utilized. The structures were randomly divided into two sets (31![[thin space (1/6-em)]](https://www.rsc.org/images/entities/char_2009.gif) 713 each), with one set allocated for training and the other set for validation purposes in generating new zeolites. To impose invariances to the model, various data augmentation methods (i.e., translation and rotation) were employed as described in ESI Section 1.†
713 each), with one set allocated for training and the other set for validation purposes in generating new zeolites. To impose invariances to the model, various data augmentation methods (i.e., translation and rotation) were employed as described in ESI Section 1.†
4.3. Molecular simulations and data preparation
Classical molecular simulation was used for the preparation of methane energy grids. Lennard-Jones 12-6 potential model with parameters from García-Pérez et al.41 was used for the calculation of pairwise interaction between atoms. | (6) |
The Lorentz–Berthelot mixing rule was imposed for the calculation. For silicon and oxygen grids, Gaussian function was used to represent the atomic positions of the atoms. The peaks of the Gaussian function are assigned to the position of atoms with the amplitude of 1.0 and variance of 0.5. No damping factor was used in the Gaussian function. To keep the grid sizes the same for all structures, the sizes of all grids were fixed as 32 × 32 × 32 by using fractional coordination. GRIDAY software42 was used for the grid generation tasks.
The Henry coefficient and the isosteric heat of adsorption were directly calculated from the methane energy grids using the following equations:
 | (7) |
 | (8) |
Author contributions
J. P. developed the model, performed the experiments and the data analysis. J. K. directed the project. All authors participated in the discussion and contributed to writing the manuscript.Conflicts of interest
There are no conflicts to declare.Acknowledgements
This work was supported by the National Research Foundation of Korea (NRF) under grant no. 2021R1A2C200358313, and 2021M3A7C208974513, and by the National Supercomputing Center with supercomputing resources including technical support (KSC-2022-CRE-0515). SMM acknowledges the support of the Natural Sciences and Engineering Research Council of Canada (NSERC) under grant number RGPIN-2023-04232.Notes and references
- P. Dhariwal and A. Nichol, Adv. Neural Inf. Process. Syst., 2021, 34, 8780–8794 Search PubMed.
- F.-A. Croitoru, V. Hondru, R. T. Ionescu and M. Shah, IEEE Trans. Pattern Anal. Mach. Intell., 2023, 10850–10869 Search PubMed.
- T. Brown, B. Mann, N. Ryder, M. Subbiah, J. D. Kaplan, P. Dhariwal, A. Neelakantan, P. Shyam, G. Sastry and A. Askell, Adv. Neural Inf. Process. Syst., 2020, 33, 1877–1901 Search PubMed.
- J. Devlin, M.-W. Chang, K. Lee and K. Toutanova, arXiv, 2018, preprint, arXiv:1810.04805, DOI:10.48550/arXiv.1810.04805.
- H. Cao, C. Tan, Z. Gao, G. Chen, P.-A. Heng and S. Z. Li, arXiv, 2022, preprint, arXiv:2209.02646, DOI:10.48550/arXiv.2209.02646.
- I. Goodfellow, J. Pouget-Abadie, M. Mirza, B. Xu, D. Warde-Farley, S. Ozair, A. Courville and Y. Bengio, Commun. ACM, 2020, 63, 139–144 CrossRef.
- A. Ramesh, M. Pavlov, G. Goh, S. Gray, C. Voss, A. Radford, M. Chen and I. Sutskever, Proceedings of the 38th International Conference on Machine Learning, PMLR, 2021, vol. 139, pp. 8821–8831 Search PubMed.
- A. Ramesh, P. Dhariwal, A. Nichol, C. Chu and M. Chen, arXiv, 2022, preprint, arXiv:2204.06125, DOI:10.48550/arXiv.2204.06125.
- Midjourney, 2022, https://www.midjourney.com Search PubMed.
- R. Rombach, A. Blattmann, D. Lorenz, P. Esser and B. Ommer, arXiv, 2022, preprint, arXiv:2112.10752, DOI:10.48550/arXiv.2112.10752.
- M. Xu, L. Yu, Y. Song, C. Shi, S. Ermon and J. Tang, arXiv, 2022, preprint, arXiv:2203.02923, DOI:10.48550/arXiv.2203.02923.
- E. Hoogeboom, V. G. Satorras, C. Vignac and M. Welling, Proceedings of the 39th International Conference on Machine Learning, PMLR, 2022, vol. 162, pp. 8867–8887 Search PubMed.
- K. E. Wu, K. K. Yang, R. v. d. Berg, J. Y. Zou, A. X. Lu and A. P. Amini, arXiv, 2022, preprint, arXiv:2209.15611, DOI:10.48550/arXiv.2209.15611.
- B. L. Trippe, J. Yim, D. Tischer, T. Broderick, D. Baker, R. Barzilay and T. Jaakkola, arXiv, 2022, preprint, arXiv:2206.04119, DOI:10.48550/arXiv.2206.04119.
- N. Anand and T. Achim, arXiv, 2022, preprint, arXiv:2205.15019, DOI:10.48550/arXiv.2205.15019.
- M. Alverson, S. Baird, R. Murdock, J. Johnson and T. Sparks, Digital Discovery, 2024, 3, 62–80 RSC.
- T. Xie, X. Fu, O.-E. Ganea, R. Barzilay and T. Jaakkola, arXiv, 2021, preprint, arXiv:2110.06197, DOI:10.48550/arXiv.2110.06197.
- R. Jiao, W. Huang, P. Lin, J. Han, P. Chen, Y. Lu and Y. Liu, Crystal Structure Prediction by Joint Equivariant Diffusion on Lattices and Fractional Coordinates, Workshop on “Machine Learning for Materials” ICLR 2023, 2023 Search PubMed.
- Z. Yao, B. Sánchez-Lengeling, N. S. Bobbitt, B. J. Bucior, S. G. H. Kumar, S. P. Collins, T. Burns, T. K. Woo, O. K. Farha and R. Q. Snurr, Nat. Mach. Intell., 2021, 3, 76–86 CrossRef.
- H. Park, S. Majumdar, X. Zhang, J. Kim and B. Smit, ChemRxiv, 2023, DOI:10.26434/chemrxiv-2023-71mjq.
- Y. Lim, J. Park, S. Lee and J. Kim, J. Mater. Chem. A, 2021, 9, 21175–21183 RSC.
- J. Park, Y. Lim, S. Lee and J. Kim, Chem. Mater., 2022, 9–16 Search PubMed.
- P. Krokidas, M. Kainourgiakis, T. Steriotis and G. Giannakopoulos, ChemRxiv, 2023, DOI:10.26434/chemrxiv-2023-s726s.
- Y. Comlek, T. D. Pham, R. Snurr and W. Chen, npj Comput. Mater., 2023, 9, 170 CrossRef CAS.
- M. Zhou and J. Wu, npj Comput. Mater., 2022, 8, 256 CrossRef CAS.
- M. Zhou, A. Vassallo and J. Wu, J. Membr. Sci., 2020, 598, 117675 CrossRef CAS.
- A. Gandhi and M. F. Hasan, Curr. Opin. Chem. Eng., 2022, 35, 100739 CrossRef.
- D. A. Gomez-Gualdron, O. V. Gutov, V. Krungleviciute, B. Borah, J. E. Mondloch, J. T. Hupp, T. Yildirim, O. K. Farha and R. Q. Snurr, Chem. Mater., 2014, 26, 5632–5639 CrossRef CAS.
- D. M. Anstine, D. S. Sholl, J. I. Siepmann, R. Q. Snurr, A. Aspuru-Guzik and C. M. Colina, Curr. Opin. Chem. Eng., 2022, 36, 100795 CrossRef.
- P. G. Boyd, A. Chidambaram, E. García-Díez, C. P. Ireland, T. D. Daff, R. Bounds, A. Gładysiak, P. Schouwink, S. M. Moosavi and M. M. Maroto-Valer, Nature, 2019, 576, 253–256 CrossRef CAS PubMed.
- S. Wang, X. Guo and L. Zhao, arXiv, 2022, preprint, arXiv:2201.11932, DOI:10.48550/arXiv.2201.11932.
- D. J. Earl and M. W. Deem, Ind. Eng. Chem. Res., 2006, 45, 5449–5454 CrossRef CAS.
- R. Pophale, P. A. Cheeseman and M. W. Deem, Phys. Chem. Chem. Phys., 2011, 13, 12407–12412 RSC.
- B. Kim, S. Lee and J. Kim, Sci. Adv., 2020, 6, eaax9324 CrossRef CAS PubMed.
- J. Ho, A. Jain and P. Abbeel, Adv. Neural Inf. Process. Syst., 2020, 33, 6840–6851 Search PubMed.
- S. Lee, B. Kim and J. Kim, J. Mater. Chem. A, 2019, 7, 2709–2716 RSC.
- N. Zhang, X. Liu, X. Li and G.-J. Qi, arXiv, 2023, preprint, arXiv:2302.09404, DOI:10.48550/arXiv.2302.09404.
- X. Huang and S. Belongie, arXiv, 2017, arXiv:1703.06868, DOI:10.48550/arXiv.1703.06868.
- V. Dumoulin, J. Shlens and M. Kudlur, arXiv, 2016, preprint, arXiv:1610.07629, DOI:10.48550/arXiv.1610.07629.
- J. Song, C. Meng and S. Ermon, arXiv, 2020, preprint, arXiv:2010.02502, DOI:10.48550/arXiv.2010.02502.
- E. García-Pérez, J. B. Parra Soto, M. C. Ovín Ania, A. García Sánchez, J. Van Baten, R. Krishna, D. Dubbeldam and S. Calero, J. Phys. Chem. C, 2009, 113(20), 8814–8820 CrossRef.
- https://github.com/good4488/GRIDAY2 .
Footnote |
| † Electronic supplementary information (ESI) available. See DOI: https://doi.org/10.1039/d3ta06274k |
| This journal is © The Royal Society of Chemistry 2024 |

