 Open Access Article
Proton conductor NASICON-structure Li1+xCdx/2Zr2−x/2(PO4)3 as solid electrolyte for intermediate-temperature fuel cells†
Xiuxiu
Li
a,
Enyi
Hu
a,
Faze
Wang
 *a,
Peter
Lund
b,
Bin
Zhu
 a and
Jun
Wang
*a
aJiangsu Provincial Key Laboratory of Solar Energy Science and Technology, School of Energy & Environment, Southeast University, Nanjing 210096, China. E-mail: fazewang@seu.edu.cn; wj-jw@seu.edu.cn
bDepartment of Engineering Physics/Advanced Energy Systems, School of Science, Aalto University, Aalto 00076, Finland
First published on 18th January 2024
Abstract
Low ionic conductivity of solid electrolytes at intermediate temperatures hinders the commercialization process of solid fuel cell technology. A sodium superionic conductor (NASICON)-structure with a rigid three-dimensional network and an interconnected interstitial space is expected to be an ideal solid electrolyte for fuel cells. Based on the H+/Li+ exchange engineering strategy, here we report a NASICON-structure proton conductor Li1+xCdx/2Zr2−x/2(PO4)3 (x = 0.5, 1, 1.5, 2) derived from CdZr4(PO4)6 to construct a fuel cell device. Among all samples, the Li3Cd1Zr1(PO4)3 cell device exhibits a high performance including peak power density 815 mW cm−2, proton conductivity 0.165 S cm−1 and activation energy 0.372 eV at 550 °C. Theoretical and experimental studies both suggest that the high proton conductivity benefits from the unique 3D interstitial space and rapid H+/Li+ exchange in the NASICON material. Under fuel cell operating conditions, the interstitial space of Li1+xCdx/2Zr2−x/2(PO4)3 (x = 2) substitutes mobile Li+ with H+ enabling fast proton transport. The new transport mechanism and excellent proton conductivity suggest that Li1+xCdx/2Zr2−x/2(PO4)3 provides new opportunities for enriching novel electrolyte materials in intermediate temperature protonic ceramic fuel cells (IT-PCFCs).
1. Introduction
A solid oxide fuel cell (SOFC) is an electrochemical device that can directly convert the chemical energy of hydrogen or another fuel to electrical energy through an electrochemical reaction without a conventional combustion process.1–3 The fuel cell system has been utilized in a variety of energy applications.4,5 The attractive characteristics make them quite fitting for addressing the energy crisis in the present situation of international energy development. Unfortunately, the large-scale commercialization of SOFCs is still challenging because of low ionic conductivity at high operating temperatures. Though proton conductors at lower temperatures have been proposed to promote the commercialization and future development of SOFCs,6–8 intermediate temperature protonic ceramic fuel cells (IT-PCFCs) still face the challenge of how to guarantee high performance at lower temperatures. Therefore, novel-class electrolyte materials need to be further explored and discovered to meet the more stringent requirements.Sodium superionic conductor NASICON (Na superionic conductor)-type oxide-based materials are considered to be one of the most promising solid electrolytes due to their reasonable high Li-ion conductivities at room temperature.9–11 PO4 tetrahedra and metal oxide octahedra constitute the three-dimensional connected crystal skeleton of NASICON electrolyte, and partial Li+ fills the pores of the skeleton structure to construct three-dimensional connected ion transport channels. The essential structural feature of rigid and three-dimensional NASICON materials is an interconnected interstitial space that is occupied by mobile Li+ ions.12–14 These mobile lithium ions can migrate freely and exhibit certain ion conduction properties at room temperature.
In recent years, a study on the H+/Li+ exchange engineering strategy has been proposed to turn a lithium-ion conductor into a proton conductor. Li+ ions can be substituted by H+, which implies that protons can transport through existing interstitial Li+ space to exhibit the proton conduction function.15–17 The ion-exchange strategy has been applied to fast lithium-ion conductors including Garnet18,19 and LISICON20–23 structure materials. Chen et al.20 reported that the Li13.7In0.2Sr0.1Zn(GeO4+δ)4 material was successfully converted into a proton conductor and exhibited a proton conductivity of 0.094 S cm−1 in a hydrogen atmosphere at 600 °C. Matsui et al.23 demonstrated that the Li3.13H0.37Zn0.25GeO4 conductor through the simple ion-exchange method could even obtain 5.5 mS cm−1 of electrical conductivity at 200 °C. As fast sodium-ion conductors with a similar structure, NASICON-structure materials are likely to benefit from this ion-exchange strategy. This strategy has been successfully applied to NASICON materials in reports from Stenina et al.24,25 indicating the great potential to turn NASICON materials into proton conductor electrolytes. Lu et al.26 reported that the Li vacancy generated after Li migration in NASICON materials provides the proton migration path under fuel cell conditions. However, the application of the interesting ion-exchange method on NASICON electrolytes is limited and needs further exploration.
Considering that the new proton transport mechanism may bring new opportunities and inject new vitality into the development of IT-PCFCs, from the perspective of the H+/Li+ engineering strategy, novel Li1+xCdx/2Zr2−x/2(PO4)3 (x = 0.5, 1, 1.5, 2) materials were designed as a proton electrolyte for IT-SOFCs, which have a rigid 3D interstitial space for proton transport and therefore enhance ion conductivity. In comparison to pristine CdZr4(PO4)6, the effects of lithium content (x = 0.5, 1, 1.5, 2) in Li1+xCdx/2Zr2−x/2(PO4)3 on the crystal structure, electrochemical performance, and proton transport characteristics were studied. Our results demonstrated that the optimal component Li3Cd1Zr1(PO4)3 is the promising electrolyte candidate for LT-PCFCs. DFT calculations predict the most probable H+/Li+ trajectories and confirm the proton transport mechanism in Li3Cd1Zr1(PO4)3 complementing the experimental results. The novel proton transport mechanism has great potential in protonic conductor design and optimization for PCFC application.
2. Experimental section
2.1. Materials preparation
Li1+xCdx/2Zr2-x/2(PO4)3 (x = 0.5, 1, 1.5, 2) and CdZr4(PO4)6 powder were synthesized by the sol–gel method with the precursors ZrOCl2·6H2O (Aldrich), Cd(NO3)2·4H2O (Aldrich), Li2CO3 (Aldrich) and NH4H2PO4 (Aldrich, 99.99%). Li2CO3 and NH4H2PO4 were dissolved in deionized water at a stoichiometric ratio and stirred for half an hour. Then the solution was added dropwise to the ZrOCl2·6H2O and Cd(NO3)2 solution with continuous stirring. After evaporating the solvent at 80 °C, the resulting powder was heated at 450 °C in air for 10 hours to burn off volatiles. The final product was obtained after a secondary calcination step at 750 °C for 12 h in air.2.2. Fuel cell fabrication and measurements
A symmetric cell with a single-cell configuration of Ni-NCAL/Electrolyte/NCAL-Ni was used for the electrochemical measurement. The as-prepared Li1+xCdx/2Zr2−x/2(PO4)3 and CdZr4(PO4)6 were used as the electrolyte membrane and NCAL (Ni0.8Co0.15Al0.05Li-oxide, B&M Science and Technology Co., Ltd, Tianjin, China) was pasted on the nickel foam and used as the electrode for the oxygen reduction reaction (ORR) and hydrogen oxidation reaction (HOR). NCAL powder was first mixed with absolute ethanol to form a black slurry, and then painted on the nickel foam with a thickness of 2 mm. The electrode was baked for 30 minutes at 100 °C to evaporate the solvent and obtain the final electrode for testing. In order to obtain the single fuel cell NCAL-Ni/Electrolyte/NCAL-Ni with symmetrical configuration, Li1+xCdx/2Zr2−x/2(PO4)3 (x = 0.5, 1, 1.5, 2) and CdZr4(PO4)6 powder were sandwiched between two same pieces of NCAL-Ni electrodes at a pressure over 200 Mpa. The obtained single cell device possesses 0.64 cm2 effective working area and ∼1 mm thickness.The as-fabricated fuel cells were fixed on a stainless-steel sample holder and then were preheated at 550 °C for 30 min before testing. During the performance test, hydrogen and ambient air served as fuel and an oxidizer with a flow velocity of 100 ml min−1, respectively. The electrochemical impedance spectra (EIS) measurement was carried out on a CHI660E electrochemical work station (CH Instruments Ins.) in open circuit voltage (OCV) mode. During the EIS test, the AC voltage amplitude was 5 mV and frequency range was from 0.1 Hz to 1 MHz. The experimental impedance data were then fitted using the software Zview2. The I–V (current–voltage) and I–P (current-power) data of the cells at 460–550 °C were recorded using an IT8511 electronic load (ITECH Electrical Co., Ltd) using IT7000 software.
For the ion conductivity measurement of Li3Cd1Zr1(PO4)3, Ag was used as the current collector instead of NCAL electrodes. The electrolyte powder was ground and pressed using the same manufacturing method as above. Both sides of the pellet were painted with Ag paste to fabricate the Ag/Li3Cd1Zr1(PO4)3/Ag device and then heated at 550 °C for 1 h. During the test, the pellets were assembled in the sample holder under different atmospheres (N2/N2, H2/H2 and air/air) and the EIS (or I–t curve) data were collected using the CHI660E electrochemical workstation.
2.3. Materials characterization
The phase structures of Li1+xCdx/2Zr2−x/2(PO4)3 (x = 0.5, 1, 1.5, 2) and CdZr4(PO4)6 powder were identified using an X-ray diffractometer (Germany, Bruker Corporation) with Cu Kα radiation (λ = 1.5418 Å). The angular range of 2θ is between 10° and 40°, and the scanning step was 0.02°. Morphological properties of the synthesized samples were obtained by scanning electron microscopy (SEM, Thermo Scientific Apreo 2C). The cross-sectional structural morphology of the fuel cell was recorded by scanning electron microscopy (SEM, ZEISS Siama 500). High resolution transmission electron microscopy (HR-TEM) and energy dispersive X-ray spectroscopy (EDS) characterization studies were performed on an FEI Titan G2 60-300. The surface element compositions and valence states of Li1+xCdx/2Zr2−x/2(PO4)3 (x = 0.5, 1, 1.5, 2) and CdZr4(PO4)6 powder were identified using X-ray photoelectron spectroscopy (XPS, Shimadzu AXI Sultra DLD) with Al Kα radiation. To analyze the surface characteristics of powder, Raman spectra analysis was performed at room temperature on a Thermo Scientific DXR3xi microscopic Raman spectrometer with a 532 nm laser and 10× microscope objective. Fourier transform infrared spectroscopy (FTIR) spectral data were obtained using a Fourier transform infrared spectrometer (Thermo Scientific Nicolet iS20) in the wavelength range of 400–4000 cm−1.2.4. Simulation and numerical analysis
The Vienna Ab Initio Simulation Package (VASP) was employed to perform all the density functional theory (DFT) calculations within the generalized gradient approximation (GGA) using the Perdew, Burke, and Enzerhof (PBE) formulation.27–29 The projected augmented wave (PAW) potentials were applied to describe the ionic cores and take valence electrons into account using a plane wave basis set with a kinetic energy cutoff of 450 eV.30,31 Partial occupancies of the Kohn–Sham orbitals were allowed using the Gaussian smearing method and a width of 0.05 eV. The electronic energy was considered self-consistent when the energy change was smaller than 10−6 eV. A geometry optimization was considered convergent when the force change was smaller than 0.05 eV Å−1. Grimme's DFT-D3 methodology was used to describe the dispersion interactions.32 The equilibrium lattice constants of the Li3CdZr(PO4)3 unit cell were optimized when using a 3 × 3 × 2 Monkhorst–Pack k-point grid for Brillouin zone sampling. The climbing image-nudged elastic band method had been employed to calculate the H/Li ion migration barriers in the Li3CdZr(PO4)3 structures.3. Results and discussion
3.1. Carrier transport mechanism analysis
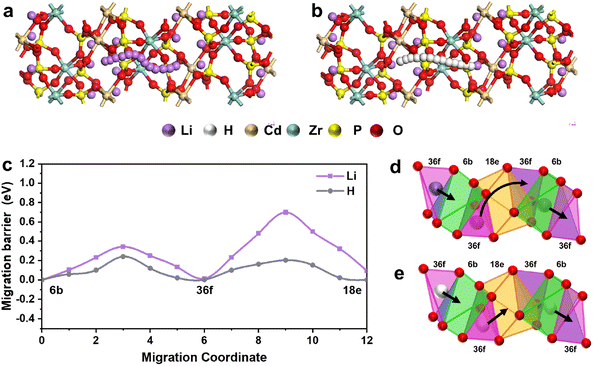
In order to explore the conduction mechanism of the Li3Cd1Zr1(PO4)3 electrolyte material under fuel cell conditions, DFT theoretical computations based on VASP were adopted here to predict the ion transport trajectories. As Li3Cd1Zr1(PO4)3 crystallizes in the orthorhombic system with the Pnma space group, alternation of chains ZrO6 and CdO6 octahedra are linked together by PO4 tetraheadra sharing oxygen vertices, whereas the Li+ ions are distributed in different sites. Some Li+ ions are fixed in the skeleton structure to construct three-dimensional connected ion-transport channels, and other lithium ions migrate freely in the interconnected interstitial space.In the fuel cell test conditions, a steady stream of hydrogen injection brings lots of H+ ions to enter the interstitial space which has been filled by some Li+ ions. Based on the climbing image-nudged elastic band method, both the proton and Li ions can move freely in the interstitial space within the 3D transport network as schematically illustrated in Fig. 1a and b. The migration path of lithium ions and protons in the 3D structure is obtained by simulation calculation, and it is clear that the proton migration path is shorter.
Further calculations of the migration barrier of H/Li ions on the migration route are shown in Fig. 1c. In the migration path from the 6b site to the 36f site, the migration barrier of protons is 0.23 eV lower than that of lithium ions (0.34 eV). The energy barrier of 230 meV for this migration route is close to the value reported in the previous research.14,33 The maximum migration barrier of lithium ions is as high as 0.7 eV, while the proton is still at a low value of 0.2 eV in the 36f–18e path. Therefore, the proton possesses a lower migration barrier compared with lithium ions in the whole migration route, which indicates that the proton is the main transport carrier in the Li3CdZr(PO4)3 material under fuel cell conditions.
To further demonstrate the ion hopping method in interstitial spaces, the detailed transition paths of protons and lithium ions are depicted in Fig. 1d and e. Here, three ions (Li+/H+) in different sites are selected to illustrate the cooperative hopping method, two in 36f sites and 1 in 6b site. The ion (Li+/H+) residing in the tetrahedral 36f site displaces the face-sharing octahedral 6b site. Li ions in 36f sites hop right along the surface of the polyhedron 18e site to the opposite tetrahedral 36f site, whereas the proton adopts the path of direct hopping through the polyhedron 18e site. Different transition modes explain the apparent barrier difference between the 36f and 18e sites even if the migration site is the same. The ion (Li+/H+) originally in the center of the octahedral 6b site is pushed to the tetrahedral 36f site on the right. Based on the same cooperative hopping mechanism, this kind of transition method can continue to propagate in the Li3CdZr(PO4)3 network.
In general, the migration sites of the protons and lithium ions are the same, but the different migration modes lead to different path lengths, which directly affect the value of the migration energy barrier. Under fuel cell test conditions, the proton possesses the lower migration barrier and is considered the main carrier contributing to the ionic conductivity characteristics of the Li3CdZr(PO4)3 cell device.
3.2. Phase and structural analysis
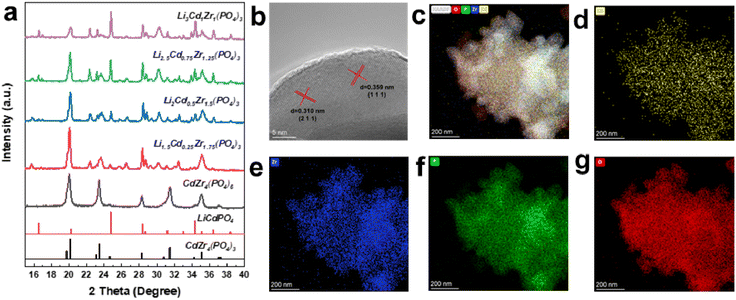
Based on the conclusion from the above theoretical calculations, we predicted that NASICON-type solid electrolyte would be a good conductor for proton transfer. Hence, the series Li1+xCdx/2Zr2−x/2(PO4)3 with different Li contents were successfully synthesized by the sol–gel method. The XRD patterns of Li1+xCdx/2Zr2−x/2(PO4)3 (x = 0.5, 1, 1.5, 2) and CdZr4(PO4)6 samples are shown in Fig. 2a. The XRD pattern of the CdZr4(PO4)6 sample is in good agreement with the olivine-type structure with the space group R![[3 with combining macron]](https://www.rsc.org/images/entities/char_0033_0304.gif) (PDF 45-0017) belonging to the trigonal system. No extra impurity phases are observed in the synthesized sample, confirming the successful single-phase structure. The diffraction peaks of Li1+xCdx/2Zr2−x/2(PO4)3 (x = 0.5, 1, 1.5, 2) samples conformed to crystal structures of LiCdPO4 (PDF 81-0508) and CdZr4(PO4)6 (PDF 45-0017), and some extra peaks are also detected and attributed to ZrO2 (PDF 89-9069). The reason for the extra impure phase is probably that Li and P are both easy to volatilize in high temperature synthesis procedures.34 With an increase in lithium element doping, the trigonal structure system of CdZr4(PO4)6 is further transformed into the olivine-type structure of LiCdPO4 with the Pnma space group attributed to the orthorhombic system, and the content of the impure phase also decreases in this process, which creates a broader interstitial space for ions moving freely.
(PDF 45-0017) belonging to the trigonal system. No extra impurity phases are observed in the synthesized sample, confirming the successful single-phase structure. The diffraction peaks of Li1+xCdx/2Zr2−x/2(PO4)3 (x = 0.5, 1, 1.5, 2) samples conformed to crystal structures of LiCdPO4 (PDF 81-0508) and CdZr4(PO4)6 (PDF 45-0017), and some extra peaks are also detected and attributed to ZrO2 (PDF 89-9069). The reason for the extra impure phase is probably that Li and P are both easy to volatilize in high temperature synthesis procedures.34 With an increase in lithium element doping, the trigonal structure system of CdZr4(PO4)6 is further transformed into the olivine-type structure of LiCdPO4 with the Pnma space group attributed to the orthorhombic system, and the content of the impure phase also decreases in this process, which creates a broader interstitial space for ions moving freely.
The morphology of the CdZr4(PO4)6 and Li3Cd1Zr1(PO4)3 samples characterized by the SEM method is shown in Fig. S1.† Both samples are made of nanoparticles smaller than 100 nm and the agglomeration is severe probably because of the insufficient grinding. Fig. 2b presents the HRTEM image of Li3Cd1Zr1(PO4)3 powder. Clear lattice fringes with spacing distances of 3.59 Å and 3.10 Å could be observed, corresponding to the (111) and (211) crystal planes of the olivine-type structure consistent with the XRD results. As presented in Fig. 2c–g, high-angle annular dark-field (HAADF) image and corresponding EDS elemental mappings of Li3Cd1Zr1(PO4)3 powder further confirm the characteristic of uniform distribution of elements. Due to the limitations of EDS technology, the distribution of Li element is not observed here. XPS characterization will be used to determine the existence of lithium in the following section.
3.3. XPS analysis
The XPS technology was adopted here to analyze the surface chemical valence states of the as-synthesized CdZr4(PO4)6 and Li3Cd1Zr1(PO4)3 samples. The presence of lithium in Li3Cd1Zr1(PO4)3 was determined using this technique. The recorded XPS spectra of P 2p, Li 1s, Zr 3d, and Cd 3d for the two sample powders are presented in Fig. 3.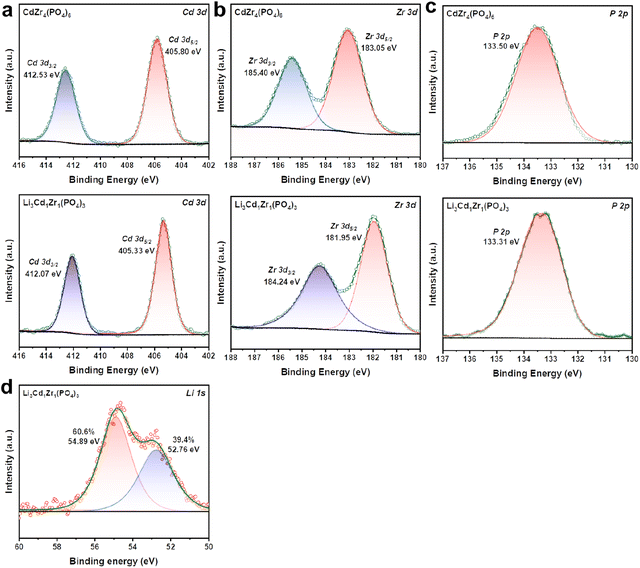 | ||
| Fig. 3 XPS spectra of (a) Cd 3d, (b) Zr 3d, and (c) P 2p for CdZr4(PO4)6 and Li3Cd1Zr1(PO4)3 samples. XPS spectra of (d) Li 1s for the Li3Cd1Zr1(PO4)3 sample. | ||
As shown in Fig. 3a, the peaks located at binding energies of 412.07 eV (412.53 eV) and 405.33 eV (405.80 eV) are assigned to be the satellite peaks of Cd 3d3/2 and Cd 3d5/2, which are consistent with the previous report for Cd2+.35 Zr exists in a +4 valence state due to the couple of spin orbital peaks of Zr 3d3/2 located at 184.24 eV (185.40 eV) and Zr 3d5/2 at 181.95 eV (183.05 eV)36 observed in Fig. 3b. As shown in Fig. 3c, the peak located at 133.31 eV (133.50 eV) is assigned to be the characteristic peak of P 2p, which characterizes the +5 valence state.37 In comparison to CdZr4(PO4)6, the peaks of Li3Cd1Zr1(PO4)3 in cation-site elements (Cd, Zr and P) all shift towards higher binding energy due to the complexed ionic coordination environment caused by lithium-ion doping. However, the binding energy differences between doublets are very close, indicative of no detectable change in the spin orbit components. Fig. 3d confirms the presence of Li+ with a characteristic binding energy of 54.89 eV attributed to Li3PO4 (ref. 38) and 52.76 eV attributed to Li2O (ref. 39) in Li3Cd1Zr1(PO4)3, which indicates the successful introduction of Li into the olivine type structure.
The deconvoluted spectrum of O 1s was collected to further analyze the oxygen vacancy depicted in Fig. S2.† It includes three characteristic peaks corresponding to lattice oxygen (OL), oxygen vacancy (Ov), and chemically adsorbed oxygen species (Oa).40 Ov is ascribed to defect oxide which is beneficial for ionic transport. Oa is the chemisorbed oxygen species which are easily liberated at fuel cell operating temperature. It is worth noting that Ov occupies the dominant position in Li3Cd1Zr1(PO4)3 while OL is dominant in CdZr4(PO4)6, illustrating an apparent increment of surface oxygen vacancies in the Li3Cd1Zr1(PO4)3 sample attributed to the doping of lower valent Li+.
3.4. Raman spectra analysis
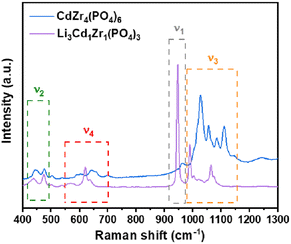
Raman spectroscopy is used to verify the lithium incorporation in the olivine-type structure. Raman spectra of both CdZr4(PO4)6 and Li3Cd1Zr1(PO4)3 samples were measured and are presented in Fig. 4, which agree well with the assignments reported in the previous study.41–44 Considering that the lithium atoms located in sites with inversion symmetry are not spectroscopically active, lithium vibrations are hard to be identified. Here an attempt is made to indirectly prove the successful doping of lithium based on the movement of other bonds. The bands located above 400 cm−1 are attributed to internal modes originating from the intramolecular vibrations of the (PO4)3− anion. Four bands are observed between 1100 and 900 cm−1 in the Raman spectrum of Li3Cd1Zr1(PO4)3. The salient Raman signature with the highest intensity at 948 cm−1 is assigned to the symmetric P–O stretching vibration band of υ1. The antisymmetric stretching bands of the PO43− anion (υ3) appear in the bands between 990 and 1100 cm−1. Raman bands between 550 and 700 cm−1 are ascribed to υ4 of O–P–O asymmetric bending vibrations. The frequencies located at 440 cm−1 and 476 cm−1 are related to the O–P–O symmetric bending vibration of υ2. For the undoped CdZr4(PO4)6 sample, Raman bands observed at 963 cm−1 (υ1), 448 cm−1 and 478 cm−1 (υ2), 1000–1150 cm−1 (υ3) and 550–700 cm−1 (υ4) belong to the functional group (PO4)3−. The Raman peaks of Li3Cd1Zr1(PO4)3 samples red-shift in comparison to the undoped CdZr4(PO4)6 probably because the incorporation of Li into the CdZr4(PO4)6 structure creates lattice disorder, hence confirming the successful incorporation of lithium.3.5. Electrochemical analysis
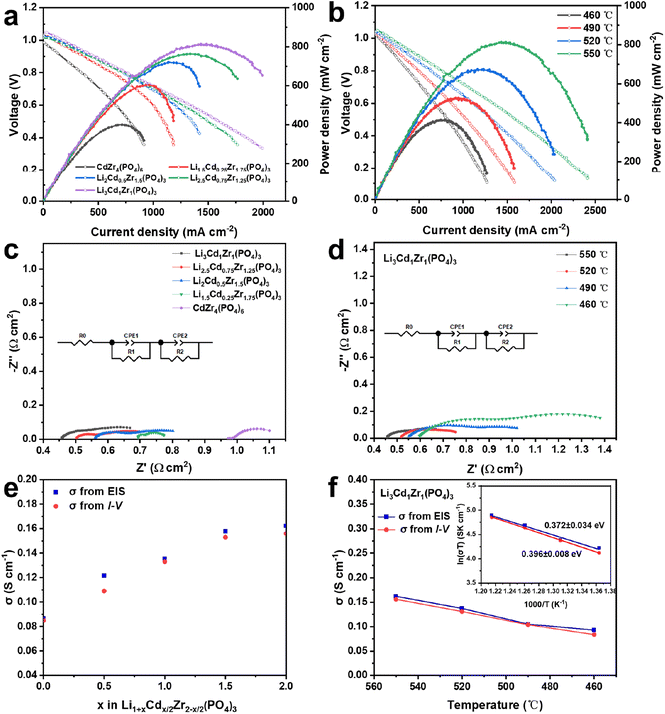
The Li1+xCdx/2Zr2-x/2(PO4)3 (x = 0.5, 1, 1.5, 2) and CdZr4(PO4)6 electrolyte samples are applied to fuel cells to conduct further study. As presented in Fig. 5a, the I–V and I–P performances of the fuel cell device with different solid electrolytes are assessed and compared in H2/air at 460–550 °C. All the cell devices exhibit about 1.0 V high OCVs at 550 °C, suggesting that electronic leakage could be negligible. The pristine CdZr4(PO4)6 device demonstrates a maximum peak power density (Pmax) of 402 mW cm−2 at 550 °C. However, the electrochemical performance is improved with an increase in lithium introduction to Li1+xCdx/2Zr2−x/2(PO4)3 (x = 0.5, 1, 1.5, 2) materials, and the Li3Cd1Zr1(PO4)3 fuel cell reaches a maximum Pmax of 815 mW cm−2 at 550 °C, which is two times higher than that of the CdZr4(PO4)6 cell. The electrochemical performance of the Li1+xCdx/2Zr2−x/2(PO4)3(x = 0.5, 1, 1.5, 2) cells is apparently higher than that of the pristine CdZr4(PO4)6 device, which may be because of the higher ionic conductivity of Li1+xCdx/2Zr2−x/2(PO4)3(x = 0.5, 1, 1.5, 2) beneficial from lithium doping creating more ion migration channels. As shown in Fig. 5b, the Li3Cd1Zr1(PO4)3 cell device yields a Pmax of 677 mW cm−2, 530 mW cm−2, and 421 mW cm−2 at 520 °C, 490 °C and 460 °C, respectively. It is attractive that the Li3Cd1Zr1(PO4)3 cell device shows considerable OCV and power density even at 460 °C, which indicates that this material is the potential electrolyte for IT-PCFCs.The electrochemical impedance spectroscopy (EIS) plots for the Li1+xCdx/2Zr2−x/2(PO4)3 (x = 0.5, 1, 1.5, 2) and CdZr4(PO4)6 device were recorded under H2/air and are shown in Fig. 5c and d. The experimental EIS data were fitted with an equivalent circuit of Ro (R1CPE1) (R2CPE2). R represents the resistance, which can be further subdivided into three major parts consisting of the ohmic resistance Ro, anode polarization resistance R1 and cathode polarization resistance R2, respectively. CPE represents the constant phase element for a non-ideal capacitor. The simulation results of Li1+xCdx/2Zr2-x/2(PO4)3 (x = 0.5, 1, 1.5, 2) and CdZr4(PO4)6 cell device are summarized in Tables S1–S2.† The Li3Cd1Zr1(PO4)3 cell device yields a minimum ohmic resistance of 0.45 Ω cm2, and the increase of lithium doping leads to a lower Ro than that of the pristine CdZr4(PO4)6 device (0.96 Ω cm2) at 550 °C, which coincides with the electrochemical performance. Table S2† lists the simulation results of the Li3Cd1Zr1(PO4)3 cell under H2/air conditions at 460–550 °C. The ohmic resistance Ro decreases from 0.59 to 0.45 Ω cm2 when the temperature increases from 460 to 550 °C, indicating the facilitated electrode reaction process of the Li3Cd1Zr1(PO4)3 cell.
To further confirm the superior ionic conduction of the Li3Cd1Zr1(PO4)3 cell at intermediate temperatures, the ionic conductivities of the five materials were calculated and are compared in Fig. 5e and f. The ionic conductivity is calculated according to the relation σ = L/RS, where L is the thickness of the electrolyte pellet, R is the resistance from the EIS simulation results or the intermediate ohmic polarization region of the I–V polarization curves, and S is the active area of the electrolyte pellet. The cross-sectional view of the fabricated fuel cell device is shown in Fig. S3† and the thickness of the electrolyte pellet is 0.55 mm. The ionic conductivity calculated from EIS and I–V curves of the Li1+xCdx/2Zr2-x/2(PO4)3 (x = 0.5, 1, 1.5, 2) and CdZr4(PO4)6 device is presented in Fig. 5e. The Li3Cd1Zr1(PO4)3 cell acquires the best ionic conductivity values of 0.165 S cm−1 at 550 °C, which is two times higher than that of the pristine CdZr4(PO4)6 device. Other Li1+xCdx/2Zr2−x/2(PO4)3 (x = 0.5, 1, 1.5) devices with lithium doping also show high ionic conductivity with values of 0.158 S cm−1, 0.136 S cm−1 and 0.122 S cm−1 respectively. The ionic conductivity values acquired by the EIS results and I–V curves are reliable due to the small numerical difference. With an increase in Li content, the changed structure creates a broader interstitial space for ion transport, which contributes to the improvement of ion conductivity.
Moreover, the activation energies for ionic conduction of the Li3Cd1Zr1(PO4)3 cell at different temperatures are calculated from the slops of the Arrhenius plots. As shown in Fig. 5f, the Li3Cd1Zr1(PO4)3 cell obtains a low activation energy of 0.372 eV from the EIS results and 0.396 eV from I–V curves. The low activation energy of the Li3Cd1Zr1(PO4)3 cell is close to that of traditional proton electrolytes in such a temperature range. Lower activation energy provides higher fuel cell electrochemical performance at medium temperatures. Therefore, it can be speculated that the high performance of the Li3Cd1Zr1(PO4)3 material at 460–550 °C may be ascribed to contribution of proton conduction, which is in good agreement with those obtained by the DFT simulation results.
The ionic conductivities of as-prepared Li3Cd1Zr1(PO4)3 electrolyte and other conventional oxygen ion conductors Zr0.92Y0.08O1.96(YSZ),45 Ce0.9Gd0.1O1.95(GDC),46 and (Bi0.95Zr0.05)0.85Y0.15O1.5+δ (BiZrY),47 proton conductors BaZr0.1Ce0.7Y0.1Yb0.1O3−δ (BZCYYb)48 and hydride conductors (BaH2)49 are presented in Fig. 6. The ionic conductivity of Li3Cd1Zr1(PO4)3 electrolyte is significantly higher than that of oxygen ion conductors in the medium temperature range (460–550 °C). In comparison to proton conductors BZCYYb and hydride conductors BaH2 subjected to the same temperature conditions, Li3Cd1Zr1(PO4)3 electrolyte also exhibits similar superior conductivity.
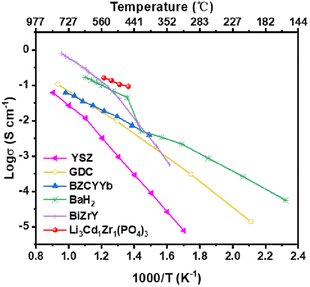 | ||
| Fig. 6 Ionic conductivities of the Li3Cd1Zr1(PO4)3 material and other well-known ionic conductors (oxygen ion conductors: Zr0.92Y0.08O1.96(YSZ),45 Ce0.9Gd0.1O1.95(GDC),46 and (Bi0.95Zr0.05)0.85Y0.15O1.5+δ (BiZrY).47 Proton conductors: BaZr0.1Ce0.7Y0.1Yb0.1O3−δ (BZCYYb)48 and hydride conductors (BaH2)49) in the previous report. | ||
3.6. Carrier transport experiment analysis
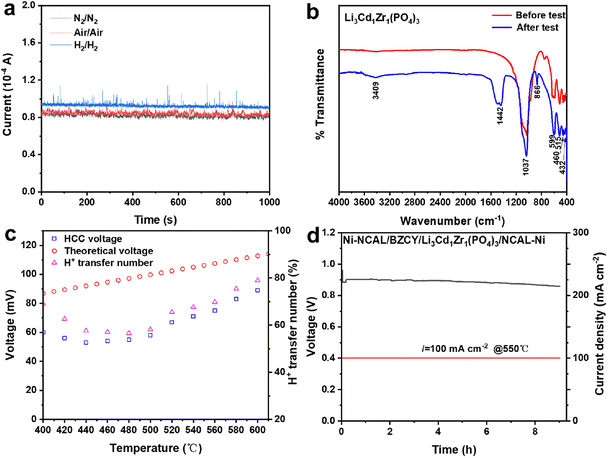
The DFT calculation results demonstrated that the proton is the main carrier in Li3Cd1Zr1(PO4)3 from a simulation aspect, and the proton conduction mechanism was further investigated by the following experiments.In order to characterize the type of ions (Li+/H+/O2−) responsible for the fuel cell performance, I–t curves of the Ag/Li3Cd1Zr1(PO4)3/Ag device in N2/N2, H2/H2 and air/air atmospheres at 550 °C were recorded with a potential of 1 V. As depicted in Fig. 7a, the current in the H2 atmosphere yields a higher value, while the current in the air/air atmosphere is slightly higher than that in the N2 atmosphere. The H+ conductivity of the Ag/Li3Cd1Zr1(PO4)3/Ag device exposed to the H2 atmosphere is calculated to be 2.94 × 10⁻⁵ s cm−2 because hydrogen gas served as the proton source. Under N2 and air atmospheres, Li+ and O2− as the transport carriers in Li3Cd1Zr1(PO4)3 demonstrate a conductivity of 2.62 × 10⁻⁵ and 2.66 × 10⁻⁵ s cm−2, respectively. The transport capacities of oxygen and lithium ions are similar and lower than that of protons, which indicates that protons are the dominant transport carriers responsible for Li3Cd1Zr1(PO4)3 cell performance. More detailed experimental comparisons of the contributions of the three ions are presented below.
Fourier transform infrared (FTIR) spectroscopy was performed to compare the functional groups of Li3Cd1Zr1(PO4)3 before and after the performance test. As depicted in Fig. 7b, the new band observed at 3409 cm−1 after the test is attributed to the O–H bond in the hydroxyl group.50 This indicates that protons insert and may transfer as O–H carriers in the Li3Cd1Zr1(PO4)3 electrolyte under the cell environment. Other bands at 540–630 cm−1 and 410–470 cm−1 are assigned to the variable angles of PO4 and the band located at 1037 cm−1 corresponds to the asymmetric stretching vibration of PO43–.51 Bands located at 1442 cm−1 and 866 cm−1 are ascribed to CO32− modes from the CO2 molecules on the sample surfaces.52 The FTIR results indicate that proton transfer exists in Li3Cd1Zr1(PO4)3 under cell conditions.
Hydrogen concentration cell (HCC) and oxygen concentration cell (OCC) tests were further carried out to demonstrate the proportion of proton and oxygen conduction in the Li3Cd1Zr1(PO4)3 material. The migration number is calculated as the ratio of observed voltage and theoretical voltage (calculated according to the Nernst equation). Both sides of the electrolyte pellet were painted with Ag paste, and air and 5%O2 + 95%Ar were supplied to Ag electrodes in the OCC test. The OCC voltage was hardly detected and the oxygen migration number was about zero, indicative of negligible oxygen conduction in Li3Cd1Zr1(PO4)3. The Ag/Li3Cd1Zr1(PO4)3/Ag cell was then measured in a pure H2 and 5%H2 + 95%Ar atmosphere for the HCC test. As shown in Fig. 7c, the H+ transfer number is between 55% and 80% at 400–610 °C, indicating that proton conduction accounts for a high proportion in Li3Cd1Zr1(PO4)3. As silver is not an ideal electrode for cells, the real transfer number value is higher. However, it is possible for Li+ ion conduction to make contributions under hydrogen concentration cell conditions, which requires further discussion.
After excluding the contribution of oxygen ions, the lithium-ion conductivity of Li3Cd1Zr1(PO4)3 was analyzed using the EIS results of the Ag/Li3Cd1Zr1(PO4)3/Ag cell in air. As shown in Fig. S4a,† the lithium ion conductivity of the Li3Cd1Zr1(PO4)3 pellet is 3.2 × 10⁻⁴ S cm−1 at 550 °C, which is much lower than that of the Li3Cd1Zr1(PO4)3 cell in a fuel cell atmosphere (0.165 S cm−1). The EIS results indicate that the lithium ion conductivity of Li3Cd1Zr1(PO4)3 can be excluded in a fuel cell environment. Furthermore, the durability test was performed with a constant current density of 100 mA cm−2 at 550 °C. As depicted in Fig. S4b,† the voltage of the Li3Cd1Zr1(PO4)3 cell decays suddenly after about 0.9 hours likely due to its partial reduction on the hydrogen side. BaZrO3-based materials have good compatibility between electrolyte and the anode in fuel cell environments and hence proton conductor BaZr0.1Ce0.7Y0.2O3−δ (BZCY) was used as the protection layer here.21,53 As depicted in Fig. 7d, the durability performance of the Li3Cd1Zr1(PO4)3 cell with the BZCY protection layer is significantly improved to 9 hours. Both electrodes and electrolytes containing lithium ions may serve as sources to contribute to Li-ion conductivity, and the idealized case of migration of all lithium ions was considered here. Based on the maximum amount of charge carried by all lithium ions and the constant current density 100 mA cm−2, the maximum durability time that lithium ions can contribute in the Li3Cd1Zr1(PO4)3 cell is calculated to be about 1.8 h. Because most Li+ ions are fixed in the structure and mobile ions are in the minority, the lithium ions in NCAL electrodes and Li3Cd1Zr1(PO4)3 electrolytes cannot be completely exhausted and no lithium-ion source will be supplemented after the migration of all mobile Li ions, so its actual contribution to performance is smaller. Therefore, the contribution of lithium ions in performance of the Li3Cd1Zr1(PO4)3 cell device can be neglected here. The durability test was carried out in the laboratory stage and the novel Li3Cd1Zr1(PO4)3 electrolyte material needs mature assembly and testing processes to complete the long-term durability test.
The above experiment results demonstrate that the existence of Li+/O2− can be neglected and proton conduction is dominant in Li3Cd1Zr1(PO4)3 under fuel cell conditions, corresponding to the simulation results.
4. Conclusions
Overall, the NASICON-structure proton conductor Li1+xCdx/2Zr2−x/2(PO4)3 (x = 0.5, 1, 1.5, 2) material derived from CdZr4(PO4)6 is synthesized and related to electrochemical devices. An increase in the introduction of lithium in CdZr4(PO4)6 leads to a structural change from a trigonal to an orthorhombic system, which creates more 3D interstitial space for ions moving freely which is beneficial for ion conductivity. Focusing on the understanding of the proton conduction mechanism, the migration method of Li+/H+ in interstitial space of the Li3Cd1Zr1(PO4)3 structure has been investigated via DFT simulation. The proton has the smaller migration barrier and is shown as the main transport carrier in the Li3Cd1Zr1(PO4)3 material under fuel cell conditions, which is also confirmed by the experiments that exclude the contributions of lithium ions and oxygen ions. Among five electrolyte samples, the Li3Cd1Zr1(PO4)3 single cell device exhibits excellent electrochemical performance with a peak power density of 815 mW cm−2, an ionic conductivity of 0.165 S cm−1 and an activation energy of 0.372 eV at 550 °C. Notably, the ionic conductivity of Li3Cd1Zr1(PO4)3 outperforms that of other conventional oxygen ion/proton/hydride conductors, showing great application potential in fuel cell electrolyte. The novel proton transport mechanism provides important insights into rational design of proton conductors for intermediate temperature fuel cells and other electrochemical systems.Author contributions
Conceptualization: Xiuxiu Li and Faze Wang. Formal analysis and methodology: Xiuxiu Li, Enyi Hu and Faze Wang. Project administration, funding acquisition and supervision: Jun Wang and Faze Wang. Resources and investigation: Bin Zhu. Writing—original draft: Xiuxiu Li and Enyi Hu. Software and writing—review and editing: Faze Wang and Peter Lund.Conflicts of interest
There are no conflicts to declare.Acknowledgements
This work was supported by the National Natural Science Foundation of China (NSFC) (Grant No. 22109022) and Postgraduate Research & Practice Innovation Program of Jiangsu Province (SJCX23_0061).References
- S. Zarabi Golkhatmi, M. I. Asghar and P. D. Lund, Renewable Sustainable Energy Rev., 2022, 161, 112339 CrossRef CAS.
- F. Ramadhani, M. A. Hussain, H. Mokhlis and S. Hajimolana, Renewable Sustainable Energy Rev., 2017, 76, 460–484 CrossRef.
- M. Singh, D. Zappa and E. Comini, Int. J. Hydrogen Energy, 2021, 46, 27643–27674 CrossRef CAS.
- S. P. Jiang, Electrochem. Energy Rev., 2022, 5, 21 CrossRef CAS.
- Z. Li, M. Li and Z. Zhu, Electrochem. Energy Rev., 2022, 5, 263–311 CrossRef CAS.
- N. Wang, C. Tang, L. Du, R. Zhu, L. Xing, Z. Song, B. Yuan, L. Zhao, Y. Aoki and S. Ye, Adv. Energy Mater., 2022, 12, 1–29 Search PubMed.
- M. Liang, Y. Zhu, Y. Song, D. Guan, Z. Luo, G. Yang, S. P. Jiang, W. Zhou, R. Ran and Z. Shao, Adv. Mater., 2022, 34, 1–9 Search PubMed.
- I. Zvonareva, X. Z. Fu, D. Medvedev and Z. Shao, Energy Environ. Sci., 2022, 15, 439–465 RSC.
- M. T. Ahsan, Z. Ali, M. Usman and Y. Hou, Carbon Energy, 2022, 4, 776–819 CrossRef CAS.
- Q. Zhou, L. Wang, W. Li, K. Zhao, M. Liu, Q. Wu, Y. Yang, G. He, I. P. Parkin, P. R. Shearing, D. J. L. Brett, J. Zhang and X. Sun, Sodium Superionic Conductors (NASICONs) as Cathode Materials for Sodium-Ion Batteries, Springer Singapore, 2021, vol. 4 Search PubMed.
- M. Hou, F. Liang, K. Chen, Y. Dai and D. Xue, Nanotechnology, 2020, 31, 132003 CrossRef CAS PubMed.
- V. Soundharrajan, S. Nithiananth, K. Sakthiabirami, J. H. Kim, C. Y. Su and J. K. Chang, J. Mater. Chem. A, 2022, 10, 1022–1046 RSC.
- I. Hanghofer, B. Gadermaier, A. Wilkening, D. Rettenwander and H. M. R. Wilkening, Dalton Trans., 2019, 48, 9376–9387 RSC.
- Y. Xiao, K. J. Jun, Y. Wang, L. J. Miara, Q. Tu and G. Ceder, Adv. Energy Mater., 2021, 11, 2101437 CrossRef CAS.
- R. Lan and S. Tao, Adv. Energy Mater., 2014, 4, 1301683 CrossRef.
- L. Fan and P. C. Su, J. Power Sources, 2016, 306, 369–377 CrossRef CAS.
- P. G. Komorowski, S. A. Argyropoulos, R. G. V. Hancock, J. Gulens, P. Taylor, J. D. Canaday, A. K. Kuriakose, T. A. Wheat and A. Ahmad, Solid State Ionics, 1991, 48, 295–301 CrossRef CAS.
- L. Truong and V. Thangadurai, Chem. Mater., 2011, 23, 3970–3977 CrossRef CAS.
- L. Truong and V. Thangadurai, Inorg. Chem., 2012, 51, 1222–1224 CrossRef CAS PubMed.
- F. Chen, D. Liao, X. Pan, G. Lin and K. Peng, Ceram. Int., 2022, 48, 11304–11312 CrossRef CAS.
- T. Wei, L. A. Zhang, Y. Chen, P. Yang and M. Liu, Chem. Mater., 2017, 29, 1490–1495 CrossRef CAS.
- L. Sebastian, R. S. Jayashree and J. Gopalakrishnan, J. Mater. Chem., 2003, 13, 1400–1405 RSC.
- T. Matsui, T. Ozeki, K. Miyazaki, S. Nagasaka, H. Muroyama, K. Imagawa, Y. Okada and K. Eguchi, J. Mater. Chem. A, 2023, 11, 18207–18212 RSC.
- I. A. Stenina, I. Y. Pinus, A. I. Rebrov and A. B. Yaroslavtsev, Solid State Ionics, 2004, 175, 445–449 CrossRef CAS.
- I. A. Stenina, M. N. Kislitsyn, N. A. Ghuravlev and A. B. Yaroslavtsev, Mater. Res. Bull., 2008, 43, 377–383 CrossRef CAS.
- Y. Lu, E. Hu, M. Yousaf, L. Ma, J. Wang, F. Wang and P. Lund, Energy Fuels, 2022, 36, 15154–15164 CrossRef CAS.
- J. P. Perdew, K. Burke and M. Ernzerhof, Phys. Rev. Lett., 1996, 77, 3865–3868 CrossRef CAS PubMed.
- D. Joubert, Phys. Rev. B: Condens. Matter Mater. Phys., 1999, 59, 1758–1775 CrossRef.
- G. Kresse and J. Furthmüller, Phys. Rev. B: Condens. Matter Mater. Phys., 1996, 54, 11169–11186 CrossRef CAS.
- S. Grimme, J. Antony, S. Ehrlich and H. Krieg, J. Chem. Phys., 2010, 132, 154104 CrossRef PubMed.
- P. E. Blöchl, Phys. Rev., 1994, 50, 17953–17979 Search PubMed.
- G. Henkelman, B. P. Uberuaga and H. Jónsson, J. Chem. Phys., 2000, 113, 9901–9904 CrossRef CAS.
- B. Lang, B. Ziebarth and C. Elsässer, Chem. Mater., 2015, 27, 5040–5048 CrossRef CAS.
- A. La Monaca, G. Girard, S. Savoie, H. Demers, G. Bertoni, S. Krachkovskiy, S. Marras, E. Mugnaioli, M. Gemmi, D. Benetti, A. Vijh, F. Rosei and A. Paolella, J. Mater. Chem. A, 2021, 9, 13688–13696 RSC.
- K. Mohanraj, J. H. Chang, D. Balasubramanian, J. Chandrasekaran, R. Marnadu, B. Babu, N. Senthil Kumar and S. Chandrasekar, J. Alloys Compd., 2021, 888, 161568 CrossRef CAS.
- M. Wang, K. Wang, X. Huang, T. Zhou, H. Xie and Y. Ren, Ceram. Int., 2020, 46, 28490–28498 CrossRef CAS.
- L. Zhang, Y. Liu, Y. Wang, X. Li and Y. Wang, Appl. Surf. Sci., 2021, 557, 149838 CrossRef CAS.
- H. Li, W. Jiang, W. Ma, H. Qu and Q. Zhong, Chem. Eng. Commun., 2016, 203, 339–344 CrossRef CAS.
- Q. Liu, D. Zhou, D. Shanmukaraj, P. Li, F. Kang, B. Li, M. Armand and G. Wang, ACS Energy Lett., 2020, 5, 1456–1464 CrossRef CAS.
- J. He, Y. Xu, P. Shao, L. Yang, Y. Sun, Y. Yang, F. Cui and W. Wang, Chem. Eng. J., 2020, 394, 124912 CrossRef CAS.
- Y. Bai, Y. Yin, J. Yang, C. Qing and W. Zhang, J. Raman Spectrosc., 2011, 42, 831–838 CrossRef CAS.
- T. Choudhury, E. Kumi-Barimah, P. Parameswaran Nampi, G. M. Kale and G. Jose, Mater. Sci. Eng., B, 2022, 277, 115582 CrossRef CAS.
- G. B. Nair and S. J. Dhoble, RSC Adv., 2015, 5, 49235–49247 RSC.
- A. Djemal, B. Louati and K. Guidara, J. Mater. Sci.: Mater. Electron., 2017, 28, 13806–13813 CrossRef CAS.
- E. Conductivity and R. Region, J. Am. Ceram. Soc., 1952, 69, 2–5 Search PubMed.
- B. C. H. Steele, Solid State Ionics, 2000, 129, 95–110 CrossRef CAS.
- A. A. Yaremchenko, V. V. Kharton, E. N. Naumovich, A. A. Tonoyan and V. V. Samokhval, J. Solid State Electrochem., 1998, 2, 308–314 CrossRef CAS.
- L. Yang, S. Wang, K. Blinn, M. Liu, Z. Liu, Z. Cheng and M. Liu, Science, 2009, 326, 126–129 CrossRef CAS PubMed.
- M. C. Verbraeken, C. Cheung, E. Suard and J. T. S. Irvine, Nat. Mater., 2015, 14, 95–100 CrossRef CAS PubMed.
- X. Sun and Y. Li, Chem.–Eur. J., 2003, 9, 2229–2238 CrossRef CAS PubMed.
- N. K. Anuar, S. B. R. S. Adnan and N. S. Mohamed, Ceram. Int., 2014, 40, 13719–13727 CrossRef CAS.
- E. Portillo, T. R. Reina, M. Cano, F. Vega and B. Navarrete, Solid State Ionics, 2019, 341, 115039 CrossRef CAS.
- H. Wang, E. Hu, B. Zhu, Y. Wu and Q. Fan, J. Power Sources, 2023, 580, 233464 CrossRef CAS.
Footnote |
| † Electronic supplementary information (ESI) available. See DOI: https://doi.org/10.1039/d3ta05182j |
| This journal is © The Royal Society of Chemistry 2024 |

