 Open Access Article
Continuous drop-in-biofuel production from pretreated sugarcane bagasse in a microwave-visible irradiated continuous stirred slurry reactor: reaction kinetics & techno-enviro-economic sustainability analyses†
Sourav
Barman
and
Rajat
Chakraborty
 *
*
Chemical Engineering Department, Jadavpur University, Kolkata-700032, India. E-mail: rajat_chakraborty25@yahoo.com; rajat.chakraborty@jadavpuruniversity.in; Tel: +91 3324572689
First published on 16th July 2024
Abstract
This work utilizes an innovative microwave-visible irradiated continuous stirred slurry reactor (MWVIS-CSSR) for sustainable continuous production of a drop-in biofuel, namely, ethyl levulinate (EL), from pretreated sugarcane bagasse (PSCB). Besides, a novel realistic kinetic model, considering MWVIS intensified EL production through parallel non-catalytic and homogeneous–heterogeneous catalytic pathways in the presence of a magnetic Ni0.5Zn0.5Fe2O4 (NZF) photocatalyst in conjunction with an oxalic acid–choline chloride based acidic deep eutectic solvent (DES2), was also formulated and validated (R2 adj. ≥ 0.95). The 5 liter volume MWVIS-CSSR could render maximum 54.7 mol% EL yield (selectivity: 97.85%) at a feed flow rate of 35 ml min−1 under optimized conditions (temperature: 100 °C, NZF loading: 6 wt% PSCB, stirring speed: 500 rpm). Remarkably, the synergistic impact of MW and VIS irradiation substantially elevated the EL yield (54.7 mol%) compared to those of the individual MW (29.45 mol%) and VIS (20.1 mol%) systems. The optimally produced EL when blended at 5 vol% with B10 and B20 (10% and 20% biodiesel–diesel blends) could enhance the brake thermal efficiency (1–2%) besides mitigating 21–22% HC and 7.5–20% CO engine exhaust emissions in comparison with reference blends (B10 and B20). Notably, the reactor scale-up study based on the penetration depth of the MW and VIS energy of NZF and DES2 showcased the potential to upscale the 5 liter MWVIS-CSSR to a 1 m3 volume, allowing EL production to reach 689 kg h−1 with a sugarcane bagasse processing capacity of 2000 kg h−1. Moreover, the process simulation conducted in Aspen Plus software, utilizing COSMO-based property estimation with DFT calculations, alongside the techno-economic analysis, revealed a robust internal rate of return (IRR) of 54.25% and a net present value (NPV) of 8.22 × 10⁵ US$ with a payback period of 4.91 years. Additionally, the environmental impact analysis study for the scaled-up EL production process in the MWVIS-CSSR revealed a reduction of 40–60% in marine ecotoxicity and 39–61% in human toxicity compared to the separate MW-CSSR and VIS-CSSR systems.
Sustainability spotlightEthyl levulinate (EL) is a potential oxygenated drop-in biofuel and a versatile platform chemical. Hence, with sustainable production of EL from lignocellulosic biomass, EL is set to have a promising future as a central platform chemical within the developing biorefinery sector. This work offers an energy-efficient, sustainable method for continuous EL production using a microwave-visible irradiated slurry reactor with a magnetic Ni0.5Zn0.5Fe2O4 photocatalyst and an oxalic acid–choline chloride deep-eutectic-solvent. The developed realistic EL production kinetic model in this work could aid in efficient reactor design for industrial scale-up. Additionally, the study assessed the economic feasibility, environmental impacts of the continuous EL production process, and engine performance of EL blended fuels, highlighting EL's potential in reducing emissions. This work aligns with UN SDG 7 (affordable and clean energy), SDG 9 (industry, innovation, and infrastructure), and SDG 13 (climate action). |
1 Introduction
In a rapidly developing country like India, rising air pollution from transportation is a major concern. In this respect, the Central Pollution Control Board under the Ministry of Environment, Forest and Climate Change, Government of India (GOI) introduced Bharat stage VI emission standards (BS-VI) norms in 2020 to regulate the vehicle exhaust emissions.1 In order to meet such stringent emission regulations, biodiesel has been blended with commercial diesel to upgrade exhaust emission quality.2 However, biodiesel also has some shortfalls, viz. high viscosity and cloud point and low volatility, which have plagued the use of biodiesel in cold climates.3 Ethyl levulinate (EL), a potential oxygenated drop-in biofuel (oxygen content: 33%) for biodiesel, has recently gained popularity as a cold flow enhancer.4 Unlu et al.5 reported that 20 vol% blending of EL with canola oil biodiesel could significantly enhance the kinematic viscosity (3.5 mm2 s−1) and cloud point (−6 °C) properties of the blended fuel. Besides serving as a cold flow enhancer, EL serves as a versatile platform chemical for the production of high-value compounds, including 2-methyltetrahydrofuran, γ-valerolactone, valeric esters and more.6–8 Hence, with sustainable production of EL from lignocellulosic biomass, EL is set to have a promising future as a central platform chemical within the developing biorefinery sector.In the literature, various studies investigated the EL synthesis process from lignocellulosic biomass as well as cellulose-derived platform chemicals such as glucose, HMF, furfural and levulinic acid, employing both homogeneous and heterogeneous catalysts.9 Among homogeneous catalysts, acidic ionic liquids and DESs have been recently employed as promising homogeneous catalysts for EL synthesis from biomass, owing to their high thermal stability and non-toxicity compared to strong mineral acids. For instance, Guan et al. employed a sulfonated ionic liquid (IL) and managed to attain a 16 wt% yield of EL from wheat straw within 60 minutes at a temperature of 200 °C.10 On the other hand, Sert et al.11 achieved 86.83 mol% EL yield from levulinic acid by utilizing a choline chloride–p-toluene sulfonic acid-based DES at 90 °C for the same time duration. Other work done by Hu et al. achieved 88.82 mol% EL yield from furfuryl alcohol by utilizing ChCl-5-sulfosalicylic acid (5-SSA) based acidic DESs at 100 °C and 2 h.12 It's worth noting that there has been substantial research into the direct conversion of EL from lignocellulosic biomass using ionic liquids. However, there currently exists a research gap in the direct transformation of EL from lignocellulosic biomass or cellulose using DESs, despite the advantages of DESs over ILs, including their cost-effectiveness, straightforward preparation, and reduced toxicity.
In recent decades, researchers have demonstrated that substituting conventional heating with microwave heating significantly amplifies reaction rates. For instance, Nguyen et al. reported that MW heating outperforms conventional heating methods and demonstrated that, through MW irradiation, it is possible to achieve 90.38% EL from levulinic acid (LA) within 60 minutes at a temperature of 200 °C under non-catalytic conditions.13 Liu et al.14 demonstrated that mechanically pretreated corn stover produced 31.23% EL at 160 °C under MW irradiation (power: 600 watt). Other electromagnetic radiations mainly UV and visible (VIS) light were also employed to synthesise EL through photocatalytic esterification of LA. Raut et al. produced 94 mol% EL from levulinic acid employing a carboxylic acid functionalized IL entangled porphyrin photo-catalyst under 5 watt LED light at room temperature for 20 h.15 Another study done by Castañeda et al. reported that a fluorine (1%) modified TiO2 photocatalyst successfully converted 100% of LA to EL in the presence of CCl4 solvent in 1 h at 60 °C under UV irradiation.16 It is noteworthy that, so far, no research has been reported on the synthesis of EL from lignocellulosic biomass using a photocatalyst, primarily due to challenges associated with the separation of the nano-photocatalyst from the reaction mixture. Magnetic Ni–Zn–ferrites (NZF) have drawn significant research attention for their distinctive electric and magnetic properties, high stability, and lower energy bandgap, rendering them suitable as magnetically separable visible range photocatalysts for various photochemical reactions.17,18 Work done by Nimisha et al.19 showed that 88% fluorescein dye degradation could be achieved employing NZF under solar irradiation in 1 h.
Very recently, our research group demonstrated the synergistic enhancement of reaction rates by combining different electromagnetic radiations, resulting in energy savings compared to conventional heating methods.20,21 In a study conducted by our group,21 it was found that employing microwave-xenon irradiation yielded a 60.3 mol% EL yield from delignified sugarcane bagasse in the presence of a ternary DES composed of FeCl3, citric acid, and choline chloride. Notably, there has been no reported research on EL synthesis using NZF photocatalysts and DESs through the effective utilization of microwave-visible irradiation.
Regarding choosing lignocellulosic biomass for EL production, sugarcane bagasse has emerged as a prime candidate owing to its widespread availability as an agro-industrial residue, particularly in countries like India, where it accounts for approximately 23% of global sugarcane production.22 Moreover, its relatively high cellulose and hemicellulose content makes sugarcane bagasse a favourable feedstock for the EL production process.
Some works have been reported on continuous flow reactor systems, viz. fixed bed reactors, pervaporation membrane reactors, and reactive distillation for synthesis of EL from LA.23 For instance, Unlu et al.24 reported that 100% LA conversion had been realised in 5 h at 70 °C within a pervaporation membrane reactor using a silicotungstic acid functionalized membrane. Kong et al.25 used a catalytic fixed-bed reactor filled with cerium-phosphotungstic acid grafted silica gel pellets for EL synthesis and reported that 99.0% EL yield was accomplished in 50 h. Notably, a fixed bed reactor encounters certain key challenges, viz. non-uniform heat transfer and high pressure drop across the reactor bed, whereas a membrane reactor has high initial costs.26 Nevertheless, raw lignocellulosic biomass presents a notable challenge due to its inherent difficulty in solubilization with solvents. In previous studies, researchers addressed this issue by employing a two-step process where intermediate levulinic acid was used to generate ethyl levulinate in a continuous reactor. In the context of continuous EL synthesis from lignocellulosic biomass, a continuous stirred slurry reactor (CSSR) could stand out in its ability to maintain consistent mixing and temperature control when dealing with slurry feeds, outperforming other reactor types. Notably, Bermúdez et al.27 emphasized the necessity of taking into account a significant amount of reaction mass for a precise assessment of the true energy efficiency of the MW irradiation system. Therefore, in this study, to attain a thorough comprehension of both the actual energy performance of the MW-VIS irradiation system and the sustainability of the process, the EL synthesis process was conducted in a sizable continuous flow stirred slurry reactor, following prior batch system experimentation.
Kinetic studies conducted on lignocellulosic biomass to EL synthesis processes have so far extensively employed simplified pseudo-homogeneous kinetic models to describe such multiphase reactions.28,29 For instance, Tao et al.30 employed a simplified pseudo-homogeneous first order kinetic model to understand the EL synthesis process from cellulose in the presence of a solid Al2/3H2SiW12O40 catalyst. However, development of a realistic reaction kinetic model for such complex multiphase reactions is crucial to understanding the reaction mechanisms and scaling up industrial processes. As far as we know, no scientific literature is available on the development of a kinetic model by considering the PSCB to EL conversion through a parallel homogeneous–heterogeneous reaction pathway in the presence of an NZF photocatalyst and acidic DES.
In recent years, a number of studies have examined the engine performance of EL as a fuel additive in a biodiesel–diesel blend. For instance, Wang et al. investigated the four-stroke diesel engine performance of an EL–diesel blend, and reported that smoke emission decreased with increasing EL content.31 Notably, Lei et al.32 optimized the ethyl levulinate–biodiesel–diesel blends based on the blended fuel's physical and chemical properties. This research also entailed an analysis of the performance and exhaust emissions resulting from the utilization of these optimized blended fuels in a diesel engine. However, it is noteworthy that there is a gap in the existing literature as no prior work has been reported regarding the optimization of EL blending ratios with biodiesel–diesel fuel blends, with a particular focus on the exhaust emissions and the associated environmental impacts of these blended fuels.
Computational resources nowadays play a crucial role in the successful design and assessment of overall process sustainability in biorefineries. This involves a comprehensive analysis of process economics and associated environmental impacts. Aspen Plus software is extensively employed to seamlessly scale up laboratory-scale processes to industrial operations, facilitating detailed economic evaluations for informed and cost-effective decision-making.33 Concurrently, in recent years, environmental impact analysis has become an essential technique for assessing climate change risks, examining a process's environmental effects, and scrutinizing energy consumption. Cañon et al. investigated the overall process sustainability of EL production from Colombian rice straw, utilizing both Aspen Plus and OpenLCA software.34 In the present work, we have also made an effort to investigate the overall sustainability of the continuous EL synthesis process through economic and environmental impact analysis employing both Aspen Plus and OpenLCA software.
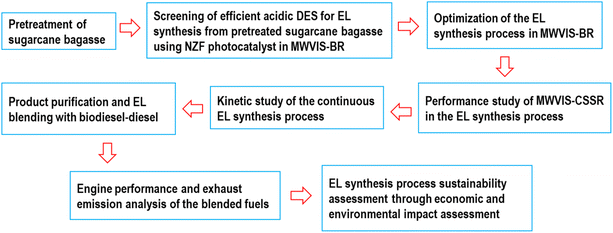
So, the primary objective of the current work was to produce EL synthesis from sugarcane bagasse (SCB) through a sustainable and energy efficient protocol. To achieve this, various acidic DESs were initially prepared, and their efficacy in EL synthesis was investigated (Fig. 1) in the presence of the NZF photocatalyst under the photo-thermal effect of MW and VIS irradiation systems within a batch reactor (MWVIS-BR). Subsequently, the batch EL production process parameters were optimized. Following this, the EL synthesis process was explored within a continuous stirred slurry reactor system (MWVIS-CSSR), and continuous EL synthesis kinetic analysis was performed. The produced EL was blended with biodiesel–diesel, and its impact on fuel properties, engine performance, and exhaust emissions was analysed, alongside determining the optimal EL blending ratio through environmental impact assessment. Finally, the entire SCB to EL conversion process was upscaled to handle a processing capacity of 2000 kg h−1 of SCB and simulated using Aspen Plus, followed by a comprehensive sustainability assessment involving economic and environmental impact analyses.
2 Materials and methods
2.1. Materials
Ethanol (99.9%), choline chloride (ChCl, 98%), p-toluene sulfonic acid (CH3C6H4SO3H·H2O), oxalic acid (C2H2O4·2H2O), malonic acid (CH2(COOH)2), citric acid (C6H8O7·H2O), phenylpropionic acid (C9H10O2), ethyl levulinate (EL), levulinic acid, 5-ethoxy methyl furfural (5EMF), ethyl β-D-glucopyranoside, ethyl β-D-xylopyranoside, peroxyacetic acid, and NaOH were purchased from Merck. Ni–Zn–ferrite (NZF) nanoparticles (Ni0.5Zn0.5Fe2O4; size <30 nm) were procured from Nanoshel Limited whereas sugarcane bagasse (SCB) was collected from Shree Renuka Sugars Limited, Haldia, India.2.2. Methods
![[thin space (1/6-em)]](https://www.rsc.org/images/entities/char_2009.gif) :
:![[thin space (1/6-em)]](https://www.rsc.org/images/entities/char_2009.gif) 1 molar ratio, as specified in Table 1 and subsequently employed in the EL synthesis process.
1 molar ratio, as specified in Table 1 and subsequently employed in the EL synthesis process.
| Abbreviation | DES | Freezing temperature (°C) | pH (at 25 °C) |
|---|---|---|---|
| DES1 | Choline chloride![[thin space (1/6-em)]](https://www.rsc.org/images/entities/char_2009.gif) : :![[thin space (1/6-em)]](https://www.rsc.org/images/entities/char_2009.gif) p-toluene sulfonic acid p-toluene sulfonic acid |
12 | −1.45 |
| DES2 | Choline chloride![[thin space (1/6-em)]](https://www.rsc.org/images/entities/char_2009.gif) : :![[thin space (1/6-em)]](https://www.rsc.org/images/entities/char_2009.gif) oxalic acid oxalic acid |
34 | −0.97 |
| DES3 | Choline chloride![[thin space (1/6-em)]](https://www.rsc.org/images/entities/char_2009.gif) : :![[thin space (1/6-em)]](https://www.rsc.org/images/entities/char_2009.gif) malonic acid malonic acid |
10 | −0.16 |
| DES4 | Choline chloride![[thin space (1/6-em)]](https://www.rsc.org/images/entities/char_2009.gif) : :![[thin space (1/6-em)]](https://www.rsc.org/images/entities/char_2009.gif) citric acid citric acid |
69 | 0.15 |
| DES5 | Choline chloride![[thin space (1/6-em)]](https://www.rsc.org/images/entities/char_2009.gif) : :![[thin space (1/6-em)]](https://www.rsc.org/images/entities/char_2009.gif) phenylpropionic acid phenylpropionic acid |
20 | 1.12 |
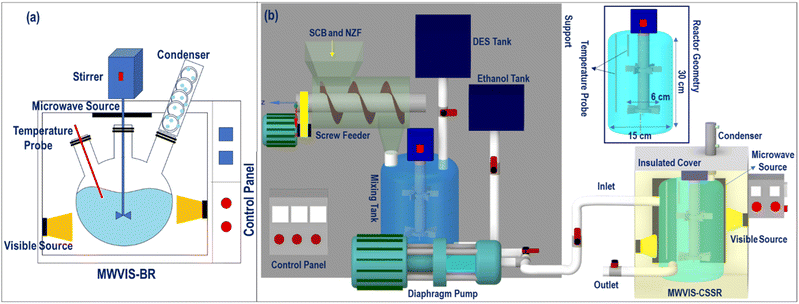
The batch EL synthesis process (Fig. 2(a)) was performed in an MW (frequency: 915 MHz; specific power input: 4 watt per ml of reaction volume)-VIS (wavelength: 400–700 nm; specific power input: 4 watt per ml of reaction volume) irradiated stirred batch reactor (MWVIS-BR) at fixed reaction conditions (temperature: 100 °C, time: 45 min; stirring speed: 500 rpm) in the presence of the NZF photocatalyst. In this arrangement, 1 g of PSCB was reacted with 10 ml of ethanol in the presence of a fixed amount of the prepared DES and NZF nano-photocatalyst (5 ml of DES and 4 wt% NZF, proportional to the PSCB quantity).
 | (1) |
 | (2) |
| Factors | Name | Units | −1 level | 0 level | 1 level |
|---|---|---|---|---|---|
| Ω T | Reaction temperature | °C | 80 | 90 | 100 |
| Ω S | Stirring speed | rpm | 400 | 500 | 600 |
| Ω NZF/PSCB | NZF to PSCB ratio | (wt%) | 2 | 4 | 6 |
| Ω t | Synthesis time | min | 30 | 45 | 60 |
| Ω T (°C) | Ω t (min) | Ω NZF/PSCB (wt%) | Ω S (rpm) | Ω EL (mol%) | SD | SN ratio |
|---|---|---|---|---|---|---|
| 80 | 30 | 2 | 400 | 20.50 | ±0.50 | 26.23 |
| 80 | 45 | 4 | 500 | 29.50 | ±0.15 | 29.39 |
| 80 | 60 | 6 | 600 | 27.50 | ±0.05 | 28.78 |
| 90 | 30 | 4 | 600 | 31.75 | ±0.50 | 30.03 |
| 90 | 45 | 6 | 400 | 44.10 | ±0.30 | 32.88 |
| 90 | 60 | 2 | 500 | 36.40 | ±0.10 | 31.22 |
| 100 | 30 | 6 | 500 | 47.10 | ±0.20 | 33.46 |
| 100 | 45 | 2 | 600 | 39.75 | ±0.30 | 31.98 |
| 100 | 60 | 4 | 400 | 50.20 | ±0.25 | 34.01 |
![[thin space (1/6-em)]](https://www.rsc.org/images/entities/char_2009.gif) :
:![[thin space (1/6-em)]](https://www.rsc.org/images/entities/char_2009.gif) 10, while maintaining the inlet and source temperatures at 250 °C and 280 °C, respectively.
10, while maintaining the inlet and source temperatures at 250 °C and 280 °C, respectively.
The other intermediate products (glucose, oligosaccharides) were analysed using HPLC (Waters high performance carbohydrate column: P/N WAT044355: 4.6 mm × 250 mm column with 4 μm Nova-Pack@ spherical silica bonded with trifunctional amino propyl silane; Waters 410 refractive index (RI) detector). Acetonitrile and water (75![[thin space (1/6-em)]](https://www.rsc.org/images/entities/char_2009.gif) :
:![[thin space (1/6-em)]](https://www.rsc.org/images/entities/char_2009.gif) 25 (V/V)) with a flow rate of 1.4 ml min−1 were used as a mobile phase.
25 (V/V)) with a flow rate of 1.4 ml min−1 were used as a mobile phase.
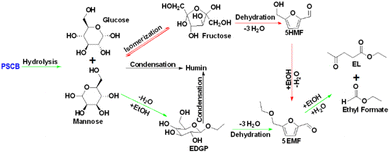 | ||
| Scheme 1 Possible reaction pathway for EL synthesis from PSCB (green colour represents route-1 and red colour represents route-2). | ||
During an experimental kinetic study of the continuous EL synthesis process, EDGP, 5EMF, EL, and EF were identified as the main generated products (Fig. 9). Additionally, glucose and 5HMF were detected in trace amounts in the product mix. Based on the above results, it was assumed that formation of EDGP from glucose or mannose takes place rapidly and the overall reaction pathway primarily follows route-1.35 Moreover, formation of humin was also observed under optimized process conditions. Thus, the continuous PSCB to EL conversion process employing NZF and DES2 was simplified as Fig. 3.
Notably, during experimental investigation, it was observed that under non-catalytic conditions (without NZF and DES), PSCB underwent partial conversion to EDGP in the MWVIS-CSSR. Furthermore, in the presence of both the homogeneous acidic DES and heterogeneous NZF photocatalyst, PSCB was observed to convert to EL through parallel pathways, including both homogeneous and heterogeneous processes. Consequently, the overall rate of PSCB conversion (−rPSCB) was formulated by combining the non-catalytic (−rNC), homogeneous catalytic (−rH1) and heterogeneous catalytic (−rHt1) conversion rate of PSCB. Notably, in formulating the rates for non-catalytic and homogeneous catalytic conversion, a pseudo-homogeneous irreversible first-order kinetic model was assumed, while for heterogeneous catalytic conversion of PSCB, the Eley–Rideal heterogeneous kinetic model was applied. In formulating the Eley–Rideal heterogeneous kinetic model, it was assumed that only ethanol was adsorbed on the NZF photocatalyst's surface, as PSCB's larger size (size range: −240 to +300 mesh; average size: 58 μm) prevented it from entering the pores of NZF (average surface pore size of the NZF: 48 nm, from Brunauer–Emmett–Teller (BET) analysis) and the surface reaction was the rate controlling step.
| −rPSCB = −[rNC + rH1 + ρNZFrHt1] | (3) |
 | (4) |
Accordingly, the formation rates of EDGP (eqn (5)), 5EMF (eqn (6)), EL (eqn (7)) and humin (eqn (8)) were also formulated by considering a homogeneous pseudo first order kinetic model and heterogeneous Eley–Rideal kinetic model. Notably, the product yields were calculated based on the holocellulose present in the PSCB.
 | (5) |
 | (6) |
 | (7) |
| rHumin = kH3CEDGP | (8) |
Finally, the observed rate of conversion or formation of each species was determined employing the CSSR design equation (eqn (9)) and the kinetic parameters of the formulated kinetic model equations (eqn (4)–(8)) at different temperatures were evaluated.
 | (9) |
 | (10) |
![[thin space (1/6-em)]](https://www.rsc.org/images/entities/char_2009.gif) 000 ppm), CO2 (0–20%), and NOx (0–5000 ppm).
000 ppm), CO2 (0–20%), and NOx (0–5000 ppm).
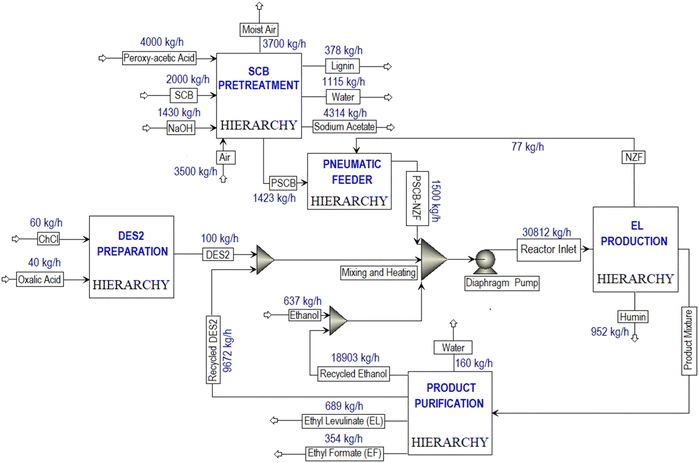
2.2.7.1. Process scale-up and economic analysis. For techno-economic analysis, the SCB to EL conversion process was subdivided into four sections and modelled as four hierarchy blocks, viz. SCB PRETREATMENT, DES PREPARATION, EL PRODUCTION and PRODUCT PURIFICATION, using Aspen Plus software. During simulation of the SCB PRETREATMENT hierarchy block, the SCB, containing 10% moisture, was modelled as cellulose, hemicellulose and lignin content according to Table S1.† Additionally, information of the missing properties such as solid molar volume, solid heat capacity of cellulose, humin (insoluble solid) and lignin was collected from the ASPEN PLUS INHSPCD (NREL Biofuels) databank.36 Notably, the screw feeder setup utilised in the current study was modelled as a pneumatic feeder during Aspen Plus simulation, where air was used to convey the solid PSCB–NZF mixture (Fig. S5†). In the simulation of the EL PRODUCTION hierarchy block, the MWVIS-CSSR was modelled as a custom CSTR with the help of ASPEN CUSTOM MODELER, where the estimated kinetic parameters of the EL synthesis process were used to simulate the PSCB to EL conversion process.
A Non-Random Two-Liquid with Redlich-Kwon (NRTL-RK) model was considered as the primary thermodynamic package for phase equilibrium and thermodynamic calculations. However, in order to successfully simulate the PRODUCT PURIFICATION block in Aspen Plus, we chose to utilize the COSMO-SAC property model for estimating activity coefficients, due to the absence of binary interaction parameters for DES2 with other components in the simulation. The COSMO data (sigma (σ) profile) for individual components (Fig. S2†) were determined through density functional theory (DFT) calculations carried out in the DMOL3 module of the Material Studio software.37
After successfully simulating the EL conversion process, economic analysis of the plant was conducted using the Aspen Plus Economic Analyzer, considering a 20 year plant life and a one-year construction period. Table 4 displays the prices of the individual feed stream, utility stream, waste stream, product, and byproduct stream. The price of NaOH (https://www.echemi.com/), peroxy-acetic acid (https://www.echemi.com/), oxalic acid (https://www.chemanalyst.com/HYPERLINK "http://www.chemanalyst.com" \o "http://www.chemanalyst.com"www.chemanalyst.com), and EF (https://www.indiamart.com/) was obtained from various sources. Notably, the equipment cost of the MWVIS-CSSR was determined by combining the cost of a closed agitated tank with a similar capacity and the additional cost for MW and VIS generator units. The average reported cost of 100 kW microwave generators typically varies between 75![[thin space (1/6-em)]](https://www.rsc.org/images/entities/char_2009.gif) 000 and 100
000 and 100![[thin space (1/6-em)]](https://www.rsc.org/images/entities/char_2009.gif) 000 US$ depending on various design parameters.41 Therefore, in the MWVIS-CSSR equipment cost calculation, a cost of 1000 US$ per kW for a 915 MHz MW generator was considered. Similarly, the equipment cost calculation for the MWVIS-CSSR included a pricing of 1000 US$ per kW for the VIS source.42
000 US$ depending on various design parameters.41 Therefore, in the MWVIS-CSSR equipment cost calculation, a cost of 1000 US$ per kW for a 915 MHz MW generator was considered. Similarly, the equipment cost calculation for the MWVIS-CSSR included a pricing of 1000 US$ per kW for the VIS source.42
| Stream | Stream type | Price (US$ per kg) | References |
|---|---|---|---|
| SCB | Feed stream | 0.024 | 33 |
| Ethanol | Feed stream | 0.903 | 34 |
| NaOH | Feed stream | 0.212![[thin space (1/6-em)]](https://www.rsc.org/images/entities/char_2009.gif) 065 065 |
|
| Peroxy-acetic acid | Feed stream | 0.344![[thin space (1/6-em)]](https://www.rsc.org/images/entities/char_2009.gif) 505 505 |
|
| ChCl | Feed stream | 0.77 | |
| Oxalic acid | Feed stream | 0.56 | |
| Electricity | Utility stream | 0.19 (US$ per kWh) | 34 |
| Cooling water | Utility stream | 0.001![[thin space (1/6-em)]](https://www.rsc.org/images/entities/char_2009.gif) 318 318 |
34 |
| Medium pressure steam | Utility stream | 0.008![[thin space (1/6-em)]](https://www.rsc.org/images/entities/char_2009.gif) 627 627 |
34 |
| EL | Product stream | 3 | 34 |
| EF | Byproduct stream | 2.16 | |
| Lignin | Byproduct stream | 0.5 | 38 |
| Sodium acetate | Byproduct stream | 0.545 | 39 |
| Humin | Waste stream | −0.04 | 40 |
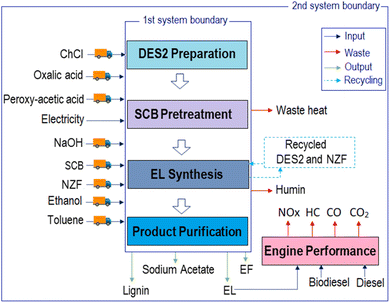
2.2.7.2. Environmental impact assessment. After economic analysis, the environmental impacts associated with the EL synthesis process were analysed using OpenLCA 1.9 software. Additionally, the environmental impacts related to specific irradiation systems were scrutinized to comprehend the influence of energy consumption in both MW and VIS irradiation systems on the overall environmental footprint. To explore these impacts, a gate-to-gate life cycle assessment (LCA) approach was utilized, where the system boundary (Fig. 4; 1st system boundary) encompasses the transport of raw materials, the pretreatment of waste SCB, the preparation of a DES, and the synthesis and purification process of EL. In the context of transportation, it was assumed that the transportation of all raw materials would cover a distance of 100 kilometres using a 16 metric ton truck equipped with a EURO VI engine. Additionally, the waste humin generated in the EL synthesis process was considered to be managed through hazardous waste treatment, specifically underground deposition. It is noteworthy that all electric energy employed in the operation was considered to dissipate into the atmosphere as waste heat.43 Moreover, to identify the optimum EL blending ratio in B10 and B20, environmental impact analysis for each blend was also performed employing the engine exhaust emission data though the gate to grave approach (Fig. 4; 2nd system boundary).
The life cycle inventory (LCI) database was prepared based on the Aspen Plus simulated data of the upscaled EL synthesis process. “ReCiPe Midpoint (H)” life cycle analysis methodology44 with Ecoinvent database 3.5 was used to assess and evaluate the potential environmental impact indicators associated with the EL synthesis process. During LCA analysis, physical allocation was considered for the multioutput processes and LCA results were normalized based on “World ReCiPe H” normalization and a weighting factor.
3 Results and discussion
3.1. Screening of DESs in the MWVIS-BR
In Fig. 5(a), it is evident that the oxalic acid-based DES (DES2) exhibited the highest EL yield from PSCB in the presence of the NZF photo-catalyst, despite its higher pH value compared to DES1. Interestingly, in the absence of the NZF photo-catalyst, DES1, with the lowest pH value, achieved the highest EL yield (31.0 mol%) compared to the other prepared DESs under the same reaction conditions. This discrepancy was attributed to the partial solubility of the NZF catalyst in DES1 at 100 °C, leading to its ineffective performance under VIS irradiation. Notably, the NZF photocatalyst was completely insoluble in DES2 and retained its magnetic properties, allowing easy separation from the reaction mixture and reuse for up to eight cycles without compromising EL yield. Additionally, TGA analysis (Fig. 5(b)) revealed that DES2 was thermally stable at the reaction temperature and it also has low viscosity (Fig. 5(c)) and density (Fig. 5(d)) at the reaction temperature, which facilitates the reaction. Thus, considering the experimental findings and the physical properties of the DESs (characterization details of DESs are given in ESI Section S3†), it could be concluded that DES2 is the most efficient medium for synthesizing EL from PSCB in the presence of the NZF photo-catalyst. As a result, for subsequent investigations, the EL synthesis process was conducted using DES2 as the chosen medium.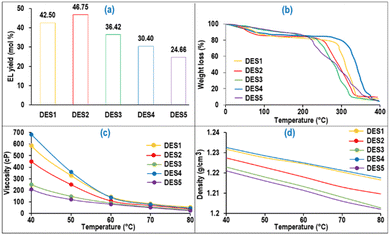 | ||
| Fig. 5 (a) EL yield in the prepared DES (reaction conditions: ΩT: 100 °C; ΩNZF/PSCB: 4 wt%; Ωt: 45 min; ΩS: 500 rpm). (b) TGA analyses of the DES; (c) density and (d) viscosity of the DES. | ||
3.2. Optimization of the EL synthesis process in the MWVIS-BR
Analysis of variance (ANOVA) for the EL synthesis process in the MWVIS-BR indicated that the ΩT and ΩNZF/PSCB were the most statistically significant factors (p-value < 0.05) (Table 5). The normal probability plot of residuals and the model fit summary along with correlation between process factors and ΩEL is shown in Fig. S3.† Notably, Table 6 reveals that the process factors with higher Δ values showed a stronger influence on the response factor (ΩEL). Accordingly, the order in which the relative significance of the process factors on the response (ΩEL) could be arranged is: ΩT > ΩNZF/PSCB > Ωt > ΩS. Moreover, the highest S/N ratio value for each process factor is denoted by an asterisk (Table 6), which showed that the optimized process factors were 100 °C (ΩT), 6 wt% (ΩNZF/PSCB), 45 min (Ωt), and 500 rpm (ΩS), which provided a maximum experimental 54.50 mol% EL yield (selectivity: 97.85%) in the MWVIS-BR in the presence of DES2 medium.| Source | DF | Adj. SS | Adj. MS | F-value | P-value |
|---|---|---|---|---|---|
| Regression | 4 | 749.93 | 187.484 | 28.10 | 0.003 |
| Ω T | 1 | 591.03 | 591.034 | 88.58 | 0.001 |
| Ω t | 1 | 36.26 | 36.260 | 5.43 | 0.080 |
| Ω NZF/PSCB | 1 | 81.03 | 81.034 | 12.14 | 0.025 |
| Ω S | 1 | 41.61 | 41.607 | 6.24 | 0.067 |
| Error | 4 | 26.69 | 6.672 | ||
| Total | 8 | 776.62 |
| Level | Ω T | Ω t | Ω NZF/PSCB | Ω S |
|---|---|---|---|---|
| 1 | 28.14 | 29.91 | 29.81 | 31.05 |
| 2 | 31.38 | 31.42* | 31.15 | 31.36* |
| 3 | 33.15* | 31.34 | 31.71* | 30.27 |
| Delta | 5.01 | 1.51 | 1.90 | 1.09 |
| Rank | 1 | 3 | 2 | 4 |
3.3. Individual parametric effects on the EL synthesis process in the MWVIS-BR
After optimization, the individual impact of process factors on the EL synthesis process under optimized conditions was investigated. The analysis of the effect of reaction temperature on EL yield, as depicted in Fig. 6(a), indicated that beyond a reaction temperature of 100 °C, the EL yield began to decrease, possibly due to the formation of humin from EDGP at higher temperatures. Furthermore, the EL yield monotonically increased with increasing stirring speed up to 500 rpm (Fig. 6(b)) where mass transfer resistance was negligible which was confirmed through external and internal mass transfer calculations employing the Mears criterion and Weisz–Prater criterion respectively.45 However, the EL yield started to decrease due to the vortex formation when the stirring speed was extended beyond the optimal level. The effect of batch reaction time on EL yield is shown in Fig. S4.†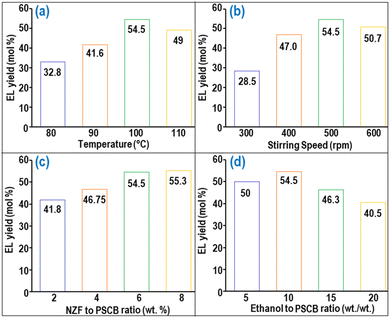 | ||
| Fig. 6 Effect of (a) temperature and (b) stirring speed on EL yield, (c) NZF to PSCB ratio and (d) ethanol to PSCB ratio on EL yield in the MWVIS-BR. | ||
The impact of the NZF to PSCB ratio (ΩNZF/PSCB) on EL yield, depicted in Fig. 6(c), revealed that there was a marginal increase in EL yield beyond the optimal ΩNZF/PSCB value of 6 wt%. A similar trend was also observed when the DES2 to PSCB ratio was increased beyond 5 wt/wt. On the other hand, the optimum ethanol loading per gram of PSCB was found to be 10 ml; beyond that point, the EL yield started to decrease (as depicted in Fig. 6(d)). This decrease in yield can be attributed to the higher ethanol loading, which results in a reduction of acid concentration within the reaction medium and a decrease in the absorption capacity of MW.
3.4. MWVIS-CSSR performance study in the EL synthesis process
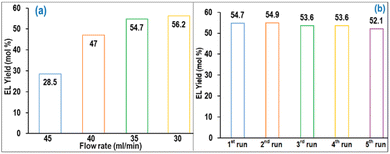
The performance of the 5 L MWVIS-CSSR was examined in the EL synthesis process at various feed flow rates while maintaining the otherwise optimized batch process conditions, viz. 100 °C (ΩT), 6 wt% (ΩNZF/PSCB), and 500 rpm (ΩS). Fig. 7(a) shows that under steady state conditions, a similar EL yield to that in the MWVIS-BR (54.50 mol%) could be achieved in the MWVIS-CSSR at a slurry feed flowrate of 35 ml min−1 (space time: 142 min). Notably, further decreasing the feed flow rate didn't increase the EL yield much (2.7% EL yield increment). The reusability study of the DES2 medium was conducted using a fresh NZF photocatalyst in the MWVIS-CSSR which revealed that the oxalic acid–choline chloride-based DES medium could be easily reused up to 5 times without compromising the EL yield (Fig. 7(b)). Importantly, no decrease in the efficacy of the NZF photocatalyst up to eight cycles, as measured by EL yield, was observed throughout the NZF reusability study.Interestingly, to facilitate comparison, experimental runs for EL production from SCB and cellulose were conducted at a feed flow rate of 35 ml min−1. Notably, EL yield from cellulose was 43 mol%, while EL from SCB reached 58.60 mol%. However, despite the higher EL yield from SCB compared to PSCB, separating EL and recycling the DES2 from the product mixture after the reaction proved to be challenging.
The impact of individual and combined MW and VIS energy systems on EL yield in the large MWVIS-CSSR was also explored and illustrated in Fig. 8(a). This inquiry revealed a synergistic effect in the combined MW and VIS irradiation system, significantly enhancing EL yield (54.7 mol%) compared to individual MW (29.45 mol%) and VIS (20.1 mol%) irradiation systems. The synergistic effect of MW-induced heating, driven by dipolar rotation and the ionic conduction mechanism in the presence of DES2,46 coupled with the absorption of VIS energy by the NZF photocatalyst, modifies the internal energy of the reacting molecules and decreases the activation energy,47 enabling higher EL yield in the presence of the MWVIS system.
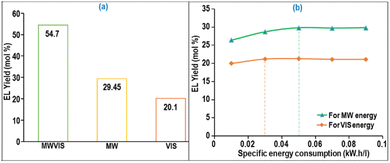 | ||
| Fig. 8 (a) EL production and (b) specific energy consumption by the MW and VIS system in a 5 L MWVIS-CSSR. | ||
Notably, the specific energy consumption for achieving 54.7 mol% EL yield with combined MW (0.05 kW h L−1) and VIS (0.02 kW h L−1) energy (Fig. 8(b)) in the large 5 L CSSR (total specific energy consumption: 0.07 kW h L−1) was substantially lower than in the smaller 15 ml batch reactor system (6 kW h L−1). This observation is in line with Bermúdez et al.'s27 findings, showing that raising the sample weight from 5 to 100 g leads to a significant 90–95% reduction in the MW specific energy consumption for sample heating, while beyond 200 g, the specific energy consumption of MW energy remains relatively constant.
3.5. Kinetics parameters evaluation for the EL synthesis process in the MWVIS-CSSR
The PSCB to EL continuous conversion kinetic data (Fig. 9) obtained from the MWVIS-CSSR at different reaction temperatures under otherwise optimal reaction conditions were fitted in the formulated kinetic models employing MATLAB R2014a. Notably, the formulated kinetic models exhibit remarkable agreement with experimental data, showcasing high R2 adj. (≥0.95) and low RMSE values (≤5.15 × 10⁻⁷) (Table 7). Accordingly, the kinetic rate constants for different reaction steps involved in the PSCB to EL synthesis process were evaluated and tabulated in Table 7. Analysis of Table 7 revealed that the rate of the conversion reaction from PSCB to EDGP was significantly slower in the heterogeneous catalytic route (2.0 × 10⁻⁴ g of NZF per min) compared to the homogeneous counterpart (0.0428 min−1). However, the heterogeneous catalyst, NZF, demonstrated significant advancements in enhancing the rate of the EDGP to 5EMF and 5EMF to EL conversion steps (Table 7), aligning closely with the performance of the homogeneous counterpart, i.e. DES2. Besides, the evaluated activation energies (E) and pre-exponential factors (Ao) (Table 8) suggested that the conversion reaction from EDGP to humin exhibits the highest activation energy (96.467 kJ mol−1) among all the reaction steps involved in the PSCB to EL synthesis process, suggesting the NZF photocatalyst and DES2 could effectively inhibit humin generation.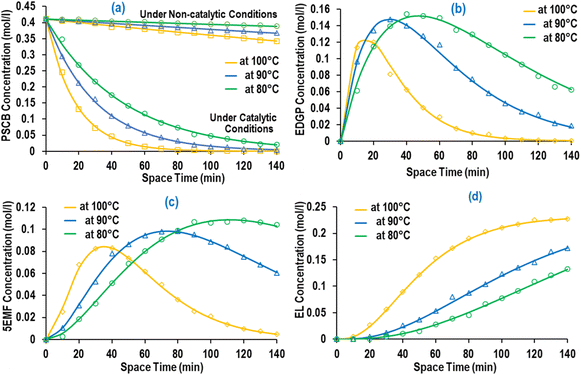 | ||
| Fig. 9 (a) PSCB (under catalytic and non-catalytic conditions), (b) EDGP, (c) 5EMF and (d) EL concentrations at different reaction temperatures [line: predicted yield; marker: actual yield]. | ||
| Temperature (K) | Rate constants | R 2 | R adj 2 | RMSE | |||||||
|---|---|---|---|---|---|---|---|---|---|---|---|
| k NC | k H1 | k H2 | k H3 | k H4 | k Ht1 | k Ht2 | k Ht3 | ||||
| 373 | 0.0013 | 0.0428 | 0.0128 | 0.0152 | 0.035 | 2.0 × 10⁻⁴ | 0.0037 | 0.0028 | 0.96 | 0.95 | 5.15 × 10⁻⁷ |
| 363 | 0.0008 | 0.0306 | 0.0116 | 0.0122 | 0.014 | 1.0 × 10⁻⁴ | 0.0025 | 0.0023 | 0.99 | 0.99 | 5.77 × 10⁻⁷ |
| 353 | 0.0004 | 0.0205 | 0.0075 | 0.007 | 0.006 | 4.44 × 10⁻⁵ | 0.0020 | 0.0017 | 0.98 | 0.97 | 5.64 × 10⁻⁷ |
| Reaction step | Non-catalytic reaction pathway | Homogeneous catalytic reaction pathway | Heterogeneous catalytic reaction pathway | |||
|---|---|---|---|---|---|---|
| E (kJ mol−1) | A o | E (kJ mol−1) | A o | E (kJ mol−1) | A o | |
| PSCB to EDGP conversion | 64.601 | 1.49 × 10⁶ | 40.167 | 18![[thin space (1/6-em)]](https://www.rsc.org/images/entities/char_2009.gif) 196.78 196.78 |
91.520 | 1.53 × 10⁹ |
| EDGP to 5EMF conversion | 29.161 | 160.20 | 33.185 | 161.41 | ||
| 5EMF to EL conversion | 42.440 | 14![[thin space (1/6-em)]](https://www.rsc.org/images/entities/char_2009.gif) 071.40 071.40 |
26.590 | 15.26 | ||
| EDGP to humin conversion | 96.467 | 1.11 × 10¹² | ||||
3.6. Techno-economic analysis of the SCB to EL conversion process
Fig. 10 depicted a successful simulation of the SCB to EL conversion process, showcasing four hierarchical blocks (DES PREPARATION, SCB PRETREATMENT, EL PRODUCTION, and PRODUCT PURIFICATION) along with corresponding feed and product flow rates. The SCB PRETREATMENT hierarchical block was simulated with a processing capacity of 2000 kg h−1 of SCB, resulting in the production of 378 kg h−1 of lignin, 4314 kg h−1 of sodium acetate, and 1423 kg h−1 of PSCB. Notably, the RSTOIC model was used to simulate the pretreatment and neutralization reactor. A detailed process flow-diagram of the simulated SCB PRETREATMENT is shown in Fig. S6.†Within the EL PRODUCTION hierarchy block (Fig. 11), the MWVIS-CSSR was simulated as a single CSTR (reactor volume: 72 m3, space time: 142 min), enabling the processing of 30![[thin space (1/6-em)]](https://www.rsc.org/images/entities/char_2009.gif) 812 kg h−1 of the reaction mixture. Following the completion of the reaction, the NZF magnetic photocatalyst was separated using a magnetic separator. Subsequently, humin was isolated through filtration, and the remaining liquid product mixture was directed to the PRODUCT PURIFICATION hierarchy block. Notably, during the humin separation process, it was assumed that 1% of the total utilized DES2 was lost.
812 kg h−1 of the reaction mixture. Following the completion of the reaction, the NZF magnetic photocatalyst was separated using a magnetic separator. Subsequently, humin was isolated through filtration, and the remaining liquid product mixture was directed to the PRODUCT PURIFICATION hierarchy block. Notably, during the humin separation process, it was assumed that 1% of the total utilized DES2 was lost.
Although the MWVIS-CSSR was simulated as a single reactor (72 m3 volume), upscaling to such large volume poses challenges. One of the key challenges associated with large MW or photo-reactors is uneven distribution of electromagnetic energy due to their short penetration depth in the reactor medium. In this context, a well-executed reactor design typically involved the consideration of the penetration depth of MW within the reaction medium, in conjunction with other conventional design factors. Goyal et al.48 reported the significance of considering the microwave penetration depth when the reactor's maximum diameter exceeds four times that depth, in order to achieve consistent and uniform microwave heating. Based on complex permittivity [ε(iω) = ε(ω)′ − iε(ω)′′] (Fig. 12(a)) and the calculated penetration depth from eqn (1) (0.246 m) of DES2–ethanol medium at 915 MHz MW frequency, it can be observed that the 5 liter MWVIS-CSSR can be easily scaled up to 1 m3 volume (by increasing the reactor height and diameter by 6 times, while maintaining the same height-to-diameter ratio as in the MWVIS-CSSR). Conversely, in terms of scaling up the CSSR with respect to VIS penetration depth poses no challenges, as the size of the Ni0.5Zn0.5Fe2O4 photocatalyst is smaller (<30 nm) than the VIS penetration depth (Fig. 12(b)) and the reaction medium exhibits transparency to VIS irradiation. Notably, various companies have already designed and implemented industrial-scale MW intensified CSSR (https://www.nanomagtech.com/) and photo-CSSR (https://www.ekato.com/) systems for different reaction applications; however, no previous company reported or designed a combined MW and VIS irradiated large-scale CSSR system. Thus, based on the MW and VIS energy penetration depths in our reaction medium and insights drawn from analogous large-scale industrial reactor designs, it would be practical to employ 72 CSSRs with a 1 m3 reactor volume each, connected in parallel instead of using a single 72 m3 single CSSR. This approach will not only guarantee consistent MW heating and VIS absorption by the reaction medium but also reduce the issue of uneven residence time distribution, which is a concern when using a large single CSSR.
 | ||
| Fig. 12 (a) Complex permittivity of DES2. (b) UV-VIS absorption spectroscopic analysis of the NZF photocatalyst in DES2 medium. | ||
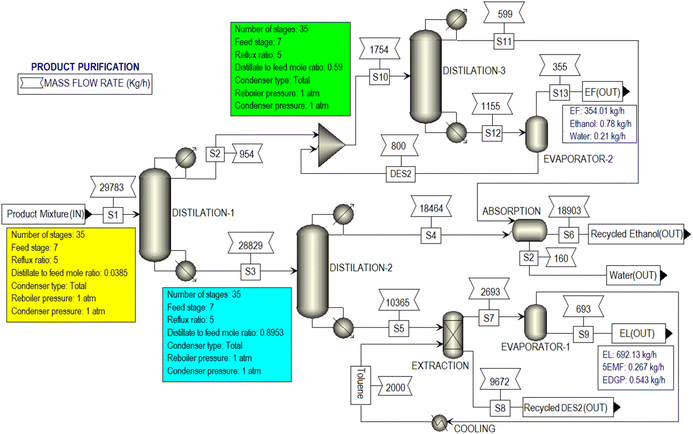
Fig. 13 illustrates the simulated PRODUCT PURIFICATION hierarchical block, involving crucial unit operations such as distillation, extractions, and evaporation for the efficient separation of EL, DES2, ethanol, and EF. The hierarchical block commenced with distillation column 1, accomplishing complete separation of EF and a partial separation of ethanol from the product mixture. Subsequently, the remaining product mixture was sent to distillation column 2, where complete separation of ethanol was achieved. An extractor was then used to separate DES2 from the bottom product of distillate 2, employing toluene as the extracting solvent. Finally, EL (purity >99%) was separated from the extraction solvent by evaporating and recycling the toluene. Notably, in the purification process, DES2 served as an entrainer49 in distillation column 3, facilitating the separation of ethanol from the EF–ethanol mixture that was initially obtained as a distillate from distillation column 1. Subsequently, EF was completely isolated from DES2 through evaporation, resulting in the collection of 99% pure EF, while DES2 was recycled back into distillation column 3.
In Fig. 14(a), the depicted data illustrated the overall capital expenses (CAPEX) and annual operating expenses (OPEX) associated with the simulated conversion process from SCB to EL, conducted at a processing capacity of 2000 SCB per hour. Analysis of Fig. 14(a) revealed that raw material costs constituted the predominant share of the total annual OPEX, comprising 45%, with utility costs following closely at 34%. On the other hand, Fig. 14(b) highlighted that the major equipment contributing to the total equipment costs includes the reactors (50%), followed by the distillation column (26%) and heat exchanger (16%). Notably, within the total reactor cost (cost of the pretreatment reactor, neutralizer and MWVIS-CSSR), the MWVIS-CSSR alone accounted for a total cost of 2.89 × 10⁶ US$, representing 67% of the total reactor cost. Despite the higher cost of the MWVIS-CSSR, the annual electricity consumption cost of the MWVIS system represents only 11% of the total annual utility cost, amounting to a total of 4.92 × 10⁵ US$. The number of magnetrons used in a reactor significantly impacts its operational cost due to their low efficiency in converting electrical energy to microwave power.50 Conversely, the power rating of the magnetrons influences the purchase cost of the reactor, as higher power ratings typically lead to lower purchase costs.51 Therefore, it is important to optimize the employed magnetron system in order to enhance the energy savings. The cost of the MWVIS-CSSR can also be reduced by employing cutting-edge solid-state microwave generators which offers substantial cost benefits over traditional magnetrons by improving efficiency and reducing maintenance and operational expenses.52
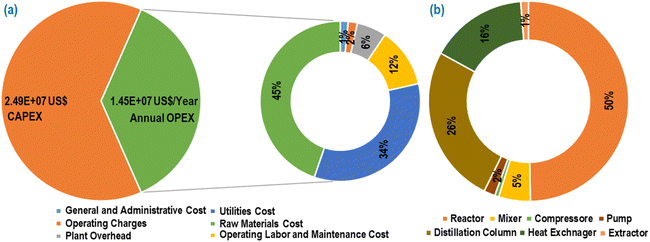 | ||
| Fig. 14 (a) Total CAPEX and annual OPEX of the SCB to EL synthesis process. (b) Share of major equipment in the total equipment costs. | ||
Upon commencement of operations, the simulated process reveals an annual product sale of 3.96 × 10⁷ US$, with 1.74 × 10⁷ US$ from annual EL sales and an additional 6.42 × 10⁶ US$ stemming from annual EF sales. The sales revenue data provide insightful financial metrics for the simulated process, including a robust internal rate of return (IRR) of 54.25% with a net present value (NPV) of 8.22 × 10⁵ US$, signifying the project's profitability. Additionally, the payback period is estimated at 4.91 years (including a 1 year construction period), demonstrating the time required for the initial investment to be recouped through generated profits. Zhuo et al.53 conducted an economic analysis on large scale EL production from corn straw, with an annual processing capacity of 70![[thin space (1/6-em)]](https://www.rsc.org/images/entities/char_2009.gif) 000 tons of corn straw and reported that the calculated IRR of the large-scale production system was 35.08% and the payback period was 5.32 years. Notably, economic analyses were also carried out for the SCB to EL conversion process utilizing the MW-CSSR and VIS-CSSR, which revealed that the process involving the MW-assisted CSSR yielded an IRR of 24.5% with a payback period of 13.45 years whereas the process involving the VIS-assisted CSSR showed no economic profit within the plant's lifetime of 20 years. Therefore, from the economic analysis, it is evident that the utilization of the MWVIS-CSSR significantly enhances the financial feasibility and attractiveness of the continuous SCB to EL conversion process.
000 tons of corn straw and reported that the calculated IRR of the large-scale production system was 35.08% and the payback period was 5.32 years. Notably, economic analyses were also carried out for the SCB to EL conversion process utilizing the MW-CSSR and VIS-CSSR, which revealed that the process involving the MW-assisted CSSR yielded an IRR of 24.5% with a payback period of 13.45 years whereas the process involving the VIS-assisted CSSR showed no economic profit within the plant's lifetime of 20 years. Therefore, from the economic analysis, it is evident that the utilization of the MWVIS-CSSR significantly enhances the financial feasibility and attractiveness of the continuous SCB to EL conversion process.
3.7. Engine performance and exhaust analysis
The engine performance analysis data, involving brake thermal efficiency and brake-specific fuel consumption (BSFC) for various EL–biodiesel–diesel blended fuels (EL5B10, EL10B10, EL5B20, EL10B20) at 1500 rpm engine speed, is presented in Fig. 15(a and b). Notably, an increase in EL vol% in B10 enhanced the brake thermal efficiency (1–2%), while increasing EL vol% from 5% to 10% in B20 showed an adverse effect, leading to a decrease in the thermal efficiency (Fig. 15(a)). However, the BSFC was found to slightly increase (1–2.7%) with the augmented blending proportion of EL in both B10 and B20 (Fig. 15(b)). These observations emphasize that incorporating 5 vol% EL in both B10 and B20 has the potential to enhance engine efficiency.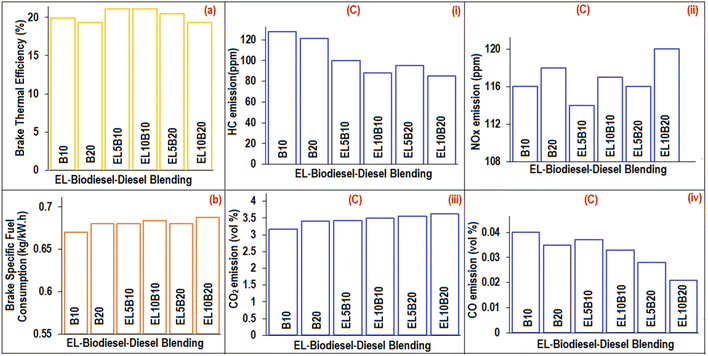 | ||
| Fig. 15 (a) Brake thermal efficiency, (b) brake specific fuel consumption and (c) exhaust emission analyses: (i) HC, (ii) NOx, (iii) CO2, and (iv) CO of different blends. | ||
Fig. 15(c(i–iv)) illustrate the HC, NOx, CO2, and CO exhaust emissions for B10, B20, and EL-blended fuels (EL5B10, EL10B10, EL5B20, EL10B20). The HC emission data (Fig. 15(c(ii))) demonstrates a notable reduction with 5 vol% (HC reduction: 21–22%) and 10 vol% EL blending (HC reduction: 29–31%), compared to reference fuels B10 and B20. This reduction in HC emissions is ascribed to improved combustion in the combustion chamber, facilitated by the presence of oxygen (33 wt%) in EL.54 Notably, the NOx emission (Fig. 15(c(ii))) values for EL-blended fuels were found to increase with increasing EL content; however they were less than those of B10 and B20. The rise in NOx emissions can be attributed to the increased combustion efficiency with higher EL content which leads to elevated maximum temperatures during the combustion of EL-blended fuels, creating conditions that favour the formation of NOx.55 Moreover, as the EL vol% in the EL-blended fuels increased, CO emissions (Fig. 15(c(iii))) exhibited a gradual decrease (7.5–20% at 5 vol% EL blending; 17.5–40% at 10 vol% EL blending), while CO2 emissions (Fig. 7(c(iv))) showed a gradual increase (4.5–8% at 5 vol% EL blending; 6–10% at 10 vol% EL blending) compared to the reference blends, B10 and B20, at a diesel engine speed of 1500 rpm.
3.8. Environmental sustainability analysis of the SCB to EL conversion process
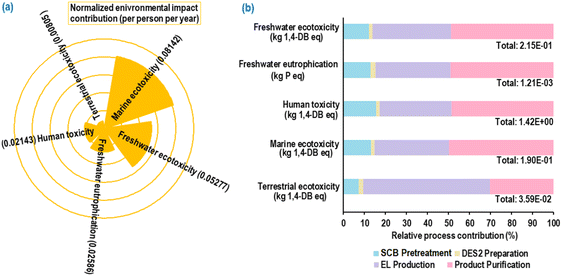
Fig. 16(a) illustrates the normalized environmental impacts (per person per year) of the most significant ReCiPe midpoint (H) impact indicators associated with the simulated continuous EL synthesis process under MWVIS irradiation. The use of fossil fuels for transporting chemicals and waste SCB,56 along with the utilization of coal-based electricity,57 results in significant emissions of nitrates and nitrogen oxides (NOx). These emissions contribute substantially to marine ecotoxicity (0.08142), freshwater ecotoxicity (0.05277), freshwater eutrophication (0.02586), human toxicity (0.02143) and terrestrial ecotoxicity (0.00805). Furthermore, the breakdown of percentage contributions by sub-processes in the significant indicators (Fig. 16(b)) revealed that product purification and EL production sub-processes were the primary contributors, followed by SCB pretreatment and DES2 preparation. The observed pattern is attributed to the utilization of coal-based steam and electricity to meet the high energy demand during product purification and EL production. Notably, Cañon et al.34 conducted an LCA analysis of the ethyl levulinate production process from Colombian rice straw derived levulinic acid and reported a comparable freshwater eutrophication value (1.624 × 10⁻³ kg P eq.), slightly higher than the result obtained in the present study, indicating the environmental sustainability of the current process. The other minor environmental impact indicators are associated with the simulated EL conversion process and their normalized contributions are presented in ESI Fig. S7.†A comparative environmental impact assessment study (Fig. 17(a)) for reactor systems indicated that the MWVIS-CSSR has less environmental impact in all indicators compared to MW-CSSR and VIS-CSSR systems. Thus, the synergistic MWVIS irradiation system not only enhanced the EL yield, but also had less environmental impacts on marine ecotoxicity, freshwater ecotoxicity, freshwater eutrophication, human toxicity and terrestrial ecotoxicity by 40–60%, 41–62%, 40–60%, 39–61% and 9–17%, respectively in comparison with the MW and VIS systems.
Interestingly a comparative environmental impact analysis based on the blended fuel exhaust emission (Fig. 15(c)) and energy output data (Table S2†) showed that 5 vol% EL blending with B10 exhibited the least environmental impact in terms of climate change (kg CO2 eq.) among all other fuel blends (Fig. 17(b)). Consequently, the integration of 5 vol% EL into B10 (biodiesel–diesel: 10![[thin space (1/6-em)]](https://www.rsc.org/images/entities/char_2009.gif) :
:![[thin space (1/6-em)]](https://www.rsc.org/images/entities/char_2009.gif) 90 vol%) could significantly diminish overall environmental impacts, despite the B10EL5 blend showing elevated HC and CO emissions compared to other EL–biodiesel–diesel blends. A plausible explanation for this phenomenon could be the reduced NOx emissions by B10EL5 compared to other blends, thereby establishing itself as a less significant contributor to climate change (1.72 × 10⁻² kg CO2 eq.).58
90 vol%) could significantly diminish overall environmental impacts, despite the B10EL5 blend showing elevated HC and CO emissions compared to other EL–biodiesel–diesel blends. A plausible explanation for this phenomenon could be the reduced NOx emissions by B10EL5 compared to other blends, thereby establishing itself as a less significant contributor to climate change (1.72 × 10⁻² kg CO2 eq.).58
The comprehensive evaluation of both techno-economic and environmental impact analyses revealed that the continuous EL conversion process utilizing the integrated MWVIS irradiation system in a CSSR demonstrated enhanced overall process sustainability. This was evident in terms of both economic feasibility and environmental sustainability when compared to employing individual irradiation systems. The synergistic effect of MW and VIS irradiation in the presence of the NZF photocatalyst and DES2 medium contributed to improved efficiency and cost-effectiveness, and reduced environmental impacts, making it a promising approach for continuous ethyl levulinate production.
4 Conclusion
Sustainable continuous valorisation of pretreated sugarcane bagasse (PSCB) into ethyl levulinate (EL) was achieved employing an innovative microwave-visible irradiated continuous stirred slurry reactor (MWVIS-CSSR). Under mild reaction conditions (142 min residence time and 100 °C reaction temperature), the MWVIS-CSSR could render 54.7 mol% EL yield in the presence of a magnetic Ni0.5Zn0.5Fe2O4 (NZF) photocatalyst and oxalic acid–choline chloride based acidic deep eutectic solvent (DES2). Remarkably, the synergistic impacts of MW and VIS irradiation substantially augmented the EL yield (54.7 mol%), considerably exceeding the yields achieved with individual application of MW (29.45 mol%) and VIS (20.1 mol%) irradiation. Moreover, the developed novel reaction kinetic model for the PSCB to EL conversion process, formulated by considering parallel non-catalytic and homogeneous–heterogeneous catalytic routes, has been proven to accurately interpret the experimental data. The techno-economic study and comparative environmental impact assessment revealed that the continuous conversion of sugarcane bagasse to EL employing the MWVIS-CSSR exhibited superior economic feasibility (internal rate of return: 54.25%) and had less environmental impact (marine ecotoxicity: 1.90 × 10⁻¹ kg 1,4-DB eq., freshwater ecotoxicity: 2.15 × 10⁻¹ kg 1,4-DB eq. and human toxicity: 1.42 kg 1,4-DB eq.) compared to the EL conversion process in the individual MW-CSSR and and VIS-CSSR. Besides, environmental impact analysis based on the exhaust emission of EL–biodiesel–diesel blends showed that the 5 vol% EL blending in B10 exhibited the least environmental impact in terms of climate change (kg CO2 eq.). Thus, the current continuous EL synthesis process, along with its subsequent application in assessing engine performance and the engine emission profile, not only underscores the potential for sustainable EL production through leveraging sugarcane bagasse but also signifies a significant step toward addressing energy efficiency and environmental concerns in the realm of drop-in-biofuel synthesis and its sustainable applications towards improvement in diesel engine performance and mitigation of adverse climate changes.Data availability
Supporting data for the findings are available in the ESI† of this manuscript.Author contributions
Sourav Barman: conceptualization, methodology, software, data collection & interpretation, validation. Rajat Chakraborty: conceptualization, visualization, supervision, funding acquisition, review, editing & overall guidance. All authors read and approved the final manuscript.Conflicts of interest
There are no conflicts to declare.Acknowledgements
The financial support from DHESTBT (ST/P/S&T/4 G-2/2018) (Government of West Bengal, India) is gratefully acknowledged.References
- A. A. Patil, R. R. Joshi, A. J. Dhavale and K. S. Balwan, Int. J. Eng. Res. Technol., 2019, 6, 1359–1361 Search PubMed.
- B. Tesfa, R. Mishra, C. Zhang, F. Gu and A. D. Ball, Energy, 2013, 51, 101–115 CrossRef CAS.
- J. S. Lee, J. Y. Park, D. K. Kim, J. P. Lee, S. C. Park and Y. J. Kim, Bioresour. Technol., 2008, 99, 1196–1203 CrossRef PubMed.
- B. C. Windom, T. M. Lovestead, M. Mascal, E. B. Nikitin and T. J. Bruno, Energy Fuels, 2011, 25, 1878–1890 CrossRef CAS.
- D. Unlu, N. Boz, O. Ilgen and N. Hilmioglu, Open Chem., 2018, 16, 647–652 CAS.
- V. Pace, P. Hoyos, L. Castoldi, P. Domínguez de María and A. R. Alcántara, ChemSusChem, 2012, 5, 1369–1379 CrossRef CAS PubMed.
- Y. Kuwahara, H. Kango and H. Yamashita, ACS Sustain. Chem. Eng., 2017, 5, 1141–1152 CrossRef CAS.
- F. Ye, D. Zhang, T. Xue, Y. Wang and Y. Guan, Green Chem., 2014, 16, 3951–3957 RSC.
- H. Liu, Y. Kong, W. Song, R. Zhang, J. Zhang, Y. Sun and L. Peng, Chem. Eng. J., 2024, 481, 148559 CrossRef CAS.
- Q. Guan, T. Lei, Z. Wang, H. Xu, L. Lin, G. Chen, X. Li and Z. Li, Ind. Crops Prod., 2018, 113, 150–156 CrossRef CAS.
- M. Sert, Renew. Energy, 2020, 153, 1155–1162 CrossRef CAS.
- A. Hu, H. Wang and J. Ding, ACS Omega, 2022, 7, 33192–33198 CrossRef CAS PubMed.
- H. C. Nguyen, H. C. Ong, T. T. Pham, T. K. Dinh and C. H. Su, Int. J. Energy Res., 2020, 44, 1698–1708 CrossRef CAS.
- H. Liu, Y. Zhang, T. Hou, X. Chen, C. Gao, L. Han and W. Xiao, Fuel Process. Technol., 2018, 174, 53–60 CrossRef CAS.
- S. U. Raut, S. A. Deshmukh, S. H. Barange and P. R. Bhagat, Catal. Today, 2023, 408, 81–91 CrossRef CAS.
- C. Castañeda, J. J. Martínez and A. Mesa, Rev. Fac. Ing., Univ. Antioquia, 2022, 105, 29–36 Search PubMed.
- J. S. Jang, S. J. Hong, J. S. Lee, P. H. Borse, O. S. Jung, T. E. Hong, E. D. Jeong, M. S. Won, H. G. Kim and J. Korean, Phys. Soc., 2009, 54, 204–208 CAS.
- S. Zhang, R. Shi and Y. Tan, J. Solution Chem., 2018, 47, 1112–1126 CrossRef CAS.
- O. K. Nimisha, M. Akshay, S. Mannya and A. R. Mary, Mater. Today: Proc., 2022, 66, 2370–2373 CAS.
- R. Samanta and R. Chakraborty, Renew. Energy, 2023, 210, 842–858 CrossRef CAS.
- S. Barman, S. Roy Choudhury and R. Chakraborty, Environ. Sci. Pollut. Res., 2024, 1–14 CAS.
- K. S. Konde, S. Nagarajan, V. Kumar, S. V. Patil and V. V. Ranade, Sustainable Energy Fuels, 2021, 5, 52–78 RSC.
- D. Unlu, O. Ilgen and N. D. Hilmioglu, Chem. Eng. Res. Des., 2017, 118, 248–258 CrossRef CAS.
- D. Unlu and N. Durmaz Hilmioglu, Energy Fuels, 2016, 30, 2997–3003 CrossRef CAS.
- X. Kong, S. Wu, L. Liu, S. Li and J. Liu, Mol. Catal., 2017, 439, 180–185 CrossRef CAS.
- F. Gallucci, M. Van Sint Annaland and J. A. Kuipers, Int. J. Hydrogen Energy, 2010, 35, 7142–7150 CrossRef CAS.
- J. M. Bermúdez, D. Beneroso, N. Rey-Raap, A. Arenillas and J. A. Menéndez, Chem. Eng. Process., 2015, 95, 1–8 CrossRef.
- T. Flannelly, S. Dooley and J. J. Leahy, Energy Fuels, 2015, 29, 7554–7565 CrossRef CAS.
- W. Zh. Weina, C. Chang, M. A. Chen and D. Fengguang, Chin. J. Chem. Eng., 2014, 22, 238–242 CrossRef.
- C. Tao, L. Peng, J. Zhang and L. He, Fuel Process. Technol., 2021, 213, 106709 CrossRef CAS.
- Z. W. Wang, T. Z. Lei, L. Liu, J. L. Zhu, X. F. He and Z. F. Li, BioResources, 2012, 7, 5972–5982 Search PubMed.
- T. Lei, Z. Wang, X. Chang, L. Lin, X. Yan, Y. Sun, X. Shi, X. He and J. Zhu, Energy, 2016, 95, 29–40 CrossRef CAS.
- S. Lilonfe, I. Dimitriou, B. Davies, A. F. Abdul-Manan and J. McKechnie, Chem. Eng. J., 2024, 479, 147516 CrossRef CAS.
- C. Cañon, N. Sanchez and M. Cobo, Data Brief, 2022, 45, 108681 CrossRef PubMed.
- H. Liu, H. Meng, H. Cong, X. Shen, X. Chen, H. Xing and J. Dai, RSC Adv., 2022, 12, 34145–34153 RSC.
- R. J. Wooley and V. Putsche, Development of an ASPEN PLUS physical property database for biofuels components, National Renewable Energy Lab (NREL), Golden, CO (United States), 1996 Search PubMed.
- J. De Riva, V. R. Ferro, D. Moreno, I. Diaz and J. Palomar, Fuel Process. Technol., 2016, 146, 29–38 CrossRef CAS.
- H. Ľudmila, J. Michal, Š. Andrea and H. Aleš, Wood Res., 2015, 60, 973–986 Search PubMed.
- G. Englmair, W. Kong, J. B. Berg, S. Furbo and J. Fan, Appl. Therm. Eng., 2020, 166, 114647 CrossRef CAS.
- R. Davis, L. Tao, E. C. Tan, M. J. Biddy, G. T. Beckham, C. Scarlata, J. Jacobson, K. Cafferty, J. Ross, J. Lukas and D. Knorr, Process design and economics for the conversion of lignocellulosic biomass to hydrocarbons: dilute-acid and enzymatic deconstruction of biomass to sugars and biological conversion of sugars to hydrocarbons, National Renewable Energy Lab (NREL), Golden, CO (United States), 2013 Search PubMed.
- A. Hasna, J. Appl. Sci., 2011, 11, 3613–3618 CrossRef.
- H. Baum, T. Geissler and U. Westerkamp, Z. für Verkehrswiss., 2009, 80, 118 Search PubMed.
- F. Wu, Z. Zhou and A. L. Hicks, Environ. Sci. Technol., 2019, 53, 4078–4087 CrossRef CAS PubMed.
- J. Lin, S. Liu, Z. Han, R. Ma, C. Cui and S. Sun, Chem. Eng. J., 2023, 452, 139551 CrossRef CAS.
- H. S. Fogler, Essentials of chemical reaction engineering, Pearson Education, 2010 Search PubMed.
- R. Mannhold, H. Kubinyi and G. Folkers, Molecular interaction fields: applications in drug discovery and ADME prediction, John Wiley & Sons, 2006 Search PubMed.
- J. Zhou, W. Xu, Z. You, Z. Wang, Y. Luo, L. Gao, C. Yin, R. Peng and L. Lan, Sci. Rep., 2016, 6, 25149 CrossRef CAS PubMed.
- H. Goyal, A. Mehdad, R. F. Lobo, G. D. Stefanidis and D. G. Vlachos, Ind. Eng. Chem. Res., 2019, 59, 2516–2523 CrossRef.
- M. Neubauer, T. Wallek and S. Lux, Chem. Eng. Res. Des., 2022, 184, 402–418 CrossRef CAS.
- J. Chaouki, S. Farag, M. Attia and J. Doucet, Can. J. Chem. Eng., 2020, 98, 832–847 CrossRef CAS.
- J. D. Moseley and C. O. Kappe, Green Chem., 2011, 13, 794–806 RSC.
- A. Solouki, S. A. Jaffer and J. Chaouki, Energy Rep., 2022, 8, 4373–4385 CrossRef.
- C. Zhuo, L. Xueqin, W. Zhiwei, Y. Yantao, S. Tanglei, H. Taoli, L. Peng, L. Yanling, W. Youqing, L. Tingzhou and Q. Jingshen, Ind. Crops Prod., 2023, 192, 116096 CrossRef CAS.
- L. Prasad, S. Pradhan, L. M. Das and S. N. Naik, Appl. Energy, 2012, 93, 245–250 CrossRef CAS.
- T. Lei, Z. Wang, X. Chang, L. Lin, X. Yan, Y. Sun, X. Shi, X. He and J. Zhu, Energy, 2016, 95, 29–40 CrossRef CAS.
- C. Sun, L. Chen, L. Zhai, H. Liu, K. Wang, C. Jiao and Z. Shen, J. Clean. Prod., 2020, 277, 123519 CrossRef CAS.
- M. Felix and S. H. Gheewala, Int. J. Life Cycle Assess., 2014, 19, 1424–1432 CrossRef CAS.
- Y. Lu, M. Shao, C. Zheng, H. Ji, X. Gao and Q. Wang, Atmos. Environ., 2020, 231, 117536 CrossRef CAS.
Footnote |
| † Electronic supplementary information (ESI) available. See DOI: https://doi.org/10.1039/d4su00250d |
| This journal is © The Royal Society of Chemistry 2024 |

