 Open Access Article
The beneficiation of asphalt waste through conversion into an efficient activated carbon adsorbent for diazinon pesticide, optimized through response surface methodology†
Robert O.
Gembo
 ab,
Sebusi
Odisitse
a,
Titus A. M.
Msagati
 b and
Cecil K.
King'ondu
 *a
*a
aDepartment of Chemical and Forensic Sciences, Botswana International University of Science and Technology, Palapye, Botswana. E-mail: kingonduc@biust.ac.bw
bInstitute for Nanotechnology and Water Sustainability, College of Science, Engineering and Technology, University of South Africa, Florida 1709, Roodepoort, Johannesburg, South Africa
First published on 11th June 2024
Abstract
This study reports on converting waste into an activated carbon material for the efficient removal of diazinon pesticide (DP). The asphalt waste obtained from the streets was converted into an activated carbon and was experimentally examined in a batch system. The prepared carbon adsorbents were characterized by energy-dispersive X-ray spectroscopy (EDX), X-ray diffraction (XRD), scanning electron microscopy (SEM), Fourier transform infrared spectroscopy (FTIR), Raman spectroscopy, and Brunauer–Emmett–Teller (BET) analysis. The results revealed that the activated carbon (AC) had an amorphous structure, high porosity, and a relatively high surface area of 788.33 m2 g−1. Additionally, functional groups such as –CH2– and S![[double bond, length as m-dash]](https://www.rsc.org/images/entities/char_e001.gif) O were detected for the prepared adsorbent. The impact of DP sorption parameters, such as, sorbent dosage, initial concentration, and pH were modelled and optimized using central composite design (CCD) via response surface methodology (RSM). The optimal conditions obtained from the CCD were found to be 5.6, 30 mg, and 200 mg L−1 for pH, sorbent dosage, and initial pesticide concentration, respectively, with adsorption capacity of 234.25 mg g−1. The experimental data was fitted to the linear form of pseudo first (PFO) and second order (PSO) kinetic models and the data was well described by PSO kinetic models. Based on the thermodynamic parameters, the negative values of Gibbs free energy underscore the spontaneity of the adsorption process. Enthalpy change of 1.9037 kJ mol−1 indicated the endothermic nature, while entropy change of 0.01751 kJ mol−1 K−1 indicated increased disorderliness at the adsorbent–solution interface. The study contributes to sustainable, economical solutions for pesticide contamination, emphasizing the potential of ACs derived from abundant waste materials.
O were detected for the prepared adsorbent. The impact of DP sorption parameters, such as, sorbent dosage, initial concentration, and pH were modelled and optimized using central composite design (CCD) via response surface methodology (RSM). The optimal conditions obtained from the CCD were found to be 5.6, 30 mg, and 200 mg L−1 for pH, sorbent dosage, and initial pesticide concentration, respectively, with adsorption capacity of 234.25 mg g−1. The experimental data was fitted to the linear form of pseudo first (PFO) and second order (PSO) kinetic models and the data was well described by PSO kinetic models. Based on the thermodynamic parameters, the negative values of Gibbs free energy underscore the spontaneity of the adsorption process. Enthalpy change of 1.9037 kJ mol−1 indicated the endothermic nature, while entropy change of 0.01751 kJ mol−1 K−1 indicated increased disorderliness at the adsorbent–solution interface. The study contributes to sustainable, economical solutions for pesticide contamination, emphasizing the potential of ACs derived from abundant waste materials.
Sustainability spotlightThe study highlights sustainable conversion of asphalt waste into effective activated carbon for removing diazinon pesticide. Through innovative technology and optimization methods, high adsorption capacity is achieved, offering a sustainable solution to pesticide contamination. Repurposing abundant asphalt waste materials contributes to waste reduction and environmental protection. This approach not only mitigates environmental harm but also underscores the importance of resource efficiency and circular economy principles in addressing pollution challenges and promoting sustainable practices. |
1 Introduction
Sustainable waste management (SWM) is a vital component of both the circular economy (CE) and broader sustainability efforts. Contemporary lifestyles have strayed from sustainable paths, leading to what's termed a ‘waste society’ rather than a ‘prosperous society’, marked by excessive waste generation and a pervasive culture of waste.1 Despite these challenges caused by excessive production of wastes, there are emerging strategies aimed at reversing these trends, including reintegrating municipal and industrial waste into production cycles through material recovery, fostering economies of scale, and embracing circular regenerative initiatives. The benefits of SWM recycling within CE frameworks are manifold, including increased market value of recycled products, reduction of waste disposal sites, and the sustainable sourcing of raw materials. However, a pressing question remains: what impact can SWM have on sustainability in the long run?2The current study investigates the conversion of waste asphalt, recovered from discarded road debris, into activated carbon. This activated carbon is then utilized for the adsorption of diazinon pesticide. Diazinon, a widely used pesticide along with other organophosphorus pesticides (OPPs) has been categorized by the World Health Organization as “moderately harmful” class II due to its acute toxicity, which hinders the activity of the acetylcholinesterase enzyme.3 The mechanisms of action of these pesticides involve inhibiting enzyme activity within the nervous system, thereby leading to various neurological side effects.3 Even at very low concentrations (ng L−1 ranges) in drinking water, OPPs can still cause serious negative health effects to humans. For this reason, the European Union has established guidelines for the maximum permissible concentrations of pesticide in drinking water, with a threshold of 0.1 μg L−1 for individual pesticide compound and 0.5 μg L−1 for overall pesticides.4
To meet the guidelines, scientists, and researchers, have come up with several techniques to remove these pesticides and each of these techniques have its unique set of attractive features as well as drawbacks (Table 1S, in the ESI†). Nevertheless, a common drawback among most of these treatment approaches is the necessity for high maintenance and elevated operational costs, potentially leading to the generation of by-products post-treatment.5 Consequently, the adsorption method is favored for its robust process development, simple design, and operational ease, promoting environmentally sustainable pesticide removal.4 Various adsorbents including iron modified montmorillonite,6 activated carbon,7 biochar,8 microbial system,9 clays,10 and zeolites,11 have been developed as a solution for the removal of diazinon pesticide (DP) from the water bodies. One of the benefits of meso- and microporous AC materials, in comparison to alternative solid sorbents, lies in the economical nature of their raw materials. The cost-effectiveness at the industrial production stage is attributed to the abundance of diverse carbon sources, including biomass, wood, polymeric materials, pitch, coals, coke pitch, and various industrial byproducts.12
The raw material employed in this study is asphalt, a sticky, dark, and highly viscous liquid, or semi-solid substance. It is commonly found in crude petroleum and occurs in certain natural deposits.13 The general composition of asphalt is complex consisting of asphaltenes as well as the component of crude asphalt soluble in benzene or toluene.14,15 Asphaltenes encompass nano-sized conjugated aromatic regions connected by minor aliphatic side chains featuring polar functional groups containing heteroatoms. This configuration facilitates the formation of porous asphaltene aggregates through van der Waals forces, charge–transfer interactions, and hydrogen bonding.12 Some studies have reported the use of asphalt as an unconventional carbon source,16 for instance, Homam et al.17 produced AC from a blend of asphalt and polypropylene waste for the sorption of azo dye. Rabeea et al.18 produced AC from asphalt obtained from Biji Refinery. Wang et al.19 utilized magnetic asphalt-based AC for the sorption of methylene blue. Uddin et al.13 synthesized AC through pyrolysis while, despite several advantages of ACs, one of the major drawbacks that still limit their industrial application is high cost of production due to high energy consumption.20 However, this work was conducted to evaluate the possibility of the use of waste asphalt from road debris as a precursor for AC synthesis. The asphalt used in this work was obtained from road debris sourced within the locality of Palapye, Botswana. Asphalt waste presents a readily available and abundant resource that can be repurposed into high-quality AC, providing a sustainable solution for both waste management and resource conservation. Despite containing trace amounts of hazardous substances like polycyclic aromatic hydrocarbons and heavy metals, proper processing techniques can mitigate these risks effectively. Moreover, the utilization of asphalt waste for AC production not only reduces environmental impact by diverting waste from landfills but also offers economic benefits by creating value-added products. By implementing stringent safety protocols, investing in state-of-the-art processing facilities, and ensuring regulatory compliance, the risks associated with asphalt-derived activated carbon can be minimized, allowing for the realization of its vast potential as a versatile and sustainable raw material.21–23
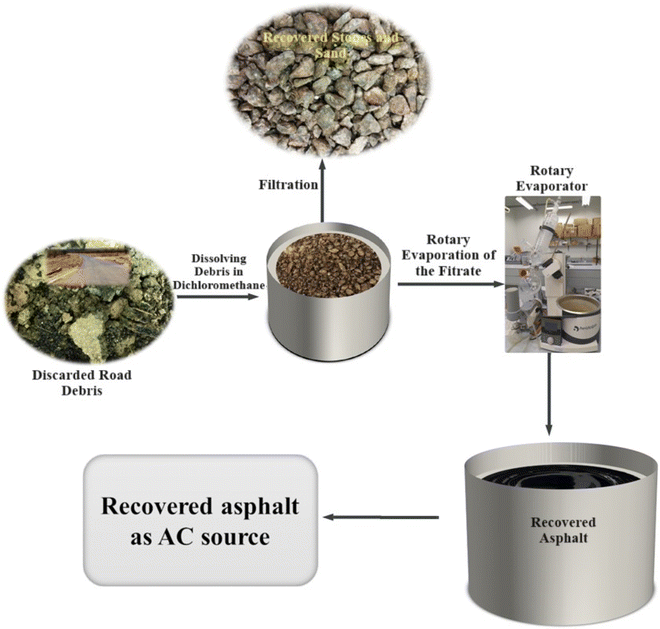
The asphalt used as a starting material was recovered using rotary evaporation (Rotavap) process (Fig. 1). This process is recognized for its reduced issues related to residual solvent in the recovered asphalt, particularly for high-viscosity asphalt. Furthermore, it has demonstrated greater efficiency in handling larger sample sizes, simplicity, and reduced labor intensity compared to alternative methods.24 The production of AC, incorporating factors like activation temperature, time, and ratio, was systematically optimized using the Taguchi method for experimental design. The resulting effective carbon materials were then optimized for the removal process of DP from aqueous solutions. The parameters of sorbent dosage, concentration, and pH were methodically optimized through the application of CCD. This comprehensive methodology of using Taguchi and CCD was employed to enhance both the preparation of AC and its effectiveness in DP removal, respectively.
2 Materials and chemicals
Materials: The asphalt used in this work was recovered from road debris sourced within the locality of Palapye, Botswana. Chemicals: All the chemical reagents such as NaOH, KOH, HCl and other chemicals were utilized without any further modification because they were of analytical-grade quality. The DP (Table 1) utilized here was obtained from a local agrovet within Palapye, Botswana. Dissolution of 10.8 mL of diazinon (270, 000 mg L−1) in 5000 mL distilled water produced a stock solution of 5000 mg L−1 concentration. Different desired concentrations applied in this study were obtained from the stock solution. UV-vis spectrophotometer (Evolution-201, Shimadzu, Japan) was used to detect diazinon at maximum wavelength of 246 nm.| IUPAC name | Structure | Molecular weight (g mol−1) | λ max (nm) | Solubility |
|---|---|---|---|---|
| a Source: PubChem. | ||||
| O,O-Diethyl O-[4-methyl-6-(propan-2-yl)pyrimidin-2-yl] phosphorothioate |
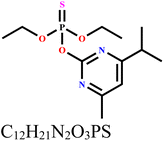
|
304.35 | 246 | 40 mg L−1 at 25 °C |
2.1 Recovery of asphalt
The rotary evaporator method was used for the recovery of the asphalt from the discarded road debris according to Fig. 1. In a typical recovery process, ∼1 kg of the discarded road debris was dissolved in ∼1 L of dichloromethane (DCM) solvent. The mixture was left to stand for about 2 h to allow all the asphalt to dissolve, thereafter it was filtered using vacuum pump. The viscous asphalt was recovered from the filtrate (DCM + asphalt) using rotary evaporation procedure. The recovered asphalt was then kept in a container for further use.2.2 Taguchi experimental design
Taguchi method constitutes an approach that facilitates the utilization of experimental techniques capable of producing relevant data for efficient statistical examination. The use of design of experiment is a robust route applied to attain optimal conditions with reduced number of experimental runs.25 In the typical utilization of the Taguchi design technique, the initial stage involves the selection of the response variable under examination. Subsequently, the variables that exert an impact on the response variable are categorized in the second step. The third stage entails the determination of the levels associated with these factors. Following this, the sensitivity of the factor levels is tested through an experimental analysis utilizing an orthogonal array.26The conventional approach for optimizing the preparation of AC and its application in either energy storage or environmental remediation involves the sequential change of individual factors through “one factor at a time” method.27 However, this traditional methodology has a significant drawback, primarily attributed to the extensive number of experiments it necessitates. The classical ‘changing one factor at a time’ method is notably inefficient, demanding a substantial investment of both labor and time.28,29 In contrast, the design of experiments emerges as a highly efficient alternative to traditional experimental approaches.26 This streamlined approach not only reduces the burden of experimentation but also is a more time-effective strategy in optimizing the preparation of AC and its application in the removal of DP.
The recovered asphalt (∼185 g) prior to activation was first carbonized at 400 °C for 180 min in a tube furnace (Model: OTF-1200X, MTI Corporation, USA) with a 10 °C min−1 heating rate under a N2 gas flow (20 cm3 min−1). The resulting carbon hereafter referred to as AsC was then mixed with KOH at various activation mass ratios as denoted in Table 2. For comparison, the AsC was also activated using NaOH under optimal conditions. The carbon materials activated using sodium and potassium are hereafter referred to as NaAsAC, and KasAC. The resulting AC was dispersed in 50 mL of 1 M HCl solution and stirred for 1 h followed by washing with distilled water until the solution attained a pH range of 6.6–7.0. Subsequently, the AC samples were dried at 100 °C for 24 h and stored for further applications.
| S/N | Coded values | Actual values | ||||
|---|---|---|---|---|---|---|
| Activation temperature (°C) | Activation time (min) | Activation ratio | Activation temperature (°C) | Activation time (min) | Activation ratio | |
| 1 | 1 | 1 | 1 | 500 | 45 | 1 |
| 2 | 1 | 2 | 2 | 500 | 60 | 2 |
| 3 | 1 | 3 | 3 | 500 | 75 | 3 |
| 4 | 2 | 1 | 2 | 600 | 45 | 2 |
| 5 | 2 | 2 | 3 | 600 | 60 | 3 |
| 6 | 2 | 3 | 1 | 600 | 75 | 1 |
| 7 | 3 | 1 | 3 | 700 | 45 | 3 |
| 8 | 3 | 2 | 1 | 700 | 60 | 1 |
| 9 | 3 | 3 | 2 | 700 | 75 | 2 |
2.2.2.1 Adsorption experiments. All the DP sorption batch experiments onto the sorbents were performed in 250 mL Erlenmeyer flasks. Adsorption variables, including initial DP concentration, sorbent dosage, and pH were varied based on the levels outlined in Table 3S in the ESI.† The experimental runs were conducted according to the design outlined in Table 4S, in the ESI.† After 90 min of adsorption time, the solution was centrifuged at 13
![[thin space (1/6-em)]](https://www.rsc.org/images/entities/char_2009.gif) 000 rpm for 7 min, the remaining DP concentration in the solution was determined using a Shimadzu Evolution 201 UV-vis spectrophotometer at 246 nm wavelength. Subsequently, the efficiency of DP removal and adsorption capacity by the AsC, NaAsAC, and KAsAC adsorbent were calculated. The adsorption procedure was optimized using RSM via CCD facilitated by Design Expert version 13.0.5.0. The process variables affecting removal efficiency viz initial diazinon concentration, pH, and KAsAC dosage, were each systematically explored across defined ranges comprising five levels (Table 3S, in the ESI†). Consequently, this defined experimental domain resulted in a comprehensive matrix of 20 distinct experimental runs, each characterized by unique configurations of process variables (Table 4S, in the ESI†). Percentage removal (%) and adsorption capacity (qe) were determined according to the following equations.
000 rpm for 7 min, the remaining DP concentration in the solution was determined using a Shimadzu Evolution 201 UV-vis spectrophotometer at 246 nm wavelength. Subsequently, the efficiency of DP removal and adsorption capacity by the AsC, NaAsAC, and KAsAC adsorbent were calculated. The adsorption procedure was optimized using RSM via CCD facilitated by Design Expert version 13.0.5.0. The process variables affecting removal efficiency viz initial diazinon concentration, pH, and KAsAC dosage, were each systematically explored across defined ranges comprising five levels (Table 3S, in the ESI†). Consequently, this defined experimental domain resulted in a comprehensive matrix of 20 distinct experimental runs, each characterized by unique configurations of process variables (Table 4S, in the ESI†). Percentage removal (%) and adsorption capacity (qe) were determined according to the following equations. | (1) |
 | (2) |
2.2.2.2 Kinetics and thermodynamics studies. Exploring kinetic models of the adsorption provides invaluable insights into the underlying mechanisms governing the diazinon adsorption onto AsC, NaAsAC, and KAsAC. The obtained experimental data from the sorption by these prepared carbon materials were meticulously fitted against PFO and PSO kinetic models, as displayed in Table 5S.† Recognizing the pivotal role of temperature in influencing the adsorption phenomena, experimental analysis was systematically conducted across a range of temperatures (298 to 328 K). These temperature variations served as a crucial parameter in comprehending the efficacy of KAsAC as an adsorbent for diazinon removal. Moreover, to discern the thermodynamic implications of temperature on diazinon adsorption, fundamental parameters like change in entropy (S°), change in enthalpy (ΔH°), and change in Gibbs energy (ΔG°) were methodically evaluated. The methodology for calculating these parameters is explicated in the ESI.†
3 Results and discussions
3.1 Influence of control factors and noise factors on preparation of AC
Nine different samples of ACs were tested for their percentage removal of DP according to the L9 array of the Taguchi method (Table 2). Additionally, noise factors were incorporated into the experimental design. The experimental and predicted percentage removal of these AC samples, along with their corresponding S/N ratios, are recorded in Table 3.| Run | Activation temperature | Activation time | Activation ratio | Yield (%) | S/N | Response (% removal) | |
|---|---|---|---|---|---|---|---|
| Experimental | Predicted | ||||||
| 1 | 500 | 45 | 1 | 58.88 | 39.55 | 94.91 | 95.51 |
| 2 | 500 | 60 | 2 | 43.45 | 39.71 | 96.67 | 96.88 |
| 3 | 500 | 75 | 3 | 45.34 | 39.83 | 98.04 | 98.26 |
| 4 | 600 | 45 | 2 | 40.86 | 39.82 | 97.99 | 97.16 |
| 5 | 600 | 60 | 3 | 35.90 | 39.89 | 98.77 | 98.53 |
| 6 | 600 | 75 | 1 | 35.46 | 39.90 | 98.90 | 97.92 |
| 7 | 700 | 45 | 3 | 25.78 | 39.89 | 98.75 | 98.81 |
| 8 | 700 | 60 | 1 | 20.88 | 39.81 | 97.80 | 98.20 |
| 9 | 700 | 75 | 2 | 25.38 | 39.91 | 98.99 | 99.57 |
Subsequently, the S/N ratio was subjected to ANOVA to ascertain the relevance of the obtained S/N data. The ANOVA results pertaining to the S/N ratio are presented in Table 4. Kirby31 reported that the F-value serves as a valuable indicator of the influence exerted by control factors on the obtained results. The F-value below one indicates the variable effect is not significant whereas a value closer to two implies the effect of the variable is moderate. Therefore, it can be observed from Table 4 that all the three parameters notably influenced the preparation of ACs.
| Source | DF | Adj SS | Adj MS | F-value | P-value |
|---|---|---|---|---|---|
| Regression | 3 | 11.493 | 3.8308 | 7.20 | 0.029 |
| Activation temperature | 1 | 5.831 | 5.8314 | 10.96 | 0.021 |
| Activation time | 1 | 3.054 | 3.0540 | 5.74 | 0.062 |
| Activation ratio | 1 | 2.607 | 2.6071 | 4.90 | 0.078 |
| Error | 5 | 2.659 | 0.5318 | ||
| Total | 8 | 14.152 |
The impact of control factors on the S/N ratio for DP removal onto the prepared AC samples are shown in Fig. 2. Increasing the activation temperature from 500 to 600 °C resulted in a higher removal capacity, however, at 700 °C there was a decline in S/N ratio of AC. This initial enhancement in removal capacity may be as a result of the creation of additional pores, improved pore structure and surface area. Conversely, at higher activation temperature, the pores are potentially destroyed leading to a loss of sorption sites, thereby reducing the removal capacity.32 The sorption capacity of DP was noted to sharply increase with the rise in activation time and ratio. This is attributed to increase pore formation as a result of prolonged exposure and increasing the amount of activating agent.33 The optimum parameters for the production of AC were 600 °C, 75 min and activation ratio of 1![[thin space (1/6-em)]](https://www.rsc.org/images/entities/char_2009.gif) :
:![[thin space (1/6-em)]](https://www.rsc.org/images/entities/char_2009.gif) 3.
3.
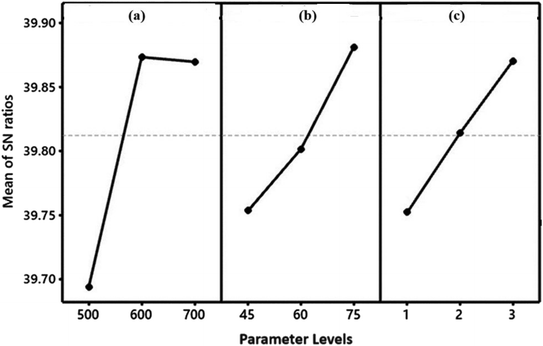 | ||
| Fig. 2 Influence of activation (a) temperature, (b) time, and (c) ratio preparation parameters on S/N ratio. | ||
3.2 X-ray diffraction analysis
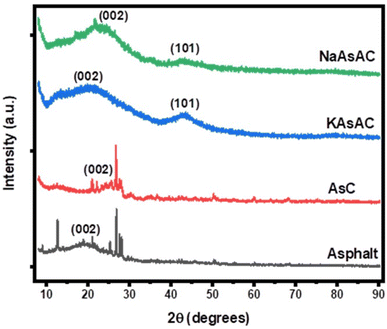
The XRD patterns of recovered asphalt, AsC, NaAsAC, and KAsAC are illustrated in Fig. 3. The recovered asphalt exhibited a sharp peak at 12.7° and broader peak between 15.0 and 25.0° which corresponds to γ-band and graphene (002) band.19 Since it was a recovered asphalt, other peaks at 26.8, 27.6, and 28.0 which contains crystalline components found in asphalt could be ascribed to minerals like quartz, calcite, and various clay minerals. The presence of the γ-band is associated with the existence of aliphatic hydrocarbon chains, signifying the presence of amorphous disordered structure.34 Graphene layers (002) originate from planar arrangement of aromatic structure.35 Unlike the recovered untreated asphalt, the prepared AC samples (KAsAC and NaAsAC) showed no γ peaks, indicative of the removal of aliphatic hydrocarbon chains during the process of activation. The broad diffraction peaks of KAsAC and NaAsAC at 20.5 and 43.1° correspond to (002) and (101) crystal plane of disordered and graphitic carbon, correspondingly.3.3 Raman and FTIR analysis
Raman analysis serves as a versatile method for discerning structural alterations within carbonaceous materials. In the pursuit of unveiling the properties and disorder present in activated carbons, Raman analysis was conducted, and the corresponding spectra can be found in Fig. 4a. Two distinct peaks manifested in the spectra. The G band, positioned around 1585 cm−1, primarily corresponds to the E2g phonon mode, which involves in-plane stretching vibrations of sp2 carbon atoms in the graphite-like structure. Conversely, the D band, observed at approximately 1325 cm−1, is associated with disorder-induced defects, such as vacancies, dislocations, or grain boundaries, leading to the disruption of the carbon lattice. These observations offers insights into the degree of structural order, providing valuable information about the material's arrangement and organization.36 It is noteworthy to highlight a distinct contrast in the intensities of the D-bands observed across the prepared carbon samples. Comprehensive details, including the Raman shift and intensity ratio across all carbon samples, are presented in Table 5. A noticeable shift was evident in the ID/IG ratio, a change that is intricately linked to the level of order within the structure. The D band, associated with structural disorder, indicated a higher intensity, serving as a key indicator of a profoundly carbon disordered structure.37,38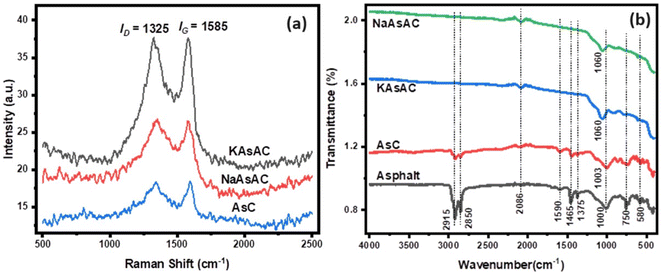 | ||
| Fig. 4 (a) Raman spectra of the prepared samples from asphalt and (b) FTIR spectra for asphalt and the prepared samples. | ||
| Samples | |||
|---|---|---|---|
| AsC | KAsAC | NaAsAC | |
| D band (cm−1) | 1342 | 1325 | 1350 |
| G band (cm−1) | 1595 | 1585 | 1578 |
| I D/IG | 0.98 | 1.03 | 1.00 |
The IR spectra of recovered asphalt material, pretreated material AsC, KasAC, and NaAsAC are given in Fig. 4b. The AsC bands at 2915 and 2850 cm−1 were attributed to the stretching vibration of the methylene group, whereas the bending vibrations of –CH2– are represented by 1465 and 1375 cm−1 bands. The observed peaks at 1590 and 1000 cm−1 are indicative of pyridine clusters and S![[double bond, length as m-dash]](https://www.rsc.org/images/entities/char_e001.gif) O vibration functional, respectively. The spectral bands detected in the region of 1600–1400 cm−1 signify the existence of the skeletal aromatic structure.19,39Fig. 4b illustrates chemical and structural transformation of the recovered untreated asphalt to AsC and AC (KAsAC and NaAsAC). In the spectrum of AsC, the intensity of the bands associated with the bending and stretching vibrations of the methylene group was notably diminished compared to those observed recovered asphalt. Moreover, no vibration bands attributed to –CH2– were detected in KAsAC and NaAsAC. This occurrence is linked to the dehydrogenation of AsC at elevated temperatures. The thermal treatment at elevated temperatures facilitated the removal of hydrogenous organic compounds and induced the conversion of secondary carbon species into graphitic carbon. The peak at 1590 cm−1 was absent in the AC samples showing the absence of pyridine functional groups on the prepared ACs. No significant change was observed in the intensity of the band at 1000 cm−1 which indicates the presence of S
O vibration functional, respectively. The spectral bands detected in the region of 1600–1400 cm−1 signify the existence of the skeletal aromatic structure.19,39Fig. 4b illustrates chemical and structural transformation of the recovered untreated asphalt to AsC and AC (KAsAC and NaAsAC). In the spectrum of AsC, the intensity of the bands associated with the bending and stretching vibrations of the methylene group was notably diminished compared to those observed recovered asphalt. Moreover, no vibration bands attributed to –CH2– were detected in KAsAC and NaAsAC. This occurrence is linked to the dehydrogenation of AsC at elevated temperatures. The thermal treatment at elevated temperatures facilitated the removal of hydrogenous organic compounds and induced the conversion of secondary carbon species into graphitic carbon. The peak at 1590 cm−1 was absent in the AC samples showing the absence of pyridine functional groups on the prepared ACs. No significant change was observed in the intensity of the band at 1000 cm−1 which indicates the presence of S![[double bond, length as m-dash]](https://www.rsc.org/images/entities/char_e001.gif) O group before and after treatment. The bands between 1600 and 1400 cm−1 disappeared in KAsAC and NaAsAC samples. This suggests that the aromatic skeletal structure underwent cross-linking and gradually transformed into a graphite carbon structure.40
O group before and after treatment. The bands between 1600 and 1400 cm−1 disappeared in KAsAC and NaAsAC samples. This suggests that the aromatic skeletal structure underwent cross-linking and gradually transformed into a graphite carbon structure.40
3.4 Scanning electron microscopy
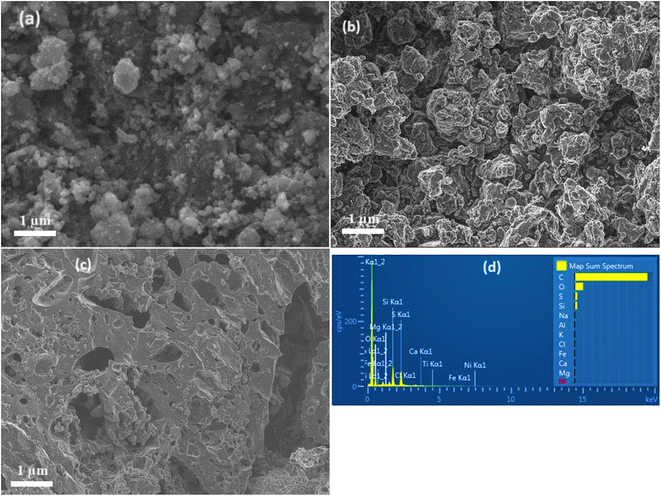
The SEM micrographs of the prepared carbon samples and the EDX of KAsAC are shown in Fig. 5. In Fig. 5a the micrograph depicts the morphology of AsC which appears irregular and somewhat clumped, lacking well-defined pores or surface features. Fig. 5b is AsC activated by NaOH (NaAsAC). NaOH activation enhanced the material's structures resulting in clearer grayscale contrast, more interparticle porosity and agglomerated particles. Fig. 5c for AsC activated by KOH (KAsAC), showed a more improved porosity compared to NaAsAC. KOH activation led to a highly porous structure with higher surface area. Both the NaOH and KOH activation introduced functional groups and created a more porous network within the carbon material improving their adsorptive capabilities. Fig. 5d displays EDX analysis of KAsAC which shows it is mainly composed of carbon. Various trace elements like O, S, Si, Na, Al, K, Cl, Fe, Ca, Mg, and Ni in the prepared AC from reclaimed asphalt originate from oxidation, asphalt mix, aggregate minerals, and environmental sources.3.5 Thermogravimetric analysis
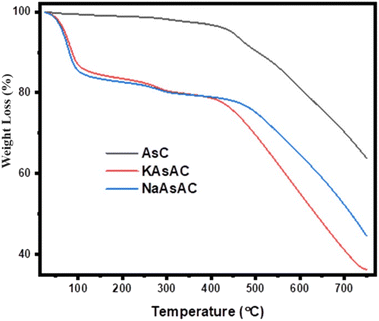
The TG curves for the AsC, KAsAC, and NaAsAC are shown in Fig. 6. As depicted in Fig. 6, a noticeable weight reduction for the carbonized asphalt begins at ∼400 °C and reaches around 35% of the initial weight at 750 °C. The initial weight loss predominantly results from the volatilization of organic oil residues with lower molecular weights. The AsC exhibited higher thermal stability due to its relatively higher degree of graphitization and higher inorganic impurities compared to KAsAC and NaAsAC. During the carbonization process, asphalt undergoes pyrolysis, leading to the elimination of volatile components and the formation of a more ordered carbon structure. This enhanced graphitization results in stronger intermolecular interactions and a higher thermal decomposition temperature. Additionally, the gradual weight loss observed during decomposition indicates a slower rate of bond cleavage, which is characteristic of a more stable carbonaceous material.41The treatment of AsC with KOH and NaOH resulted in the incorporation of additional functional groups and porosity which lowered the thermal stability of KAsAC and NaAsAC. The defects and functional groups in the KAsAC and NaAsAC carbon probably act as initiation sites for decomposition reactions at lower temperatures below 200 °C. Furthermore, the existence of highly reactive oxygen-containing functional groups like hydroxyl and carboxyl groups, can facilitate oxidative decomposition processes, leading to a more pronounced weight loss at lower temperatures. The differences in thermal stability between KAsAC and NaAsAC can be attributed to the difference in the etching ability of the activating agents. NaAsAC exhibited slightly better thermal stability compared to KAsAC, possibly due to differences in the extent of functional group formation and pore structure development.
3.6 Surface area analysis
Fig. 7 shows the N2 adsorption–desorption isotherms and the distribution of the pore sizes of AsC, KAsAC, and NaAsAC. The isotherms shown in Fig. 7a describe the correlation between the quantity of gas or vapor adsorbed by a material and the relative pressure (P/Po) at a constant temperature while the pore distribution (Fig. 7b) represents the distribution of different pores sizes within the material. As depicted in Fig. 7b, AsC, KAsAC, and NaAsAC materials exhibited a combination of micro and mesopores within their structure. According to IUPAC classification, KAsAC shows type I isotherm characterized by monolayer adsorption on a uniform surface which is shown by a steep increase in adsorption of N2. This is suggestive of monolayer adsorption at specific sites which mainly composed of micropores.42,43 NaAsAC shows type IV isotherm signifying a multilayer adsorption on a heterogeneous surface. This is explained by a broader distribution in NaAsAC indicating the formation of multiple layers of adsorbate molecules.44 The nitrogen adsorption isotherm for AsC initiates at a lower volume of nitrogen adsorbed and steadily rises as the relative pressure increases. The curve exhibits a smooth and consistent trajectory without any discernible inflection points. This characteristic suggests that the material possesses moderate porosity, indicative of its ability to accommodate nitrogen molecules within its structure without abrupt changes in adsorption behavior. The BET surface area of AsC, KAsAC, and NaAsAC was 1.02, 788.33, and 58.74 m2 g−1, respectively, while the total pore volume of AsC, KAsAC, and NaAsAC was 0.0021, 0.4451, and 0.0521 cm3 g−1, respectively.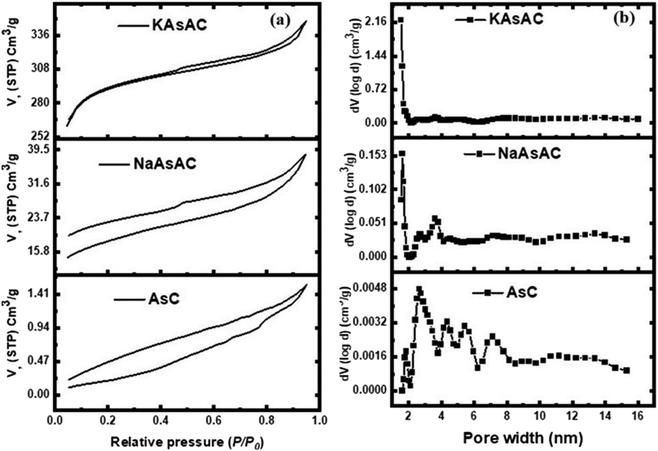 | ||
| Fig. 7 N2 adsorption–desorption isotherms and pore width distribution of AsC, NaAsAC, and KAsAC samples. | ||
3.7 Adsorption studies
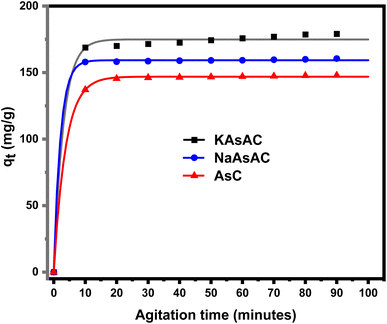
3.7.1.1 Effect of adsorption time. The influence of adsorption time on the removal of DP was studied at a fixed adsorbent dosage (30 mg), DP initial concentration (150 mg L−1), and natural pH of the DP solution indicate the actual value of pH. The sorption uptake was monitored from 10 to 90 min. The impact of adsorption time on the sorption uptake of AsC, NaAsAC, and KAsAC is shown in Fig. 8. Fig. 8 demonstrates that the sorption of DP increases with time attaining saturation around 20 min for AsC and NaAsAC while KAsAC attained saturation after 50 min of contact time. The high initial uptake capacity was due to high number of available adsorption sites which were responsible for the adsorption of DP the prepared carbon sites. After the saturation of the adsorption sites, no observable change was seen on the removal of DP. The adsorbate removal exhibited rapid initial kinetics, followed by a gradual decline until reaching equilibrium.45,46 After 90 min of adsorption time, the adsorption capacity of AsC, NaAsAC, and KAsAC was 147.40, 159.33, and 178.70 mg g−1, respectively.
| Adsorption capacity = 201.51 + 10.49 × X1 + 1.66 × X2 + 1.51 × X3 − 0.018 × X1.X2 + 0.063 × X1.X3 − 0.00102 × X2.X3 + 0.012 × X12 + 0.00015 × X22 − 0.29 × X32 | (3) |
| Run | Parameters | Response (adsorption capacity, mg g−1) | |||
|---|---|---|---|---|---|
| Adsorbent dosage, X1 (mg) | DP initial concentration, X2 (mg L−1) | pH, X3 | Experimental | Predicted | |
| 1 | 40 | 150 | 1.2 | 113.48 | 119.76 |
| 2 | 30 | 100 | 3 | 74.86 | 113.48 |
| 3 | 40 | 66 | 5.5 | 236.99 | 53.96 |
| 4 | 50 | 100 | 8 | 154.92 | 77.31 |
| 5 | 40 | 150 | 5.5 | 116.66 | 131.88 |
| 6 | 23 | 150 | 5.5 | 77.31 | 222.09 |
| 7 | 50 | 200 | 3 | 232.65 | 154.92 |
| 8 | 50 | 200 | 8 | 163.87 | 163.87 |
| 9 | 30 | 200 | 8 | 222.09 | 232.60 |
| 10 | 40 | 150 | 5.5 | 105.22 | 134.10 |
| 11 | 40 | 150 | 9.7 | 53.96 | 128.40 |
| 12 | 40 | 150 | 5.5 | 206.46 | 129.45 |
| 13 | 40 | 150 | 5.5 | 119.76 | 135.40 |
| 14 | 40 | 150 | 5.5 | 128.43 | 130.32 |
| 15 | 40 | 234 | 5.5 | 137.49 | 206.46 |
| 16 | 30 | 100 | 8 | 129.45 | 116.66 |
| 17 | 30 | 200 | 3 | 130.32 | 236.99 |
| 18 | 50 | 100 | 3 | 134.17 | 74.86 |
| 19 | 57 | 150 | 5.5 | 135.40 | 105.22 |
| 20 | 40 | 150 | 5.5 | 131.88 | 137.49 |
Table 7 summarizes the information related to the ANOVA for Quadratic model level response. The ANOVA for the response surface quadratic model applied to the sorption of DP by KAsAC indicated a substantial model significance, as evidenced by the model's F-value of 121.59. The p-values below 0.05 further established the relevance of the model terms. In this instance, the significant model terms were X1, X2, and X12. The predicted R2 value of 0.9366 shows reasonable agreement with the Adjusted R2 of 0.9828, with a difference of less than 0.2. Adequate precision, which measures the S/N, is desirable above 4; here, the ratio of 38.321 indicates an adequate signal. Therefore, this model is suitable for exploring the design parameters.
| Source | Sum of squares | D f | Mean square | F-value | P-value |
|---|---|---|---|---|---|
| Model | 48![[thin space (1/6-em)]](https://www.rsc.org/images/entities/char_2009.gif) 405.63 405.63 |
9 | 5378.40 | 121.59 | <0.0001 |
| X 1-dosage | 13![[thin space (1/6-em)]](https://www.rsc.org/images/entities/char_2009.gif) 249.16 249.16 |
1 | 13![[thin space (1/6-em)]](https://www.rsc.org/images/entities/char_2009.gif) 249.16 249.16 |
299.53 | <0.0001 |
| X 2-initial concentration | 32![[thin space (1/6-em)]](https://www.rsc.org/images/entities/char_2009.gif) 147.55 147.55 |
1 | 32![[thin space (1/6-em)]](https://www.rsc.org/images/entities/char_2009.gif) 147.55 147.55 |
726.78 | <0.0001 |
| X 3-pH | 45.11 | 1 | 45.11 | 1.02 | 0.3364 |
| X 1 X 2 | 663.88 | 1 | 663.88 | 15.01 | 0.0031 |
| X 1 X 3 | 19.72 | 1 | 19.72 | 0.4459 | 0.5194 |
| X 2 X 3 | 0.1314 | 1 | 0.1314 | 0.0030 | 0.9576 |
| X 1 2 | 2144.58 | 1 | 2144.58 | 48.48 | <0.0001 |
| X 2 2 | 2.03 | 1 | 2.03 | 0.0460 | 0.8345 |
| X 3 2 | 46.01 | 1 | 46.01 | 1.04 | 0.3318 |
| Residual | 442.33 | 10 | 44.23 | ||
| Lack of fit | 394.06 | 5 | 78.81 | 3.16 | 0.189 |
| Pure error | 48.27 | 5 | 9.65 | ||
| Cor total | 48![[thin space (1/6-em)]](https://www.rsc.org/images/entities/char_2009.gif) 847.96 847.96 |
19 | |||
| R 2 | 0.9909 | ||||
| Adj. R2 | 0.9828 | ||||
| Pred. R2 | 0.9366 | ||||
| Adeq precision | 38.32 |
The R2 for this model was 0.9909, indicating the model's significant capacity to predict variations in response. The residuals cluster closely around or align with the 45° line, affirming the normal distribution of errors (Fig. S2a†). Additionally, the scatter plot of residuals against predicted values (Fig. S2b†) demonstrates their random dispersion around the reference line, with no discernible pattern. According to eqn (6), the estimated efficiency of DP removal by the KAsAC, and the comparison between model predictions and experimental data is outlined in Fig. 9a. These projections from the RSM exhibited a strong alignment with the experimental indicating a robust fit.
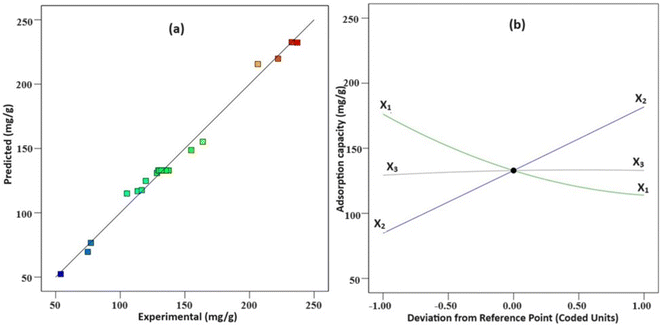 | ||
| Fig. 9 (a) Experimental and predicted plot obtained from the design, (b) response surface (perturbation) illustrating the impact of primary variables (X1, X2, and X3) on diazinon removal efficiency. | ||
The impacts of the primary variables (−1 to +1 levels) on diazinon adsorption capacity are outlined in Fig. 9b. It is imperative to highlight that in Fig. 9b, when describing the influence of one variable, other variables are kept at the zero level. For instance, it is observed that for the sorbent dosage variable (X1) when increased from −1 (30 mg) to +1 (50 mg), the remaining two variables—diazinon concentrations (X2) set at 150 mg L−1 and pH (X3) at 5.5 remain at the zero level. Optimal values for sorbent dosage, DP initial concentration, and pH were determined to be 30 mg, 200 mg L−1, respectively. Under these conditions, the predicted diazinon adsorption capacity was 234.25 mg g−1, with a desirability score of 0.985. Conducting similar experiments under these optimal conditions showed the high repeatability of the method in predicting the actual adsorption capacity, with a low relative deviation. Under these optimal conditions, the experiment was repeated, demonstrating a consistent adsorption capacity of 231.97 ± 1.61 mg g−1, confirming the accuracy of the model and its suitability for the study.
The adsorption capacity shown in Fig. 10a was reduced from 176.24 to 113.99 mg g−1 with an increase in KAsAC dosage from 30 to 50 mg. At high adsorbent dosages, interparticle interactions become more pronounced and the adsorbent particles start blocking each other's active sites and thus increasing diffusional resistance thereby decreasing the adsorption of the diazinon molecules. Also, interparticle interactions reduce the effective surface area available for adsorption.47,48
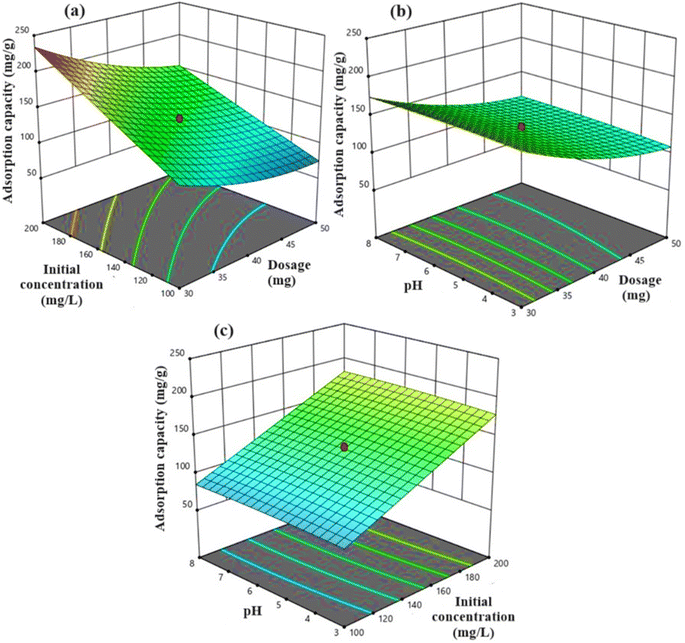 | ||
| Fig. 10 The 3D plots illustrating the interactions between (a) initial concentration and dosage, (b) pH and dosage, and (c) pH and initial concentration for DP adsorption. | ||
The increase in adsorption of diazinon onto KAsAC with increase in the initial concentration from 100 to 200 mg L−1 can be explained by several factors. Firstly, higher initial concentrations of diazinon in the solution provide a greater driving force for adsorption onto the KAsAC surface. This means that as the concentration of diazinon increases, more diazinon molecules are available to interact with the adsorption sites on the KAsAC, leading to an overall increase in adsorption capacity as shown in Fig. 10b. Moreover, increased initial concentrations of diazinon can also result in a higher concentration gradient between the solution phase and the activated carbon surface. This concentration gradient facilitates the movement of the molecules of diazinon from the solution onto the activated carbon surface, promoting greater adsorption efficiency especially when multilayer adsorption is involved.49
The influence of pH on adsorption is displayed in Fig. 10c. The slight increase in DP uptake onto KAsAC, from 129.28 to 132.93 mg g−1, with a change in pH from 3 to 8 could be associated with the existence of –CH2– and S![[double bond, length as m-dash]](https://www.rsc.org/images/entities/char_e001.gif) O functional groups on KAsAC surface. At lower pH values (pH 3), the KAsAC surface tends to be more positively charged because of protonation of –CH2– groups and the presence of positively charged species on the S
O functional groups on KAsAC surface. At lower pH values (pH 3), the KAsAC surface tends to be more positively charged because of protonation of –CH2– groups and the presence of positively charged species on the S![[double bond, length as m-dash]](https://www.rsc.org/images/entities/char_e001.gif) O groups. This positive surface charge can enhance electrostatic interactions with the negatively charged diazinon molecules, promoting adsorption. Additionally, at lower pH, diazinon molecules may exist predominantly in their protonated form, increasing their affinity for the activated carbon surface through hydrogen bonding and other interactions with functional groups.50
O groups. This positive surface charge can enhance electrostatic interactions with the negatively charged diazinon molecules, promoting adsorption. Additionally, at lower pH, diazinon molecules may exist predominantly in their protonated form, increasing their affinity for the activated carbon surface through hydrogen bonding and other interactions with functional groups.50
3.7.2.1 Effect of temperature. The impact of temperature on the sorption uptake of DP was evaluated at temperature ranging from 298 to 328 K, with DP initial concentration of 200 mg L−1, 90 min duration, pH of 5.6, and sorbent dosage of 1 g L−1 using KAsAC. Fig. 11a shows that adsorption of DP onto KAsAC increases with increase in temperature from 298 to 328 K. The higher temperatures typically led to greater molecular motion and kinetic energy within the system. This increased thermal energy enhances the collision frequency between DP molecules in the solution and the adsorption sites on the KAsAC surface, promoting more effective adsorption.45,49,51 The results of the impact of temperature were further examined with the thermodynamics parameters ΔG° (J mol−1), ΔH° (J mol−1), and ΔS° (J K−1 mol−1).45 These parameters were determined according to the following expressions:
| ΔG° = TΔS° − ΔH° | (4) |
ΔG° = −RT![[thin space (1/6-em)]](https://www.rsc.org/images/entities/char_2009.gif) ln ln![[thin space (1/6-em)]](https://www.rsc.org/images/entities/char_2009.gif) K° K° | (5) |
 | (6) |
 | (7) |
![[thin space (1/6-em)]](https://www.rsc.org/images/entities/char_2009.gif) K° vs. 1/T plot. The sorption data was subjected to further analysis through the van't Hoff plot as shown in Fig. 11b while Table 8 summarizes the thermodynamic information. The positive value of ΔH° indicates that the sorption of diazinon onto KAsAC is endothermic chemisorption.52 As shown in Table 8, the Gibbs free energy change (ΔG°) exhibits negative values across all tested temperatures, indicating the spontaneous nature of diazinon adsorption on KAsAC. The negative values ΔG° signify that solutes favor retention in the stationary phase over migration into the mobile phase. The transfer of solutes from the mobile phase to the stationary phase is thermodynamically favored in terms of enthalpy. The ΔS° value was positive suggesting an increasing randomness or disorderliness within the system during the process of adsorption process. This could occur if the sorption process leads to a more disordered arrangement of molecules on the activated carbon surface or if there is an increase in the degree of freedom of the molecules involved.
K° vs. 1/T plot. The sorption data was subjected to further analysis through the van't Hoff plot as shown in Fig. 11b while Table 8 summarizes the thermodynamic information. The positive value of ΔH° indicates that the sorption of diazinon onto KAsAC is endothermic chemisorption.52 As shown in Table 8, the Gibbs free energy change (ΔG°) exhibits negative values across all tested temperatures, indicating the spontaneous nature of diazinon adsorption on KAsAC. The negative values ΔG° signify that solutes favor retention in the stationary phase over migration into the mobile phase. The transfer of solutes from the mobile phase to the stationary phase is thermodynamically favored in terms of enthalpy. The ΔS° value was positive suggesting an increasing randomness or disorderliness within the system during the process of adsorption process. This could occur if the sorption process leads to a more disordered arrangement of molecules on the activated carbon surface or if there is an increase in the degree of freedom of the molecules involved.
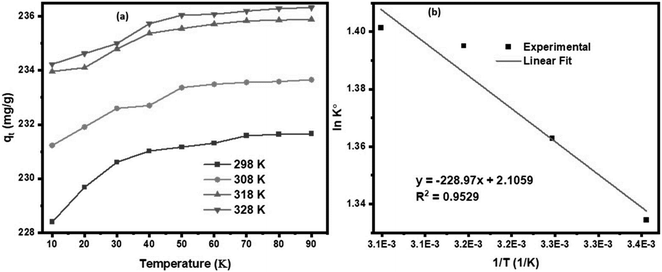 | ||
| Fig. 11 (a) Effects of temperature on the DP over KAsAC, (b) van't Hoff plot for DP sorption onto KAsAC. | ||
| Temperature (K) | K° | ln(K°) | ΔG° (kJ mol−1) | ΔH° (kJ mol−1) | ΔS° (kJ mol−1 K−1) |
|---|---|---|---|---|---|
| 298 | 3.7977 | 1.3344 | −3.3061 | 1.9037 | 0.01751 |
| 308 | 3.9074 | 1.3629 | −3.4899 | ||
| 318 | 4.0351 | 1.3950 | −3.6882 | ||
| 328 | 4.0607 | 1.4013 | −3.8215 |
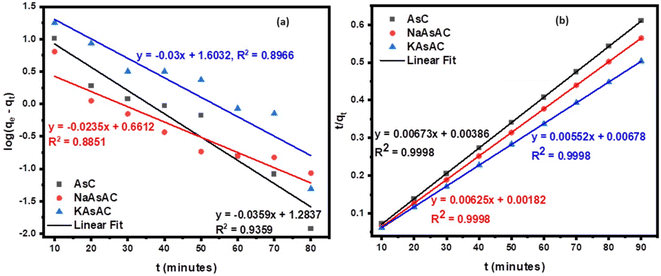
3.7.2.2 Kinetics models. The investigation into factors influencing adsorption rate involved a study on sorption kinetics. The study employed PFO and PSO equations to determine the kinetic model that best describes the process. Table 10 represents the results, including the computed parameters for each model while Fig. 12 displays the kinetic model plots. The greater R2 values (Table 9) shows the sorption process was best described by PSO model. The model also showed a precise fit for the experimental and calculated data for the AsC, NaAsAC, and KAsAC adsorbents. Furthermore, it was observed that the calculated equilibrium capacity (qe,cal) determined from PSO equation were close to experimental equilibrium capacity (qe,exp). This observation indicates that the sorption rate is primarily influenced by the number of vacant sites on the sorbent.
| Model | Parameters | Sorbents | ||
|---|---|---|---|---|
| AsC | NaAsAC | KAsAC | ||
| PFO | q e,exp (mg g−1) | 147.40 | 159.33 | 178.70 |
| q e,cal (mg g−1) | 143.79 | 157.39 | 173.73 | |
| K 1 (L min−1) | −0.0359 | −0.0235 | −0.03 | |
| R 2 | 0.9359 | 0.8851 | 0.8966 | |
| PSO | q e,cal (mg g−1) | 148.59 | 160.00 | 181.16 |
| K 2 (g mg−1 min−1) | 0.00673 | 0.00625 | 0.00552 | |
| R 2 | 0.9998 | 0.9998 | 0.9998 | |
The possible adsorption mechanism of DP adsorption onto the prepared carbon materials is shown in Fig. 13. According to the figure, surface of the prepared ACs interacted with diazinon through several mechanisms. The nonpolar methylene group (–CH2–) facilitated weak van der Waals interactions with diazinon's nonpolar regions. Pyridine clusters, with their π-electron-rich aromatic structure, engaged in π–π stacking interactions with diazinon's π-electron system, and hydrogen bonding could occur between the nitrogen in pyridine and the hydrogen or oxygen in diazinon. The sulfone group (S![[double bond, length as m-dash]](https://www.rsc.org/images/entities/char_e001.gif) O) formed hydrogen bonds, with the oxygen acting as a hydrogen bond acceptor. Additionally, the aromatic skeletal structure of the activated carbon allowed for π–π interactions with diazinon's aromatic rings.
O) formed hydrogen bonds, with the oxygen acting as a hydrogen bond acceptor. Additionally, the aromatic skeletal structure of the activated carbon allowed for π–π interactions with diazinon's aromatic rings.
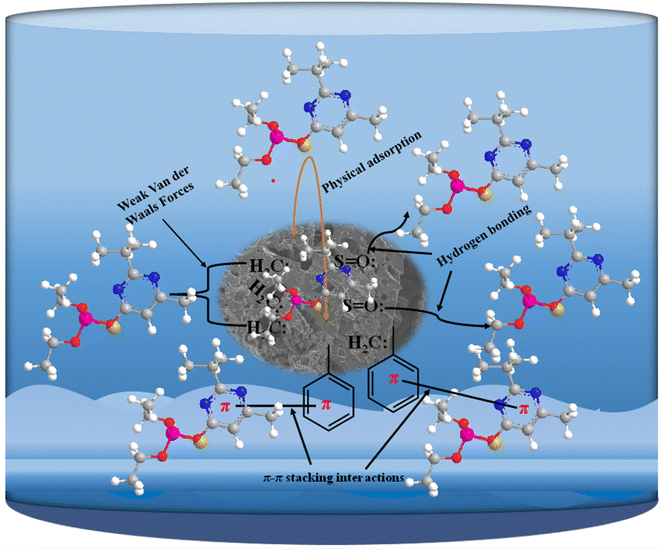 | ||
| Fig. 13 A schematic illustration of adsorption mechanism of diazinon pesticide onto the prepared AC. | ||
3.7.2.3 Comparison with the reported literature. This study aimed at evaluating the efficacy of KAsAC in adsorbing diazinon, a common pesticide, by comparing its performance with previously reported data from the literature. The study aimed to enhance understanding of the adsorption capacities of the prepared AC, offering insights into its potential applications in environmental remediation efforts. As shown in Table 10, KAsAC sorbent showed adequate sorption uptake for diazinon removal from aqueous solution. Numerous attributes such as cost-effectiveness, abundance, accessibility, and notable adsorption efficacy underscore the advantage of the asphalt based activated carbo over several sorbents for the removal of diazinon from aqueous solutions.
| Material | Initial concentration (mg L−1) | Dosage | Contact time (min) | pH | Percentage removal (%) | Adsorption capacity (mg g−1) | Ref. |
|---|---|---|---|---|---|---|---|
| a NR = not reported. | |||||||
| Treated zeolites (MZ & ATZ) | 50 | 0.3 g | 80 | 6.00 | NR | 61.73 & 15.10 | 3 |
| Coconut shell-modified biochar | 1 | 2.0 g L−1 | 120 | 7.00 | NR | 10.33 | 4 |
| Fe/Ni bimetallic nanoparticles | 1.4 | 0.75 g | 16 | 7.00 | 96% | 0.202![[thin space (1/6-em)]](https://www.rsc.org/images/entities/char_2009.gif) 045 045 |
45 |
| Pumice | 6.288 | 4 g L−1 | 30 | 3.00 | 76.3 | 20.65 | 49 |
| Microorganism (Saccharomyces cerevisiae) | 2.5 | 3.88% | 1365 | 5.50 | 96% | NR | 50 |
| NH4Cl-induced activated carbon | 20 | 0.3 g L−1 | 30 | 7.00 | 97.5% | NR | 51 |
| Zero-valent iron supported on biopolymer chitosan | 100 | 0.05 g | 20 | 4.60 | 96.95 | NR | 53 |
| Microorganism (Escherichia coli LMG 15862) | NR | 775 mg L−1 | 65 | 6.75 | 96.06% | NR | 54 |
| Photocatalyst (C-TiO2/g-C3N4 nanocomposite) | 15 | 0.1 g L−1 | 30 | 5.50 | 98.34% | NR | 55 |
| Zinc oxide nanoparticles loaded activated carbon | 5 | 0.83 | 55 | 5.00 | 100% | NR | 56 |
| Asphalt based AC (KAsAC) | 200 | 1 g L−1 | 90 | 5.6 | 234.25 | Present study | |
4 Conclusion, limitations, and future research
The cost-effective and abundantly available asphalt was utilized as a starting material for the synthesis of carbon samples (AsC, NaAsAC, and KAsAC) for the adsorption of diazinon from water sources. The preparation process was optimized by Taguchi method with optimal conditions found as 600 °C activation temperature, 75 min activation time, and 1![[thin space (1/6-em)]](https://www.rsc.org/images/entities/char_2009.gif) :
:![[thin space (1/6-em)]](https://www.rsc.org/images/entities/char_2009.gif) 3 activation ratio. The synthesized carbon samples were characterized using XRD, SEM, BET, FTIR, and Raman. The prepared AC samples were predominantly amorphous, porous, with improved surface area after activation, and –CH2–, S
3 activation ratio. The synthesized carbon samples were characterized using XRD, SEM, BET, FTIR, and Raman. The prepared AC samples were predominantly amorphous, porous, with improved surface area after activation, and –CH2–, S![[double bond, length as m-dash]](https://www.rsc.org/images/entities/char_e001.gif) O functional groups. The prepared carbon samples were employed in the removal of diazinon pesticide with removal capacities of 147.40, 159.33, and 178.70 mg g−1 for AsC, NaAsAC, and KAsAC, respectively. The sample with high adsorption uptake (KAsAC) was used in a systematic statistical approach, to optimize the impact of independent variables including pH, DP initial concentration, and KAsAC sorbent dosage using CCD. A quadratic model formulated using ANOVA in RSM predicted diazinon sorption capacity under varying process conditions, with model validation indicating a robust fit with an R2 value of 0.9909 and a significantly low p-value (<0.001). An Adsorption capacity of 234.25 mg g−1 was achieved at initial diazinon concentration = 200 mg L−1, pH = 5.6, KAsAC dosage = 1 g L−1, and adsorption time = 90 min. Exploring kinetic models showed that adsorption of diazinon was well described by PSO model. Overall, the findings underscored the favorable, spontaneous, and endothermic nature of the diazinon adsorption process by KAsAC, positioning it as a potentially effective sorbent for the removal of pesticide from aqueous solutions.
O functional groups. The prepared carbon samples were employed in the removal of diazinon pesticide with removal capacities of 147.40, 159.33, and 178.70 mg g−1 for AsC, NaAsAC, and KAsAC, respectively. The sample with high adsorption uptake (KAsAC) was used in a systematic statistical approach, to optimize the impact of independent variables including pH, DP initial concentration, and KAsAC sorbent dosage using CCD. A quadratic model formulated using ANOVA in RSM predicted diazinon sorption capacity under varying process conditions, with model validation indicating a robust fit with an R2 value of 0.9909 and a significantly low p-value (<0.001). An Adsorption capacity of 234.25 mg g−1 was achieved at initial diazinon concentration = 200 mg L−1, pH = 5.6, KAsAC dosage = 1 g L−1, and adsorption time = 90 min. Exploring kinetic models showed that adsorption of diazinon was well described by PSO model. Overall, the findings underscored the favorable, spontaneous, and endothermic nature of the diazinon adsorption process by KAsAC, positioning it as a potentially effective sorbent for the removal of pesticide from aqueous solutions.
While this study successfully demonstrated the conversion of waste asphalt into an AC material for the efficient removal of DP, there were some limitations encountered. These include the scalability of the production process, the variability in asphalt composition due to factors such as road type, traffic load, climate conditions, and maintenance history may lead to inconsistent quality and performance of the activated carbon. Therefore, future research could explore the economic viability of the process such as cost of asphalt recovery, purification, activation, and product testing. Additionally, multiple applications for various contaminants and the long-term stability and reusability of the AC should be established for large-scale implementation. Addressing these aspects will further enhance the applicability and effectiveness of the developed technology.
Author contributions
Robert O. Gembo: conceptualization, methodology, data collection, data analysis, data curation, writing – original draft; Sebusi Odisitse: project supervision and writing – review & editing; Titus A. M. Msagati: writing – review & editing; Cecil K. King'ondu: conceptualization, project supervision, funding acquisition, resources, and writing – review & editing.Conflicts of interest
The authors affirm that they do not have any discernible competing financial interests or personal relationships that might have potentially impacted the integrity of the research presented in this manuscript.Acknowledgements
The authors acknowledge Botswana International University of Science and Technology (BIUST) for the funding under grant S00415.References
- G. De Feo and S. De Gisi, Domestic separation and collection of municipal solid waste: opinion and awareness of citizens and workers, Sustainability, 2010, 2(5), 1297–1326 CrossRef
.
- G. E. Halkos and P. S. C. Aslanidis, New circular economy perspectives on measuring sustainable waste management productivity, Econ. Anal. Policy, 2023, 77, 764–779 CrossRef
.
- H. Esfandian, A. Samadi-Maybodi, M. Parvini and B. Khoshandam, Development of a novel method for the removal of diazinon pesticide from aqueous solution and modeling by artificial neural networks (ANN), J. Ind. Eng. Chem., 2016, 35, 295–308 CrossRef CAS
.
- N. A. Baharum, H. M. Nasir, M. Y. Ishak, N. M. Isa, M. A. Hassan and A. Z. Aris, Highly efficient removal of diazinon pesticide from aqueous solutions by using coconut shell-modified biochar, Arab. J. Chem., 2020, 13, 6106–6121 CrossRef CAS
.
- B. Zieliński, P. Miądlicki and J. Przepiórski, Development of activated carbon for removal of pesticides from water: case study, Sci. Rep., 2022, 12, 1–14 CrossRef PubMed
.
- P. Kabwadza-Corner, N. Matsue, E. Johan and T. Henmi, Mechanism of diazinon adsorption on iron modified montmorillonite, Am. J. Anal. Chem., 2014, 05, 70–76 CrossRef CAS
.
- Z. Akbarlou, V. Alipour, M. Heidari and K. Dindarloo, Adsorption of diazinon from aqueous solutions onto an activated carbon sample produced in Iran, Environ. Heal Eng. Manag., 2017, 4, 93–99 CrossRef CAS
.
- S. E. Ban, E. J. Lee, J. Yoon, D. J. Lim, I. S. Kim and J. W. Lee, Role of cellulose and lignin on biochar characteristics and removal of diazinon from biochar with a controlled chemical composition, Ind. Crops Prod., 2023, 200, 116913 CrossRef CAS
.
- X. Wu, J. Li, Z. Zhou, Z. Lin, S. Pang and P. Bhatt,
et al., Environmental occurrence, toxicity concerns, and degradation of diazinon using a microbial system, Front. Microbiol., 2021, 12, 1–18 CAS
.
- N. Sohrabi, R. Mohammadi, H. R. Ghassemzadeh and S. S. S. Heris, Equilibrium, kinetic and thermodynamic study of diazinon adsorption from water by clay/GO/Fe3O4: modeling and optimization based on response surface methodology and artificial neural network, J. Mol. Liq., 2021, 328, 115384 CrossRef CAS
.
- H. Esfandian, M. Parvinia, B. Khoshandam and A. Samadi-Maybodi, Removal of diazinon from aqueous solutions in batch systems using Cu-modified sodalite Zeolite: an application of response surface methodology, Int. J. Eng., Trans. B, 2015, 28, 1552–1563 Search PubMed
.
- A. S. Jalilov, G. Ruan, C. C. Hwang, D. E. Schipper, J. J. Tour and Y. Li,
et al., Asphalt-derived high surface area activated porous carbons for carbon dioxide capture, ACS Appl. Mater. Interfaces, 2015, 7, 1376–1382 CrossRef CAS PubMed
.
- M. Azhar Uddin, Y. Shinozaki, N. Furusawa, T. Yamada, Y. Yamaji and E. Sasaoka, Preparation of activated carbon from asphalt and heavy oil fly ash and coal fly ash by pyrolysis, J. Anal. Appl. Pyrolysis, 2007, 78, 337–342 CrossRef CAS
.
- K. L. Gawrys and P. K. Kilpatrick, Asphaltenic aggregates are polydisperse oblate cylinders, J. Colloid Interface Sci., 2005, 288, 325–334 CrossRef CAS PubMed
.
- P. M. Spiecker, K. L. Gawrys and P. K. Kilpatrick, Aggregation and solubility behavior of asphaltenes and their subfractions, J. Colloid Interface Sci., 2003, 267, 178–193 CrossRef CAS PubMed
.
- R. O. Gembo, S. Odisitse and C. K. King’ondu, Transforming waste resources into efficient activated carbon for energy storage and environmental remediation: a comprehensive review, Int. J. Environ. Sci. Technol., 2024, 21, 6167–6206 CrossRef CAS
.
- H. T. S. A. S. Toohi, M. A. Rabeea, J. A. Abdullah and R. F. Muslim, Synthesis and characterization activated carbon using a mix (asphalt-polypropylene waste) for novel azo dye (HNDA) adsorption, Carbon Lett., 2021, 31, 837–849 CrossRef
.
- M. A. Rabeea, R. F. Muslim and A. A. Younis, Preparation activated carbon from biji refinery
asphalt treated with sulfur and waste polymers, Int. J. Appl. Eng. Res., 2017, 12, 14783–14788 Search PubMed
.
- Q. Wang, E. O. Fagbohun, H. Zhu, A. Hussain, F. Wang and Y. Cui, One-step synthesis of magnetic asphalt-based activated carbon with high specific surface area and adsorption performance for methylene blue, Sep. Purif. Technol., 2023, 321, 124205 CrossRef CAS
.
- B. Tsyntsarski, S. Marinov, T. Budinova, M. F. Yardim and N. Petrov, Synthesis and characterization of activated carbon from natural asphaltites, Fuel Process. Technol., 2013, 116, 346–349 CrossRef CAS
.
- M. Tafazzoli, Incorporating sustainable practices in asphalt industry, IntechOpen, 2016, 11, 1–19 Search PubMed
.
- A. M. Mohammed and I. A. Saleh, A review of environmental emissions from asphalt plants and paving, Mater. Sci. Eng. Int. J., 2023, 7, 59–66 Search PubMed
.
- M. A. Rabeea, T. A. Zaidan, A. H. Ayfan and A. A. Younis, High porosity activated carbon synthesis using asphaltene particles, Carbon Lett., 2020, 30, 199–205 CrossRef
.
- P. Mikhailenko, P. Ataeian and H. Baaj, Extraction and recovery of asphalt binder: a literature review, Int. J. Pavement Res. Technol., 2020, 13, 20–31 CrossRef
.
- F. J. Pontes, G. F. Amorim, P. P. Balestrassi, A. P. Paiva and J. R. Ferreira, Design of experiments and focused grid search for neural network parameter optimization, Neurocomputing, 2016, 186, 22–34 CrossRef
.
- N. Khanna and J. P. Davim, Design-of-experiments application in machining titanium alloys for aerospace structural components, Meas. J. Int. Meas. Confed., 2015, 61, 280–290 CrossRef
.
- A. M. M. Vargas, C. A. Garcia, E. M. Reis, E. Lenzi, W. F. Costa and V. C. Almeida, NaOH-activated carbon from flamboyant (Delonix regia) pods: optimization of preparation conditions using central composite rotatable design, Chem. Eng. J., 2010, 162, 43–50 CrossRef CAS
.
- M. Loredo-Cancino, E. Soto-Regalado, F. J. Cerino-Córdova, R. B. García-Reyes, A. M. García-León and M. T. Garza-González, Determining optimal conditions to produce activated carbon from barley husks using single or dual optimization, J. Environ. Manage., 2013, 125, 117–125 CrossRef CAS PubMed
.
- A. Duchosal, R. Serra, R. Leroy and H. Hamdi, Numerical optimization of the minimum quantity lubrication parameters by inner canalizations and cutting conditions for milling finishing process with taguchi method, J. Clean. Prod., 2015, 108, 65–71 CrossRef CAS
.
- U. Moralı, H. Demiral and S. Şensöz, Optimization of activated carbon production from sunflower seed extracted meal: taguchi design of experiment approach and analysis of variance, J. Clean. Prod., 2018, 189, 602–611 CrossRef
.
-
E. D. Kirby, A Parameter Design Study in a Turning by Review: Literature and Arts of the Americas, 2006, pp. 1–14 Search PubMed
.
- A. Kundu, B. Sen Gupta, M. A. Hashim and G. Redzwan, Taguchi optimization approach for production of activated carbon from phosphoric acid impregnated palm kernel shell by microwave heating, J. Clean. Prod., 2015, 105, 420–427 CrossRef CAS
.
- S. S. A. Syed-Hassan and M. S. M. Zaini, Optimization of the preparation of activated carbon from palm kernel shell for methane adsorption using Taguchi orthogonal array design, Korean J. Chem. Eng., 2016, 33, 2502–2512 CrossRef CAS
.
- T. F. Yen, J. Gordon Erdman and S. S. Pollack, Investigation of the structure of petroleum asphaltenes by X-ray diffraction, Anal. Chem., 1961, 33, 1587–1594 CrossRef CAS
.
- M. N. Siddiqui, M. F. Ali and J. Shirokoff, Use of X-ray diffraction in assessing the aging pattern of asphalt fractions, Fuel, 2002, 81, 51–58 CrossRef CAS
.
- K. B. Dermenci, K. Daems, Y. Güner, S. Turan, J. Van Mierlo and M. Berecibar, Electrochemical parameterization of commercial activated carbons as anodes for high-power Li-ion batteries, J. Mater. Sci. Mater. Electron., 2022, 33, 13064–13074 CrossRef CAS
.
-
P. Sinha and S. Banerjee, Handbook of Nanocomposite Supercapacitor Materials I, ed. K. K. Kar, 2020. pp. 125–154 Search PubMed
.
- D. Pan, S. Wang, B. Zhao, M. Wu, H. Zhang and Y. Wang,
et al., Li storage properties of disordered graphene nanosheets, Chem. Mater., 2009, 21, 3136–3142 CrossRef CAS
.
- Z. Han, S. Kong, J. Cheng, H. Sui, X. Li and Z. Zhang,
et al., preparation of efficient carbon-based adsorption material using asphaltenes from asphalt rocks, Ind. Eng. Chem. Res., 2019, 58, 14785–14794 CrossRef CAS
.
- H. H. Joni, R. H. A. Al-Rubaee and M. A. Al-zerkani, Rejuvenation of aged asphalt binder extracted from reclaimed asphalt pavement using waste vegetable and engine oils, Case Stud. Constr. Mater., 2019, 11, e00279 Search PubMed
.
- O. V. Gorbunova, O. N. Baklanova, T. I. Gulyaeva, A. B. Arbuzov, M. V. Trenikhin and A. V. Lavrenov, Effect of thermal pretreatment on porous structure of asphalt-based carbon, J. Mater. Sci., 2022, 57, 7239–7249 CrossRef CAS
.
- W. Liang, Y. Zhang, X. Wang, Y. Wu, X. Zhou and J. Xiao,
et al., Asphalt-derived high surface area activated porous carbons for the effective adsorption separation of ethane and ethylene, Chem. Eng. Sci., 2017, 162, 192–202 CrossRef CAS
.
- Q. Wang, E. O. Fagbohun, H. Zhu, A. Hussain, F. Wang and Y. Cui, One-step synthesis of magnetic asphalt-based activated carbon with high specific surface area and adsorption performance for methylene blue, Sep. Purif. Technol., 2023, 321, 124205 CrossRef CAS
.
- M. A. Al-Ghouti and D. A. Da’ana, Guidelines for the use and interpretation of adsorption isotherm models: a review, J. Hazard. Mater., 2020, 393, 122383 CrossRef CAS PubMed
.
- N. Mansouriieh, M. R. Sohrabi and M. Khosravi, Adsorption kinetics and thermodynamics of organophosphorus profenofos pesticide onto Fe/Ni bimetallic nanoparticles, Int. J. Environ. Sci. Technol., 2016, 13, 1393–1404 CrossRef CAS
.
- Z. Mahmoodi, A. R. Abhari, R. S. Lalehloo, Z. H. Bakr and G. A. M. Ali, Thermodynamic studies on the adsorption of organophosphate pesticides (diazinon) onto ZnO/polyethersulfone nanocomposites, ChemistrySelect, 2022, 7, 1–10 CrossRef
.
- H. Bassareh, M. Karamzadeh and S. Movahedirad, Synthesis and characterization of cost-effective and high-efficiency biochar for the adsorption of Pb2+ from wastewater, Sci. Rep., 2023, 13, 1–15 CrossRef PubMed
.
- J. Tan, X. Zhang, X. Wei and L. Wang, Removal of malachite green from aqueous solution using waste newspaper fiber, BioResources, 2012, 7, 4307–4320 Search PubMed
.
- M. H. Dehghani, A. H. Hassani, R. R. Karri, B. Younesi, M. Shayeghi and M. Salari,
et al., Process optimization and enhancement of pesticide adsorption by porous adsorbents by regression analysis and parametric modelling, Sci. Rep., 2021, 11, 11719 CrossRef CAS PubMed
.
- M. H. Ehrampoush, A. Sadeghi, M. T. Ghaneian and Z. Bonyadi, Optimization of diazinon biodegradation from aqueous solutions by Saccharomyces cerevisiae using response surface methodology, AMB Express, 2017, 7, 68 CrossRef PubMed
.
- G. Moussavi, H. Hosseini and A. Alahabadi, The investigation of diazinon pesticide removal from contaminated water by adsorption onto NH4Cl-induced activated carbon, Chem. Eng. J., 2013, 214, 172–179 CrossRef CAS
.
- M. A. Amani, A. M. Latifi, K. Tahvildari and R. Karimian, Removal of diazinon pesticide from aqueous solutions using MCM-41 type materials: isotherms, kinetics and thermodynamics, Int. J. Environ. Sci. Technol., 2018, 15, 1301–1312 CrossRef CAS
.
- S. Farhadi, M. R. Sohrabi, F. Motiee and M. Davallo, Organophosphorus diazinon pesticide removing from aqueous solution by zero-valent iron supported on biopolymer chitosan: RSM optimization methodology, J. Polym. Environ., 2021, 29, 103–120 CrossRef CAS
.
- A. Toolabi, M. Malakootian, M. T. Ghaneian, A. Esrafili, M. H. Ehrampoush and M. AskarShahi,
et al., Modeling photocatalytic degradation of diazinon from aqueous solutions and effluent toxicity risk assessment using Escherichia coli LMG 15862, AMB Express, 2018, 8, 59 CrossRef PubMed
.
- S. Amiri and M. Anbia, Enhanced degradation of diazinon in aqueous solution using C-TiO2/g-C3N4 nanocomposite under visible light: synthesis, characterization, kinetics, and mechanism studies, Mater. Res. Bull., 2023, 165, 112289 CrossRef CAS
.
- P. Pourali, Y. Rashtbari, A. Behzad, A. Ahmadfazeli, Y. Poureshgh and A. Dargahi, Loading of zinc oxide nanoparticles from green synthesis on the low cost and eco-friendly activated carbon and its application for diazinon removal: isotherm, kinetics and retrieval study, Appl. Water Sci., 2023, 13, 101 CrossRef CAS
.
Footnote |
| † Electronic supplementary information (ESI) available. See DOI: https://doi.org/10.1039/d4su00196f |
| This journal is © The Royal Society of Chemistry 2024 |

