
 Open Access Article
 This Open Access Article is licensed under a
 Creative Commons Attribution 3.0 Unported Licence
Pathways for vanillin production through alkaline aerobic oxidation of a phenolic lignin model compound, guaiacylglycerol-β-guaiacyl ether, in concentrated aqueous alkali†
Ayami
Ishikawa
 ,
Takashi
Hosoya
* and
Hisashi
Miyafuji
,
Takashi
Hosoya
* and
Hisashi
Miyafuji
Graduate School of Life and Environmental Sciences, Kyoto Prefectural University, Japan, 1- 5 Shimogamo-hangi-cho, Sakyo-ku, Kyoto 606-8522, Japan. E-mail: hosoya_t@kpu.ac.jp
First published on 26th April 2024
Abstract
Vanillin (4-hydroxy-3-methoxybenzaldehyde) is a crucial compound that can be produced through alkaline aerobic oxidation of softwood lignin. Our research group has been investigating an effective method for vanillin production from native lignin via alkaline aerobic oxidation of softwood in a highly concentrated alkaline medium (4.0 mol L−1 NaOH aq.). This study reports on the analysis of vanillin production pathways from the phenolic β-O-4 structure, a major structural motif in lignin. The study focuses on the behavior of vanillin production from erythro-guaiacyl glycerol-β-guaiacyl ether (GG) under the previously proposed alkaline aerobic oxidation conditions (4.0 mol L−1 NaOH aq./120 °C/O2) for producing vanillin from native softwood lignin. Our experimental results confirm the existence of a pathway consistent with previous studies related to pulp bleaching. This involves the enol ether ((E/Z)-2-methoxy-4-[2-(2-methoxyphenoxy)ethenyl]phenol, EE) formed through the non-oxidative alkaline decomposition of GG. However, a detailed comparison of vanillin yields from GG and isolated EE suggests the presence of an undisclosed vanillin production pathway that does not involve EE as an intermediate. The existence of this unknown pathway is further supported by the significant difference in the deuterium incorporation rate (RD/H) into the α-position of vanillin during alkaline aerobic oxidation in NaOD/D2O, which markedly differs between GG (1.04) and EE (0.25) as starting materials.
Sustainability spotlightFrom the viewpoint of recent environmental requirements, it is crucial to utilize lignin as a raw material for low-molecular-weight aromatic compounds replacing petroleum. Vanillin is one of the key substances in the chemical industry that can be produced from lignin, but there are various challenges in vanillin production from lignin. This study provides mechanistic insights into vanillin production from lignin, which are essential for addressing these challenges. Our work contributes to achieving a carbon-neutral society, and emphasizes the importance of the following UN sustainable development goals: climate action (SDG 13). |
Introduction
Vanillin is one of the platform chemicals in industry that can be produced from lignin, a major component of wood, particularly softwood lignin.1,2 It is one of the crucial compounds used not only as a commercial fragrance, but also as a raw material for polymers and pharmaceuticals due to its two reactive functional groups (aldehyde and phenolic hydroxy groups).1–4 Industrial production of vanillin from lignin has been established through the alkaline aerobic oxidation of lignosulfonate, derived from the waste liquid of the sulfite pulping process.5–7 In this method, vanillin is obtained by oxidizing lignosulfonate at temperatures ranging from 170 to 200 °C under pressurized air in the presence of Cu2+ as a catalyst. Until the 1980s, this method was a predominant approach for vanillin production worldwide.1–3,8 However, the yield obtained by this method is generally below 10%, and the cost of separating and purifying vanillin from by-products is significant. Additionally, due to environmental concerns related to the strong alkali and sulfur-containing components in the waste liquid, along with a decrease in the supply of lignosulfonate as a raw material, this method has been largely replaced by the vanillin production from petroleum-derived guaiacol.1,3To address the challenges associated with vanillin production from lignin, considerable efforts have been directed towards improving reaction processes9–11 and exploring catalysts capable of achieving higher yields.12–16 However, the molecular mechanisms underlying the alkaline aerobic oxidation of lignin, particularly the specific generation mechanism of vanillin from lignin substructures, remain insufficiently understood. Although a deeper mechanistic understanding of lignin's oxidative decomposition may not immediately enhance the vanillin production process, it is essential for facilitating rational and consistent process development.
Our research group is conducting analyses on the reaction behaviors of various lignin model compounds under alkaline aerobic oxidation conditions to elucidate the vanillin generation pathway from native lignin in softwood.17–19Scheme 1A illustrates the proposed formation of vanillin from β-O-4 linkages in the middle units of native lignin polymers, where β-O-4 (β-ether) constitutes approximately 50% of the interunit linkages in native lignin.17 The analysis of oxidative degradation behaviors of non-phenolic β-O-4 type model compounds, representing β-O-4-type intermediate residues in lignin, indicate that vanillin production initiates with the alkaline hydrolysis of the β-ether bond, forming a glycerol end group. This group undergoes further oxidative degradation, converting into a vanillin end group. A vanillin molecule is then released through the alkaline hydrolysis of the β-ether bond adjacent to this precursor structure. Furthermore, the conversion from the glycerol end group to the vanillin end group is a multistep process. It involves the oxidation of the α-hydroxy group into a carbonyl group, translocation of the Cα-carbonyl group to the γ-position, and side-chain fragmentation via a retro-aldol reaction.19 The retro-aldol reaction starting from the thermodynamically more stable α-carbonyl moiety also occurs. However, the activation barrier for this reaction is larger than that from the γ-carbonyl moiety, rendering the retro-aldol reaction from the α-carbonyl structure kinetically unfavorable.
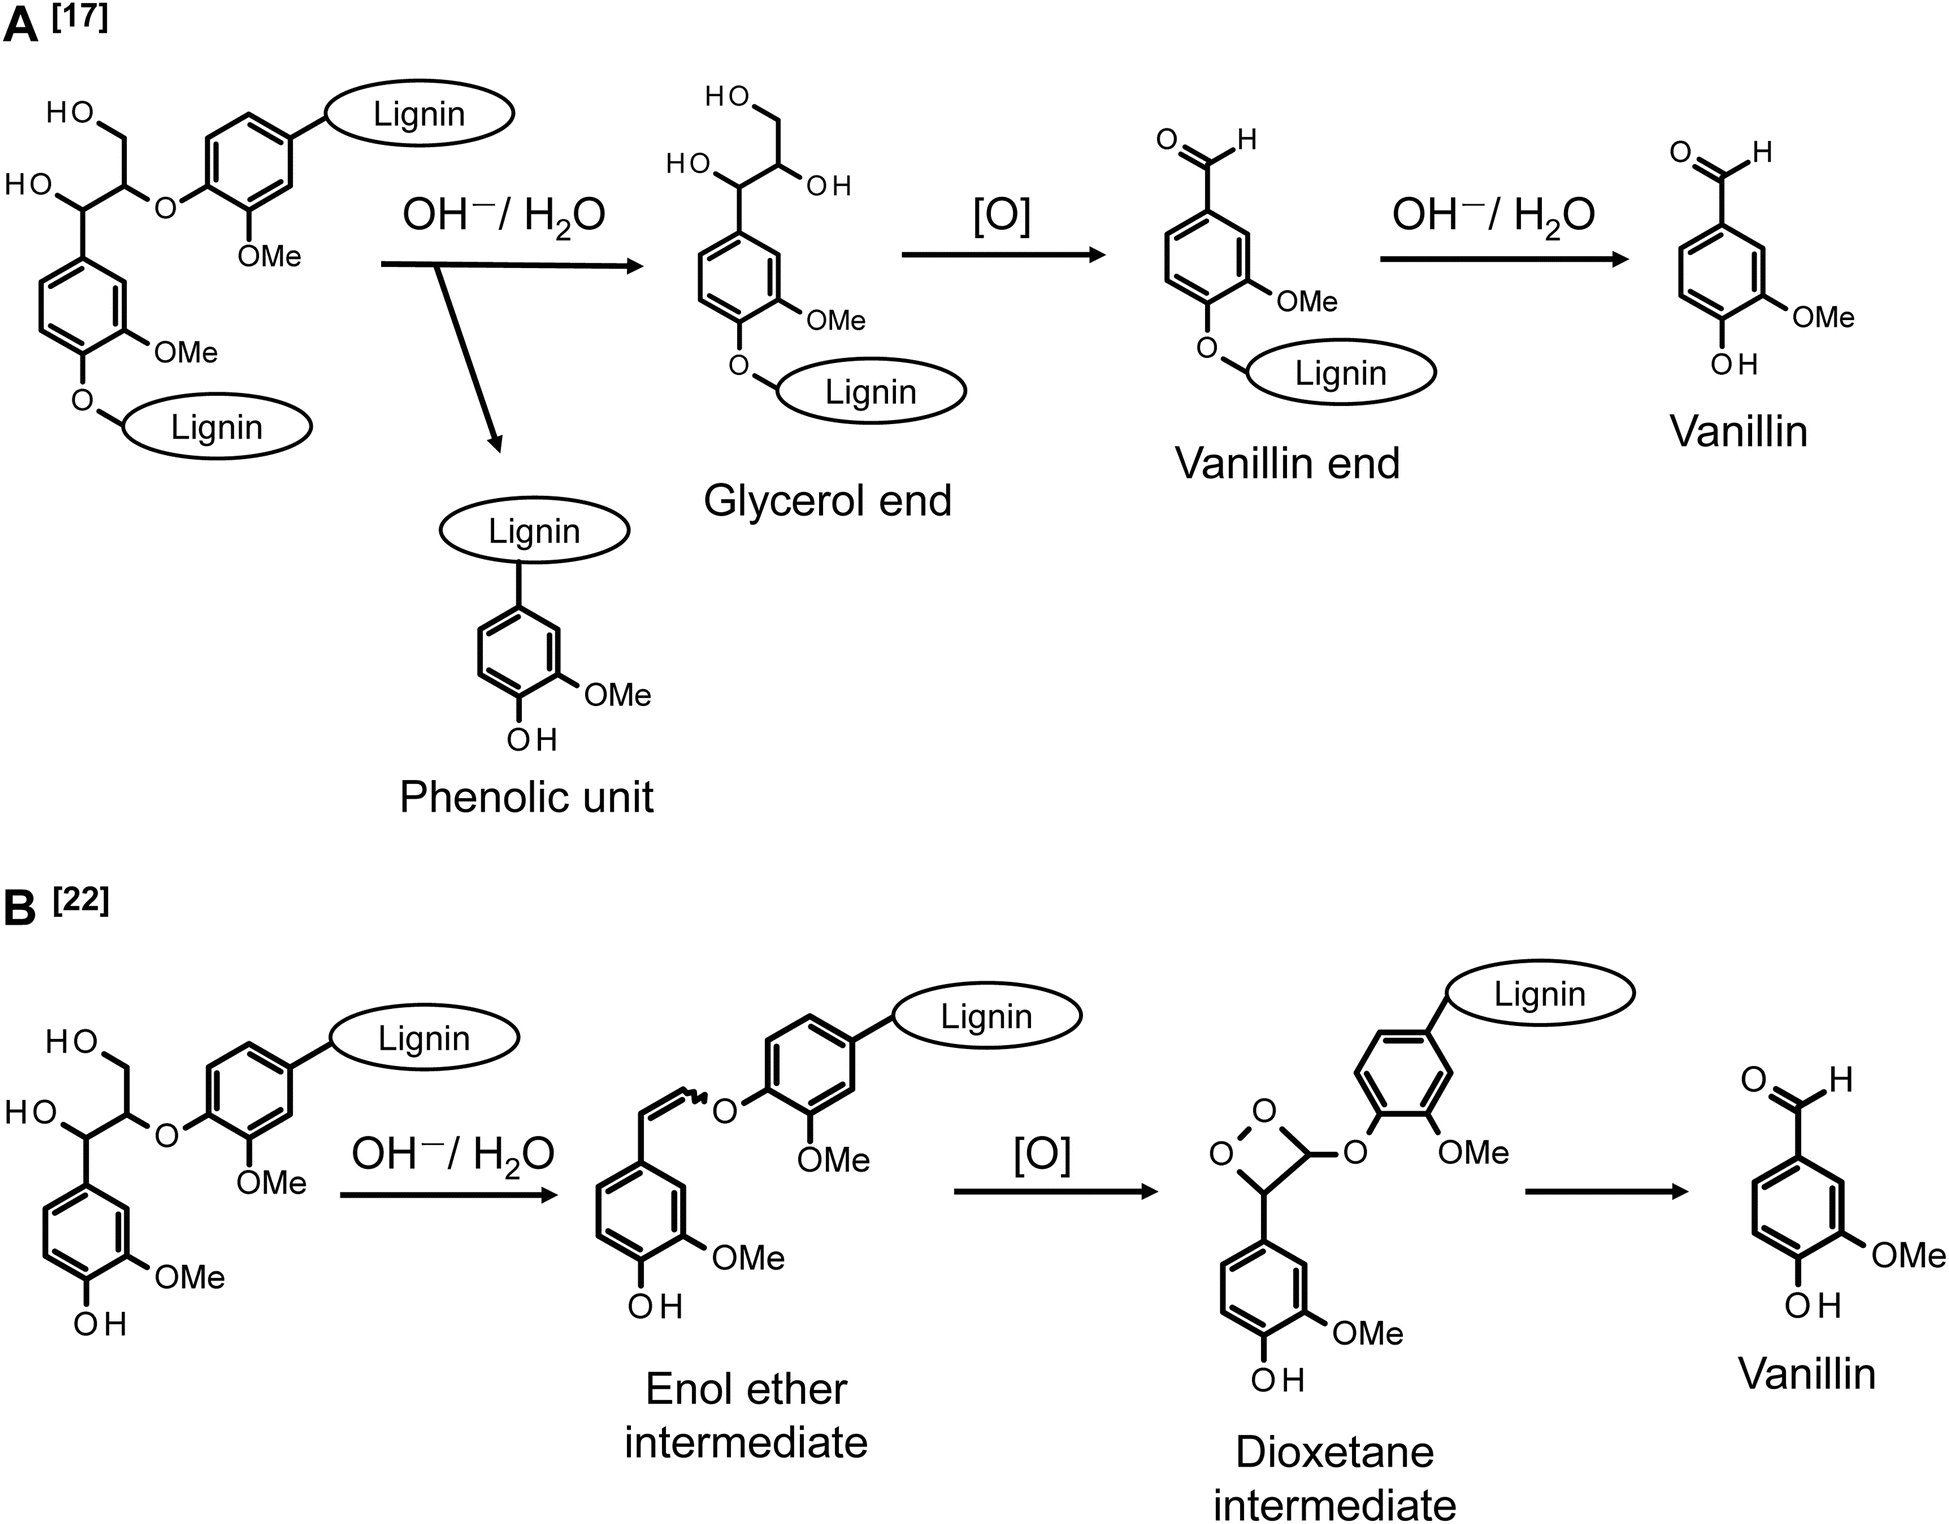 | ||
| Scheme 1 Vanillin production pathways in alkaline aerobic oxidation of a middle β-O-4 unit (A)17 and a phenolic β-O-4 unit (B)22 of lignin. The description [O] indicates that the corresponding process involves oxidation reactions. | ||
In addition to the mechanistic studies mentioned earlier, our ongoing research is focused on developing an efficient method for producing vanillin from natural lignin in softwood. Previous studies have demonstrated that under high-concentration alkaline conditions ([OH−] ≈ 4.0 mol L−1), vanillin can be produced with a high yield of up to 23.2 wt% (based on Klason lignin) by oxidizing lignin in the presence of bulky organic cations like Bu4N+ and complex cations including Na+.17,18 These reaction conditions were primarily established through the exploration of optimal conditions for vanillin production from softwood lignin.20,21 This method offers several advantages over traditional processes, including operation at lower temperatures (100–120 °C), no requirement for pressurized air, the absence of sulfur in the raw materials, and the elimination of transition metal catalysts. The increased yield of vanillin in the presence of organic cations is hypothesized to result from the suppression of bimolecular reactions, such as the disproportionation reactions that occur in the vanillin end group in Scheme 1A.19
Phenolic units, present in limited quantities in lignin and emerging through the cleavage of β-O-4 linkages in the intermediate units, generally exhibit higher reactivity in oxidation reactions with various oxidants compared to non-phenolic units. The pathway for vanillin production from the alkaline aerobic oxidation of these phenolic units is proposed in Scheme 1B, drawing on the mechanistic insights gleaned from various reactions in pulp bleaching.22–24 The initial step in this reaction involves forming an enol ether intermediate through non-oxidative alkaline degradation, a process extensively studied in the context of delignification reactions in pulping. This step proceeds from the γ-position of quinone methide intermediates derived from phenolic units, with the release of formaldehyde molecules.25–29 While enol ether structures are relatively stable under non-oxidative conditions, they are believed to convert to dioxetane intermediates in the presence of O2 in the reaction system. It is suggested that vanillin production involves the cleavage of the Cα–Cβ bond, initiated by the homolysis of the O–O bond in this intermediate.22,23 This vanillin production pathway presents advantages, primarily due to its foundation on the facile formation of enol ether structures during the alkaline-induced degradation of β-O-4 linkages in lignin. Additionally, the hypothesis proposing that the electron-deficient O2 molecule attacks the electron-rich C![[double bond, length as m-dash]](https://www.rsc.org/images/entities/char_e001.gif) C bond appears logically coherent. However, this mechanism necessitates further validation, given that the dioxetane intermediate has yet to be experimentally identified, and there exists a notable absence of phenomenological evidence. Moreover, an alternative vanillin production mechanism, predicated on the occurrence of retro-aldol reactions within phenolic units, has been suggested.30,31 Nevertheless, in the alkaline aerobic oxidation of lignin for vanillin production, vanillin is expected to form not only from the middle units as shown in Scheme 1A but also from the phenolic structures as indicated in Scheme 1B. However, the specific contributions of these pathways to the overall vanillin production reaction remain unclear.
C bond appears logically coherent. However, this mechanism necessitates further validation, given that the dioxetane intermediate has yet to be experimentally identified, and there exists a notable absence of phenomenological evidence. Moreover, an alternative vanillin production mechanism, predicated on the occurrence of retro-aldol reactions within phenolic units, has been suggested.30,31 Nevertheless, in the alkaline aerobic oxidation of lignin for vanillin production, vanillin is expected to form not only from the middle units as shown in Scheme 1A but also from the phenolic structures as indicated in Scheme 1B. However, the specific contributions of these pathways to the overall vanillin production reaction remain unclear.
The pathway for vanillin production from the enol ether intermediate, as depicted in Scheme 1B, is proposed based on various studies related to O2 pulp bleaching. These studies predominantly focus on the decomposition of chromophores in unbleached pulp, emphasizing the oxidative breakdown of aromatic rings. In this context, the production of vanillin is considered a minor reaction.22,23,32 However, from the perspective of vanillin production, the reaction outlined in Scheme 1B represents one of the most significant pathways. Thus, while both pulp bleaching and vanillin production are fundamentally based on alkaline aerobic oxidation reactions, their objectives and focuses differ markedly. It is therefore essential to investigate these reaction pathways specifically for vanillin production. Typical O2 pulp bleaching involves a process conducted at approximately 90–100 °C, with an OH− concentration of about 1.5% on pulp (pH = 10–12), under pressurized air conditions (0.5–0.6 MPa), and in the presence of metal ions such as Fe2+, Mn2+, and Cu2+.33–35 In contrast, our proposed conditions for alkaline aerobic oxidation in vanillin production employ a more concentrated alkaline solution (around 4.0 mol L−1) and a slightly higher temperature (around 120 °C). While the presence of a vanillin production pathway via the enol ether in Scheme 1B under these conditions is suggested, further investigation is required to explore potential side reactions and alternative pathways for vanillin production that do not involve the enol ether.
In consideration of the aspects discussed earlier, this study delves into the oxidative degradation of a β-O-4 type phenolic lignin model compound (erythro-1-(4-hydroxy-3-methoxyphenyl)-2-(2-methoxyphenoxy)-1,3-propanediol, erythro-guaiacyl glycerol-β-guaiacyl ether, GG) and an enol ether structure (E/Z-2-methoxy-4-[2-(2-methoxyphenoxy)ethenyl]phenol, EE), which is proposed as an intermediate in vanillin production from GG. This investigation is conducted under vanillin production conditions that we have proposed (4.0 mol L−1 NaOH aq./120 °C/O2). The study meticulously examines the oxidation behavior of the starting model compounds and the formation of the products, providing a detailed analysis of the results. In the initial part of this paper, we report that under our specified vanillin production conditions, vanillin is produced through a pathway from GG to EE. Additionally, we establish that the total vanillin production cannot be fully accounted for by the reactions involving only EE. In the latter part of the article, we present conclusive evidence based on the results from the oxidative decomposition experiments of GG in a NaOD solution. This evidence supports the existence of alternative pathways for vanillin production that do not involve the EE intermediate.
Experimental
Materials
All commercial chemicals other than 1-(4-hydroxy-3-methoxyphenyl)ethanone and NaBH4 from Tokyo Chemical Industry Co were purchased from FUJIFILM Wako Pure Chemical Co. NaOD/D2O solutions were prepared from sodium deuteroxide (D, 99.5%) 40 wt% in D2O and deuterium oxide, 99.8%, both of which were purchased from the same company. During the synthesis of the model compounds, reactions were monitored by TLC on silica gel with co-solvents of n-hexane and ethyl acetate being used as the eluent and a 10 wt% phosphomolybdic acid/ethanol solution and UV254 nm being employed to quench the spots. CHROMATOREX PSQ100B silica gel (Fuji silica chemical, Ltd) was used for column chromatography with the amount of the silica gel being set to be approximately 50 g per 1 g of the crude mixture.GG was synthesized based on the method proposed by Nakatsubo et al.36 For detailed information, refer to our previous research.371H NMR (400 MHz, CDCl3) δ (ppm) = 7.08–6.80 (m, 7H), 5.61 (s, 1H), 4.96 (dd, J = 4.8, 3.9 Hz, 1H), 4.16–4.12 (m, 1H), 3.94–3.86 (m, 7H), 3.68–3.61 (m, 1H), 3.49 (d, J = 3.5 Hz, 1H), 2.71 (dd, J = 7.5, 5.5 Hz, 1H). The synthesized GG (5 mg) was stirred in a solution of acetic anhydride/pyridine (0.1 mL, 1/1, v/v), and the solvent was concentrated to dryness in vacuo to afford GG acetate. 1H NMR (400 MHz, CDCl3) δ (ppm) = 7.06–6.81 (m, 7H), 6,07 (d, J = 5.5 Hz, 1H), 4.67–4.63 (m, 1H), 4.45 (dd, J = 6.4, 5.5 Hz, 1H), 4.24 (dd, J = 8.2, 3.6 Hz, 1H), 3.80 (s, 3H), 3.76 (s, 3H), 2.29 (s, 3H), 2.08 (s, 3H), 2.02 (s, 3H). Comparison of the 1H NMR spectra of GG acetate with the literature38 revealed that GG was synthesized as the erythro-isomer.
EE was synthesized by reacting guaiacyl ethanediol-β-guaiacyl ether (EG), that was synthesized based on the method reported by Galkin et al. (see the ESI† for detailed synthetic procedure).39 Using the same reaction apparatus as described below, EG (50 mg) was reacted in 2.0 mol L−1 NaOH aq. (2.0 mL) at 170 °C for 60 min under N2. The reaction mixture was then adjusted to pH 5–6 by adding acetic acid, and the solution was extracted with ethyl acetate. The organic layer was washed twice with brine, dried over anhydrous Na2SO4, and concentrated to dryness in vacuo. The product was purified on a silica gel column with ethyl acetate/n-hexane (1/2, v/v) to afford EE (9.98 mg). EE was a cis/trans isomeric compound, and the molar ratio of the cis/trans isomers was determined to be 1![[thin space (1/6-em)]](https://www.rsc.org/images/entities/char_2009.gif) :1.28 based on the integration values of the protons at cis β-position (δ = 6.52 ppm, J = 6.8 Hz) and trans α-position (δ = 6.28 ppm, J = 12.3 Hz) in the 1H NMR analysis.271H NMR (400 MHz, CDCl3) δ (ppm) = 7.60 (d, J = 1.8 Hz, 1H), 7.10–6.76 (m, 16H, the integral value is large due to the signal of contaminants), 6.52 (d, J = 6.8 Hz, 1H), 6.28 (d, J = 12.3 Hz, 1H), 5.61 (s, 1H), 5.55 (s, 1H), 5.54 (d, J = 6.8 Hz, 1H), 3.90 (s, 3H), 3.89 (s, 3H), 3.88 (s, 6H).
:1.28 based on the integration values of the protons at cis β-position (δ = 6.52 ppm, J = 6.8 Hz) and trans α-position (δ = 6.28 ppm, J = 12.3 Hz) in the 1H NMR analysis.271H NMR (400 MHz, CDCl3) δ (ppm) = 7.60 (d, J = 1.8 Hz, 1H), 7.10–6.76 (m, 16H, the integral value is large due to the signal of contaminants), 6.52 (d, J = 6.8 Hz, 1H), 6.28 (d, J = 12.3 Hz, 1H), 5.61 (s, 1H), 5.55 (s, 1H), 5.54 (d, J = 6.8 Hz, 1H), 3.90 (s, 3H), 3.89 (s, 3H), 3.88 (s, 6H).
Alkaline aerobic oxidation and product analysis
Alkaline aerobic oxidation was conducted using a dual-structured reaction apparatus, depicted in Fig. 1, comprising a perfluoroalkoxy (PFA) test tube with an inner diameter of 10.0 mm and a capacity of 5 mL, alongside a glass autoclave featuring an inner diameter of 20.0 mm and a capacity of 15 mL. An acetonitrile solution, with precisely adjusted concentrations of either GG or EE, was introduced into the PFA test tube to attain a sample mass of 3.0 mg (GG: 9.37 μmol, EE: 11.02 μmol). Following the removal of acetonitrile under vacuum conditions, 1.0 mL of either 4.0 mol L−1 NaOH aqueous solution or 4.0 mol L−1 NaOD/D2O solution was added. O2 was then infused into the test tube, which was immediately sealed with a silicone stopper, and subsequently positioned within a glass autoclave containing 2.0 mL of water. After introducing O2 into the autoclave's interior, it was quickly sealed. The entire reaction setup was then placed in a preheated oil bath at 120 °C and agitated at 500 rpm using a HE-20 G stirrer, produced by Koike Precision Instruments, with a polytetrafluoroethylene (PTFE) HP oval-shaped rotor (maximum diameter × total length: 5 × 10 mm). The model compounds were fully soluble in the reaction media, allowing the reaction to proceed in a homogeneous phase. Note that comparisons between the rapid O2 introduction method presented above and a more comprehensive O2 substitution approach employing a glove box revealed analogous results (see Table S1 in the ESI†). The quantity of O2 introduced into the vapor phase of the PFA test tube in this experiment was approximately 0.16 mmol, considering O2 as an ideal gas.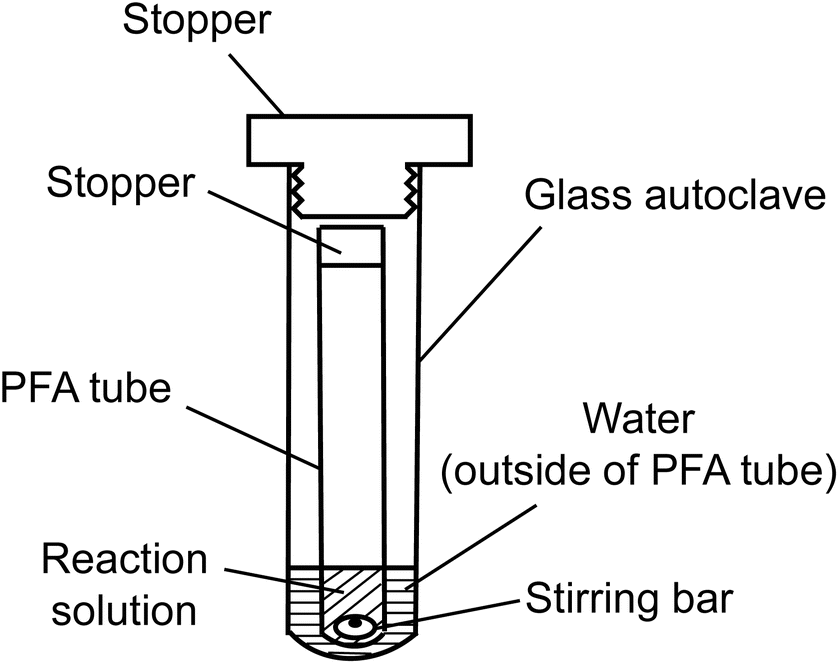 | ||
| Fig. 1 Reaction system employed for alkaline aerobic oxidation. | ||
Following the reaction for a duration ranging from 20 to 240 min, the glass autoclave was permitted to cool down. The reaction system was subsequently opened once it had returned to ambient temperature. Thereafter, an ethanol solution (1 mL) containing an accurately weighed internal standard (1,5-dihydroxy-1,2,3,4-tetrahydronaphthalene, hereafter referred to as “IS”, approximately 2 mg) was introduced to the reaction mixture. A sample of the resultant solution (20 μL) was diluted and neutralized with 980 μL of a 0.082 mol L−1 trifluoroacetic acid (TFA) solution in water/acetonitrile (1/9, v/v). This dilution, after syringe filtration through a 0.45 μm filter, was employed as the sample for high-performance liquid chromatography (HPLC) analysis.
The HPLC analysis was performed using a Shimadzu HPLC system equipped with an LC-20AD pump and a CTO-20AC column oven under the specified conditions: a Cadenza CD-C18 column (Imtakt Co., Kyoto, Japan) was utilized with the column temperature maintained at 30 °C. The elution gradient was composed of a 0.1% TFA aq./acetonitrile solution, adjusted to the following proportions over time: 90/10 at 0 min, transitioning to 45/55 at 30 min, then to 0/100 from 35 to 40 min, reverting to 45/55 at 45 min, and finally returning to 90/10 at 50 min. Detection was carried out using a photo diode array detector (SPD-M40) set at 280 nm with a flow rate of 0.8 mL min−1. Product identification was achieved by comparing the retention times of the peaks observed at UV280 nm with those of authentic compounds. Quantification was based on the ratio of the peak areas of the product and the internal standard within the HPLC sample, alongside a calibration curve derived from separate HPLC analyses of the authentic compound and the IS.
In the HPLC chromatogram of the reaction mixture derived from experiments employing NaOD/D2O, it was observed that the peak corresponding to vanillin near a retention time of approximately 14 min bifurcated into two distinct peaks (see Fig. S1 in the ESI†). This phenomenon is ascribed to the differentiation between vanillin molecules that have undergone deuterium incorporation at the aldehyde group and those that have not, hence resulting in the separation of deuterated vanillin from its non-deuterated counterpart. Within the context of this study, it is conjectured that both deuterated and non-deuterated forms of vanillin yield congruent calibration curves. Accordingly, the quantification of vanillin was predicated on the summation of the peak areas corresponding to these two distinct peaks.
The calibration curve for EE in the HPLC analysis was constructed using the following method. Initially, EE (2.0 mg), following purification via silica gel column chromatography, was solubilized in CDCl3 (1.0 mL) containing p-hydroxybenzaldehyde (1.6 mg). This solution was then subjected to 1H NMR analysis. The integration values for the aldehyde proton of p-hydroxybenzaldehyde (δ = 9.85 ppm) and for the protons located at the cis-β-position (δ = 6.52 ppm, J = 6.8 Hz) and the trans-α-position (δ = 6.28 ppm, J = 12.3 Hz) were meticulously compared to ascertain the quantities of the cis and trans configurations of EE, respectively. Following this, an ethanol solution (1.0 mL) containing a precisely weighed IS (approximately 2 mg) was introduced, and the HPLC analysis was conducted employing the aforementioned methodology. The calibration curve was established by correlating the quantified values of EE, derived from the 1H NMR analysis, with the ratio of the peak areas of the internal standard to EE, as determined via the HPLC analysis. The identification of the cis and trans isomers of EE in the HPLC chromatogram was facilitated by employing a previously reported method,37 which identifies the peak at approximately 34.4 min as trans-EE and the peak at approximately 35.9 min as cis-EE.
For the preparation of samples for Gas Chromatography/Mass Spectrometry (GC/MS) analysis of oxidation products, the subsequent protocol was adhered to. The reaction mixture resulting from the oxidation experiment, conducted as described previously, was adjusted to a pH of 5–6 by the addition of acetic acid. Subsequently, this mixture was subjected to extraction with ethyl acetate. The organic phase was then purified through dual washes with brine, followed by drying over anhydrous sodium sulfate, and the solvent was removed under reduced pressure to afford a dry residue. This residue was further reacted in a mixture of acetic anhydride and pyridine (0.1 mL, 1:1 v/v), and the resultant solution was employed as the sample for GC/MS analysis.
The GC/MS analysis was performed utilizing a Shimadzu GCMS-QP2010 Ultra system under specified operational conditions: the column utilized was an Agilent J&W DB-5MS with a diameter (ID) of 0.25 mm, a length of 30.0 m, and a film thickness (DF) of 0.25 μm. The injector temperature was set to 250 °C, and the column oven temperature was programmed to start at 50 °C (held for 1 min), ramp to 320 °C at a rate of 1 → 48 min, and then hold at 320 °C for an additional 10 min. Helium was used as the carrier gas at a flow rate of 2.04 mL min−1, with an emission current of 20 μA and an ionization time of 2.0 ms.
The molar ratio of deuterated to non-deuterated aldehyde groups (RD/H), resulting from the oxidation experiment in NaOD/D2O, was determined based on the mass spectra of acetylated vanillin obtained via the GC/MS analysis. The calculation was based on the following formula:
| RD/H = (A − B)/C |
Results and discussion
Aerobic oxidation pathways of GG
Fig. 2 presents the HPLC chromatogram obtained from the reaction mixture during the aerobic oxidation of GG over a period of 60 min. Within this chromatogram, in addition to the unreacted GG (retention time of 18.2 min), the oxidation products of GG were discerned as principal decomposition constituents. These included vanillin (14.0 min), arising from the A-ring of GG, guaiacol (17.4 min), emanating from the B-ring, trans-EE (34.4 min), and cis-EE (35.9 min). The ensuing discussion within this manuscript is dedicated to elucidating the formation mechanisms and reaction dynamics of these identified products. It is imperative to acknowledge that vanillic acid, another derivative from the A-ring, was also detected at a retention time of 10.8 min within the reaction mixture. However, given its markedly low yield, ranging from 0.1 to 1.1 mol% relative to GG, vanillic acid will not be further considered in the discussions of this study.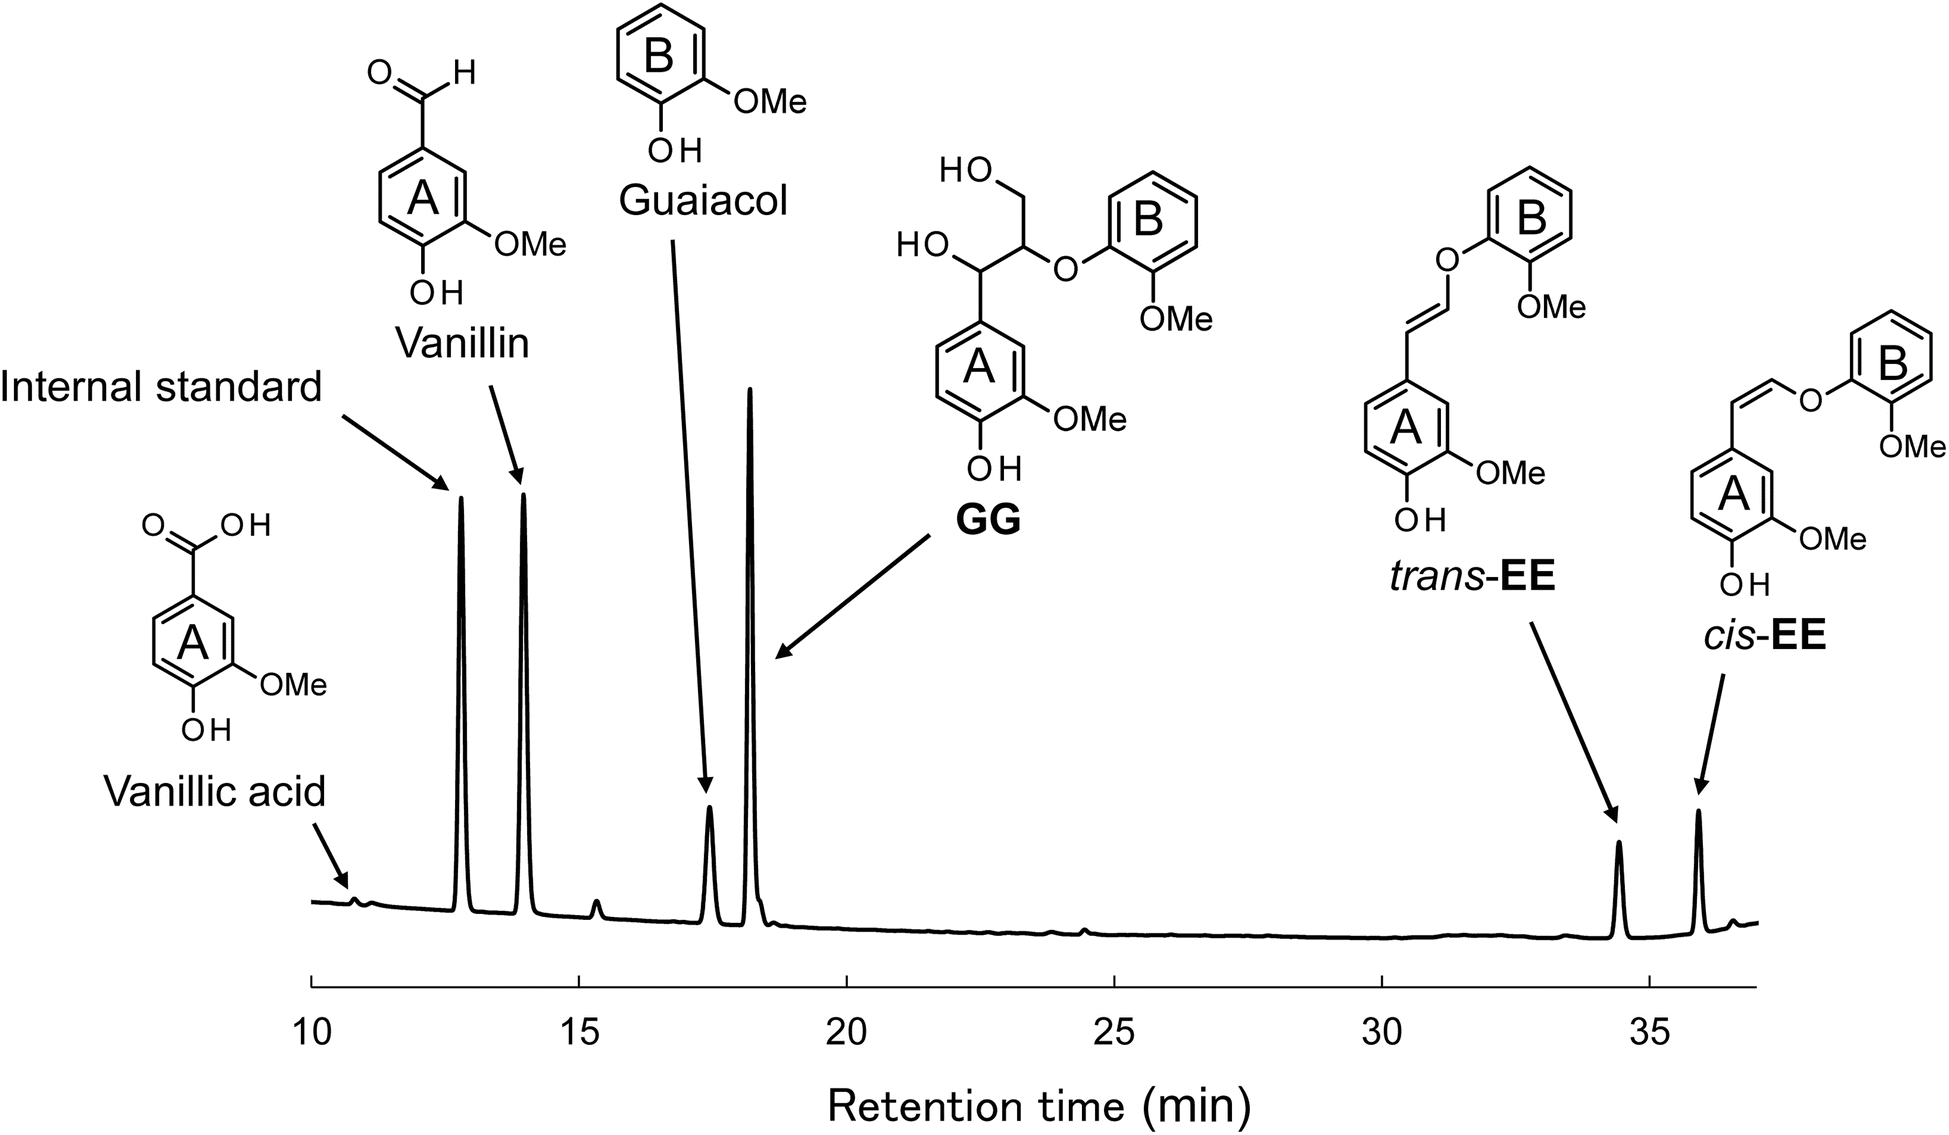 | ||
| Fig. 2 HPLC chromatogram of the reaction mixture obtained after the degradation of GG in 4.0 mol L−1 NaOH aq. at 120 °C for 60 min under O2. | ||
Fig. 3 illustrates the temporal evolution of the recovery rate (%) of the starting material and the yield (mol%) of the product, as determined from HPLC analysis of the reaction mixture. Table 1 compiles the yields of the products (mol%) and the recovery rates of starting materials (%) observed under various reaction conditions. In the oxidative decomposition of GG under O2, depicted in Fig. 3A, GG degradation was observed to increase with reaction time, culminating in a recovery rate of 6.1% at 240 min, indicative of the near-complete decomposition of GG (entry 1 in Table 1). Concomitant with this degradation process, the yields of vanillin and guaiacol escalated, achieving 38.7 mol% and 64.8 mol%, respectively, at 240 min. Furthermore, a minor quantity of EE was generated during GG decomposition, with the yield of EE peaking at 5.8 mol% at 60 min before diminishing to 2.4 mol% at 240 min. As elaborated upon in subsequent sections, EE is implicated in oxidative transformation to vanillin in the presence of O2,17,22 underscoring its potential intermediary role in the vanillin formation pathway in this experiment.
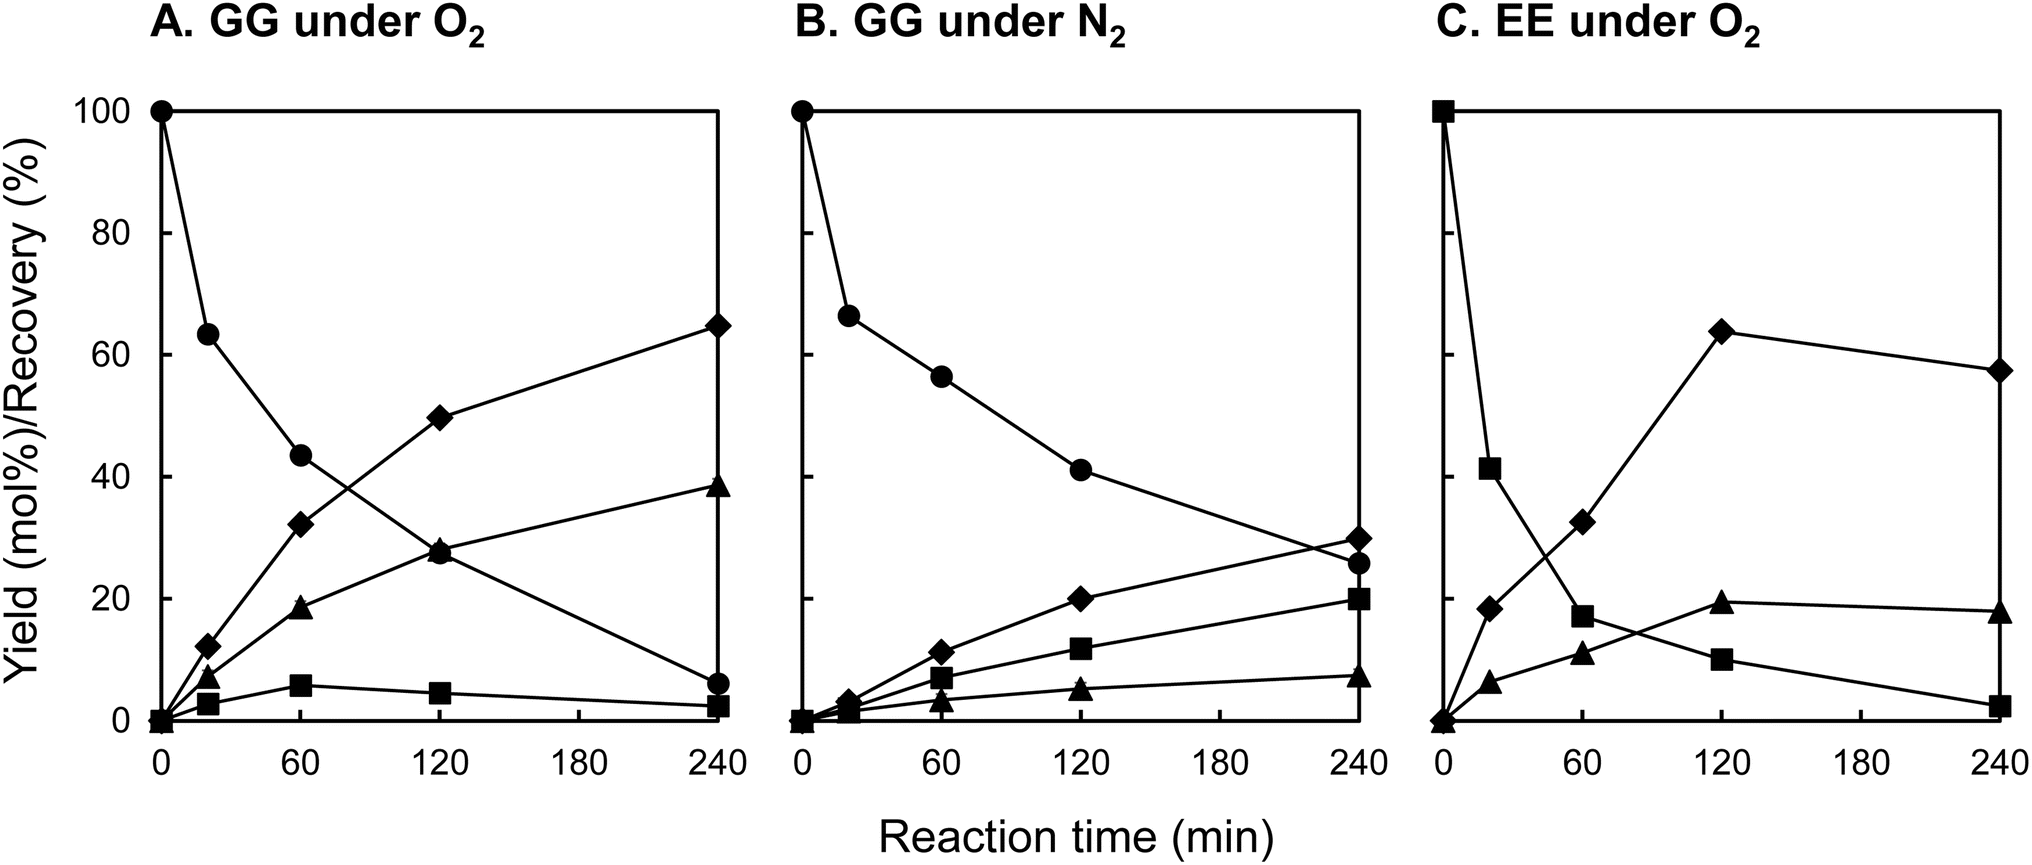 | ||
| Fig. 3 Changes with time in recovery of the staring material and the yields of vanillin (▲), guaiacol (◆), and EE (■) during the degradation of GG (A and B) and EE (C) in 4.0 mol L−1 NaOH aq. at 120 °C under O2 (A and C) and N2 (B). The EE yields are presented as the sum of the cis- and trans-isomers. | ||
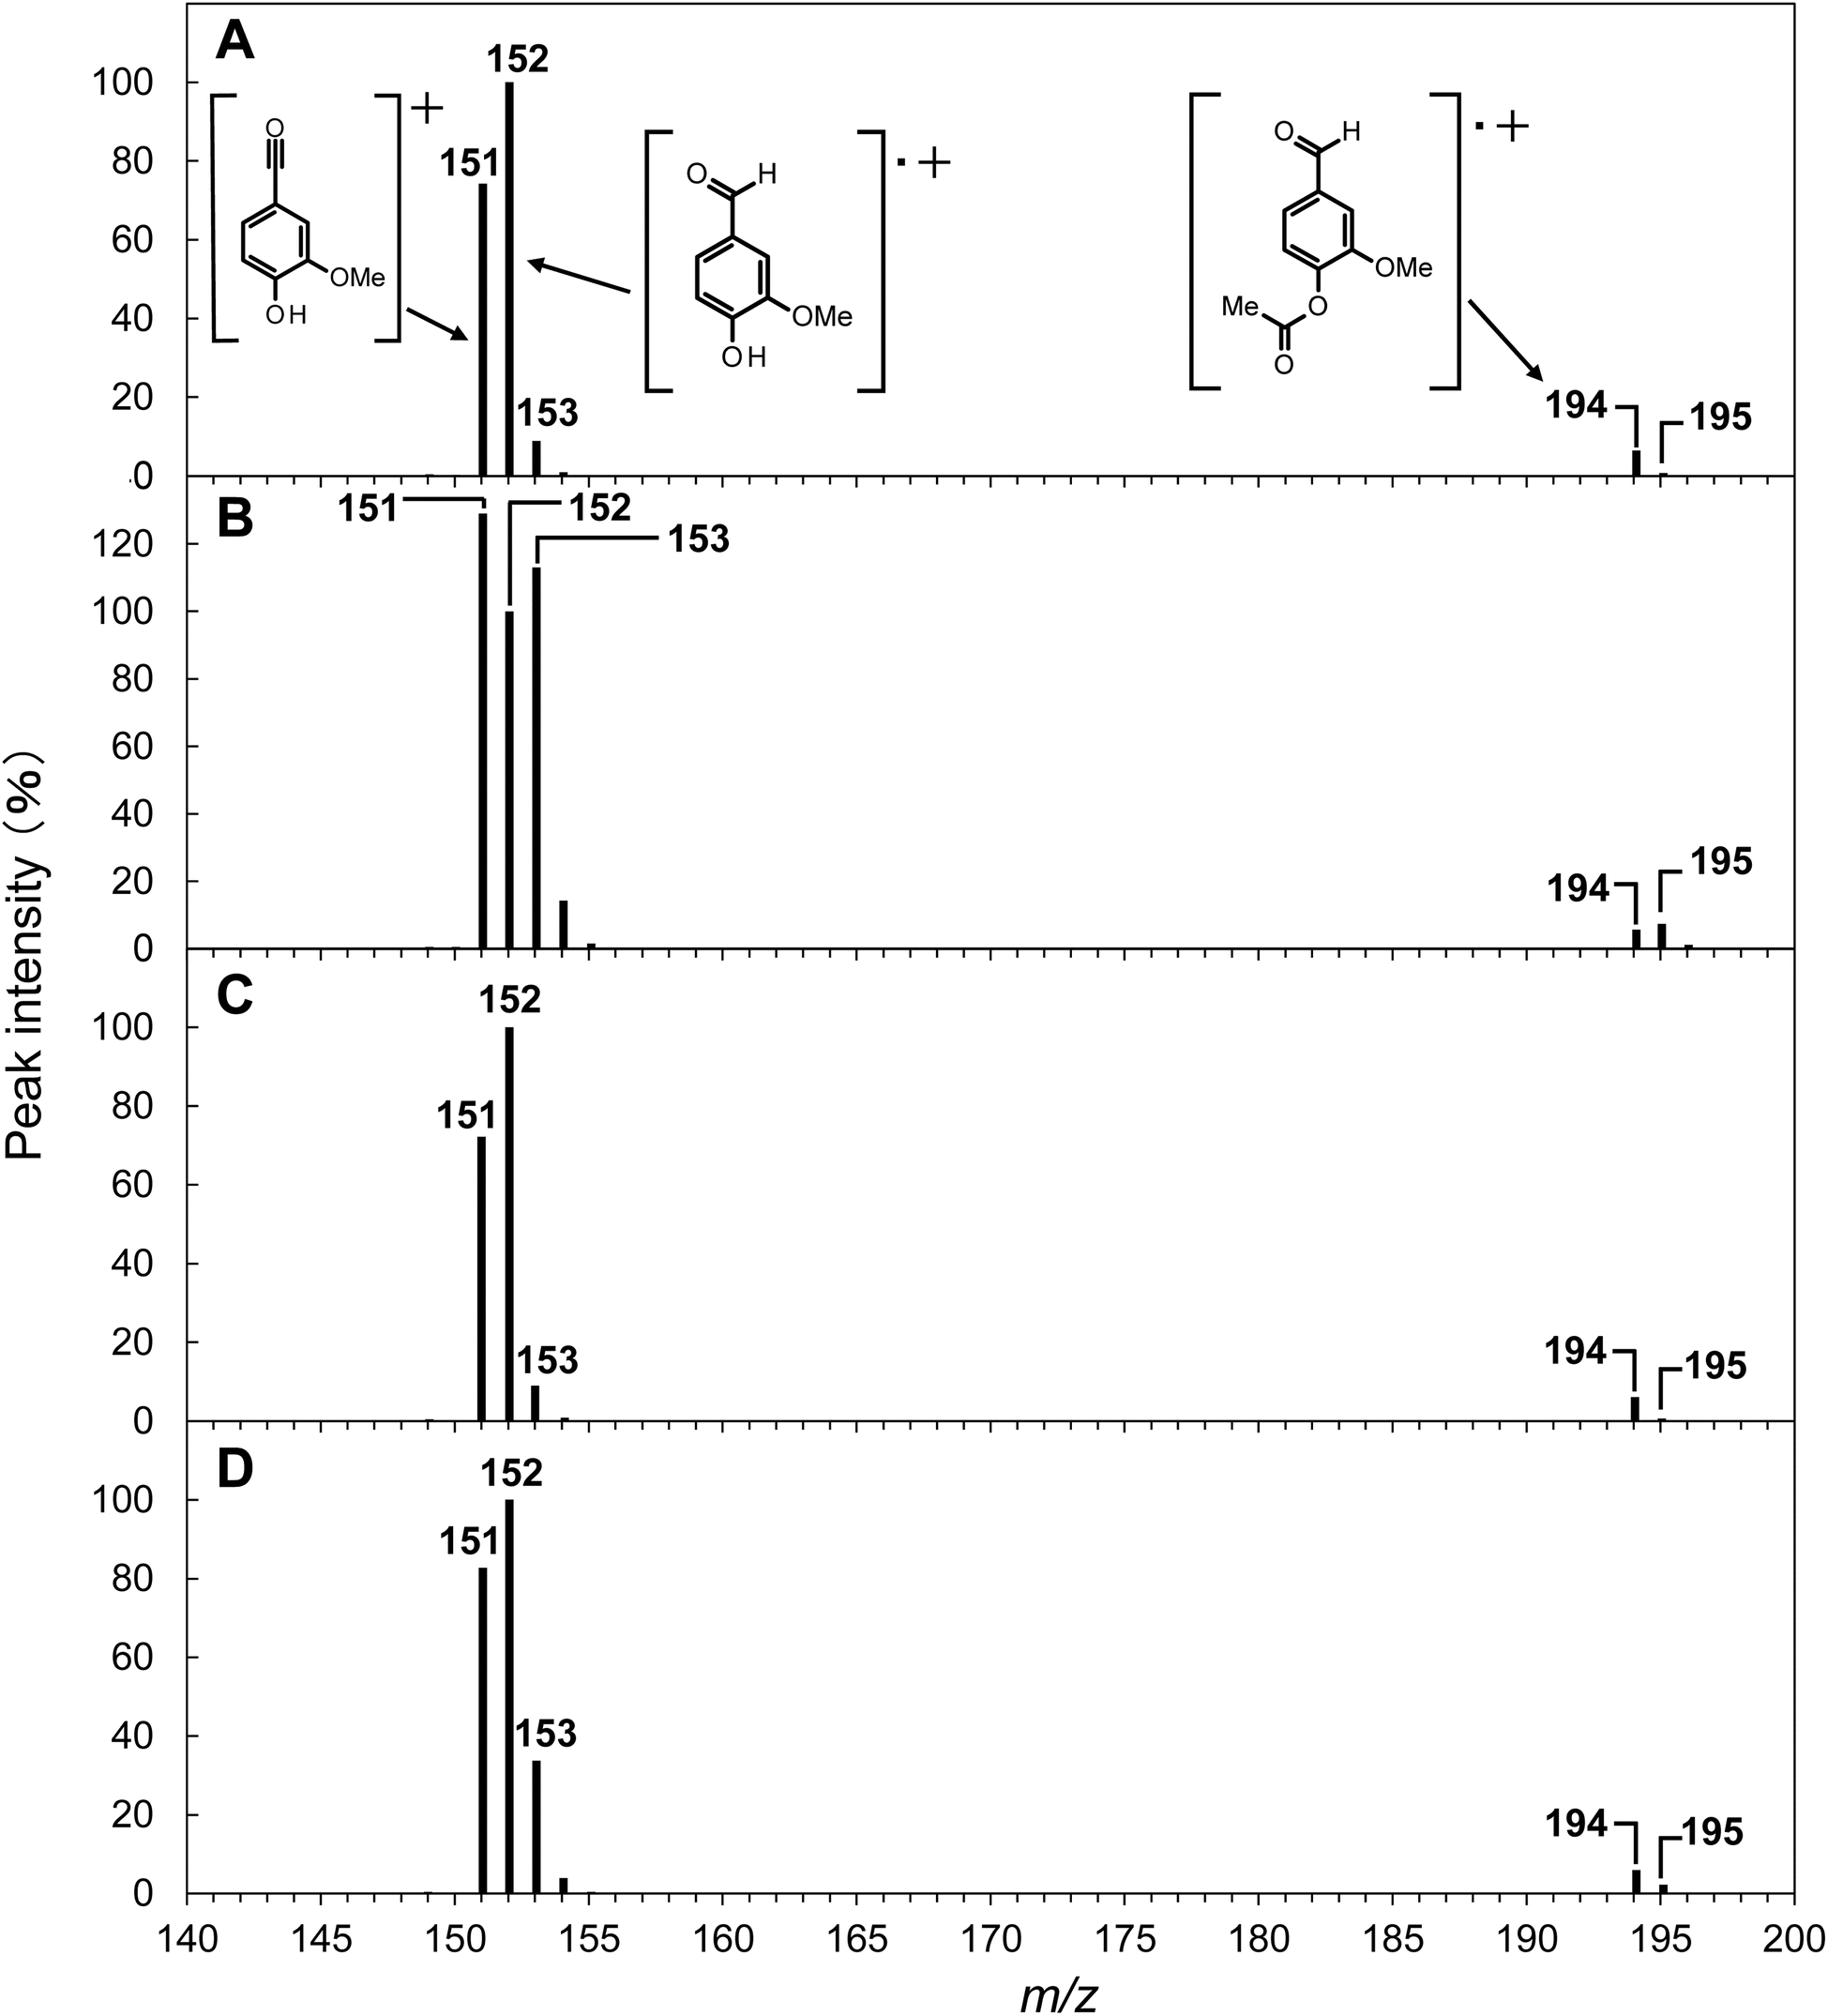 | ||
| Fig. 4 Mass spectra of acetylated vanillin detected at a retention time of 20.2 min in the GC/MS analysis of the reaction mixture obtained after the degradation of GG in NaOH (A), GG in NaOD/D2O (B), EE in NaOH (C), and EE in NaOD/D2O (D) at 120 °C for 240 min under O2. The concentrations of OH− and OD− were set to be 4.0 mol L−1. Peak intensities are shown relative to the m/z 152 ion peak, which acts as the base ion peak in most cases, except for the degradation of GG in NaOD/D2O (refer to Table 2 for the detailed peak intensity information). | ||
| Entry | Starting material | Atmo-sphere | Stirring | Mediuma | Yield (mol%) | Recovery (%) | ||
|---|---|---|---|---|---|---|---|---|
| Vanillin | Guaiacol | EE | ||||||
| a The concentrations of OH− and OD− were set to be 4.0 mol L−1. b The number in the parenthesis shows the yield on the basis of degraded starting material. | ||||||||
| 1 | GG | O2 | Yes | NaOH aq. | 38.7 | 64.8 | 2.4 (2.6)b | 6.1 |
| 2 | GG | O2 | No | NaOH aq. | 16.6 | 53.8 | 9.8 (12.4) | 20.9 |
| 3 | GG | N2 | Yes | NaOH aq. | 7.4 | 29.9 | 20.0 (27.0) | 25.8 |
| 4 | EE | O2 | Yes | NaOH aq. | 18.0 | 57.4 | — | 2.4 |
| 5 | GG | O2 | Yes | NaOD/D2O | 26.9 | 66.1 | 9.9 | 11.5 |
| 6 | EE | O2 | Yes | NaOD/D2O | 20.2 | 48.9 | — | 12.8 |
| Entry | Starting material | Medium | Peak intensityc (%) | R ID/H | R IID/H | ||||
|---|---|---|---|---|---|---|---|---|---|
| 151 | 152 | 153 | 194 | 195 | |||||
| a The concentrations of OH− and OD− were set to be 4.0 mol L−1. b The deuteration ratios (RID/H and RIID/H) were calculated using the equation provided in the experimental section. RID/H and RIID/H were determined based on the ion peaks of 152–153 and 194–195, respectively. c The peak intensity is presented relative to that of the m/z 152 ion peak. | |||||||||
| 1 | GG | NaOH aq. | 74.3 | 100 | 8.9 | 6.5 | 0.7 | — | — |
| 2 | GG | NaOD/D2O | 129.0 | 100 | 113.0 | 5.6 | 7.4 | 1.04 | 1.19 |
| 3 | EE | NaOH aq. | 72.2 | 100 | 9.0 | 6.2 | 0.7 | — | — |
| 4 | EE | NaOD/D2O | 82.7 | 100 | 33.8 | 5.9 | 2.2 | 0.25 | 0.27 |
| 5 | Vanillin | NaOD/D2O | 84.4 | 100 | 14.9 | 8.0 | 1.2 | — | — |
To ascertain the role of O2 oxidation in vanillin formation, decomposition experiments of GG under O2 were performed without stirring the reaction mixture. As indicated in entry 2 of Table 1, the yield of vanillin at 240 min was markedly reduced in the absence of stirring (vanillin yield: 16.6 mol%). This observation suggests that a significant portion of the vanillin presented in Fig. 3A resulted from oxidation reactions with O2 absorbed from the gas phase of the reaction system. Additionally, the yield of guaiacol diminished from 64.8 mol% to 53.8 mol% under non-stirring conditions, implying that the liberation of guaiacol from the B-ring occurs in tandem with the formation of vanillin.
The decomposition of GG was further investigated under N2 conditions. As illustrated in Fig. 3B, the yield of EE progressively increased with reaction time under N2, peaking at 20.0 mol% at 240 min. The yield of EE derived from the decomposition of GG base was 27.0 mol% (entry 3 in Table 1), markedly exceeding the yield under O2 conditions with stirring (2.6%, entry 1 in Table 1). The yield of EE from the decomposed GG base in the absence of stirring under O2 (12.4%, entry 2 in Table 1) was intermediate between these figures. These findings strongly imply that EE, generated via the non-oxidative alkaline decomposition of GG as outlined in Scheme 1B, is subject to oxidative conversion to vanillin in the presence of O2. EE has been documented to exhibit stability under alkaline conditions at elevated temperatures for several hours in the absence of oxidants,28,29,37 corroborating the observed resilience of EE under N2 in this experiment. The formation of vanillin under N2 conditions, albeit with a considerably reduced yield (7.4 mol% at 240 min, entry 3 in Table 1), may be attributed to the presence of quinones with oxidizing properties within the reaction environment.27 Nonetheless, the precise mechanisms underlying this formation of vanillin under inert atmosphere remain to be elucidated. Despite the significant production of guaiacol in this scenario (29.9 mol% at 240 min, entry 3 in Table 1), this could partly be rationalized by the detachment reaction of the compound during the formation of alkaline condensates.28
To elucidate the contribution of EE to the vanillin production, EE was synthesized, purified, and then subjected to alkaline aerobic oxidation. As depicted in Fig. 3C and documented in entry 4 of Table 1, EE underwent near-complete decomposition within a reaction duration of 240 min (EE recovery: 2.4%), resulting in the formation of vanillin and guaiacol with yields of 18.0 mol% and 57.4 mol%, respectively. These outcomes unequivocally demonstrate that, under the experimental conditions of this study, EE undergoes an oxidation reaction in the presence of O2 to produce vanillin, concurrently generating guaiacol. Based on these observations, we propose that a portion of the vanillin derived from GG is produced via a non-oxidative pathway from GG to EE through alkaline decomposition, as delineated in Scheme 2 (pathway A), and via the oxidative decomposition of EE in the presence of O2 (pathway B). The reaction sequence, encompassing the detectable reactants, intermediates, and final products, parallels those outlined in Scheme 1B. It is therefore inferred that the reaction mechanism proposed in Scheme 1B is applicable under the conditions for vanillin production investigated in this study.
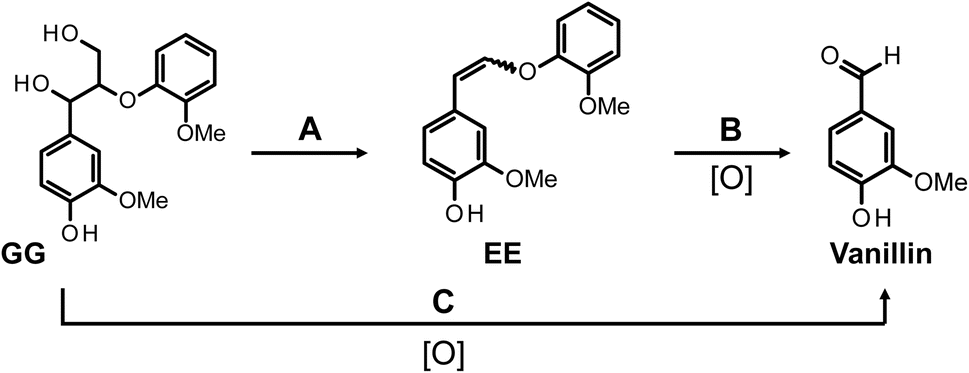 | ||
| Scheme 2 Vanillin production pathways in the alkaline aerobic oxidation of GG in this study. The description [O] below the arrow indicates that the corresponding pathway is an oxidative process. | ||
Within the framework of vanillin production from GG, a pathway incorporating EE as an intermediate (pathway A → B, Scheme 2) has been delineated. Nonetheless, there are observed phenomena that cannot be fully accounted for by this pathway alone. The yield of EE from GG under N2 conditions after a duration of 240 min was 20.0 mol% (entry 3 in Table 1), whereas the yield of vanillin resulting from the oxidative decomposition of isolated EE over the same timeframe amounted to 18.0 mol% (entry 4 in Table 1). When these outcomes are combined under the assumption that all vanillin is derived from EE, the inferred yield of vanillin from GG after 240 min is calculated to be around 3.6 mol%, by multiplying the two yields. However, the actual yield of vanillin from the oxidative decomposition of GG was 38.7 mol% (entry 1 in Table 1), markedly exceeding the calculated estimate. This discrepancy suggests the presence of an alternate pathway (pathway C) that does not involve EE. Given the significant disparity between the observed vanillin yield of 38.7 mol% and the projected yield of 3.6 mol%, it is proposed that pathway C is either more predominant or possesses competitive significance relative to pathway A in the formation of vanillin from GG.
The discussion thus far has centered on the generation of EE, vanillin, and guaiacol as products from GG. Nonetheless, the conversion to these low-molecular-weight aromatic compounds was not complete, as indicated by the yields presented in Table 1. This implies that not all reactants in the mixture were accounted for by these products alone. Drawing from research on pulp bleaching, it has been proposed that alkaline aerobic oxidation facilitates the oxidative breakdown of benzene rings.22,32,40–42 Reflecting on the findings of this study, the recovery rate of GG following decomposition under N2 (in the absence of O2) for 240 min was 25.8% (entry 3 in Table 1), a figure significantly higher than the recovery rate observed under O2 conditions (6.1%, entry 1 in Table 1). This observation suggests that GG decomposes more swiftly in the presence of O2. Such a phenomenon can be logically attributed to a direct oxidative degradation route for GG, mediated by O2 and resultant reactive oxygen species, potentially leading to the formation of intermediates like muconic acids via oxidation of the benzene ring in GG. The occurrence of additional reactions beyond those leading to vanillin formation is deemed a contributing factor to the incomplete yields of the aromatic compounds. While a thorough examination of the aforementioned side reactions may offer a holistic understanding of alkali-mediated aerobic oxidation, this study, with its focus on vanillin production, will not delve further into these aspects.
Aerobic oxidation of GG and EE in NaOD/D2O
To our knowledge, pathway C in Scheme 2 has not been extensively investigated as a pathway for the generation of vanillin during the oxidative degradation of lignin. Specifically, in terms of generating vanillin from phenolic β-O-4 structures under alkaline aerobic oxidation conditions without a catalyst, as in this study, only pathways involving the enol ether intermediates, as shown in Schemes 1 and 2, have been suggested with experimental evidence. Thus, further exploration of the existence of pathway C would be of significant interest. This section aims to reinforce the evidence for vanillin production via pathway C by contrasting the oxidative behaviors of GG and EE in NaOD/D2O with those in NaOH aq.To initially assess the differential performance of these solvents as reaction media, we compared the alkaline aerobic oxidation of GG in NaOD/D2O to that in NaOH aq. According to entry 5 in Table 1, the recovery yield of GG in NaOD/D2O was 11.5%, marginally higher than in NaOH aq. (6.1%, entry 1 in Table 1). Moreover, the yield of vanillin in NaOD/D2O was lower compared to NaOH aq. (NaOH aq.: 38.7 mol%, NaOD/D2O: 26.9 mol%), whereas the yield of the intermediate EE was greater in NaOD/D2O (NaOH aq.: 2.4 mol%, NaOD/D2O: 9.9 mol%). Subsequent experiments were performed using isolated EE. Here too, despite the change in reaction medium to NaOD/D2O not significantly affecting the vanillin yield, there was an observed increase in the EE recovery yield and a reduction in the expected guaiacol yield from the oxidative decomposition of EE (entries 4 and 6 in Table 1).
The aforementioned results suggest that O2 is less effective as an oxidant in NaOD/D2O. A plausible explanation for this observation is the limited availability of O2 from the gas phase in NaOD/D2O experiments, likely due to the higher viscosity of the NaOD/D2O solution compared to NaOH aq. Notably, in experiments utilizing NaOD/D2O, magnetic stirrers occasionally ceased functioning due to this increased viscosity. As previously mentioned, the yields of vanillin and guaiacol were reduced (vanillin yield: 16.6 mol%, guaiacol yield: 53.8 mol%), and the yield of EE was elevated (9.8 mol%) when GG was oxidized by O2 without stirring, compared to the yields achieved with stirring (entry 2 in Table 1). This similarity in the effects of stirring on the yield of oxidation products in NaOD/D2O (entries 5 and 6 in Table 1) lends support to the viscosity-related hypothesis. Subsequently, we examined the decomposition behaviors of GG and EE in NaOD/D2O and NaOH aq., with an emphasis on the characteristics of the resulting vanillin. Nonetheless, it remains critical to account for the differences in oxygen supply efficiency between the two systems throughout these comparative analyses.
The reaction mixtures resulting from alkaline aerobic oxidation in NaOH aq. and NaOD/D2O were acetylated and then analyzed using GC/MS. In the total ion chromatogram (TIC) of the GC/MS analysis, the peak for acetyl vanillin was observed at a retention time of 20.2 min, distinctly separated from other components (as shown in Fig. S2 in the ESI†). The mass spectrum, covering the m/z range of 140–200 for acetyl vanillin produced during the oxidative decomposition of GG in NaOH aq., is depicted in Fig. 4A (with the complete spectrum available in Fig. S3 in the ESI†), and the relative intensities of significant peaks in relation to the base peak at m/z 152 are summarized in Table 2. As is common for many O-acetylated compounds, the mass spectrum of acetyl vanillin displayed a notably small molecular ion peak at m/z 194 (relative intensity: 6.5%). The peak for the molecular ion of vanillin, representing the molecule following the detachment of a ketene unit from acetyl vanillin, served as the base peak at m/z 152 (refer to Fig. 4A and entry 1 in Table 2). Additionally, a prominent peak at m/z 43 (60.6%), corresponding to the acetyl cation, was noted (as detailed in Fig. S3 in the ESI†). Characteristic of aldehyde functionalities, a peak at m/z 151, indicative of a species where a hydrogen atom has been removed from the aldehyde group of vanillin, was identified with substantial intensity (74.3%) immediately following the base peak. A minor peak at m/z 153 (8.9%), one mass unit greater than the vanillin molecular ion, was also detected, signifying the isotopic peak with one 13C atom incorporated into the vanillin structure. In parallel, a marginal presence of this 13C isotopic peak at m/z 195 was observed in the molecular ion of acetyl vanillin (0.7%).
Conversely, when GG was subjected to decomposition in NaOD/D2O, a notable increase in the relative intensity of m/z 153 was observed, as depicted in Fig. 4B. Specifically, as detailed in entry 2 of Table 2, the relative intensity of m/z 153 compared to the peak at m/z 152 reached 113.0%, a figure significantly elevated relative to the decomposition in NaOH aq. Furthermore, a peak at m/z 195 exhibited a higher intensity (7.4%), surpassing that of the m/z 194 peak (5.6%). These findings robustly indicate the formation of deuterated vanillin during the reaction of GG in NaOD/D2O.
To delineate the specific positions of deuterium incorporation, a standard vanillin sample was treated in NaOD/D2O for 240 min, followed by GC/MS analysis of its acetylated form. The resultant spectrum showed a mild increase in the intensities of m/z 153 and m/z 195 relative to the acetylated vanillin derived from vanillin in NaOH aq. (referenced in entry 5 of Table 2). However, the substantial increase in intensity observed when GG was reacted in NaOD/D2O was not replicated. The deuterium-enriched species generated by treating the vanillin standard in NaOD/D2O are believed to result from solvent exchange reactions at the aromatic ring, particularly at the 5th position of vanillin. Despite these observations, the results imply that such C–H deuteration processes are not the primary mechanism behind the formation of deuterated vanillin from GG in NaOD/D2O.
In the mass spectrum of the acetylated vanillin derived from GG reacted in NaOD/D2O, there was not only a significant increase in m/z 153 but also a shift in the base ion peak from m/z 152 to m/z 151 (relative intensity of m/z 151: 129.0%, as illustrated in Fig. 4B and entry 2 in Table 2). These findings prompted a further examination of the deuterium introduction sites. Should deuterium be introduced at the aldehyde group, it is anticipated that the ion peak (m/z 151), resulting from the detachment of D from the CDO group, would manifest with a significant intensity. Moreover, when comparing the mass spectra of a mixture containing vanillin with both CHO and CDO groups to that of vanillin with solely CHO groups, one would expect a portion of the peak at m/z 152 in the mixture's spectrum to “shift” to m/z 153, consequently diminishing the peak at m/z 152. These assumptions accurately explain the patterns observed in the mass spectrum presented in entry 2 of Table 2, leading to the conclusion that deuterium substitution in vanillin takes place at the aldehyde group during reactions in NaOD/D2O. Consequently, further discussions in this article will proceed under the assumption that deuterium incorporation into vanillin occurs predominantly at the aldehyde group.
In the realm of EI mass analysis, if one assumes an equal probability of D or H elimination from the aldehyde group of vanillin acetate, regardless of whether deuterium has been introduced, the rate of deuterium incorporation (RD/H) into the aldehyde group of vanillin can be estimated by the ratio of peak intensities at m/z 153 to 152 (or m/z 195 to 194). It is, however, imperative to deduct the contribution from the inherent 13C isotopic peak intensities at m/z 153 and m/z 195 (refer to the experimental section for details). Taking these factors into account, the RD/H values for vanillin derived from GG in NaOD/D2O (denoted as RID/H and RIID/H for m/z 153 and m/z 195, respectively) were tabulated in Table 2. As a result, RID/H was calculated as 1.04 and RIID/H as 1.19, indicating nearly identical ratios. These findings suggest that in NaOD/D2O, deuterium-incorporated vanillin and non-incorporated vanillin were produced in roughly equal proportions.
Subsequently, the rate of deuterium incorporation into vanillin produced from isolated EE under conditions analogous to those for GG was examined. As illustrated in Fig. 4C and D, transitioning the reaction medium from NaOH aq. to NaOD/D2O for vanillin derived from EE led to an elevation in the peak intensities at m/z 153 and 195, along with an increased relative intensity of m/z 151 to the peak at m/z 152. This enhancement indicates that deuterium incorporation into the aldehyde group of vanillin occurs even when starting from EE. Nonetheless, as delineated by the comparative analysis between entries 2 and 4 in Table 2, the augmentation in the relative intensities of peaks at m/z 153 and 195 when decomposing EE in NaOD/D2O was less pronounced than that observed with GG. The deuterium incorporation rates RID/H and RIID/H for vanillin in the context of EE were determined to be 0.25 and 0.27, respectively, demonstrating that while deuterated vanillin is formed from EE, the ratio is significantly lower compared to that from GG. Additionally, D-substituted vanillin and non-substituted vanillin exhibited slightly different retention times in HPLC analysis, and these disparate rates of deuterium incorporation in vanillin from GG and EE were also mirrored in the HPLC analysis (see Fig. S1† and the associated discussion in ESI†).
The findings, highlighting a notable disparity in the RD/H values when utilizing GG and EE as starting materials, underscore the presence of Scheme 2's pathway C as a unique route distinct from pathway B, where EE does not act as an intermediate. By decomposing GG in NaOD/D2O under N2 conditions and performing subsequent 1H NMR analysis on the isolated EE, it was verified that deuterium incorporation does not occur during the formation of EE from GG (see Fig. S4† and the pertinent discussion in the ESI†). Consequently, within the vanillin generation process of pathway C, deuterium incorporation at the α-position C–H is significantly observed at some stage of the reaction, whereas such extensive deuterium substitution is deemed less probable in pathway B. As previously mentioned, direct comparison of outcomes in NaOH aq. and NaOD/D2O is impractical due to differences in O2 supply efficiency between these conditions. Nonetheless, the evidence firmly supports the existence of distinct pathways in the vanillin production from GG.
The molecular mechanisms underlying pathways B and C remain to be elucidated. The proposed mechanism of vanillin formation from EEvia a dioxetane structure, as depicted in Scheme 1B, fails to account for the minor solvent substitution at the α-position observed in pathway B in this study. On the other hand, assuming the vanillin formation through retro-aldol reactions in phenolic units,30,31 the deuterium incorporation might be explained by the well-known solvent exchange reaction at the α-hydrogen of the carbonyl group. Nevertheless, a more detailed investigation is required to comprehensively explain these observations. Furthermore, concerning pathway C, according to our research, it delineates a novel vanillin production pathway not previously reported in the literature, as far as vanillin production occurring under non-catalytic alkaline aerobic oxidation conditions. The elucidation of this pathway's mechanism warrants a systematic study utilizing model compounds different from those explored in the current article.
Conclusions
This study has clarified the process of vanillin formation through the alkaline aerobic oxidation of GG, revealing a sequence that includes a non-oxidative conversion pathway from GG to EEvia alkaline decomposition, succeeded by an oxidative decomposition of EE (pathway A → B, Scheme 2). Contrarily, the vanillin yield derived from GG substantially exceeded the anticipated yield predicated on the sole involvement of EE as an intermediate. This discrepancy underscores the presence of an alternative pathway, pathway C (Scheme 2). To the best of our knowledge, there are no reported instances of pathway C as a route for vanillin production under uncatalyzed alkaline aerobic oxidation conditions, supported by experimental evidence. Pathway C's role in the production of vanillin from GG appears to be either more dominant or competitive with pathway A.Further investigation into pathway C entailed the alkaline aerobic oxidation of GG and EE in NaOD/D2O. These experiments demonstrated a significantly varied rate of deuterium incorporation into the aldehyde group of vanillin, depending on whether GG or EE was employed as the starting material. While the precise mechanisms underlying this reaction remain to be elucidated, the findings from this study firmly establish the existence and operational significance of pathway C in the vanillin production process.
Conflicts of interest
There are no conflicts to declare.Acknowledgements
This work was supported by a Grant-in-Aid for Scientific Research (C) (No. 21K05715 and 23K05343) from the Japan Society for the Promotion of Science. We thank to the Kyoto Municipal Institute of Industrial Technology and Culture for granting us the opportunity to use their GC/MS facilities.References
- M. Fache, B. Boutevin and S. Caillol, ACS Sustainable Chem. Eng., 2016, 4, 35–46 CrossRef CAS.
- P. C. Rodrigues Pinto, E. A. Borges da Silva and A. E. Rodrigues, Biomass Convers., 2012, 381–420 CrossRef PubMed.
- M. B. Hocking, J. Chem. Educ., 1997, 74, 1055 CrossRef CAS.
- H. Zhang, X. Yong, J. Zhou, J. Deng and Y. Wu, ACS Appl. Mater. Interfaces, 2016, 8, 2753–2763 CrossRef CAS PubMed.
- G. H. Tomlinson and H. Hibbert, J. Am. Chem. Soc., 1936, 58, 345–348 CrossRef CAS.
- G. H. Tomlinson and H. Hibbert, J. Am. Chem. Soc., 1936, 58, 348–353 CrossRef CAS.
- J. L. McCarthy and A. Islam, ACS Symp. Ser., 1999, 742, 2–99 CrossRef.
- W. Schutyser, J. S. Kruger, A. M. Robinson, R. Katahira, D. G. Brandner, N. S. Cleveland, A. Mittal, D. J. Peterson, R. Meilan, Y. Román-Leshkov and G. T. Beckham, Green Chem., 2018, 20, 3828–3844 RSC.
- P. Ding, M. Garrett, Ø. Loe, A. W. Nienow and A. W. Pacek, Ind. Eng. Chem. Res., 2012, 51, 184–188 CrossRef CAS.
- A. W. Pacek, P. Ding, M. Garrett, G. Sheldrake and A. W. Nienow, Ind. Eng. Chem. Res., 2013, 52, 8361–8372 CrossRef CAS.
- O. Y. Abdelaziz, K. Ravi, F. Mittermeier, S. Meier, A. Riisager, G. Lidén and C. P. Hulteberg, ACS Sustainable Chem. Eng., 2019, 7, 11640–11652 CrossRef CAS.
- G. X. Wu and M. Heitz, J. Wood Chem. Technol., 1995, 15, 189–202 CrossRef CAS.
- R. Behling, S. Valange and G. Chatel, Green Chem., 2016, 18, 1839–1854 RSC.
- J. C. Villar, A. Caperos and F. García-Ochoa, Wood Sci. Technol., 2001, 35, 245–255 CrossRef CAS.
- W. Jeon, I.-H. Choi, J.-Y. Park, J.-S. Lee and K.-R. Hwang, Catal. Today, 2020, 352, 95–103 CrossRef CAS.
- F. G. Sales, L. C. Maranhão, N. M. Lima Filho and C. A. Abreu, Chem. Eng. Sci., 2007, 62, 5386–5391 CrossRef CAS.
- T. Hosoya, K. Yamamoto, H. Miyafuji and T. Yamada, RSC Adv., 2020, 10, 19199–19210 RSC.
- T. Hosoya, K. Kawase, Y. Hirano, M. Ikeuchi and H. Miyafuji, J. Wood Chem. Technol., 2022, 42, 1–14 CrossRef CAS.
- Y. Hirano, A. Izawa, T. Hosoya and H. Miyafuji, React. Chem. Eng., 2022, 7, 1603–1616 RSC.
- K. Yamamoto, T. Hosoya, K. Yoshioka, H. Miyafuji, H. Ohno and T. Yamada, ACS Sustainable Chem. Eng., 2017, 5, 10111–10115 CrossRef CAS.
- M. Maeda, T. Hosoya, K. Yoshikoka, H. Miyafuji, H. Ohno and T. Yamada, J. Wood Sci., 2018, 64, 810–815 CrossRef CAS.
- J. Gierer, F. Imsgard and I. Norén, Acta Chem. Scand., 1977, 31, 561–572 CrossRef.
- J. Gierer, Wood Sci. Technol., 1986, 20, 1–33 CrossRef CAS.
- J. Gierer, E. Yang and T. Reitberger, Holzforschung, 1996, 50, 353–359 CrossRef CAS.
- J. Gierer and I. Pettersson, Can. J. Chem., 1977, 55, 593–599 CrossRef CAS.
- J. Gierer, B. Lenz and N. Wallin, Acta Chem. Scand., 1964, 18, 1469–1476 CrossRef CAS.
- S. Kubo, K. Hashida, S. Hishiyama, T. Yamada and S. Hosoya, J. Wood Chem. Technol., 2015, 35, 62–72 CrossRef.
- F. Gu, P. Posoknistakul, S. Shimizu, T. Yokoyama, Y. Jin and Y. Matsumoto, J. Wood Sci., 2014, 60, 346–352 CrossRef CAS.
- A. Imai, T. Yokoyama, Y. Matsumoto and G. Meshitsuka, J. Agric. Food Chem., 2007, 55, 9043–9046 CrossRef CAS PubMed.
- V. E. Tarabanko and N. Tarabanko, Int. J. Mol. Sci., 2017, 18, 2421 CrossRef PubMed.
- V. E. Tarabanko, D. V. Petukhov and G. E. Selyutin, Kinet. Catal., 2004, 45, 569–577 CrossRef CAS.
- J. Gierer, T. Reitberger, E. Q. Yang and B. H. Yoon, J. Wood Chem. Technol., 2001, 21, 313–341 CrossRef CAS.
- T. Goto, S. Zaccaron, H. Hettegger, R. H. Bischof, K. Fackler, A. Potthast and T. Rosenau, Cellulose, 2023, 30, 3887–3900 CrossRef CAS.
- G. Gellerstedt and W. W. Al-Dajani, Holzforschung, 2000, 54, 609–617 CAS.
- E. Johansson and S. Ljunggren, J. Wood Chem. Technol., 1994, 14, 507–525 CrossRef CAS.
- F. Nakatsubo, K. Sato and T. Higuchi, Holzforschung, 1975, 29, 165–168 CrossRef CAS.
- T. Hayashi, T. Hosoya and H. Miyafuji, J. Agric. Food Chem., 2023, 71, 10124–10132 CrossRef CAS PubMed.
- H. Marcelle, L. Knut and v. U. Sverker, Acta Chem. Scand., 1986, 40, 31–35 Search PubMed.
- M. V. Galkin, C. Dahlstrand and J. S. M. Samec, ChemSusChem, 2015, 8, 2187–2192 CrossRef CAS PubMed.
- J. Gierer, Holzforschung, 1997, 51, 34–46 CrossRef CAS.
- S. Omori and C. W. Dence, Wood Sci. Technol., 1981, 15, 113–123 CrossRef CAS.
- K. Kratzl, P. Claus, W. Lonsky and J. S. Gratzl, Wood Sci. Technol., 1974, 8, 35–49 CrossRef CAS.
Footnote |
| † Electronic supplementary information (ESI) available. See DOI: https://doi.org/10.1039/d4su00085d |
| This journal is © The Royal Society of Chemistry 2024 |