
 Open Access Article
 This Open Access Article is licensed under a Creative Commons Attribution-Non Commercial 3.0 Unported Licence
How do stretch rate, temperature, and solvent exchange affect elastic network rupture?†
Asal Y
Siavoshani
a,
Zehao
Fan
a,
Muxuan
Yang
a,
Shan
Liu
a,
Ming-Chi
Wang
a,
Jiabin
Liu
ab,
Weinan
Xu
 a,
Junpeng
Wang
a,
Shaoting
Lin
ab and
Shi-Qing
Wang
*a
a,
Junpeng
Wang
a,
Shaoting
Lin
ab and
Shi-Qing
Wang
*a
aSchool of Polymer Science and Polymer Engineering, University of Akron, Akron, Ohio 44325, USA. E-mail: swang@uakron.edu
bDepartment of Mechanical Engineering, Michigan State University, East Lansing, MI, USA
First published on 18th September 2024
Abstract
In this study, we investigate three different polymeric networks in terms of their tensile strength as a function of stretching rate, or temperature, or medium viscosity. Both an acrylate-based elastomer and a crosslinked poly(methyl acrylate) are stronger, more stretchable, and tougher at high rates. They are also much stronger at lower temperatures. Such phenomena systematically suggest that the kinetics of bond dissociation in backbones of those load-bearing strands dictate the rate and temperature dependencies. We apply Eyring's activation idea for chain scission to rationalize the influence of rate and temperature on rupture for both elastomers and hydrogels where hydrogels become much more stretchable and stronger when water is replaced by glycerol.
1. Introduction
Soft robots,1,2 tissue engineering,3,4 flexible and stretchable electronics,5–7 and potential hydrogel-based8–13 medical applications make it important for us to develop a better understanding of mechanical behavior, including fracture behavior, of polymer networks. Toward this task of relating the macroscopic failure of covalently bonded polymeric systems to the network structure and mechanical strength, the rapidly developing mechanochemistry14–19 may ultimately provide evidence of bond scission as the core process in elastomeric rupture. Molecular insights via the incorporation of mechanophores20–23 will assist us in the construction of reliable models for elastomeric fracture. On the other hand, it has become plausible to make notable progress thanks to recent clarifications24–26 about the nature of polymer fracture. For example, stretching rate and temperature effects on the fracture behavior of vulcanized rubber can be understood based on local-stress analysis at the crack tip.27Mechanical studies of one traditional form of elastomers, i.e., crosslinked rubbery polymers have a long history because of the wide industrial applications of synthetic and natural rubbers in automobile and aircraft tires. In these studies, tensile strength28–32 and toughness33–36 of rubber vulcanizates were found to display a remarkably strong rate and temperature dependencies. Specifically, a vulcanizate (a) stretches more at a higher stretching rate and (b) stretches less at a higher temperature. Thus, when ultimate strain (e.g., stretch ratio) at rupture is plotted as a function of applied rate ![[small epsi, Greek, dot above]](https://www.rsc.org/images/entities/i_char_e0a1.gif) at different temperatures to form a family of curves, the data collected at the lowest temperature form the top curve. A horizontal shift of these curves relative to one reference can produce an approximate master curve of the rupture strain λb against effective rate AT. Sometimes, AT is found to be close to the WLF shift factor aT that is known37 to describe temperature dependence of polymer dynamics. Therefore, it was believed that “the fracture process is dominated by viscoelastic effects”38 as if chain dynamics can be fully responsible for the observed rate and temperature dependencies; “the variation of tensile strength σb and λb with temperature and rate, like that of the fracture energy, Gc, of amorphous rubbers, primarily arises from changes in segmental mobility” according to the textbook.39
at different temperatures to form a family of curves, the data collected at the lowest temperature form the top curve. A horizontal shift of these curves relative to one reference can produce an approximate master curve of the rupture strain λb against effective rate AT. Sometimes, AT is found to be close to the WLF shift factor aT that is known37 to describe temperature dependence of polymer dynamics. Therefore, it was believed that “the fracture process is dominated by viscoelastic effects”38 as if chain dynamics can be fully responsible for the observed rate and temperature dependencies; “the variation of tensile strength σb and λb with temperature and rate, like that of the fracture energy, Gc, of amorphous rubbers, primarily arises from changes in segmental mobility” according to the textbook.39
In the Griffith style account40 of fracture behavior of elastomers,29,33 the increase of Gc with increasing stretching rate and decreasing temperature is regarded as evidence of a rise of energy dissipation (e.g., internal viscosity34), where crack propagation is assumed to be influenced by polymer viscoelasticity.34,41–47 Rupture of uncut specimens has been treated by Bueche and Halpin48,49 within the fracture mechanics framework that assumes crack propagation to start from pre-existing flaws.39 Using spatial–temporal resolved polarized optical microscopy (str-POM), it can be shown25,27 that high toughness directly originates from high material strength. Specifically, the tip stress at fracture σtip(F) appears comparable to ’the inherent strength of the polymer.26 For elastomers, it can be demonstrated based on str-POM that σtip(F) dictates the magnitude of Gc, and σtip(F) is prescribed by tensile strength σb. Thus, the rate and temperature dependencies of Gc and σb likely have the same physical origin. Consequently, it becomes crucial to understand why tensile strength of elastomers can increase at high stretching rates and lower temperatures. When crosslinked rubber is elastically stretched, the phenomenon cannot be described by Bueche–Halpin theory.27 Chain tension builds up in proportion to the imposed strain. It is misleading to think39 well above the glass transition temperature Tg that “in a cross-linked rubber the internal viscosity still impedes the rearrangement of molecular chains”.
The present work examines three separate crosslinked rubbery polymers in terms of their tensile strength as a function of stretching rate, temperature, and solvent exchange. The aim is to explore the notion that scission of covalent bonds in backbones of load-bearing strands (LBSs) may control rupture behavior characterized by tensile strength and ultimate strain, i.e., stretching ratio λb at rupture. A recently proposed theory26 asserts that kinetics of bond dissociation results in the observed rate and temperature dependencies of the threshold condition for elastomeric rupture. Bond lifetime, shortened in the presence of chain tension due to external stretching, is longer at a lower temperature because bond dissociation is an activation process and requires thermal energy (kBT) to hop over the dissociation barrier. Thus, the temperature effect is self-evident: more LBSs survive at a lower temperature due to lower thermal energy available to cause bond dissociation. Separately, an elastomer could stretch more at a high stretching rate in a highly heterogeneous network where straightened LBSs with high tension is a negligible fraction of the total population of strands. At a given nominal strain (λ − 1), produced with a high stretching rate, the elapsed time can be much shorter than lifetimes of LBSs – only more stretching could further shorten the network lifetime until sufficient bond dissociation takes place. At a low rate, network's lifetime exceeds the experimental timescale at a lower strain.
2. Bond dissociation leading to elastomeric rupture
The fracture of crosslinked rubbery polymers occurs via chain scission. While intersegmental interactions can cause stress to become rate dependent at low temperatures, we will only apply stretching rates in a temperature range where tensile stress is entirely of intrachain origin. When stretching is purely elastic and done in strain-controlled mode, we may relate the condition for rupture, i.e., ultimate strain at rupture λb, to the buildup of bond tension in LBSs. The relation has been recently detailed.26 According to this theory of bond dissociation for elastomeric rupture, which is based on the phenomenological theory of Kauzmann–Eyring,50 the bond lifetime tb(![[f with combining macron]](https://www.rsc.org/images/entities/i_char_0066_0304.gif) ) shortens in the presence of bond tension f. In terms of the normalized form = f/fmax and corresponding activation energy barrier Ea(), we have,26,51,52
) shortens in the presence of bond tension f. In terms of the normalized form = f/fmax and corresponding activation energy barrier Ea(), we have,26,51,52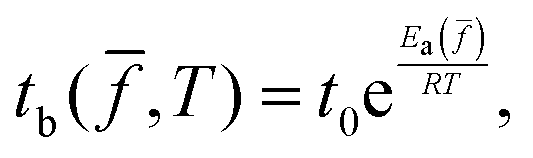 | (1) |
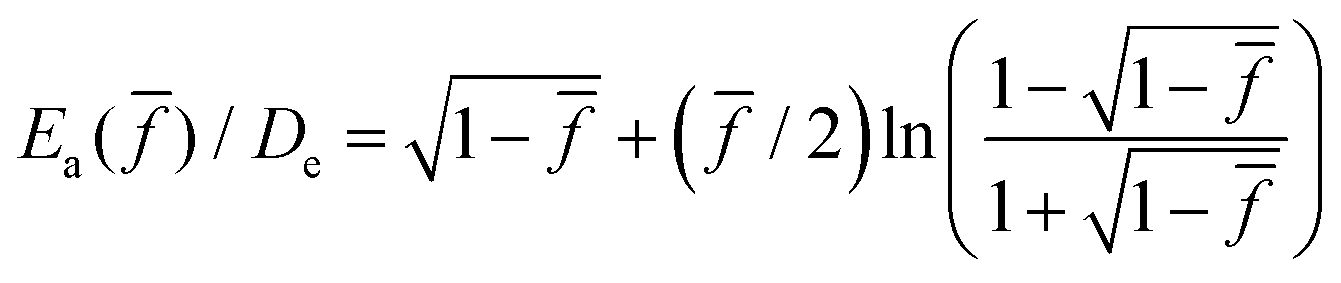 , which was first derived by Kauzmann and Eyring50 using the Morse potential.53 Here R is the gas constant, and De is the bond dissociation energy, equal to 370.8 kJ mol−1 for carbon–carbon bond according to a recent calculation of density-functional theory,54 which also produces fmax = 6.9 nN. The prefactor t0 is usually regarded as being related to bond vibration frequency given by h/kBT in vacuum,55 which is on the order of 0.1 ps, where h is the Planck constant and kB is the Boltzmann constant.
Since the experimental time ts, which has elapsed during stretching to λ(ts), depends on the applied stretching rate, elastomeric rupture acquires rate dependence. Specifically, upon expressing ts as either
ts(λ) = −1![[thin space (1/6-em)]](https://www.rsc.org/images/entities/char_2009.gif) ln[λ()], stretching at a constant Hencky rate ln[λ()], stretching at a constant Hencky rate | (2a) |
ts(λ) = (λ − 1)/![[small lambda, Greek, dot above]](https://www.rsc.org/images/entities/i_char_e152.gif) , stretching at a constant crosshead speed V: = V/L0, , stretching at a constant crosshead speed V: = V/L0, | (2b) |
In general, it is formidable to figure out the functional form of λ() because mechanical characteristics do not reveal detailed information about the network structure. Although relating bond tension (λ) to nominal strain λ is an insurmountable task, we can postulate an expression for this function (λ) to mimic the fact that a great deal of bond tension builds up in LBS only after sufficient stretching has taken place.26 For simplicity, we adopted the following expression, parametrized by a single constant F that designates the normalized tension reached at rupture:
 | (3a) |
) given by | (3b) |
Here F represents the normalized bond tension level at rupture,26 which varies from one type of network to another and is thus adjustable. When the experimental time scale is fixed by stretching rate, which is usually in a narrow “mechanical window”, the choice of F depends on the temperature of the rupture experiment. Bonds are longer lived, i.e., more stable at lower temperatures where rupture may involve a higher bond tension, thus, a higher value of F.
Although eqn (3a) is an oversimplification, it captures the following scenario that may occur in elastomeric stretching. As strain increases during continuous extension, additional load-bearing strands experience non-Gaussian stretching while already-straightened strands wait for their lifetimes to surpass the experimental time ts of eqn (2a) and (2b) – the duration of specimen stretching. Only when a fraction of load-bearing strands, albeit minimal, is subjected to sufficiently high tension does the further accumulation of bond tension in those strands occur, resulting in shortened lifetime. In other words, as λ increases, the population of load-bearing strands in high tension grows to a threshold. To a given nominal strain value (λ) stretching takes a shorter time at higher stretching rate, shorter than the bond lifetime. Thus, stretching continues to reach higher strain and corresponding higher tensile strength before rupture. Rupture occurs when tb of eqn (1) equals ts of eqn (2a) or (2b).
3. Experimental
3.1. Sample preparation
Our three elastomeric systems are a commercial acrylate-based elastomer from 3M (VHB-4910), a crosslinked poly(methyl acrylate) (PMA×), and three hydrogels.:1 (v/v) mixture of methyl acrylate (MA) (10 mL, 110 mmol, 100 equiv.) and chloroform (10 mL). The solution was then thoroughly deoxygenated by 20 min of nitrogen purging before being transferred via a syringe under nitrogen protection to a glass–silicone–glass sandwich mold (120 mm × 120 mm × 1.4 mm). After UV irradiation (wavelength = 365 nm) for 1 h, the cured film was taken out from the mold and submerged in toluene to remove any sol fraction. The solvent was decanted and replaced with fresh one three times over the course of 24 h. The washed film was then deswelled in methanol and dried under air for 1 h and then in a high vacuum at 50 °C for 24 h.
The single network hydrogel poly(acrylamide) was prepared at Michigan State University based on hydrogel precursor solutions, by mixing 1.2 g acrylamide (AAm, Sigma A8887) as the monomer, 200 μL of 0.1 M ammonium persulfate (APS, Sigma A3678) as the thermal initiator, 10 μL N,N,N′,N′-tetramethylethylenediamine (TEMED, Sigma T9281) as the accelerator, and 4 mL of 0.23 wt% N,N′-methylenebisacrylamide (MBAA, Sigma 146072) as the crosslinker in 8.8 mL deionized water. Thereafter, the precursor was vortexed using a centrifugal mixer (Kr-100, THINKY) for 30 s and then poured into a dog-bone-shaped acrylic mold (30 mm × 15 mm × 3 mm) and sealed with an acrylic cover. Subsequently, the molds containing the precursor solution were placed on a 55 °C hot plate for 0.5 h until curing. The resulting sample has a polymer volume fraction of 7.35%. This SN hydrogel is labeled as PAAm.
: AAm) of 1:2 in the final hydrogel. The DN hydrogel was obtained after polymerization and crosslinking of the obtained hydrogel at 60 °C for 6 hours. This DN hydrogel is labeled as PAMPS:AAm.
PAAm was prepared at MSU by immersing the PAAm hydrogel (30 × 15 × 3 mm3) in 100 mL of glycerol (Glycerol, Sigma G9012) for 24 hours until the solvent exchange was completed. To match the polymer concentration of PAAm glycerol gels, the hydrogels were placed on a flat acrylic board under ambient conditions to dehydrate. The hydrogels were flipped every 30 minutes until they matched the dimensions of the glycerol gels. The dehydration led to volume shrinkage to 65% of the original volume. Consequently, the final samples to be tested achieved a polymer concentration of (7.35/0.65)% = 11%.
3.2. Methods
For VHB, PMA, hydrogel, and glycerol gels made at UA, an Instron tester 5969 was employed to perform continuous stretching using two pneumatic clamps. The hydrogels and glycerol–gels made at MSU were glued onto acrylic boards using super glue (Krazy Glue). With the boards clamped onto the CellScale Testing Machine at a crosshead speed of 1 mm s−1, continuous stretching was carried out until rupture. For compression, a specific homemade setup was constructed to permit observation of fracture in the plane of compression, as shown Fig. 1. An Instron was also used to advance a blade into samples under study.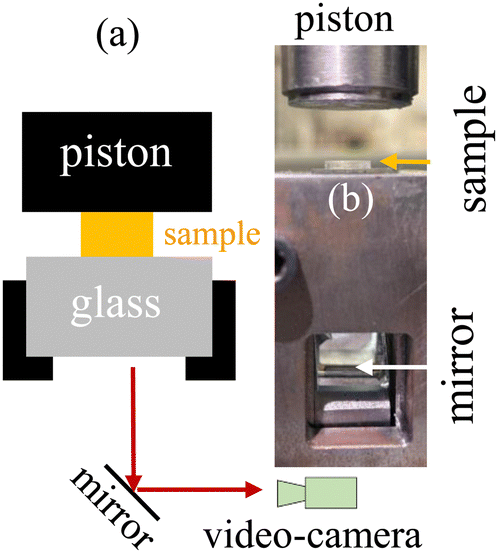 | ||
| Fig. 1 (a) Schematic illustration of the compression setup for video recording. (b) Photo of the actual setup. Piston is mounted on the moving crosshead of the Instron. | ||
4. Results and discussion
Each of the three systems listed in Section 2 is investigated to demonstrate a particular effect. Specifically, VHB is studied to demonstrate the rate effect on stretchability and tensile strength. PMA× is shown to exhibit the temperature dependence of tensile strength as well as the rate dependence of toughness. Hydrogels upon solvent exchange, e.g., replacing water with glycerol, illustrate the effect of medium on their rupture behavior.4.1. VHB stretching more at a higher stretching rate
VHB has proprietary structures at both chain and network levels. It is presumably manufactured by crosslinking of premade acrylic chains that may trap entanglement. The entanglement contribution diminishes at elevated temperatures so that only LBSs between crosslinks are involved, i.e., elastically stretched, in the mechanical response until the point of rupture. In this limit, e.g., at 90 °C, VHB displays the same stress versus strain curve at different stretching rates, as shown in Fig. 2a. Consistent with Smith's data,28 VHB is stronger when examined at higher rates. Such a rate effect has never been satisfactorily explained in the past because Bueche and Halpin theory48,49 does not apply27 for strain-controlled stretching in the elastic stretching limit. In situ birefringence measurements were carried out to show in Fig. 2b that the stress–optical relationship (SOR) is independent of stretching rate: Cauchy stress and birefringence increase with stretching in the same manner for the different applied rates. In other words, the SOR is the same, suggesting that stretching is purely elastic. See in the ESI† the setup for birefringence observations, made by in situ video recording of specimen stretching. | ||
Fig. 2 (a) Engineering stress vs. stretching ratio from uniaxial extension of VHB at three Hencky rates V/L = 1/12, 1/120 and 1/1200 s−1, where V is relative speed between two clamps and L0 = 12 mm is the initial separation between two clamps, taken to be the original sample length. (b) Birefringence at different stages of stretching for the three rates indicated in (a), plotted against local (Cauchy) stress σ, acquired from quantitative analysis of video recording using Michel–Levy chart (cf. ESI†). (c) Ultimate strain at rupture λb at different stretching rates, where data (filled dots) are from (a) and open circles are from the theoretical calculation. (d) Theoretical solution of nonlinear algebraic equation 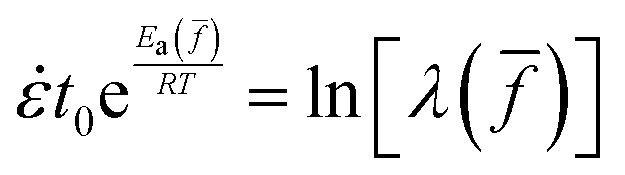 for , derived by setting ts = tb, involves a choice of F = 0.527 in eqn (3b). (e) Fractional bond tension and the time of rupture at three rates. Though relationship between rupture time and rate is not a trivial reciprocal, it approximately holds true that the elapsed time at rupture trupture = ts(λb) per eqn (2a) is roughly proportional to −1. (f) Ultimate strain λb from nine specimens at the intermediate rate, along with the photo of nine specimens prior to rupture, observed under POM, taken from Movie-9VHB in the ESI.† for , derived by setting ts = tb, involves a choice of F = 0.527 in eqn (3b). (e) Fractional bond tension and the time of rupture at three rates. Though relationship between rupture time and rate is not a trivial reciprocal, it approximately holds true that the elapsed time at rupture trupture = ts(λb) per eqn (2a) is roughly proportional to −1. (f) Ultimate strain λb from nine specimens at the intermediate rate, along with the photo of nine specimens prior to rupture, observed under POM, taken from Movie-9VHB in the ESI.† | ||
According to the theoretical treatment in Section 2 bonds in backbones of LBSs can stretch more and reach higher tension values at a higher stretching rate because bond lifetime is still long relative to the experimental timescale. Indeed, we can describe how rupture strain λb increases with the applied rate. By plotting tb(, T) of eqn (1) and ts(, ) of eqn (2a) at F = 0.527 as a function of fractional bond tension in Fig. 2c and inserting the three specific values of at the crossing points into eqn (3b), we show in Fig. 2d that the theory in open circles can prescribe a similar trend of rupture strain λb monotonically increasing with the applied rate. The same theoretical procedure to numerically solve the nonlinear equation tb(, T) = ts(, ) for at rupture is adopted below for the other two cases.
The theoretical description permits us to indicate (1) the experimental timescale for rupture as a function of the applied rate and (2) the corresponding bond tension, as shown in Fig. 2e. Finally, Fig. 2f demonstrates that rupture took place at a nearly constant stretching ratio of L/L0 = ca. 7 during simultaneous stretching of nine identical VHB specimens. The ESI† contains a video recording of this experiment, labeled as Movie-9VHB.
4.2. PMA is stronger and tougher at lower temperatures
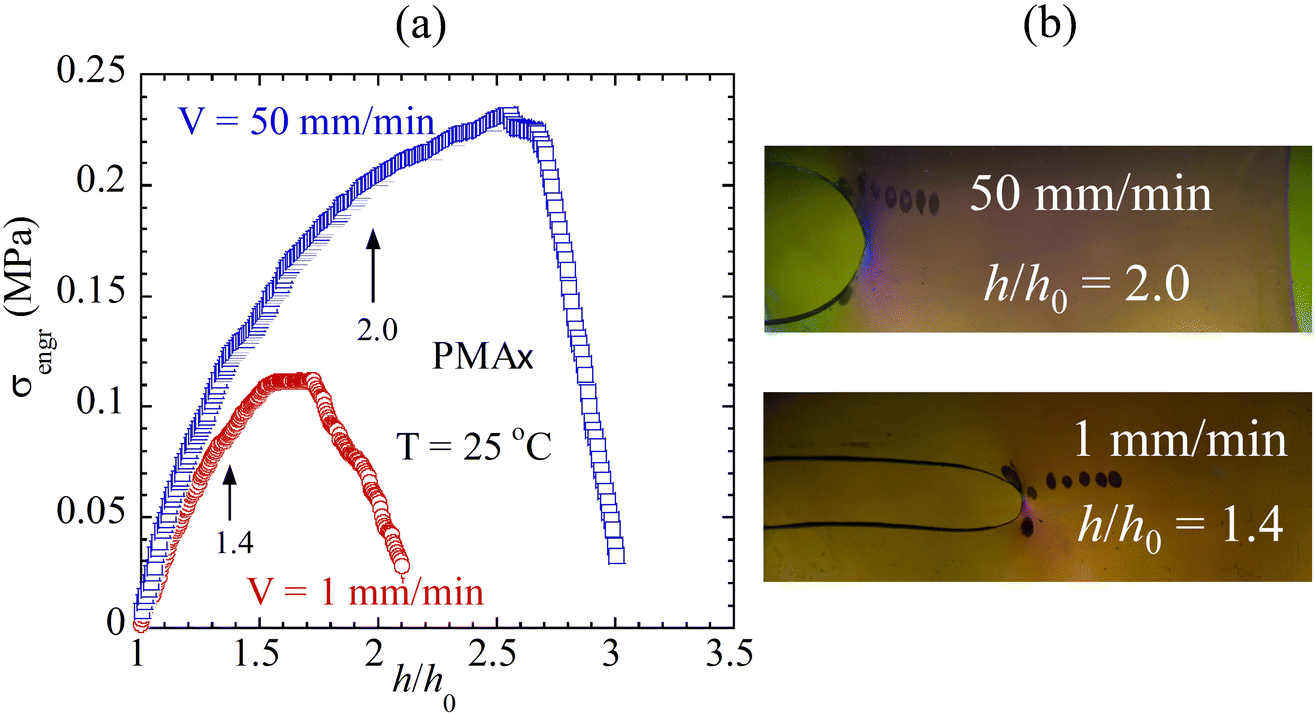
PMAx is first stretched at room temperature with three crosshead speeds of V = 0.1, 10 and 500 mm min−1. It ruptures at markedly different stretching ratios, as shown in Fig. 3a. Separately, Fig. 3b shows that PMAx is progressively weaker with increasing temperature in a temperature range from 25 to 60 °C. Following the same numerical procedure as described in the preceding paragraph, Fig. 3c illustrates the numerical solutions of tb(, T) = ts(, ) for F = 0.58. Inserting the acquired values of as a function of temperature at a given rate into eqn (3b), we show in Fig. 3d that the degree of stretching at rupture, i.e., the ultimate strain λb, increases with lowering temperature in agreement with the data of Fig. 3b. Here the choice of F = 0.58, significantly higher than 0.52 employed in Fig. 2c (which involves tests at 90 °C), indicates that the rate dependence is predicted to be significantly weaker at 60 °C than at 25 °C for PMAx, in qualitative agreement with data.
 | ||
Fig. 3 (a) Engineering stress vs. stretching ratio from uniaxial extension of dogbone-shaped PMA specimens at three crosshead speeds V = 0.1, 10 and 500 mm min−1, where the inset shows the dimensions of the dogbone-shaped specimen, cut from an ASTM D638 (type V) die. (b) Engineering stress vs. stretching ratio at five temperatures at crosshead speed V = 50 mm min−1. (c) Theoretical solution of the nonlinear algebraic equation  for , involving F = 0.58 in eqn (3b). (d) Theoretical calculation of ultimate strain at rupture λb as a function of temperature, data (filled dots), read from (b). (e) Comparison between data (in solid circles and squares) and calculation in open symbols. for , involving F = 0.58 in eqn (3b). (d) Theoretical calculation of ultimate strain at rupture λb as a function of temperature, data (filled dots), read from (b). (e) Comparison between data (in solid circles and squares) and calculation in open symbols. | ||
The results in Fig. 3a and b based on PMAx are consistent with rupture behavior of conventional vulcanized rubber such as styrene–butadiene rubber (SBR) and butadiene.28,32 Separate runs on a different batch of PMAx at two values of V = 1 and 100 mm min−1, shown in Fig. S3 in the ESI,† were video recorded to show the rise of birefringence in Movie-PMA1 and Movie-PMA100, along with the stress vs. strain curves. Elastomers are known to be tougher at higher rates and lower temperatures.33,36 According to our theory, rate and temperature have similar effects on both tensile strength and toughness because both rupture of unnotched elastomers and fracture of prenotched elastomers are due to bond dissociation.26 Thus, the observation of Fig. 3a would lead to a suggestion that PMAx should exhibit higher toughness at a higher stretching rate. Fig. 4a and b confirm that prenotch PMAx in pure shear undergoes fracture at a much lower stretching ratio of 1.4 at V = 1 mm min−1 relative to fracture that occurs at 2.0 at V = 100 mm min−1, corresponding to toughness of 0.4 and 2.1 respectively. At the higher stretching rate, (a) a higher degree of stretching is reached at fracture, corresponding to a higher level of chain tension per eqn (1), and (b) the higher toughness arises because fracture strength is higher;26 correspondingly, shorter network lifetime produces faster crack growth. Indeed, in terms of the crack propagation velocity vc, a significant difference exists, i.e., the ratio of vc at 50 mm min−1 to that at 1 mm min−1 is 18.
 | ||
| Fig. 4 (a) Engineering stress vs. stretching ratio curves from pure shear stretching of PMA specimens at crosshead speeds V = 1 and 50 mm min−1. (b) Images of the notch tip at onset of fracture described in (a). | ||
4.3. Making hydrogels much stronger with solvent exchange
Since the publication of Kramers’ reaction rate theory,59 theoretical studies52,60,61 of chain scission occasionally include the effect of molecular friction. Such an idea suggests that replacement of water with glycerol for a hydrogel could change its tensile strength and toughness by prolonging bond's and network's lifetimes through the prefactor t0 in eqn (1). Thus, it is interesting to find out whether such a solvent exchange could result in a stronger gel, where the original hydrogel can be either single-network or double-network based. As soon as the concept of DN is demonstrated to result in tougher hydrogels,56 the standard interpretation has been that the first sacrificial network provided additional energy dissipation, therefore more energy release.62 On the other hand, without exception, these tough hydrogels10–13 all exhibit higher tensile strength, consistent with the recent description of fracture mechanics of polymers26 that toughness is directly related to polymer strength and the spatial extent of stress intensification at the crack tip. Based on str-POM, this connection between toughness and strength has recently been demonstrated in the case of vulcanized rubber.25,27 Since elastomeric strength arises from strength of covalent bonds in LBSs, the theoretical analysis in Section 2 inspires a simple investigation into how hydrogels may be systematically toughened by replacing water with glycerol. In other words, if the solvent exchange effect is to increase the prefactor t0 in eqn (1), the water–glycerol exchange would increase the network lifetime, leading to a significant increase in stretchability and tensile strength.Here, we examine the effect of solvent exchange on several SN and DN hydrogels using compression and extension. In compression a SN hydrogel can undergo an appreciable strain before rupture. However, the corresponding glycerol–gel shows much greater resistance before disintegration, as shown in Fig. 5a. The remarkable improvement in mechanical characteristics is also demonstrated by advancing a blade into two specimens. The glycerol–gel is much more resistant to cutting as shown in Fig. 5b: the solvent exchange remarkably deters cut-through. The comparisons for both compression and blade cutting are recorded in Movie-Compression/W, Movie-Compression/G, Movie-Cutting/W and Movie-Cutting/G in the ESI.† The effect of the water–glycerol exchange may be interpreted as increasing the prefactor t0 in eqn (1) – in a viscous medium t0 may increase above its value in a vacuum. Theoretically speaking, if the prefactor t0 in eqn (1) increases by a factor of a thousand, we show in Fig. 6a that this amounts to vertical shift of the H2O (black) curve upward by a factor of 103, moving the three theoretical solutions toward the right-hand side, resulting in three higher values of for rupture at three rates. Fig. 6b shows the effect of the solvent replacement on rupture strain for three stretching rates. The structure of λ() in eqn (3b) prescribes a strong dependence of λ on . While F is the same upon solvent exchange – solvent exchange is reasonably assumed to leave the network structure intact, the tension at rupture is considerably lower in hydrogels at rupture due to their shorter lifetimes. Consequently, the variation of λ with rate in hydrogels is predicted to be much weaker.
 | ||
| Fig. 5 (a) Normal force vs. compression ratio from uniaxial compression of single-network hydrogel and glycerol–gel at a constant crosshead speed V = 1 mm s−1, where the photos reveal the contrast in terms of the onset of rupture based on the device of Fig. 1. Glycerol (photo G) continues to be compressed well past the point where the corresponding hydrogel (photo H) undergoes rupture. The side views in the lower set of photos show the remaining gap distances, marked by the red bars. (b) Force recorded during advancement of a blade at speed V = 1 mm s−1 as a function of the blade displacement. Photos show the degrees of blade travel at the moments of specimen fracture, with the help of the vertical red lines to indicate the location of the blades at fracture. | ||
 | ||
Fig. 6 (a) Theoretical result (open circles) from numerical solution of nonlinear algebraic equation  for , involving a choice of F = 0.65 in eqn (3b). (b) Theoretical prediction of ultimate stretching ratio λb at rupture by reading tb = ts from (a). for , involving a choice of F = 0.65 in eqn (3b). (b) Theoretical prediction of ultimate stretching ratio λb at rupture by reading tb = ts from (a). | ||
In tensile stretching tests, the PAMPS:AAm is rather soft and thus exhibits low stress levels, as shown in Fig. 7a in circles, different from the previously reported57 stress–strain curve. After the solvent exchange, the specimen turns considerably stronger. Movie-CS/W and Movie-CS/G are available in the ESI.† Stress relaxation is carried out to show in Fig. 7b that there is little stress relaxation, indicating absence of any entanglement or viscoelastic effect. Video recording of the glycerol–gel relaxation test in Fig. 7b is available in the ESI† as Movie-SR/G4.5. Movie-SR/G4.5 shows that the much stronger glycerol-based PAMPS:AAm displays appreciable birefringence that hardly decays during stress relaxation until delayed rupture. Moreover, as shown by images in the inset of Fig. 7b, at the same local stretching ratio of 1.5 there is a discernible birefringence in glycerol–gel but none in corresponding hydrogel, implying that the effect of the solvent exchange is also to enhance chain orientation. Surprisingly, this small amount of birefringence does not vanish, as shown by a separate Movie-SR/G2 available in the ESI.†
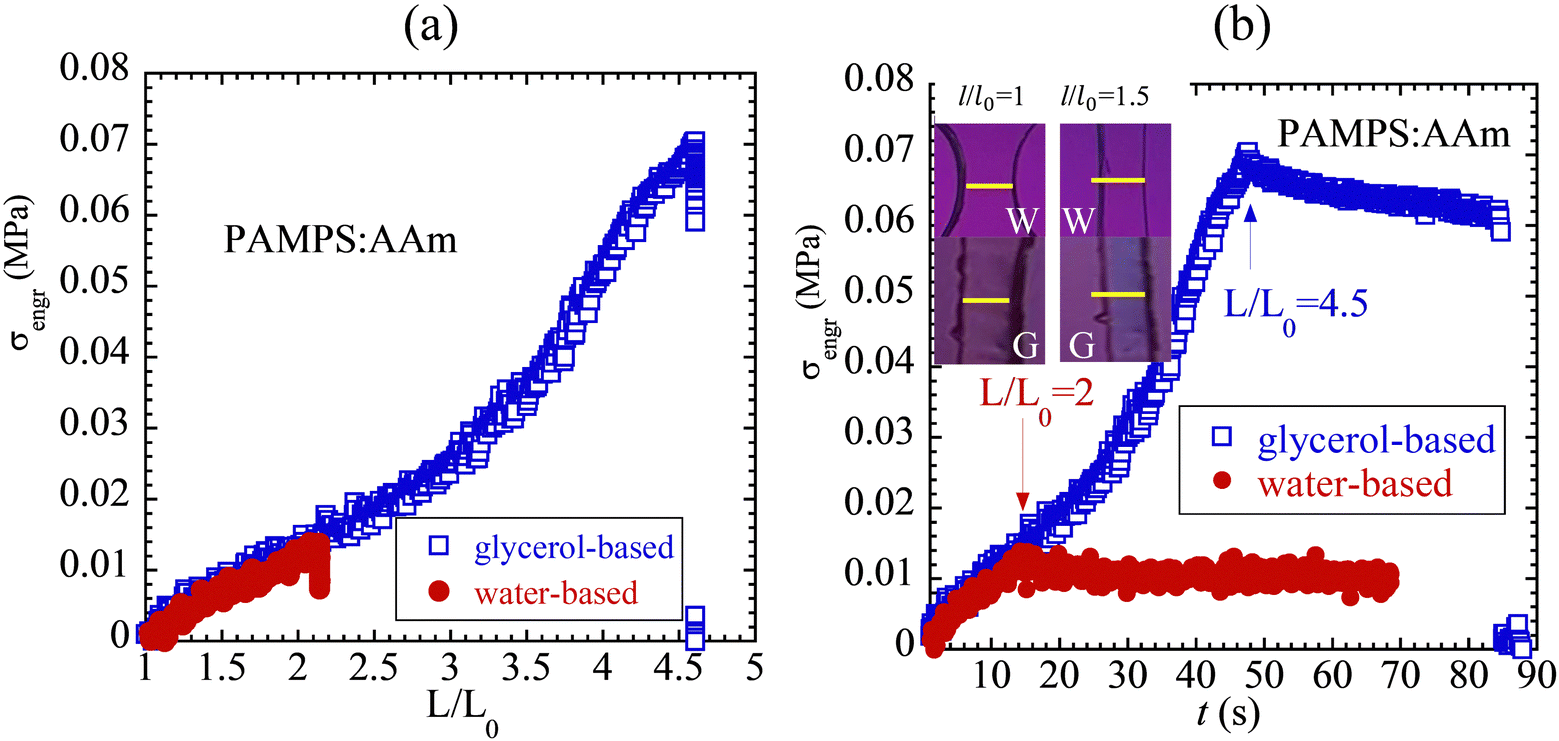 | ||
| Fig. 7 (a) Engineering stress vs. nominal stretching ratio from uniaxial extension of dogbone-shaped hydrogel and glycerol–gel specimens at a constant Hencky rate of 5 min−1. The narrow part of the glycerol–gel has dimensions of L = 22 mm, w = 3.3 mm, t = 2.8 mm, and hydrogel has dimensions of L = 12 mm, w = 3.13 mm, t = 2.8 mm. (b) Stretching of the two samples under the same conditions as in (b) and holding at L/L0 = 2 and 4.5 respectively to observe stress relaxation as a function of time. Images in the inset show that there is a discernible amount of birefringence in the glycerol-based gel at the same local stretching ratio of 1.5 when comparing the color difference between pink at the unstretched state (l/l0 = 1) and bluish pink at l/l0 = 1.5, whereas the water-based gel does not display any birefringence. | ||
To confirm the observed effect, a different hydrogel, i.e., PAAm, is also subjected to solvent exchange, replacing water with glycerol. The effect is shown in Fig. 8, corroborating with the effect displayed in Fig. 7a.
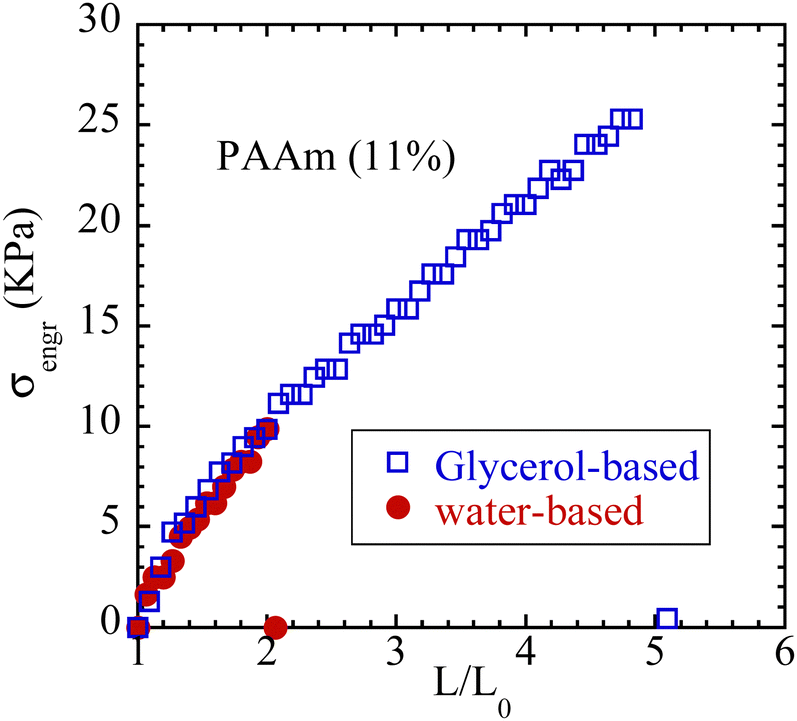 | ||
| Fig. 8 Engineering stress vs. nominal stretching ratio from uniaxial extension of dogbone-shaped water-based and glycerol-based polyacrylamide specimens at constant crosshead velocity of 1 mm s−1. Both specimens have the same dimensions: L = 26 mm, w = 2.8 mm, t = 2.6 mm. | ||
The effect of replacing water with much more viscous glycerol, shown in Fig. 5, 7 and 8, forces us to conclude that backbones in load-bearing strands of these gels become stronger. It is convenient to suggest that the much more viscous medium of glycerol may have prolonged the network lifetime. Consequently, further stretching can takes place beyond the rupture strain displayed by the hydrogel counterpart until higher stress reduces network lifetime to the experimental timescale at rupture. The lack of stress decline during the stress relaxation test in Fig. 7b shows that glycerol does not introduce enhanced viscoelasticity. In compression and blade cutting, glycerol also makes the gel much stronger. The solvent exchange effect has been reported before.63 Specifically, it was found that upon introducing glycerol to the notch tip of a hydrogel the crack growth markedly slows down at the same applied load, therefore the same energy release rate. Since the crack propagation speed reflects the lifetime of the polymer network, the slowdown is consistent with the idea that motivates the present study of solvent exchange for unnotched hydrogels: the prefactor t0 in eqn (1) is made longer upon replacing water with glycerol.
5. Conclusions
Elastomeric rupture is controlled by covalent bond dissociation. Consequently, the influence of stretching rate and temperature can be rationalized in a straightforward manner. In other words, in the simplest and thus theoretically tractable scenario where a given nominal strain produces a well-defined level of chain tension in a subpopulation of load-bearing strands (LBSs) that suffer scission during fracture, rate and temperature dependencies can be accounted for. Conceptually speaking, when an elastomer or crosslinked gel is stretched to a particular strain (stretching ratio), producing a certain high level of bond tension in backbones of those LBSs in the chain network, it may or may not rupture, depending on whether the emergent tension has shortened bond lifetime to the experimental timescale that is related to the stretching rate. If it has not, which can be the case of higher rate, the stretching will continue until rupture at a higher ultimate strain. Conversely, at a lower rate, the elastomer would have undergone rupture at a lower strain because network strands have been given enough time to be activated for scission. Separately, bond lifetime is longer at lower temperatures because of the smaller thermal energy (kBT) available to cause activation. Thus, by postulating a specific relation between bond tension and nominal stretching ratio, we can describe how tensile strength of elastomers changes with stretching rate and temperature, in qualitative agreement with experimental observations.The recent theory for elastomeric rupture,26 on the basis of Eyring's transition state theory50,64 and Kramers’ reaction rate theory,59 also motivated us to examine the effect of replacing water in hydrogels by a much more viscous aqueous medium such as glycerol. As predicted, but also to our surprise, the solvent exchange resulted in much stronger gels without any change in the gel structure. This finding appears to support the idea that the prefactor t0 in eqn (1) increases with medium viscosity. However, at present, we cannot rule out other interpretations such as lowering of activation barrier by the solvent exchange or other unknown factors.
Author contributions
Asal Y Siavoshani, Zehao Fan, Muxuan Yang, Shan Liu, Ming-Chi Wang, Jiabin Liu: data curation, formal analysis. Weinan Xu, Junpeng Wang, Shaoting Lin: supervision, formal analysis. Shi-Qing Wang: conceptualization, supervision, methodology, formal analysis, writing – original draft, writing – review & editing.Data availability
The authors state that the data underpinning the study's findings are included in the article and ESI.† Raw data supporting the study's findings can be obtained from the corresponding author upon reasonable request.Conflicts of interest
There are no conflicts of interest to declare.Acknowledgements
This work is supported, in part, by the Polymers program at the US National Science Foundation (DMR-2210184). W. X. acknowledges support from the US National Science Foundation (DMR-2213054). J. W. acknowledges support from the US National Science Foundation (CHE 2204079). S. L. acknowledges startup funds from the College of Engineering at Michigan State University and support from the US National Science Foundation (CBET-2320716).References
- R. V. Martinez, A. C. Glavan, C. Keplinger, A. I. Oyetibo and G. M. Whitesides, Soft actuators and robots that are resistant to mechanical damage, Adv. Funct. Mater., 2014, 24(20), 3003–3010 CrossRef CAS.
- M. Wang, Z. W. Cheng, B. Zuo, X. M. Chen, S. Huang and H. Yang, Liquid Crystal Elastomer Electric Locomotives, ACS Macro Lett., 2020, 9(6), 860–865 CrossRef CAS PubMed.
- K. Y. Lee and D. J. Mooney, Hydrogels for tissue engineering, Chem. Rev., 2001, 101(7), 1869–1880 CrossRef CAS PubMed.
- B. Narupai and A. Nelson, 100th Anniversary of Macromolecular Science Viewpoint: Macromolecular Materials for Additive Manufacturing, ACS Macro Lett., 2020, 9(5), 627–638 CrossRef CAS PubMed.
- J. Xu, S. H. Wang, G. J. N. Wang, C. X. Zhu, S. C. Luo, L. H. Jin, X. D. Gu, S. C. Chen, V. R. Feig, J. W. F. To, S. Rondeau-Gagne, J. Park, B. C. Schroeder, C. Lu, J. Y. Oh, Y. M. Wang, Y. H. Kim, H. Yan, R. Sinclair, D. S. Zhou, G. Xue, B. Murmann, C. Linder, W. Cai, J. B. H. Tok, J. W. Chung and Z. N. Bao, Highly stretchable polymer semiconductor films through the nanoconfinement effect, Science, 2017, 355, 6320 CrossRef PubMed.
- R. C. Du, Z. C. Xu, C. Zhu, Y. W. Jiang, H. P. Yan, H. C. Wu, O. Vardoulis, Y. F. Cai, X. Y. Zhu, Z. N. Bao, Q. H. Zhang and X. D. Jia, A Highly Stretchable and Self-Healing Supramolecular Elastomer Based on Sliding Crosslinks and Hydrogen Bonds, Adv. Funct. Mater., 2020, 30, 7 Search PubMed.
- Y. Zheng, S. Zhang, J. B.-H. Tok and Z. Bao, Molecular design of stretchable polymer semiconductors: current progress and future directions, J. Am. Chem. Soc., 2022, 144(11), 4699–4715 CrossRef CAS PubMed.
- Y. Tanaka, J. P. Gong and Y. Osada, Novel hydrogels with excellent mechanical performance, Prog. Polym. Sci., 2005, 30(1), 1–9 CrossRef CAS.
- Y. Akagi, H. Sakurai, J. P. Gong, U.-I. Chung and T. Sakai, Fracture energy of polymer gels with controlled network structures, J. Chem. Phys., 2013, 139(14), 144905 CrossRef PubMed.
- J. P. Gong, Why are double network hydrogels so tough?, Soft Matter, 2010, 6(12), 2583–2590 RSC.
- J.-Y. Sun, X. Zhao, W. R. Illeperuma, O. Chaudhuri, K. H. Oh, D. J. Mooney, J. J. Vlassak and Z. Suo, Highly stretchable and tough hydrogels, Nature, 2012, 489(7414), 133–136 CrossRef CAS PubMed.
- J. Kim, G. Zhang, M. Shi and Z. Suo, Fracture, fatigue, and friction of polymers in which entanglements greatly outnumber cross-links, Science, 2021, 374(6564), 212–216 CrossRef CAS.
- G. Nian, J. Kim, X. Bao and Z. Suo, Making highly elastic and tough hydrogels from doughs, Adv. Mater., 2022, 34(50), 2206577 CrossRef CAS PubMed.
- M. K. Beyer, The mechanical strength of a covalent bond calculated by density functional theory, J. Chem. Phys., 2000, 112(17), 7307–7312 CrossRef CAS.
- M. K. Beyer and H. Clausen-Schaumann, Mechanochemistry: The Mechanical Activation of Covalent Bonds, Chem. Rev., 2005, 105(8), 2921–2948 CrossRef CAS PubMed.
- M. M. Caruso, D. A. Davis, Q. Shen, S. A. Odom, N. R. Sottos, S. R. White and J. S. Moore, Mechanically-Induced Chemical Changes in Polymeric Materials, Chem. Rev., 2009, 109(11), 5755–5798 CrossRef CAS PubMed.
- J. Ribas-Arino and D. Marx, Covalent Mechanochemistry: Theoretical Concepts and Computational Tools with Applications to Molecular Nanomechanics, Chem. Rev., 2012, 112(10), 5412–5487 CrossRef CAS.
- P. A. May and J. S. Moore, Polymer mechanochemistry: techniques to generate molecular force via elongational flows, Chem. Soc. Rev., 2013, 42(18), 7497–7506 RSC.
- J. Li, C. Nagamani and J. S. Moore, Polymer mechanochemistry: from destructive to productive, Acc. Chem. Res., 2015, 48(8), 2181–2190 CrossRef CAS PubMed.
- D. A. Davis, A. Hamilton, J. Yang, L. D. Cremar, D. Van Gough, S. L. Potisek, M. T. Ong, P. V. Braun, T. J. Martinez, S. R. White, J. S. Moore and N. R. Sottos, Force-induced activation of covalent bonds in mechanoresponsive polymeric materials, Nature, 2009, 459(7243), 68–72 CrossRef CAS PubMed.
- E. Ducrot, Y. Chen, M. Bulters, R. P. Sijbesma and C. Creton, Toughening elastomers with sacrificial bonds and watching them break, Science, 2014, 344(6180), 186–189 CrossRef CAS PubMed.
- J. Slootman, V. Waltz, C. J. Yeh, C. Baumann, R. Göstl, J. Comtet and C. Creton, Quantifying rate-and temperature-dependent molecular damage in elastomer fracture, Phys. Rev. X, 2020, 10(4), 041045 CAS.
- J. Slootman, C. J. Yeh, P. Millereau, J. Comtet and C. Creton, A molecular interpretation of the toughness of multiple network elastomers at high temperature, Proc. Natl. Acad. Sci. U. S. A., 2022, 119(13), e2116127119 CrossRef CAS.
- T. Smith, C. Gupta, Z. Fan, G. J. Brust, R. Vogelsong, C. Carr and S.-Q. Wang, Toughness arising from inherent strength of polymers, Extreme Mech. Lett., 2022, 56, 101819 CrossRef.
- Z. Fan and S.-Q. Wang, Resolving stress state at crack tip to elucidate nature of elastomeric fracture, Extreme Mech. Lett., 2023, 61, 101986 CrossRef.
- S.-Q. Wang, Z. Fan, C. Gupta, A. Siavoshani and T. Smith, Fracture behavior of polymers in plastic and elastomeric states, Macromolecules, 2024, 57(9), 3875–3900 CrossRef CAS.
- S.-Q. Wang and Z. Fan, Investigating the dependence of elastomeric fracture on temperature and rate, Rubber Chem. Technol., 2023, 96(4), 530–550 CrossRef CAS.
- T. L. Smith, Dependence of the ultimate properties of a GR-S rubber on strain rate and temperature, J. Polm. Sci., 1958, 32(124), 99–113 CrossRef CAS.
- H. Greensmith, Rupture of rubber. VII. Effect of rate of extension in tensile tests, J. Appl. Polym. Sci., 1960, 3(8), 175–182 CrossRef CAS.
- T. L. Smith, Ultimate tensile properties of elastomers. I. Characterization by a time and temperature independent failure envelope, J. Polym. Sci., Part A: Gen. Pap., 1963, 1(12), 3597–3615 CrossRef.
- T. L. Smith, Ultimate tensile properties of elastomers. II. Comparison of failure envelopes for unfilled vulcanizates, J. Appl. Phys., 1964, 35(1), 27–36 CrossRef.
- T. L. Smith, Strength of elastomers. A perspective, Rubber Chem. Technol., 1978, 51(2), 225–252 CrossRef.
- H. W. Greensmith and A. Thomas, Rupture of rubber. III. Determination of tear properties, J. Polym. Sci., 1955, 18(88), 189–200 CrossRef CAS.
- L. Mullins, Rupture of rubber. IX. Role of hysteresis in the tearing of rubber, Trans., Inst. Rubber Ind., 1959, 35(5), 213–222 CAS.
- H. Greensmith, L. Mullins and A. Thomas, Rupture of rubber, Trans. Soc. Rheol., 1960, 4(1), 179–189 CAS.
- A. Thomas, The development of fracture mechanics for elastomers, Rubber Chem. Technol., 1994, 67(3), 50–67 CrossRef.
- M. L. Williams, R. F. Landel and J. D. Ferry, The Temperature Dependence of Relaxation Mechanisms in Amorphous Polymers and Other Glass-forming Liquids, J. Am. Chem. Soc., 1955, 77(14), 3701–3707 CrossRef CAS.
- I. M. Ward and J. Sweeney, Mechanical properties of solid polymers, 3rd, John Wiley & Sons, Ltd., Chichester, UK, 2012 Search PubMed.
- A. J. Kinloch and R. J. Young, Fracture behaviour of polymers, Springer Science & Business Media, 2013 Search PubMed.
- R. Rivlin and A. G. Thomas, Rupture of rubber. I. Characteristic energy for tearing, J. Polym. Sci., 1953, 10(3), 291–318 CrossRef CAS.
- P. De Gennes, Weak adhesive junctions, J. Phys., 1989, 50(18), 2551–2562 CrossRef CAS.
- J. M. Bowen and W. G. Knauss, The characterization of the energy of fracture at or near interfaces between viscoelastic solids, J. Adhes., 1992, 39(1), 43–59 CrossRef CAS.
- A. Gent, Adhesion and strength of viscoelastic solids. Is there a relationship between adhesion and bulk properties?, Langmuir, 1996, 12(19), 4492–4496 CrossRef CAS.
- P.-G. de Gennes, Soft adhesives, Langmuir, 1996, 12(19), 4497–4500 CrossRef CAS.
- B. Persson and E. Brener, Crack propagation in viscoelastic solids, Phys. Rev. E: Stat., Nonlinear, Soft Matter Phys., 2005, 71(3), 036123 CrossRef CAS PubMed.
- W. G. Knauss, A review of fracture in viscoelastic materials, Int. J. Fract., 2015, 196(1–2), 99–146 CrossRef.
- C. Creton, 50th anniversary perspective: Networks and gels: Soft but dynamic and tough, Macromolecules, 2017, 50(21), 8297–8316 CrossRef CAS.
- F. Bueche and J. Halpin, Molecular theory for the tensile strength of gum elastomers, J. Appl. Phys., 1964, 35(1), 36–41 CrossRef CAS.
- J. Halpin, Fracture of amorphous polymeric solids: time to break, J. Appl. Phys., 1964, 35(11), 3133–3141 CrossRef CAS.
- W. Kauzmann and H. Eyring, The viscous flow of large molecules, J. Am. Chem. Soc., 1940, 62(11), 3113–3125 CrossRef CAS.
- B. Crist Jr, J. Oddershede, J. Sabin, J. Perram and M. A. Ratner, Polymer fracture—a simple model for chain scission, J. Polym. Sci., Polym. Phys. Ed., 1984, 22(5), 881–897 CrossRef.
- R. Puthur and K. Sebastian, Theory of polymer breaking under tension, Phys. Rev. B: Condens. Matter Mater. Phys., 2002, 66(2), 024304 CrossRef.
- P. M. Morse, Diatomic molecules according to the wave mechanics. II. Vibrational levels, Phys. Rev., 1929, 34(1), 57 CrossRef CAS.
- M. K. Beyer, The mechanical strength of a covalent bond calculated by density functional theory, J. Chem. Phys., 2000, 112(17), 7307–7312 CrossRef CAS.
- E. V. Anslyn and D. A. Dougherty, Modern physical organic chemistry, University science books, 2006 Search PubMed.
- J. P. Gong, Y. Katsuyama, T. Kurokawa and Y. Osada, Double-network hydrogels with extremely high mechanical strength, Adv. Mater., 2003, 15(14), 1155–1158 CrossRef CAS.
- Y.-H. Na, Y. Tanaka, Y. Kawauchi, H. Furukawa, T. Sumiyoshi, J. P. Gong and Y. Osada, Necking phenomenon of double-network gels, Macromolecules, 2006, 39(14), 4641–4645 CrossRef CAS.
- R. Raman, T. Hua, D. Gwynne, J. Collins, S. Tamang, J. Zhou, T. Esfandiary, V. Soares, S. Pajovic and A. Hayward, Light-degradable hydrogels as dynamic triggers for gastrointestinal applications, Sci. Adv., 2020, 6(3), eaay0065 CrossRef CAS.
- H. A. Kramers, Brownian motion in a field of force and the diffusion model of chemical reactions, Physica, 1940, 7(4), 284–304 CrossRef CAS.
- F. Oliveira and P. Taylor, Breaking in polymer chains. II. The Lennard-Jones chain, J. Chem. Phys., 1994, 101(11), 10118–10125 CrossRef CAS.
- F. Oliveira, Transition-state analysis for fracture nucleation in polymers: The Lennard-Jones chain, Phys. Rev. B: Condens. Matter Mater. Phys., 1998, 57(17), 10576 CrossRef CAS.
- Y. Zheng, T. Nakajima, W. Cui, C.-Y. Hui and J. P. Gong, Swelling Effect on the Yielding, Elasticity, and Fracture of Double-Network Hydrogels with an Inhomogeneous First Network, Macromolecules, 2023, 56, 3962–3972 CrossRef CAS.
- T. Baumberger, C. Caroli and D. Martina, Solvent control of crack dynamics in a reversible hydrogel, Nat. Mater., 2006, 5(7), 552–555 CrossRef CAS PubMed.
- H. Eyring, The activated complex in chemical reactions, J. Chem. Phys., 1935, 3(2), 107–115 CrossRef CAS.
Footnote |
| † Electronic supplementary information (ESI) available. See DOI: https://doi.org/10.1039/d4sm00794h |
| This journal is © The Royal Society of Chemistry 2024 |