
 Open Access Article
 This Open Access Article is licensed under a
 Creative Commons Attribution 3.0 Unported Licence
Thermo-rheological and kinetic characterization and modeling of an epoxy vitrimer based on polyimine exchange
Niklas
Lorenz
 *,
William E.
Dyer
and
Baris
Kumru
*,
William E.
Dyer
and
Baris
Kumru
Aerospace Structures & Materials Department, Faculty of Aerospace Engineering, Delft University of Technology, 2629 HS Delft, The Netherlands. E-mail: n.lorenz@tudelft.nl
First published on 29th July 2024
Abstract
The present study describes the development of cure kinetics and chemo-rheological models for an epoxy vitrimer based on polyimine exchange to elucidate the potential in terms of processing and accurate process selection. Reaction kinetics is investigated using differential scanning calorimetry. A good agreement between the model and data can be demonstrated for different stoichiometries by selecting a parallel reaction approach consisting of an nth-order and an autocatalytic approach. The suggested chemo-rheological model captures the intrinsically high viscosity of the resin over a broad temperature and curing range, even after the gelation point. The Di-Benedetto equation represents the glass transition temperature advancement with cure while combining the rheological Winter–Chambon criterion and the kinetic model determines the degree of cure at the gelation. These results give important advice for improved process modeling of vitrimeric resins, facilitate accurate process selection, and pave the way towards the development of composites based on the matrix system investigated in this work.
1. Introduction
Epoxy resins (EP) represent an important class of thermosets deeply rooted in many industries and daily life applications. Their outstanding properties, such as excellent dimensional stability, thermal stability, mechanical strength, creep resistance, electrical insulation and chemical resistance, necessitate their use in various applications (e.g. automobile, aerospace, and electronic and electrical devices).1–3 On the other hand, reversible covalent networks represent a drawback preventing the epoxy resins from being reprocessed and recycled, and excluding further repair based on self-healing.Integrating covalent adaptive networks (CANs) into epoxy systems has led to the introduction of a new polymer class by extending thermosets material properties with remarkable properties such as recyclability, malleability, and self-healing which have so far been withheld for thermoplastic materials.1,4,5 Therefore, this new material class, called vitrimers, constitutes alternatives to conventional epoxy resin materials that open up the potential for sustainable use by enabling comprehensive recycling approaches and service life extension through pronounced reshaping and self-healing.3,6–8 For this, vitrimers exhibit the potential to replace traditional thermosetting materials in various fields to lead to sustainable materials manufacturing.1 However, vitrimer research for immediate application use is in its infancy9 and incipient stage.4 Considering existing publications on vitrimers, a wide range focuses on synthesis and materials’ properties on a laboratory scale,4,10–12 whereas only a minority addresses the material's processing in established FRP manufacturing processes.13–16
Commercial vitrimer systems are comparative newcomers to the field of matrix chemistry, although the concept was first observed by Leibler and coworkers on a laboratory scale over a decade ago.17 Currently, few commercial systems are available on the market: VitrimaxTM T100 and T130 by Mallinda, Inc.,18 EsthermTM and NOWETM by ATSP Innovations, Inc.19 and Thioplast® series by Nouryon B.V., individually aiming for different applications.
Mallinda Inc. launched VitrimaxTM T100 and T130, a 2-part vitrimeric resin system for prepregging applications, in 2021. Respectively, T100 and T130 describe the final glass transition temperature Tg,∞, which are 100 °C and 130 °C in the designated case. However, the underlying polyimine platform allows Tg to be tuned between 20 and 240 °C.18,20 Mallinda's unique polyimine platform is protected by two patents.21,22 By formulating NH2-terminated oligomers embedded with imines a dynamic hardener for epoxy resins, Mallinda effectively addresses the challenge of the condensation reaction inherent in imine chemistry.7 This approach is a proficient technical solution, preventing water release during network formation and facilitating the creation of void-free networks.7 The platform is designed for vitrimeric composites and aims to eliminate slow processing through resin injection and fiber impregnation by providing pre-cured prepreg, which can be cured in compression molding within minutes to enable high-throughput and high-volume production of structural composite parts.18 Full pre-curing of the prepregs is a decisive advantage compared to existing B-stage systems, as no refrigerated storage and transportation is necessary. In ref. 23, the authors demonstrate the manufacture of discontinuous reinforced flax fiber composites by vacuum bag molding of T100 resin films. The authors state an increased adhesion of the vitrimeric resin and the flax fibers compared to the traditional epoxy resin.23 The partial repair of a hybrid laminate containing a host resin and the T100 resin in the damaged areas was demonstrated in ref. 24. Due to the short processing time, high temperature required for infusion, and high viscosity of the vitrimer, the authors refrained from laminate manufacturing during the infusion process. Instead, they used a multi-step process of film stacking and subsequent infusion with the host resin.
Mechanical and chemical recycling of the resin is possible by either grinding and reshaping or using reagents utilized in the resin synthesis.7 Grinding and pressurized remolding through four generations demonstrate excellent mechanical recyclability, slightly decreasing elastic modulus and maintaining the ultimate tensile strength.25 Further, immersion of carbon fiber-reinforced polymer samples in neat diethylenetriamine completely dissolves the polyimine matrix, thus facilitating chemical recycling of composite without consuming chemicals and energy.26
As the development of vitrimer matrix materials matures and the first commercial solution becomes available, the question of industrially relevant processing of these materials arises. This involves understanding how vitrimers behave during manufacturing, providing relevant datasets, and modeling their properties to capture curing kinetics and chemo-rheology under process-specific conditions.
One of the main challenges associated with vitrimers is that they are difficult to process – relative to conventional thermosets – because the addition of dissociative side chains increases the viscosity of the reactive system before cure.24 Vitrimers beyond the gelation point possess even higher viscosity due to the newly formed bonds and can be challenging for many processes designed for thermoplastics.24,27 Therefore, the processing poses challenges based on the highly viscous nature7,14,24,27 that restricts processing and necessitates process design adaptations that must be assessed individually for each application. For this reason, the majority of studies documented in the literature employ the film impregnation process to manufacture composite laminates based on polyimine exchange.23,24
However, the overall processing characterization of vitrimers for their optimal application, namely cure kinetics, chemo rheology, and glass transition development models, is currently not addressed. To bridge this gap, the present paper elucidates the cure kinetics and chemo-rheological properties of a widespread polyimine-based vitrimeric resin to elucidate the processability and possible manufacturing methods for vitrimer resin. Throughout composite processing, cure-related phenomena such as residual stress buildup can cause microcracking and material degradation based on exothermal heat generation, directly affecting product quality. Further, defects, such as porosity and dry spots, are influenced by the rheological behavior of the matrix system and its changes during processing. For this, an in-depth understanding of these processes for vitrimeric matrix materials can facilitate adapting and optimizing processing conditions like filling, consolidation, and curing, as well as subsequent thermoforming processes.
2. Materials and methods
2.1 Materials
A polyimine-based vitrimer resin system VitrimaxTM T100 is purchased from Mallinda, Inc. The two-component vitrimer resin system consists of a epoxy resin (EP) and hardener (H) component. The resin constituent mixture consists of a diglycidyl ether bisphenol A (DGEBA), poly[(o-cresyl glycidyl ether)-co-formaldehyde] and poly[(phenyl glycidyl ether)-co-formaldehyde]. The hardener component is a patent-protected branched imine containing amine system. The supplier lists the following sections in the hardener: diethylenetriamine, 4,4′-diaminodicyclohexylmethane and an unspecified vitrimeric imine hardener. While the first two possess active amine functionalities, the imine hardener is also expected to bear amine functions. Therefore, the exact amine equivalent weight is unknown, preventing theoretical crosslink density calculations, as suggested in ref. 28. Fig. 1 illustrates the mechanism of imine exchange in dynamic networks. | ||
| Fig. 1 Illustration of vitrimers based on imine exchange. | ||
The supplier suggests mixing ratios of 1.5![[thin space (1/6-em)]](https://www.rsc.org/images/entities/char_2009.gif) :1 to 2.5:1 (hardener to resin component) to adjust viscosity depending on the targeted manufacturing process. For infusion applications, mixing ratios of 1.5:1 (S1) are recommended, whereas mixing ratio changes to 2.5:1 (S2) for the film impregnation process to manufacture prepregs. Our work encompasses stoichiometries S1 and S2 to cover the full range of possible processing windows and provide a comprehensive understanding of the polyimine vitrimer material behavior.
:1 to 2.5:1 (hardener to resin component) to adjust viscosity depending on the targeted manufacturing process. For infusion applications, mixing ratios of 1.5:1 (S1) are recommended, whereas mixing ratio changes to 2.5:1 (S2) for the film impregnation process to manufacture prepregs. Our work encompasses stoichiometries S1 and S2 to cover the full range of possible processing windows and provide a comprehensive understanding of the polyimine vitrimer material behavior.
2.2 Methods
Next, methods to assess the curing reaction, viscosity development, and evolution of glass transition temperature during curing are introduced in the present section and bridged to the proposed modeling approaches.For the preparation of DSC specimen to characterize the reaction kinetics, the hardener is preheated in a convection oven at 60 °C for 90 min. After adding the resin, small batches of 5 g are mixed for 3 min using a centrifuge speed mixer by Hauschild GmbH & CO. KG, Germany, while applying a vacuum pressure of 50 mbar. After mixing, the reactive mixture is immediately cooled and stored at −25 °C to avoid premature curing.
Before every DSC measurement, frozen small samples of 2–3 mg are placed into hermetic crucibles. The DSC analysis uses the mDSC250device from TA Instruments Inc. All measurements are carried out in a nitrogen atmosphere with 50 ml min−1 flow rates. Dynamic DSC scans with 5, 7.5 and 10 K min−1 heating rates are carried out at 0 to 225 °C temperature intervals. Subsequent cooling to 25 °C and reheating to 150 °C at 2.5 K min−1 determines the Tg of the samples. Further, temperatures of 120, 140 and 160 °C are selected to characterize the isothermal curing process. The DSC signals are integrated to calculate the evolution of reaction enthalpy using a linear baseline for dynamic and a strictly horizontal baseline for the isothermal runs.
Additional DSC runs are conducted to measure the Tg at various cure states. First, the specimens were exposed to an isothermal dwelling for specific times and rapidly cooled by 40 K min−1 to 0 °C. The high curing rates minimize the potential for subsequent post-curing during the cooling process. Subsequently, the specimens were reheated to 250 °C at 10 K min−1, and Tg and the residual reaction enthalpy are determined according to eqn (1)29
 | (1) |
 is expressed by eqn (2):32
 | (2) |
 | (3) |
 eqn (2) is transformed the following expression:
 | (4) |
Model-free methods rely on the assumption that the activation energy Eξ solely depends on the degree of cure ξ and that the function value f(ξ) is not altered by the temperature and the apparent reaction rate.33 For single-step reactions Ea is independent of ξ. In case the activation energy derives from a constant value, one can assume that the crosslinking exhibits a more complex behaviour and involves multiple reaction mechanisms that require supplementary investigation.40 In that case, it has been shown that strong variations in Eξ are a major source of integral errors and yield to significant differences between integral and differential methods.41,42 To overcome these drawbacks, advanced techniques have been developed by Vyazovkin32,43 that compute the temperature integral considering Eξ variation in the computation.32,42 According to the advanced method by Vyazonvkin the optimal Eξ minimises equation eqn (5):
 | (5) |
 | (6) |
For measuring the viscosity development (i), a HAAKE MARS III rheometer (Thermo Fisher Scientific Inc., USA) in parallel plate geometry, with a 20 mm diameter and 1 mm gap is used. A temperature-controlled test chamber realizes heating with temperature tolerances set to 0.1 °C. The initial shear viscosity of both individual components (Hardener, Resin) and the uncured reactive mixture (S1, S2) is measured while applying a constant controlled stress (CS mode) of 1 Pa, and the samples are heated from 30 °C to 120 °C with a heating rate of 1 K min−1 to recording the temperature-dependent steady-state viscosity development.
For measuring the GP and viscosity development during cure (ii), isothermal measurements are conducted at 90 °C and and 110° on an MCR502 rheometer from Anton Paar Benelux B.V. with a plate diameter of 25 mm. Using the multi-wave option, an oscillating deformation amplitude of 0.1 × 10⁻³ in the parallel plate configuration with a gap of 1 mm is applied at frequencies of 1, 2, 4 and 8 Hz. Strain sweeps were carried out for S1 and S2 after curing to ensure the applied strain 1 × 10⁻³ was within the linear viscoelastic region of the polymer. Guaranteeing preparation times smaller than 2.5 min while applying the resin on the rheometer plates, closing the gap, and starting the rheometer measurements minimizes premature curing.
The GP of a thermosetting resin corresponds to the material-specific DOC of incipient percolated network formation. This point becomes relevant from an engineer's point of view as viscosity increases exponentially,44,45 which prevents further processing.46 Further, the formation of the mechanical moduli at the GP commences most residual stresses in the composite material,47,48 whereas, before gelation, the development of stresses is of secondary importance, as relaxation occurs immediately.49 Different rheological49,50 and dielectric51,52 evaluation methods have been proposed for detecting gelation. Within the present work, the rheological-based Winter–Chambon criterion is utilized.50 The criterion describes gelation as the frequency-independent point of time at which the loss factors of different frequencies intersect. Based on the determined point of time, the DOC present at GP (ξGP) can be estimated using the reaction kinetic model. Usually, gelation is not indicated as a point of time but rather as a temperature-independent ξGP.51,52
Further, viscosity development during the cure represents another important measure, also measured in (ii). The Castro–Macosko model given in eqn (7)53 represents a well-established modeling approach to describe the viscosity development for ξ < ξGP:
 | (7) |
Apart from the Arrhenius law in eqn (7), the Vogel–Fulcher equation59 can be used to express the temperature-dependence of the shear viscosity η0 at low shear rates:
 | (8) |
 | (9) |
The viscosity of the hardener and epoxy mixture η0 in the initial state (ξ = 0) can be calculated as the rule of logarithmic additivity according to the Arrhenius law, which has already been applied to the initial viscosity of epoxy resins:60
| lnη0 = φRln(ηR,0) + φHln(ηH,0), | (10) |
3. Results and discussion
3.1 Thermogravimetric analysis
Fig. 2 confirms onset degradation associated with a 5% mass of S1 and S2 at temperatures of 292.3 °C and 267.5 °C, which are in the range of epoxy materials bearing imine bonds.10 The derivative of the sample weights confirms a delayed degradation of S1 compared to S2. The observed decrease in the thermal stability for S2 might be attributed to the increased dissociating tendency of imine bonds at elevated temperatures.10 Based on TGA results, a maximum temperature of 225 °C is set during DSC analysis to exclude premature material degradation for both stoichiometries. | ||
| Fig. 2 Sample weight change of stoichiometries S1 and S2 during TGA indicate the onset of degradation. | ||
Now that degradation during the DSC measurements can be excluded, the reaction behavior is discussed in the upcoming section.
3.2 Activation energy
First, the Eξ-dependency for heating rates of 1.5, 2.5, 5, 7.5 and 10 K min−1 is evaluated from 0.01 to 0.99 within intervals of 0.01. Fig. 3 shows Eξ calculated according to eqn (5) and (6). For S1, the activation energy ranges from 50 kJ mol−1 to 80 kJ mol−1, which is higher than conventional epoxy–amine reactions typically varying from 20 kJ mol−1 to 60 kJ mol−1.61–63 The higher initial activation might be attributed to the higher early-stage viscosity of the vitrimeric resin compared to conventional epoxy resins, as more energy is required to influence fluidity among the molecule chains. With the proceeding curing reaction, the viscosity increases with the increase of the curing degree, enforcing even more energy for motion among molecule chains.61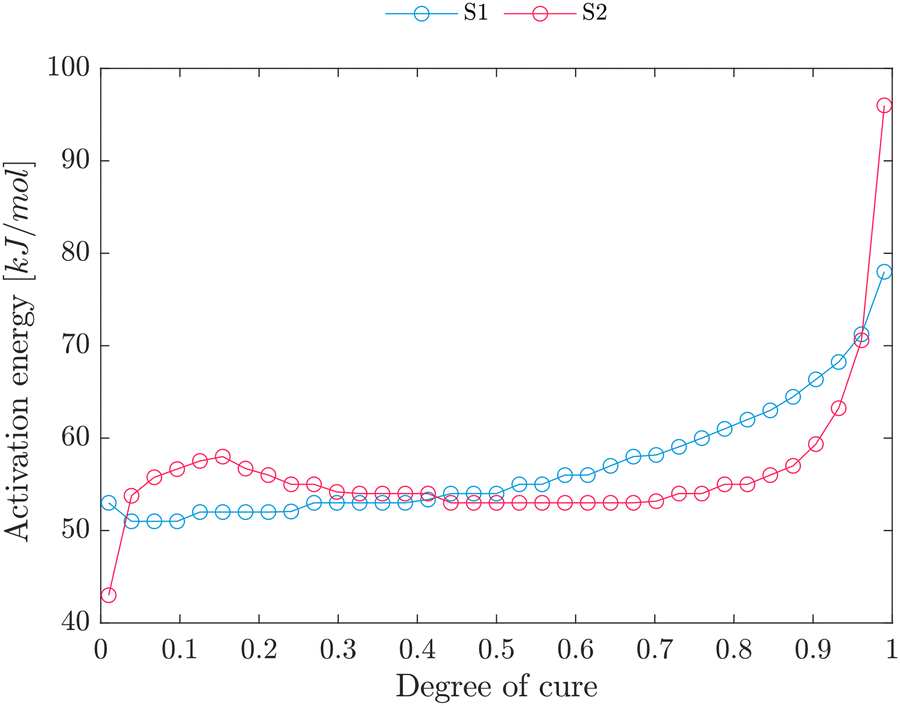 | ||
| Fig. 3 E ξ -Dependency for S1 and S2 derived from the advanced Vyazovkin method (eqn (5) and (6)). | ||
At ξ ≈ 0.6, the close-to-linear relation of activation energy and degree of cure increases, and higher energies are required to maintain the reaction. This higher energy might be explained by the network formation at gelation, accompanied by a substantial viscosity increase, further restricting the adequate activation energy. Once the epoxy curing system has exceeded the gel point, the diminutive molecules (imine, amine and epoxy) may become confined within the polymer matrix, necessitating a series of diffusion jumps before engaging in a chemical reaction.63 This circumstance that the Eα for diffusion is higher than the activation energy of the chemical reaction32 indicates that vitrification does not remarkably restrict the reaction. Further, the final Eα value is well above the activation energy for diffusion of small molecules (20 kJ mol−1).63 Instead, a sub-reaction with a higher activation energy becomes predominant.
For S2, relatively constant activation energies are observed at intervals of 0.1 to 0.9, whereas sudden increases are observed at the initial and final stages of the reaction. The initial activation energies of S2 might be attributed to the higher initial viscosity of the S2 mixture (56.9 Pa s for S1 and 135.9 Pa s S2 at 50 °C).
As is known the primary amine reaction has a lower activation energy than the secondary. Therefore, the overall increase in activation energy can be attributed to a higher ratio of secondary to primary amine curing reactions as the degree of cure increases. This circumstance explains the increase in activation energy in both S1 and S2 and the increase at a higher degree of cure for S2 compared to S1. In that case, primary amines exhaust at a lower degree of cure in S1 due to a lower amine-to-epoxy ratio. At later stages (ξ ≤ 0.7), which corresponds to the gelation point, the viscosity increase causes higher activation energy increases as more energy is required to achieve the motion of molecule chains.61
As indicated in Fig. 3, the change of Eξ emphasises that the crosslinking exhibits a more complex behavior and involves multiple reaction mechanisms that require supplementary investigation. Therefore, a model-based kinetic model approach is selected to model the reaction kinetics.
3.3 Reactions kinetics
For the model-based kinetic modeling, isothermal and dynamic DSC scans were evaluated using multivariate analysis of six measurements at three different heating rates (5, 7.5, 10 K min−1) and three isothermal curing temperatures (120, 140, 160 °C). A parallel reaction approach consisting of an nth-order and an autocatalytic type was selected for describing the reaction behavior of the reactive system for different mixing rations separately: | (11) |
| ki = ki,chem = Aie−Ei/RT, | (12) |
| m | n 1 | A 1 [log(s−1)] | E 1 [kJ mol−1] | n 2 | A 2 [log(s−1)] | E 2 [kJ mol−1] | |
|---|---|---|---|---|---|---|---|
| S1 | 2.45 | 1.36 | 3.08 | 39.13 | 2.73 | 7.81 | 75.02 |
| S2 | 1.06 | 1.09 | 3.71 | 45.26 | 2.88 | 7.62 | 73.51 |
Further, Fig. 4 and 5 compare measured data and the proposed model for both stoichiometries, stating a good agreement between modeling and experimental data.
 | ||
| Fig. 4 Comparison of non-isothermal data and kinetic model for a mixing ratio S1 (left) and S2 (right). | ||
 | ||
| Fig. 5 Comparison of isothermal data and kinetic model for a mixing ratio S1 (left) and S2 (right). The accuracy of the model is assessed by taking measurements at 100 °C and comparing them with the model data. | ||
The comparably smaller total heat flow of S2 compared to S1 is indicated by smaller peak values in the range of 0.41 W g−1 and 0.62 W g−1, respectively. It represents the findings of the less pronounced total reaction enthalpies of S2. Further, Fig. 4 confirms a similar initial Eξ (Fig. 3) as the reaction initialises at temperatures of 50 °C for S1 and S2.
Fig. 6 compares the modeled cure development for isothermal curing of S1 and S2. A slightly faster reaction of S2 can be identified, which manifests strongly at higher conversion levels. Times to reach a degree of cure of 0.7 at 120 °C vary from 445 s to 355 s for S1 and S2, respectively. This seems reasonable as S1 exhibits higher Eξ values then S2 at ξ ≥ 0.4 which might be attributed to the delayed reaction process of S1 at later stages. Further, the excess of amine groups generally increases with increasing amine content.64,65
 | ||
| Fig. 6 Comparison of the isothermal curing process for S1 and S2. | ||
This accurate model provides the basis of process development for the DGEBA/imine/amine systems based on the stoichiometric formulations (S1, S2) utilised within the present paper. Modifying the formulation by altering the epoxy-to-amine hydrogen ratio yields qualitatively similar kinetics with changes in the values of the cure kinetics model parameters as demonstrated for S1 and S2. Similarly, the proposed model is specific to the dynamic imine bonds involved in the formulation and captures their overall effect in terms of both the occurrence of exchange reaction and impact on the crosslinking polymer structure.
3.4 Development of glass transition temperature
Beneath the reaction kinetic modeling, DSC is utilized to partly cure the resin system and provide data for correlating the degree of cure to the glass transition temperature development, which can approximated by the Di-Benedetto equation:66 | (13) |
 | ||
| Fig. 7 Correlation of degree of cure and glass transition temperature for S1 and S2 according to eqn (13). | ||
| λ | T g,0 [°C] | T g,∞ [°C] | |
|---|---|---|---|
| S1 | 0.36 | −16.78 | 82.15 |
| S2 | 0.25 | −15.42 | 71.05 |
The DSC values differ from the value given in the TDS of the resin, which is given with 100 °C according to dynamic mechanical analysis (ASTM 7028) for S1.18 The final Tg should be highest for the stoichiometric composition of resin and hardener.64 A deviation from the stoichiometric composition, both upwards and downwards, results in a reduction in Tg. Typically, Tg increases with the degree of cure (Fig. 7), at the same time yielding a higher crosslink density.67 This correlation suggests that samples processed at the stoichiometric composition exhibit the highest crosslink density, thus yielding the highest Tg. As Tg,∞ of S1 is located above Tg,∞ of S2, S1 is expected to be closer to the stoichiometric mixture.
The topology freezing temperature TV of the investigated imine-based vitrimer system has not been disclosed yet. Since the topology freezing temperature TV in polyimine networks is governed by Tg, it can be assumed that TV is located below or equal to the Tg value.23,68 In addition to the glass transition, the transition from viscoelastic fluid to gel also characterizes a critical point in the processing of vitrimers, as the time for injection and the fiber impregnation process is limited by this transition. Therefore, the gelation point is discussed next.
3.5 Gelation point
Usually, gelation is not indicated as a point of time but rather as the degree of cure ξGP reached at gelation.51,52 The Winter–Chambon criterion and crossover of storage and loss modulus can be applied to indicate the gelation time. Fig. 8 depicts typical features of a sol–gel transition by gelation. The loss modulus G′′ dominates the very early stages of the isothermal curing. However, storage modulus G′ vigorously grows with increasing reaction time. As crossover of storage and loss modulus is strictly valid for balanced stoichiometries,69,70 Winter–Chambon criterion is selected as it is also valid for imbalanced stoichiometries, as shown in the seminal works of Winter and coworkers.50 | ||
| Fig. 8 Determination of the gelation point for S1 (left) and S2 (right) at 90 °C. Triangles indicate frequency-dependent crossover of storage and loss modulus and the diamonds indicate the gelation point according to the Winter–Chambon criterion. | ||
The measured temperature profiles during rheological analysis are used to solve eqn (11) numerically and convert measured gelation time to the present degree of cure ξGP. In this way, the non-isothermal, non-steady state interval at the beginning of the measurement (filling and closing the rheometer, heating up) is also considered in the evaluation. The results of three measurements at different temperatures for S1 and S2 are shown in Table 3. The reported standard deviations might be attributed to slightly different temperature equalization effects during the measurement. Even though applying a defined heating rate could have eliminated the uncontrolled heating at the beginning of the measurement, we selected isothermal measurements to map the process conditions of infusion and molding in isothermal molds.
| T [°C] | t GP [min] | ξ GP | |
|---|---|---|---|
| S1 | 90 | 14.1 ± 0.3 | 0.48 ± 0.02 |
| 110 | 8.1 ± 0.3 | 0.51 ± 0.04 | |
| S2 | 90 | 17.5 ± 0.2 | 0.62 ± 0.01 |
| 110 | 11.4 ± 0.2 | 0.70 ± 0.03 | |
For S1, gelation is reached at an average ξGP of 0.5, which is below the data published for epoxy resins within the range of 0.54–0.77.33,71,72 Still, gelation times and the resulting ξGP slightly vary depending on the temperature. One possibility might include slightly different temperature histories during the loading of the samples and changing temperature gradients within the test specimens.
Further, GP is identified before the crossover point of the storage and loss moduli, which aligns with the observations in ref. 50 for imbalanced stoichiometries. Still, the network junctions were assumed to be due to permanent chemical cross-links only and not due to any other association phenomenon which is to be questioned for the investigated vitrimeric system. Most likely, at designated curing temperatures T > Tv dynamic bond exchange expected to occur at the measurement temperatures. Further, the definition was found for chemical gels which are formed by end-end-linking reaction.50 Therefore, it ignores the existence of side reactions of the commercial reagents.69 A variety of slow side reactions such as homopolymerization of epoxide by etherification or ionic polymerization, cyclization, and various side transformation and degradation reactions, are known for epoxy/amine compounds.73 These circumstances might lead to a reduced gelation time.
Surprisingly, S2 exhibits longer gelation times and, therefore, greater ξGP values. Typically, gelation can be delayed by reducing the amount of crosslinker,74 which was not observed based on our results. Therefore, we assume that, with higher amounts of dynamic covalent bonds, the exchange mechanisms earlier dominate the storage modulus development of S2 and affect the rheological gelation criterion. This is particularly noticeable in the considerably smaller G′ of S2 compared to S1. Higher hardener content reduces the ratio of epoxies to imines and the overall number of permanent crosslinks in the system. Therefore, the structure exhibits more elastic behavior because the ratio of dynamic to permanent bonds in the S2 system is higher, yielding a delayed gelation.
Beneath the gelation time, the viscosity development during the processing is essential to identify a suitable processing window and assess next.
3.6 Viscosity development
The temperature-dependent viscosity development of the resin and hardener constituents and the mixtures S1 and S2 in the incident stage is shown in Fig. 9. The initial viscosity decreases with increasing temperature as a result of enhanced molecular mobility. | ||
| Fig. 9 Temperature dependent change in shear viscosity of epoxy resin (EP) and hardener (H) and the reactive mixture for different mixing ratios. | ||
For this, the temperature-dependent viscosity development is approximated by the Vogel–Fulcher equation (eqn (8)) for the resin and hardener and parameters are summarised in Table 4. Average relative errors  of 0.9% (EP) and 1.6% (H) confirm an excellent agreement between the measurement data and the model.
| η 0 [mPa s] | T A [°C] | T V [°C] |
|
|
|---|---|---|---|---|
| Resin | 0.55 | 282.35 | −29.85 | 0.9 |
| Hardener | 970.78 | 190.92 | −15.36 | 1.6 |
| S1 | 51.47 | 214.36 | −19.77 | — |
| S2 | 119.54 | 206.42 | −18.37 | — |
By applying eqn (10) the viscosity development of stoichiometries S1 and S2 is calculated and depicted in Fig. 10 with the experimental data of S1 and S2. A good agreement between experimental and model data is demonstrated in the incident stage before initiating the curing reaction. At temperatures of 48 °C for S1 and 55 °C for S2, the viscosity starts increasing significantly, which is attributed to the initiation of the curing reaction. For this, below these temperatures, the curing reactions process is of subordinate importance for the viscosity development. This observation is in line with the DSC results (Fig. 4), which confirms the initiation of exothermal heat flow at these temperatures of 45 °C for S1 and 50 °C for S2. The slightly lower temperatures captured during DSC measurements might be attributed to different sample masses utilized during DSC (<5 mg) and rheometer measurement (≈500 mg). Smaller sample masses favor initiating the curing reaction by heat transfer75,76 and yield temperature differences of less than 5 °C for S1 and S2.
 | ||
| Fig. 10 Modeled temperature-dependent change of shear viscosity based on the logarithmic rule of mixture. The square indicates viscosity measured by a viscometer (ASTM D2196) according to the data given in the TDS for S2. | ||
For S2, the uncured material possesses an initial viscosity of 25 Pa s at 70 °C, which is in line with the reported values of 30–50 Pa s in ref. 24 and the viscosities documented in the TDS, which indicates a viscosity of 30 Pa s at 70 °C according to ASTM D2196.18 The viscosities of S1 are consistently located below S2 as the contribution of the high-viscous hardener component decreases.
Beneath the viscosity of the resins in the incident uncured state, which mainly affects the fiber impregnation behavior, the viscosity development during the curing process is measured and captured in Fig. 11. The opposing effect of viscosity increase caused by the initiation of the curing reaction and viscosity decrease by initial heating of the resin sample becomes evident at all temperatures and in both stoichiometries. Following the initial delay, the viscosity increases steadily. The incident viscosities of S2 are located above S1, and with increasing temperature, the incident viscosity decreases. However, deviations between the expected values according to eqn (8), and the measured values are identified. Predicted incident viscosities of 4.3 Pa s and 2.2 Pa s for S1 at 90 °C and 110 °C, respectively are well below the measured viscosities of 12.4 Pa s and 7.5 Pa s.
 | ||
| Fig. 11 Time-dependent complex viscosity development (1 Hz) for isothermal curing at 90 °C and 110 °C. Diamonds indicate gelation times according to Table 3. | ||
This circumstance might be attributed to two causes: (i) the reaction already initiates during the loading of the rheometer plates, and (ii) the initial temperature captured by the thermocouple is probably higher than the bulk temperature of the resin. Both circumstances yield an increased incident viscosity. The incident viscosity is comparably high to the required levels for liquid composite molding, which is typically located in the range of 10–50 mPa s.77–79 As the incline at the gelation point is not as strongly pronounced eqn (9) cannot accurately reflect the behavior of the vitrimeric resin. A pole location at ξ = ξGP seems unsuitable, so that eqn (9) is modified yielding in:
 | (14) |
 .80 In the initial stage, we take a neglectable influence of solid contribution for granted. Further, experimental data confirm η′ ≫ η′′ so that
  is confirmed in the initial stage. Complex viscosity is the only type of viscosity that can be measured above gelation, commonly determined when the steady shear viscosity of the resin approaches infinity. Consequently, chemorheological models use complex viscosity to predict the behavior of reacting polymer systems beyond their gel point.81 This justifies our selection of complex viscosity for the investigated vitrimer, as the pre-gelation (infusion) and post-gelation (malleability, film stacking) are both relevant.
The model data are approximated separately for S1 and S2 (Fig. 12), and Table 5 summarises the parameters of the empirical model. A sufficient agreement between measurement data and fit can be confirmed with average relative errors  of 14.1% for S1 and 12.7% for S2.
 | ||
| Fig. 12 Cure-dependent complex viscosity development for S1 and S2 measured at 1 Hz. | ||
| A | B | C |
|
|
|---|---|---|---|---|
| S1 | 1.26 | −15.60 | 12.95 | 14.1 |
| S2 | 1.08 | −13.82 | 11.63 | 12.7 |

The suggested empirical approach offers the advantage of not implying an instantaneous increase in viscosity at the gel point but rather a considerably smoother transition. Furthermore, eqn (14) captures the viscosity development for an extended range (ξ ≤ 0.85) instead of ξ < ξGP, which may find applications for the forming of semi-finished products in the cross-linked state, such as demonstrated in ref. 14. Moreover, eqn (14) does not require the determination of ξGP. Note that for vitrimers, the evolution of zero-shear viscosity above Tg is not only driven by the the crosslinks but also the temperature-dependent covalent exchanges of dynamic bonds.27 Consequently, the viscosity of vitrimers is, at a certain point, essentially controlled by the bond exchange reaction kinetics, which exhibits Arrhenius-like gradual viscosity variations.1,82 Above Tv, the dynamic exchangeable reaction occurs in a shorter timescale than the timescale of material deformation, leading to the topological rearrangements of the network structure and resultant macroscale flow.82,83 As infinite network formation manifests at gelation,84 which essentially affects the macroscopic behavior of the system,74 the effect of macroscale flow reveals at the gelation point.
Introducing an inflection point through eqn (14) indicates that the complex viscosity development is not strictly dominated by one mechanism (curing reaction) but by various superimposed and partly counteracting mechanisms. After the initial increase in viscosity up to ξ ≈ ξGP, which is characterised by the rapid proceeding of the curing reaction and therefore dominated by the crosslinking, the dynamic exchangeable reaction effect becomes relevant, preventing the exponential growth in viscosity. As the bond exchange mechanism becomes fast at temperatures above Tv, which is located in or below the Tg region23,68 for the investigated imine system, bond exchange is likely to occur during the rheometer measurements. Exposed to elevated temperatures above Tv the viscosity decreases because the cross-links can rearrange, permitting the changes to defuse and the network topology to fluctuate. Therefore, it is reasonable to assume that the further increase in viscosity after gelation is compensated by the exchange of dynamic bonds. For this, the model covers the superimposed effect of crosslinking and the temperature-dependent covalent exchanges of dynamic bonds on the viscosity of the resin. The influence of more dynamic crosslinks becomes evident as more pronounced macroscale flow, and therefore, lower viscosity is measured, although S2 exhibits a higher incident viscosity. Thus, the fraction of dynamic crosslinks anticipates a more pronounced macroscale flow and effect on the complex viscosity. Finally, Fig. 13 summarises the overall complex viscosity development of S1 and S2 based on the suggested model, which covers superimposed effects of crosslinking and dynamic covalent bond exchanges. A comparison with the measurement data reveals shortcomings of the model at low degrees of cure, especially for S1. We consider that the thermal differences between the measured temperature profile and the actual temperature in the sample and the partly undefined heating process may be responsible for this. Still, complex viscosity values for ξ < 0.35 (S1,  ) and ξ < 0.2 (S2,
  ) are well mapped by the model, justifying its application, especially for pre-cured laminates with subsequent hot-pressing or reforming. Although the two similar vitrimeric systems studied can be described well with the proposed model, generalizability and transferability to other systems must be examined. For vitrimeric resins systems particularly suitable for infusion applications, the initial viscosity is expected to be significantly lower (0.01–0.1 Pa s85), so it needs to be confirmed if the suggested model is also capable of depicting a far greater range of viscosity development or if it is limited to vitrimers of high viscous nature.
 | ||
| Fig. 13 Holistic modeling approach to cover temperature and cure-dependence of the complex viscosity development for S1 (left) and S2 (right). | ||
It is worth mentioning that the suggested model covers a broad temperature range and expands the validity range to ξ ≤ 0.85 compared to the Castro–Macosko, providing a comprehensive description of the vitrimeric material behavior. Contrary to intuition, the model demonstrates that stochiometry S2, despite an initially higher viscosity, exhibits lower viscosities at a high degree of crosslinking and is, therefore, better suited for composite thermoforming applications, which are challenging because of the intrinsically high viscosity of vitrimers.14
4. Conclusion
Within the present investigation, a phenomenological cure kinetic model has been developed for an imine-containing epoxy vitrimer, depending on the underlying stochiometry. Further, the development of glass transition temperature and the viscosity during cure were modeled, capturing a broad range of viscosities and covering a relatively high degree of cure, even above the gelation point.The development of activation energy during cure indicates multiple reaction mechanisms and suggests a supplementary investigation founded on model-based kinetic approaches. The selected autocatalytic model accurately describes the underlying curing mechanism of both stoichiometries by adjusting the model parameters. The development of glass transition temperature is described using the Di Benedetto equation.
The suggested chemo-rheological model accurately (average relative errors smaller than 7% for the partly cured state) represents the rheological behavior of the resin, even after gelation. These models capture the superimposed effect of dynamic bond exchange and network formation based on crosslinking and are characteristic of the specific combination of imine bonds and epoxy/amine crosslinking systems. Therefore, the presented results represent an essential prerequisite to guide the application of imine-based vitrimeric systems to individual processing conditions and set the scene for the development of vitrimeric epoxy matrix-based composites.
Abbreviations
| EP | Epoxy resin |
| CANs | Covalent adaptive networks |
| DSC | Differential scanning calorimetry |
| DGEBA | Diglycidyl ether bisphenol A |
| H | Hardener |
| GP | Gelation point |
| TGA | Thermogravimetric analysis |
Author contributions
Niklas Lorenz: conceptualization, data curation, formal analysis, investigation, methodology, validation, visualization, writing – original draft, writing – review & editing. William E. Dyer: visualization, writing – review & editing. Baris Kumru: conceptualization, funding acquisition, writing – review & editing.Data availability
Data for this article, including all diagram data are available at 4TU.Research at https://doi.org/10.4121/53645484-fe11-4b40-bfe4-56691a4f47e0.Conflicts of interest
The authors declare that they have no known competing financial interests or personal relationships that could have appeared to influence the work reported in this paper.Acknowledgements
This project is made possible partly by a contribution from the National Growth Fund program NXTGEN HIGHTECH 01. The authors acknowledge continuous support from ASM department and technical staff. Special thanks to Dimitrios Apostolidis for conducting the TGA measurements and Dr Avishreshth Singh and Michèle van Aggelen from the Pavement Engineering section at Delft University of Technology for support with the multi-wave rheometer measurements.References
- Y. Yang, Y. Xu, Y. Ji and Y. Wei, Prog. Mater. Sci., 2021, 120, 100710 CrossRef CAS.
- F.-L. Jin, X. Li and S.-J. Park, J. Ind. Eng. Chem., 2015, 29, 1–11 CrossRef CAS.
- W. Alabiso and S. Schlogl, Polymers, 2020, 12, 1660 CrossRef CAS PubMed.
- H. Memon, Y. Wei and C. Zhu, Polym. Test., 2022, 105, 107420 CrossRef CAS.
- J. Zheng, Z. M. Png, S. H. Ng, G. X. Tham, E. Ye, S. S. Goh, X. J. Loh and Z. Li, Mater. Today, 2021, 51, 586–625 CrossRef CAS.
- B. Krishnakumar, R. V. S. P. Sanka, W. H. Binder, V. Parthasarthy, S. Rana and N. Karak, Chem. Eng. J., 2020, 385, 123820 CrossRef CAS.
- V. Schenk, K. Labastie, M. Destarac, P. Olivier and M. Guerre, Mater. Adv., 2022, 3, 8012–8029 RSC.
- N. Lorenz, T. Zawadzki, L. Keller, J. Fuchs, K. Fischer and C. Hopmann, Polym. Eng. Sci., 2024, 1–21, DOI:10.1002/pen.26805.
- W. E. Dyer and B. Kumru, Macromol. Chem. Phys., 2023, 224, 2300186 CrossRef CAS.
- S. Zhao and M. M. Abu-Omar, Macromolecules, 2018, 51, 9816–9824 CrossRef CAS.
- J. Han, T. Liu, C. Hao, S. Zhang, B. Guo and J. Zhang, Macromolecules, 2018, 51, 6789–6799 CrossRef CAS.
- H. C. Liu, H. Zhang, H. Wang, X. Huang, G. S. Huang and J. R. Wu, Chem. Eng. J., 2019, 368, 61–70 CrossRef CAS.
- I. Aranberri, M. Landa, E. Elorza, A. M. Salaberria and A. Rekondo, Polym. Test., 2021, 93, 106931 CrossRef CAS.
- S. Weidmann, P. Volk, P. Mitschang and N. Markaide, Composites, Part A, 2022, 154, 106791 CrossRef CAS.
- V. Schenk, J. De Calbiac, R. D’Elia, P. Olivier, K. Labastie, M. Destarac and M. Guerre, ACS Appl. Polym. Mater., 2024, 6, 6087–6095 CrossRef CAS.
- A. Ruiz de Luzuriaga, N. Markaide, A. M. Salaberria, I. Azcune, A. Rekondo and H. J. Grande, Polymers, 2022, 14, 3180 CrossRef CAS PubMed.
- D. Montarnal, M. Capelot, F. Tournilhac and L. Leibler, Science, 2011, 334, 965–968 CrossRef CAS PubMed.
- N.N., VITRIMAX T100™, https://mallinda.com/product/.
- N.N., Aromatic Thermosetting coPolyesters, ATSP, https://www.atspinnovations.com/.
- D. A. Kissounko, P. Taynton and C. Kaffer, Reinf. Plast., 2018, 62, 162–166 CrossRef.
- W. Zhang and P. Taynton, International Pat., WO 2015/138804 A1, 2015 Search PubMed.
- P. Taynton, Y. Luo, H. Rubin, D. Kissounko, S. Loob and S. Sadowski, International Pat., WO 2020/051506 A1, 2020 Search PubMed.
- A. Kandemir, M. L. Longana, I. Hamerton and S. J. Eichhorn, Composites, Part B, 2022, 243, 110139 CrossRef CAS.
- D. R. Palubiski, M. L. Longana, J. M. Dulieu-Barton, I. Hamerton and D. S. Ivanov, Mater. Des., 2023, 235, 112446 CrossRef CAS.
- P. Taynton, H. Ni, C. Zhu, K. Yu, S. Loob, Y. Jin, H. J. Qi and W. Zhang, Adv. Mater., 2016, 28, 2904–2909 CrossRef CAS.
- P. Taynton, K. Yu, R. K. Shoemaker, Y. Jin, H. J. Qi and W. Zhang, Adv. Mater., 2014, 26, 3938–3942 CrossRef CAS PubMed.
- A. Jourdain, R. Asbai, O. Anaya, M. M. Chehimi, E. Drockenmuller and D. Montarnal, Macromolecules, 2020, 53, 1884–1900 CrossRef CAS.
- E. Crawford and A. J. Lesser, J. Polym. Sci., Part B: Polym. Phys., 1998, 36, 1371–1382 CrossRef CAS.
- S. Saseendran, M. Wysocki and J. Varna, Adv. Manuf.: Polym. Compos. Sci., 2017, 3, 92–100 CAS.
- A. Bernath, L. Karger and F. Henning, Polymers, 2016, 8, 390 CrossRef PubMed.
- J. M. Hutchinson, J. Therm. Anal. Calorim., 2009, 98, 579–589 CrossRef CAS.
- S. Vyazovkin, Isoconversional Kinetics of Thermally Stimulated Processes, Springer International Publishing, Switzerland, 2015 Search PubMed.
- C. K. Tziamtzi and K. Chrissafis, Polymer, 2021, 230, 124091 CrossRef CAS.
- M. Stanko and M. Stommel, Polymers, 2018, 10, 698 CrossRef PubMed.
- H. E. Kissinger, Anal. Chem., 1957, 29, 1702–1706 CrossRef CAS.
- T. Ozawa, Bull. Chem. Soc. Jpn., 1965, 38, 1881–1886 CrossRef CAS.
- J. H. Flynn and L. A. Wall, J. Polym. Sci., Part B: Polym. Lett., 1966, 4, 323–328 CrossRef CAS.
- S. Vyazovkin, J. Therm. Anal., 1997, 49, 1493–1499 CrossRef CAS.
- H. L. Friedman, J. Polym. Sci., Part C: Polym. Symp., 1964, 6, 183–195 CrossRef.
- S. Vyazovkin and N. Sbirrazzuoli, Macromolecules, 1996, 29, 1867–1873 CrossRef CAS.
- N. Sbirrazzuoli, Y. Girault and L. Elégant, Thermochim. Acta, 1997, 293, 25–37 CrossRef CAS.
- N. Sbirrazzuoli, Thermochim. Acta, 2013, 564, 59–69 CrossRef CAS.
- S. Vyazovkin, J. Comput. Chem., 2000, 22, 178–183 CrossRef.
- H. H. Winter, Polym. Eng. Sci., 2004, 27, 1698–1702 CrossRef.
- L. Núñez-Regueira, C. A. Gracia-Fernández and S. Gómez-Barreiro, Polymer, 2005, 46, 5979–5985 CrossRef.
- J. Smolen, P. Olesik, P. Gradon, M. Chudy, B. Mendala and M. Koziol, Materials, 2021, 14, 6022 CrossRef CAS PubMed.
- M. Müller-Pabel, J. A. Rodríguez Agudo and M. Gude, Polym. Test., 2022, 114, 107701 CrossRef.
- D. J. O'Brien, P. T. Mather and S. R. White, J. Compos. Mater., 2001, 35, 883–904 CrossRef.
- M. Hossain, PhD, Universität Erlangen-Nürnberg, 2010 Search PubMed.
- F. Chambon and H. H. Winter, J. Rheol., 1987, 31, 683–697 CrossRef CAS.
- A. A. Shimkin, Russ. J. Gen. Chem., 2016, 86, 1488–1493 CrossRef CAS.
- R. Pethrick, Prog. Polym. Sci., 2002, 27, 1983–2017 CrossRef CAS.
- J. M. Castro and C. W. Macosko, Am. Inst. Chem. Eng. J., 2004, 28, 250–260 CrossRef.
- R. Geissberger, J. Maldonado, N. Bahamonde, A. Keller, C. Dransfeld and K. Masania, Composites, Part B, 2017, 124, 182–189 CrossRef CAS.
- J.-Y. Lai, T.-Y. Chen, M.-H. Wang, M.-K. Shih, D. Tarng and C.-P. Hung, presented in part at the IEEE 67th Electronic Components and Technology Conference, Orlando, FL, USA, 2017, 2017.
- C. Y. Khor, M. Z. Abdullah, Z. M. Ariff and W. C. Leong, Int. Commun. Heat Mass Transfer, 2012, 39, 670–680 CrossRef.
- J. C. Domínguez, M. V. Alonso, M. Oliet, E. Rojo and F. Rodríguez, Thermochim. Acta, 2010, 498, 39–44 CrossRef.
- Q. P. V. Fontana, Composites, Part A, 1998, 29, 153–158 CrossRef.
- G. Strobl, The Physics of Polymers, Springer-Verlag, Berlin Heidelberg, 2007 Search PubMed.
- S. Rusakov, V. Gilev and A. Rakhmanov, MATEC Web Conf., 2022, 362, 01026 CrossRef CAS.
- H. Cai, P. Li, G. Sui, Y. Yu, G. Li, X. Yang and S. Ryu, Thermochim. Acta, 2008, 473, 101–105 CrossRef CAS.
- S. Vyazovkin, A. Mititelu and N. Sbirrazzuoli, Macromol. Rapid Commun., 2003, 24, 1060–1065 CrossRef CAS.
- N. Sbirrazzuoli, S. Vyazovkin, A. Mititelu, C. Sladic and L. Vincent, Macromol. Chem. Phys., 2003, 204, 1815–1821 CrossRef CAS.
- M. R. Vanlandingham, R. F. Eduljee and J. W. Gillespie, J. Appl. Polym. Sci., 1999, 71, 699–712 CrossRef CAS.
- M. C. Finzel, J. Delong and M. C. Hawley, J. Polym. Sci., Part A: Polym. Chem., 1995, 33, 673–689 CrossRef CAS.
- J. P. Pascault and R. J. J. Williams, J. Polym. Sci., Part B: Polym. Phys., 2003, 28, 85–95 CrossRef.
- S. L. Simon and J. K. Gillham, J. Appl. Polym. Sci., 1994, 53, 709–727 CrossRef CAS.
- S. Dhers, G. Vantomme and L. Avérous, Green Chem., 2019, 21, 1596–1601 RSC.
- F. Snijkers, R. Pasquino and A. Maffezzoli, Soft Matter, 2016, 13, 258–268 RSC.
- H. H. Winter and F. Chambon, J. Rheol., 1986, 30, 367–382 CrossRef CAS.
- N. Lorenz, M. Müller-Pabel, J. Gerritzen, J. Müller, B. Gröger, D. Schneider, K. Fischer, M. Gude and C. Hopmann, Polym. Test., 2022, 108, 107498 CrossRef CAS.
- F. Groh, E. Kappel, C. Hühne and W. Brymerski, Compos. Struct., 2019, 207, 923–934 CrossRef.
- L. Matějka, Macromolecules, 2000, 33, 3611–3619 CrossRef.
- T. Vidil, F. Tournilhac, S. Musso, A. Robisson and L. Leibler, Prog. Polym. Sci., 2016, 62, 126–179 CrossRef CAS.
- N. Lorenz, C. Hopmann and K. Fischer, presented in part at the 2nd International Symposium on Plastics Technology, Aachen, 2023.
- M. Demleitner, S. A. Sanchez-Vazquez, D. Raps, G. Bakis, T. Pflock, A. Chaloupka, S. Schmölzer and V. Altstädt, Polym. Compos., 2019, 40, 4500–4509 CrossRef CAS.
- Hexcel, HexFlow® RTM6-2, Technical data sheet, https://www.hexcel.com/user_area/content_media/raw/RTM6_RTM62_HexFlow_DataSheet(1).pdf, (accessed 11.07.2024).
- Westlake Epoxy, Epikote System 600, Technical data sheet).
- Syensqo, CYCOM 890 RTM, Technical data sheet, https://www.syensqo.com/en/product/cycom-890-rtm#product-documents, (accessed 11.07.2024).
- S. P. Li, G. Zhao and H. Y. Chen, J. Dispersion Sci. Technol., 2005, 26, 415–419 CrossRef CAS.
- J. C. Domínguez, in Thermosets, ed. Q. Guo, Elsevier, Amsterdam, Netherlands, 2018, ch. 4, pp. 115–146 Search PubMed.
- W. Denissen, J. M. Winne and F. E. Du Prez, Chem. Sci., 2016, 7, 30–38 RSC.
- H. Fang, W. Ye, Y. Ding and H. H. Winter, Macromolecules, 2020, 53, 4855–4862 CrossRef CAS.
- D. R. Miller and C. W. Macosko, Macromolecules, 1976, 9, 206–211 CrossRef CAS.
- F. I. Anagwu and A. A. Skordos, Polymer, 2023, 288, 126427 CrossRef CAS.
| This journal is © The Royal Society of Chemistry 2024 |