 Open Access Article
Creative Commons Attribution 3.0 Unported Licence
The effect of particle geometry and initial configuration on the phase behavior of twisted convex n-prisms
Poshika
Gandhi
 * and
Anja
Kuhnhold

Institute of Physics, University of Freiburg, Hermann-Herder-Str. 3, 79104 Freiburg, Germany. E-mail: poshika.gandhi@physik.uni-freiburg.de; anja.kuhnhold@physik.uni-freiburg.de
First published on 17th June 2024
Abstract
We study the phase behavior of twisted convex n-prisms with n = 3 and 4, via Monte Carlo simulations. Biaxial phases, in untwisted prisms, can be induced by choosing specific geometries of the prisms. However, due to the convexity of the twisted particles, a strong twisting disables the formation of biaxial phases and stabilizes uniaxial nematic and smectic phases. Using the increased volume of the twisted convex particles, we define an effective aspect ratio of the twisted prisms and find a homogeneous phase behavior across the geometry of the prisms’ cross-section and even across different shapes of the cross-section. In this representation biaxial phases are found for large aspect ratios, while the low aspect ratio behavior can be compared to the hard cylinder phase diagram. For 3-prisms with a small base angle, we show the influence of the initial configuration; a polar initial configuration results in a (polar) splay nematic phase, whereas a non-polar initial configuration results in a biaxial phase.
1 Introduction
From studying the mechanisms of phase transitions to exploring the mutual effect of jamming and flow dynamics,1–3 the usage of simple models can give pivotal insight, making simulations of hard non-spherical particle systems a cornerstone of liquid crystal research.4–6 The physical properties of particles, like their shape and size, can have a significant impact on the system's bulk behavior. For example, rod-like particles have proven to be more efficient as depletants than spherical particles7 and they also have a decreasing percolation threshold with increasing particle length.8,9 Although actual molecules used in experiments usually have more complex properties, findings from such simple models can be transferred to applications. Some of the commonly simulated hard particle models include spheres, platelets, cylinders, spherocylinders, banana-shaped particles, etc.10–21![[thin space (1/6-em)]](https://www.rsc.org/images/entities/char_2009.gif) † All these particle models tend to have curved surfaces, as flat surfaces and sharp edges are costly to simulate. In a 2016 paper, Dussi and Dijkstra22 performed simulations on a novel particle shape from a class of hard polyhedra – a twisted triangular prism (TTP). The particles were triangular prisms with the added shape anisotropy of twist, such that the resulting shape was concave, i.e. the twisted prism has grooves and its center is thinner than that of the untwisted one. They found a very rich phase behavior depending on the cross-section and the twist of the TTP. For the study presented in this paper, we took the same class of particles but added a convex twisting instead, forming anti-prisms that expand in volume with the twist. In addition, we looked at higher polygon prisms to see if any predictive results can be derived from going up the polygon-side scale.
† All these particle models tend to have curved surfaces, as flat surfaces and sharp edges are costly to simulate. In a 2016 paper, Dussi and Dijkstra22 performed simulations on a novel particle shape from a class of hard polyhedra – a twisted triangular prism (TTP). The particles were triangular prisms with the added shape anisotropy of twist, such that the resulting shape was concave, i.e. the twisted prism has grooves and its center is thinner than that of the untwisted one. They found a very rich phase behavior depending on the cross-section and the twist of the TTP. For the study presented in this paper, we took the same class of particles but added a convex twisting instead, forming anti-prisms that expand in volume with the twist. In addition, we looked at higher polygon prisms to see if any predictive results can be derived from going up the polygon-side scale.
The studied prisms are biaxial particles defined by having a long axis and two shorter axes. These particles have competing rod-like and plate-like tendencies which lead to the formation of nematic phases either along the long or a short axis.23 However along Straley's line, where the shape parameters (long axis length u, short axes lengths v and w) fulfill the relation  (self-duality),24 the particles are expected to form biaxial phases, as Straley's line is the division between the rod-like and plate-like ordering. This predicted behavior has been observed for a variety of biaxial particle shapes.25–29 Similarly for the n-prisms studied here, the prolate nematic phase is expected for
  and the oblate nematic phase for
  .
.
Board-like particles (4-prisms), especially, received attention in theoretical, simulational, and experimental works due to the debates about the stability of their biaxial nematic phases. Cuetos et al. confirmed the division of prolate and oblate nematic phases along Straley's line but could not find a biaxial nematic phase (neither from their theoretical approach nor by simulations).26 They concluded that the formation of a (biaxial) smectic phase preempts the formation of the biaxial nematic. On the other hand, there are experimental realizations of a biaxial nematic phase of self-dual particles that, in addition, are polydisperse.30 Van den Pol et al. also suggested that in this case the polydispersity has a stabilizing effect on the biaxial nematic phase. This effect was theoretically confirmed by Belli et al.31 The same authors also studied the effect of adding depletants to a system of board-like particles, which can result in stabilizing prolate, oblate, or biaxial nematic phases.32 Peroukidis and Vanakaras showed that not only the duality of the particles is important for the formation of biaxial phases but they found a critical aspect ratio (u/w = 9) below which the biaxial phase vanishes even for dual-shaped particles.27 This confirmed the predictions of Shih and Alben, who predicted that the biaxial particle needs to be “sufficiently asymmetrical” to produce biaxial phases23 and also explains previous results, e.g. by Martnez-Ratón et al., who applied fundamental measure theory to a system of hard board-like particles.33
A 3-prism, that has a triangular cross-section, in addition to being biaxial, is also a polar shape, i.e. it does not have the inversion symmetry. From an application point of view, it is interesting to know whether this polarity can be transferred to the macroscopic (phase) behavior. The ferroelectricity of splay nematics is a typical example that has been studied recently.34–36 But also, the effect of the shape of the prism on the behavior of the seemingly well-known isotropic, nematic, and smectic phases found interest.37
Here, we present phase diagrams of 3- and 4-prisms with convex twist and varying shape parameters. Biaxial phases are found for specific sets of parameters and both types of cross-sections, whereas the formation of a polar phase strongly depends on the initial configuration.
2 Model
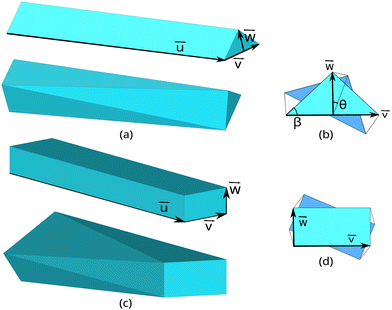
The particle is a polygonal prism (n-prism), with a convex twist as an additional form of asymmetry. The prism consists of two non-coplanar n-sided polygons such that the line joining their centers is perpendicular to both the n-gonal planes. The n-gons are joined by 2n right-triangles, instead of the usual n rectangles, to allow for a twist in the shape. This twist is defined as the rotation of one end of the prism with respect to the other end by an angle θ, as shown in Fig. 1. After the rotation, the 2n triangles can be realised in two ways depending on the choice of connected vertices, leading to either a concave particle with a decrease in the particle volume,22 or a convex particle with an increase in the particle volume. The convex twist turns the n-prism into an n-antiprism, where the two n-gons are connected by a band of alternating triangles. In this paper we report simulations of 3- and 4-prisms with a convex twist, as depicted in Fig. 1, as an extension to the work on 3-prisms with a concave twist by Dussi and Dijkstra.22 All 3-prisms are modeled with an isosceles cross-sectional triangle, and all 4-prisms with a rectangle as the cross-sectional quadrilateral.Each particle is overlaid with an orthonormal coordinate system to define its orientation in three-dimensional (3D) space as shown in Fig. 1. The vector ![[u with combining right harpoon above (vector)]](https://www.rsc.org/images/entities/i_char_0075_20d1.gif) defines the long axis of the particle (with length vector
defines the long axis of the particle (with length vector ![[u with combining right harpoon above (vector)]](https://www.rsc.org/images/entities/i_char_0075_20d1.gif) =: uû) and the vectors
=: uû) and the vectors  and
and ![[w with combining right harpoon above (vector)]](https://www.rsc.org/images/entities/i_char_0077_20d1.gif) (=: wŵ) together define the cross-sectional n-gon. For the 3-prism, v and w are the base length and height of the triangle, and for the 4-prism, v and w are the width and height of the rectangle. As in the limit of infinite n the n-prisms form a cylinder, we can write the volume of an n-prism with twist θ in terms of an effective cylinder of diameter deff and length u as,
(=: wŵ) together define the cross-sectional n-gon. For the 3-prism, v and w are the base length and height of the triangle, and for the 4-prism, v and w are the width and height of the rectangle. As in the limit of infinite n the n-prisms form a cylinder, we can write the volume of an n-prism with twist θ in terms of an effective cylinder of diameter deff and length u as,
 | (1) |
 | (2) |
The volume of a twisted n-prism, Vθ, is calculated by considering it as a combination of tetrahedrons. Each face of the n-prism forms the base of the tetrahedron and the center of the prism forms the apex. The center of the prism lies at the halfway point of the line joining the n-gon centers. For a 3-prism, the centroid is considered to be the center and for a 4-prism, the intersection of the diagonals is considered as the center. As all the vertices, including the apex, are known, the volume of the n-prism can be written as,
 | (3) |
3 Simulations
Simulations follow the Metropolis Monte Carlo (MC) algorithm in the NVT ensemble with periodic boundary conditions in all three dimensions. The simulations are performed with at least 2000 particles and 106 MC sweeps, where each MC sweep contains as many steps as the number of particles. Each MC step can lead to a translational move, a rotational move along an arbitrary axis, or a rotational move along the particle's long axis. As the particles only interact via excluded volume interactions, after each step the moved/rotated particle is checked for overlaps with its neighboring particles. The overlap mechanism used for the simulations relies on the separating axes theorem,38 with slight modifications for edge–edge overlap. The details of the modification are given in the appendix.For the initial configuration the particles are put on a simple cubic lattice and have their long axes aligned. As 3-prisms can form polar phases, we tested both polar (ŵ aligned) and non-polar initial conditions. The polar initial configuration mimics the effect of a temporary aligning field that could be used in applications to bias the formation of polar phases. During the equilibration, the maximum displacement and maximum rotation angle are adjusted to give acceptance rates between 0.45 and 0.55. Translations along the long axis have a larger step size compared to those in other directions to speed up the equilibration and the exploration of configuration space. For all simulations, the parameters u and v have fixed values of 5.0 and 1.0 respectively.
The equilibrium phases are identified using orientational order parameters, positional density data, and visual inspection of the snapshots. The nematic order parameter Sx for x ∈ {û, ![[v with combining circumflex]](https://www.rsc.org/images/entities/i_char_0076_0302.gif) , ŵ} is defined as the largest eigenvalue of the tensor Qx, whose components are given by
, ŵ} is defined as the largest eigenvalue of the tensor Qx, whose components are given by
 | (4) |
![[n with combining circumflex]](https://www.rsc.org/images/entities/i_char_006e_0302.gif) x for the chosen direction x.
x for the chosen direction x.
For each molecular axis x ∈ {û, ![[v with combining circumflex]](https://www.rsc.org/images/entities/i_char_0076_0302.gif) , ŵ}, a biaxial order parameter can be defined using the three tensors (Qu, Qv, Qw) and their eigenvectors. However, it is sufficient to measure the biaxiality with respect to a primary axis only. The eigenvector corresponding to the largest of the three nematic order parameters Sx is chosen as the primary axis
, ŵ}, a biaxial order parameter can be defined using the three tensors (Qu, Qv, Qw) and their eigenvectors. However, it is sufficient to measure the biaxiality with respect to a primary axis only. The eigenvector corresponding to the largest of the three nematic order parameters Sx is chosen as the primary axis ![[n with combining circumflex]](https://www.rsc.org/images/entities/i_char_006e_0302.gif) x. The eigenvectors corresponding to the remaining nematic order parameters are labelled as
x. The eigenvectors corresponding to the remaining nematic order parameters are labelled as ![[m with combining circumflex]](https://www.rsc.org/images/entities/i_char_006d_0302.gif) and
and ![[l with combining circumflex]](https://www.rsc.org/images/entities/i_char_006c_0302.gif) . For example, if the particles are primarily aligned along their long axis û, then the primary axis
. For example, if the particles are primarily aligned along their long axis û, then the primary axis ![[n with combining circumflex]](https://www.rsc.org/images/entities/i_char_006e_0302.gif) is the nematic director regarding û, and the nematic directors w.r.t the molecular axes
is the nematic director regarding û, and the nematic directors w.r.t the molecular axes ![[v with combining circumflex]](https://www.rsc.org/images/entities/i_char_0076_0302.gif) and ŵ form the axes
and ŵ form the axes ![[m with combining circumflex]](https://www.rsc.org/images/entities/i_char_006d_0302.gif) and
and ![[l with combining circumflex]](https://www.rsc.org/images/entities/i_char_006c_0302.gif) . The biaxial order parameter Bp corresponding to this primary axis can be defined as,26,39
. The biaxial order parameter Bp corresponding to this primary axis can be defined as,26,39
 | (5) |
 | (6) |
A system is labeled ‘equilibrated’ when the order parameters fluctuate around a mean value for at least 105 MC sweeps. For splay nematic phases, where the effect of the initial configuration is found, the order parameters are required to be stable for at least 5 × 10⁵ MC sweeps. The positional heat maps and visual inspections of the snapshots are used to check whether the smectic planes or the splay fault lines are still moving within the simulation box, in which cases the runs are continued even when the order parameters have stabilised.
Depending on the nematic order parameters Sx for x ∈ {û, ![[v with combining circumflex]](https://www.rsc.org/images/entities/i_char_0076_0302.gif) , ŵ}, the biaxial order parameters Bp, the smectic order parameter Λ, and the heat maps for particle density, we identify the following phases: isotropic (I): random orientation of all particle axes (0.0 < Sx < 0.3); prolate nematic (Nu): alignment of the long û-axes (Su > 0.3, Sw < 0.3, Bu < 0.5); oblate nematic (Nw): alignment of the short ŵ-axes (Sw > 0.3, Su < 0.3, Bw < 0.5); biaxial nematic (Nb): alignment of the long and short axes (Sx > 0.3, Bp > 0.5, Λ < 0.5); smectic A (Smu): alignment of the long axes plus layering along the director
, ŵ}, the biaxial order parameters Bp, the smectic order parameter Λ, and the heat maps for particle density, we identify the following phases: isotropic (I): random orientation of all particle axes (0.0 < Sx < 0.3); prolate nematic (Nu): alignment of the long û-axes (Su > 0.3, Sw < 0.3, Bu < 0.5); oblate nematic (Nw): alignment of the short ŵ-axes (Sw > 0.3, Su < 0.3, Bw < 0.5); biaxial nematic (Nb): alignment of the long and short axes (Sx > 0.3, Bp > 0.5, Λ < 0.5); smectic A (Smu): alignment of the long axes plus layering along the director ![[n with combining circumflex]](https://www.rsc.org/images/entities/i_char_006e_0302.gif) u (Λ > 0.5); biaxial smectic (Smb): alignment of the long and short axes plus layering along the directors
u (Λ > 0.5); biaxial smectic (Smb): alignment of the long and short axes plus layering along the directors ![[n with combining circumflex]](https://www.rsc.org/images/entities/i_char_006e_0302.gif) u and
u and ![[n with combining circumflex]](https://www.rsc.org/images/entities/i_char_006e_0302.gif) w (Bp > 0.5, Λ > 0.5).
w (Bp > 0.5, Λ > 0.5).
4 Results and discussion
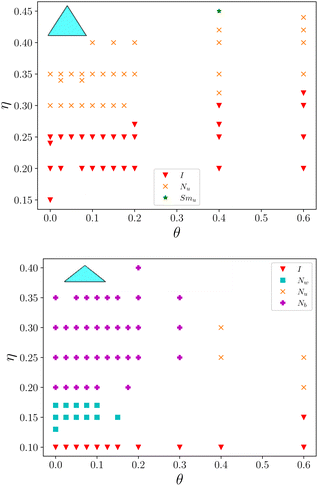
Fig. 2 and 3 show the effect of the twist angle θ on 3- and 4-prisms, respectively. Consistently, for all simulated shapes, the increase in θ leads to a larger region of the I phase in the phase diagrams. In addition, for θ ≥ 0.4 rad (≈22.9°) only the Nu phase is found irrespective whether the particle formed a Nu or Nw phase at θ = 0.
Fig. 2 (top) shows the phase diagram of 3-prisms with β = 1.0 rad (≈57.3°) and  . For zero twist, they form the I phase at low volume fractions and the Nu phase for all studied volume fractions above η = 0.30, as expected from previous studies about triangular prisms.37 As θ is increased, the range of the I phase increases. For Fig. 2 (bottom), the zero twist configuration for β = 0.45 rad (≈25.8°), with
  shows a small I and Nw region for low volume densities and a Nb phase with
 ![[u with combining right harpoon above (vector)]](https://www.rsc.org/images/entities/i_char_0075_20d1.gif) as the primary axis for η ≥ 0.2, which is again in agreement with previous results, where a transition Nw–Nb was found above a threshold of u/w = 11.29 The tendency to align along the long axis becomes apparent as θ is increased, and the Nb phase is lost. For 3-prisms, the Nb phase was also observed for particles with smaller β where
as the primary axis for η ≥ 0.2, which is again in agreement with previous results, where a transition Nw–Nb was found above a threshold of u/w = 11.29 The tendency to align along the long axis becomes apparent as θ is increased, and the Nb phase is lost. For 3-prisms, the Nb phase was also observed for particles with smaller β where  .
.
Fig. 3 shows the phase diagrams of 4-prisms in the η − θ representation. For 4-prisms with w = 1.0 and 0.5, as  , the Nu phase is expected. This is confirmed for w = 1.0 in Fig. 3 (left). The result is comparable to the phase behavior of hard colloidal tetragonal parallelepipeds studied by John and Escobedo.28 However, they conclude that the prolate nematic phase only becomes stable for u/v > 5 while we already find it for u/v = 5. For volume fractions larger than the ones we studied, they find a smectic phase; this appears in our volume fraction range for non-zero twist. As θ is increased, the Nu phase region shrinks with a direct I − Smu transition appearing for θ = 0.6. For w = 0.5 in Fig. 3 (center), the Smu phase is observed for θ = 0 and η ≥ 0.45. As seen before, the increasing θ shrinks the Nu phase to allude to a direct I − Smu for θs larger than considered for this paper. For 4-prisms with w = 0.2 (Fig. 3 (right)), the board-like particles at zero twist show I, Nw, Nb, and Smb phases. As θ increases the uniaxial Smu phase appears between the Nb and the Smb phase. On further increase of θ, the Nw and lower-η Nb phases turn into Nu, and Smb disappears from the parameter space explored. The Nb phase was obtained for the zero twist dual shape with u/w = 25 and v/w = 5, which is in agreement with the predictions that u/w > 23 is needed for the Nb phase.29 However, ref. 29 also predicts an intervening Smu phase for u/w < 28, whereas we observe a direct Nb − Smb transition for u/w = 25, as shown in Fig. 3 (right). Thin board-like particles showed a stable Smw phase in ref. 26 however we did not find traces of such a phase.
For both 3- and 4-prisms, a direct I − Nb transition was not found in agreement with several studies,26,29 but in contrast to the thin board-like spheroplatelet particles that showed a I − Nb − Smu transition along the dual shape.27,41 In ref. 42 a direct I − Smu transition was found for 4-prisms with a square cross-section and not a Nu phase. This is in contrast to our simulations (Fig. 3 (left)).
Twisting distorts the sides of the n-prism in order to accommodate the rotation, making the shape no longer conducive for stacking. The increase in the particle volume and decrease in the aspect ratio with θ further alludes to the fact that the particle shape is no longer capable of sustaining oblate and biaxial nematic phases and shows more rod-like tendencies than plate-like (in terms of the distinction using Straley's line). The shift of the phase boundaries towards larger η is, hence, a consequence of the decreasing aspect ratio of the particle.
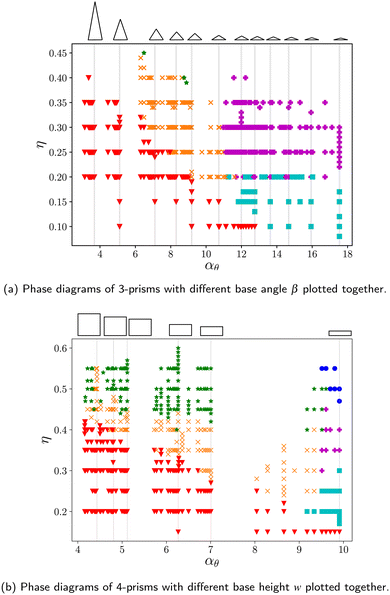
The n-prisms with a concave twist were reported to form several chiral nematic phases with periodic boundary conditions in ref. 22. In general, it is not trivial to simulate chiral nematic phases because the cholesteric pitch can be much larger than the simulation box length, and periodic boundaries suppress the formation of a chiral nematic phase with equilibrium pitch. Several approaches have been introduced to tackle this problem, e.g. twisted or self-determined boundary conditions or using hard walls.43–45 The convex twist has however, for the simulated parameters and volume fractions, been incapable of producing chiral nematic phases, both for periodic boundaries and hard walls. As compared to the concave twisting, nematic phases also appear at much larger volume fractions. This can be due to the fact that convex twisting increases the volume of the particle significantly, thus lowering its aspect ratio. As the defined aspect ratio of an n-prism is seemingly independent of the shape of the particle, we plotted the results of all the 3-prisms together in Fig. 4a, and the results of all the 4-prisms together in Fig. 4b. The grey lines in both the graphs correspond to θ = 0 for the particle shape shown above it. The sizes of the 3- and 4-prisms are characteristic of their actual sizes in the simulations in relation to other 3- and 4-prisms. As θ increases, the aspect ratio αθ decreases and the data points lie to the left of the grey line. Therefore, overlaps in the data between twisted n-prisms and the untwisted n-prisms with a different cross-section occur frequently. These graphs show strong correlations between the stable phases at a particular volume fraction with the aspect ratio without much dependency on the particle shape. The regions of transition between the phases follow consistent trends, even when the exact transition lines seem to depend on the particle shape. Next, in Fig. 5 the data for both 3- and 4-prisms is plotted together, and the phase diagrams coincide surprisingly well. This implies that the volume occupied by a particle is a bigger determining factor in the entropic stability of the resulting phase as compared to the particle's shape. The observed stable phases around αθ = 10, however, vary between the I, Nu phases found for n-prisms with  or large θ, and the I, Nw, Nb phases found for n-prisms with
  . This can be due to the prediction23 that the particles need to be “sufficiently asymmetrical” to produce biaxial phases. In addition, the regions of the I, Nu, and Smu phases agree with the ones of hard cylinders.16
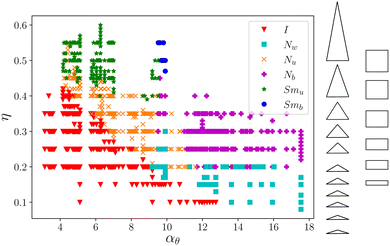 | ||
| Fig. 5 Phase diagrams of both 3-prisms and 4-prisms plotted together as a function of their aspect ratio with a sketch of the size comparison between the particle shapes. | ||
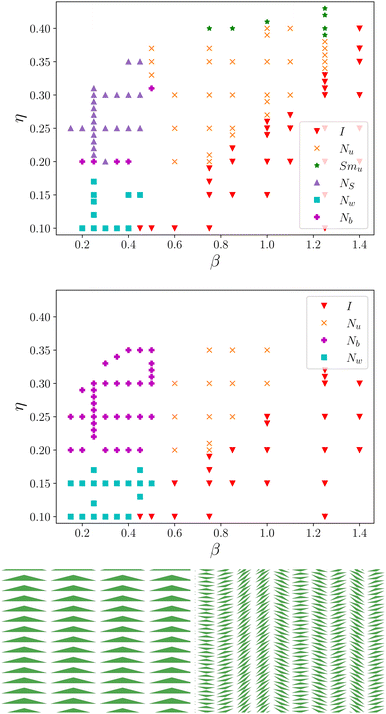
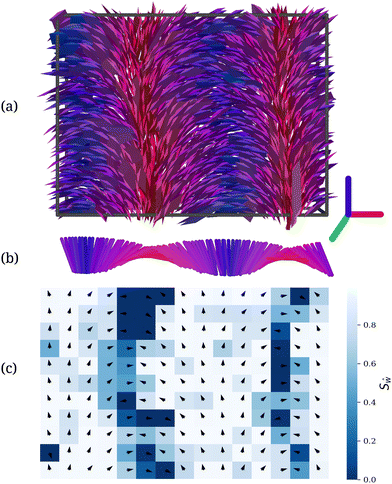
Just like the chiral nematic phases, the splay nematic phase22 was also not obtained in our simulations. All simulations for 3-prisms were setup with non-polar initial configurations, however introducing polarity at the setup leads to the emergence of the splay nematic phase (NS), see Fig. 6 (bottom). This phase is characterized by a nematic order of the long axes and a splay deformation in the director field of the ŵ-axes. Fig. 6 shows the effect of a polar initial configuration on the phase diagram, and Fig. 7 shows a snapshot of the phase along with the characteristic director profiles. For non-polar initial configurations, the region with β < 0.6 rad (≈34.3°) and η ≥ 0.20 mainly forms the biaxial nematic phase (Nb). However, for polar initial configurations, the splay nematic phase dominates. In addition, the Nu phase emerges at a lower β for a polar initial configuration. The NS phase stays stable till at least θ = 0.2 rad (≈11.4°), beyond which the simulations at suitable volume fractions could not be performed. We did not compute the free energy of the different states to be able to judge which of the modulated nematic phases is the stable equilibrium phase, but it is likely that the barrier between them is very large, and thus a transition very unlikely, which in turn is a relevant finding for possible applications of polar phases. There are further hints that a double splay phase might have a lower free energy than the single splay phase, which has been reported more commonly in both experiments and simulation studies.46 For the rest of the phase diagram, the simulated parameters produced phases independent of the initial configuration.
5 Conclusion
We studied the phase diagrams of twisted 3- and 4-prisms using extensive Monte Carlo simulations. Twist as a form of asymmetry in a particle makes a drastic change to the particle shape and the volume it occupies. We observed that twist affects all the n-prisms similarly. As θ increases, the phase boundaries shift towards higher volume fractions. In addition, if a modulated nematic phase emerges for the untwisted prisms (Nu, Nw, or NS), it gives way to a I − Nu − Smu phase combination, even hinting at a I − Smu transition at higher θ. These results are unlike the effects for concave twisting,22 where the untwisted phase is sustained for large θs, and that even induces a blue phase. Even though both concave and convex twisting remove stacking opportunities for the particles, a concave twist creates crevices in the shape which allows particles to slide into each other. Convex twisting, on the other hand, increases the particle volume making the shape behave, qualitatively, like a hard cylinder. For n-prisms with larger n, we expect a similar behavior – existence of modulated nematic phases for asymmetrical cross-sectional n-gons, which evolve quickly into Nu and Smu phases. Convex twisting, also, did not produce any signs of a chiral nematic phase.For the dual shapes, the Nb phase was found for 3-prisms with u/w > 20 and for 4-prisms with u/w = 25, and was stable across a large range of volume fractions. No direct I − Nb transition was found, rather a small region of Nw phase preceded the Nb. For thin board-like 4-prisms, a direct Nb − Smb phase transition was observed without an intervening Smu phase and the existence of a Smw phase could not be confirmed in our simulations. In addition, for all simulated shapes no direct I − Smu was found for untwisted shapes.
Remarkably, we found an almost uniform phase behavior by introducing an effective aspect ratio of twisted n-prisms. Convex twisting leads to an increasing volume of the particles, which in turn reduces their effective aspect ratio. The phases in the volume fraction – effective aspect ratio diagram overlap independent of the geometry (shape and side lengths) of the prisms' cross-section.
For particle shapes with inherent polarity, the initial configuration of the setup played a significant role in the phase they formed. A polar splay nematic phase was formed when the starting configuration was also polar. The NS was stable over large ranges of η and β, and opens opportunities to form polar phases by just using an initial polar configuration.
For larger volume fractions than studied in this paper, one could compare the phase behavior to the one of the corresponding two-dimensional system (hard triangles for n = 3 and hard rectangles for n = 4),47–50 and determine the effect of the third dimension and of the convex (or concave) twist.
Author contributions
Conceptualization: PG and AK; formal analysis, investigation, software, visualization: PG; funding acquisition, supervision: AK; writing – original draft: PG; writing – review & editing: PG and AK.Conflicts of interest
There are no conflicts to declare.Appendix
Appendix A Overlapping mechanism
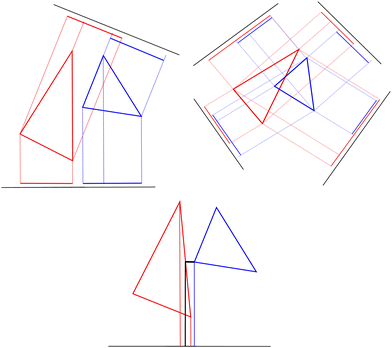
A convex polyhedron I is described by the set of its vertices VI, which can be paired together to form edges EI. The relevant edges can be grouped into faces defined by an outward facing normal NI. An overlap between these convex polyhedrons can then be discovered using the hyperplane separation theorem. In intersection/collision detection, it takes the form of a separating axis theorem.38 If the vertices of the polyhedrons can be projected onto a line such that they do not overlap, then the line is called a separating axis and the objects do not overlap. If no such line exists, then the polyhedrons overlap as visualized in Fig. 8. There is a finite number of lines that need to be considered for an overlap between the objects I and J – the face normals, NI and NJ, and the cross product of the edges EI × EJ. For 3-prisms with triangular faces, 16 face normals and 81 edge–edge cross products are the candidates for a separating axis. For 4-prisms with triangular faces, 24 face normals and 144 edge–edge cross products are the candidates.The overlap check starts with the face normals, as the process with them is quicker for objects that are further away from each other. If all face normals fail as separating axis then the edge–edge overlap check is performed. All the directors (face normals and cross products) are unit vectors which are placed on an arbitrary vertex of the face or the edge in question. For edge–edge overlap, this arbitrary placement of the director requires a high floating-point precision in calculating the projections. To reduce the necessary precision, we modified the placement of the director and placed it at the point of the shortest distance between the edges. In this way, the required precision is lowered because instead of comparing two floating-point numbers, we only check if the distance between the projection of the vertices and the point of shortest distance is more or less than zero and it outweighs the additional task of finding the shortest distance between the edges. As shown in Fig. 8 (bottom), the measurement process goes from calculating the distance of the blue projection from both the red projections, to just calculating the distance from the black projection. Apart from this modification, the rest of the algorithm given in ref. 38 has been used as-is.
Acknowledgements
We thank Tanja Schilling for helpful discussions regarding this project and for provision of computing resources. Financial support from the German Research Foundation (DFG, Project-ID 435320238) and support by the state of Baden-Württemberg through bwHPC and the German Research Foundation (DFG) through Grant No. INST 39/963-1 FUGG (bwForCluster NEMO) is acknowledged. We acknowledge support by the Open Access Publication Fund of the University of Freiburg.Notes and references
- D. Höhner, S. Wirtz and V. Scherer, Powder Technol., 2015, 278, 286–305 CrossRef.
- C. Xie, T. Song and Y. Zhao, Powder Technol., 2020, 368, 253–267 CrossRef CAS.
- J. Hao, Y. Li, Y. Liu, J. S. Curtis and Y. Guo, Adv. Powder Technol., 2021, 32, 3746–3759 CrossRef.
- D. Frenkel, Mol. Phys., 1987, 60, 1–20 CrossRef CAS.
- M. P. Allen and M. R. Wilson, J. Comput.-Aided Mol. Des., 1989, 3, 335–353 CrossRef CAS PubMed.
- L. Mederos, E. Velasco and Y. Martínez-Ratón, J. Phys.: Condens. Matter, 2014, 26, 463101 Search PubMed.
- S. Asakura and F. Oosawa, J. Polym. Sci., 1958, 33, 183–192 CrossRef CAS.
- I. Balberg, C. Anderson, S. Alexander and N. Wagner, Phys. Rev. B, 1984, 30, 3933 CrossRef.
- T. Schilling, M. A. Miller and P. Van der Schoot, Europhys. Lett., 2015, 111, 56004 CrossRef.
- A. Mulero, C. Galan and F. Cuadros, Phys. Chem. Chem. Phys., 2001, 3, 4991–4999 RSC.
- M. Isobe, Mol. Simul., 2016, 42, 1317–1329 CrossRef CAS.
- D. Frenkel and R. Eppenga, Phys. Rev. Lett., 1982, 49, 1089 CrossRef CAS.
- P. A. O’Brien, M. P. Allen, D. L. Cheung, M. Dennison and A. Masters, Phys. Rev. E, 2008, 78, 051705 CrossRef PubMed.
- M. Mathew, T. Schilling and M. Oettel, Phys. Rev. E, 2012, 85, 061407 Search PubMed.
- M. Duro, J. A. Martín-Pereda and L. Sese, Phys. Rev. A, 1988, 37, 284 CrossRef PubMed.
- J. T. Lopes, F. Romano, E. Grelet, L. F. Franco and A. Giacometti, J. Chem. Phys., 2021, 154, 104902 CrossRef CAS PubMed.
- H. Löwen, Phys. Rev. E, 1994, 50, 1232 CrossRef PubMed.
- S. C. McGrother, D. C. Williamson and G. Jackson, J. Chem. Phys., 1996, 104, 6755–6771 CrossRef CAS.
- P. Bolhuis and D. Frenkel, J. Chem. Phys., 1997, 106, 666–687 CrossRef CAS.
- J. Martínez-González, S. Varga, P. Gurin and J. Quintana-H, Europhys. Lett., 2012, 97, 26004 CrossRef.
- M. Chiappini, T. Drwenski, R. Van Roij and M. Dijkstra, Phys. Rev. Lett., 2019, 123, 068001 CrossRef CAS PubMed.
- S. Dussi and M. Dijkstra, Nat. Commun., 2016, 7, 11175 CrossRef CAS PubMed.
- C.-S. Shih and R. Alben, J. Chem. Phys., 1972, 57, 3055–3061 CrossRef CAS.
- J. P. Straley, Phys. Rev. A, 1974, 10, 1881 CrossRef.
- P. J. Camp and M. P. Allen, J. Chem. Phys., 1997, 106, 6681–6688 CrossRef CAS.
- A. Cuetos, M. Dennison, A. Masters and A. Patti, Soft Matter, 2017, 13, 4720–4732 RSC.
- S. D. Peroukidis and A. G. Vanakaras, Soft Matter, 2013, 9, 7419–7423 RSC.
- B. S. John and F. A. Escobedo, J. Phys. Chem. B, 2005, 109, 23008–23015 CrossRef CAS PubMed.
- S. Dussi, N. Tasios, T. Drwenski, R. Van Roij and M. Dijkstra, Phys. Rev. Lett., 2018, 120, 177801 CrossRef CAS PubMed.
- E. van den Pol, A. V. Petukhov, D. M. E. Thies-Weesie, D. V. Byelov and G. J. Vroege, Phys. Rev. Lett., 2009, 103, 258301 CrossRef CAS PubMed.
- S. Belli, A. Patti, M. Dijkstra and R. van Roij, Phys. Rev. Lett., 2011, 107, 148303 CrossRef CAS PubMed.
- S. Belli, M. Dijkstra and R. van Roij, J. Phys.: Condens. Matter, 2012, 24, 284128 CrossRef CAS PubMed.
- Y. Martínez-Ratón, S. Varga and E. Velasco, Phys. Chem. Chem. Phys., 2011, 13, 13247–13254 RSC.
- R. J. Mandle, N. Sebastián, J. Martinez-Perdiguero and A. Mertelj, Nat. Commun., 2021, 12, 4962 CrossRef CAS PubMed.
- F. Caimi, G. Nava, R. Barboza, N. A. Clark, E. Korblova, D. M. Walba, T. Bellini and L. Lucchetti, Soft Matter, 2021, 17, 8130–8139 RSC.
- E. Kats, Phys. Rev. E, 2021, 103, 012704 CrossRef CAS PubMed.
- M. Marechal, S. Dussi and M. Dijkstra, J. Chem. Phys., 2017, 146, 124905 CrossRef PubMed.
- D. Eberly, https://www.geometrictools.com, 2001.
- M. P. Allen, Liq. Cryst., 1990, 8, 499–511 CrossRef.
- J. M. Polson and D. Frenkel, Phys. Rev. E, 1997, 56, R6260 CrossRef CAS.
- S. D. Peroukidis, A. G. Vanakaras and D. J. Photinos, Phys. Rev. E, 2013, 88, 062508 CrossRef PubMed.
- B. S. John, C. Juhlin and F. A. Escobedo, J. Chem. Phys., 2008, 128, 044909 CrossRef PubMed.
- M. P. Allen and A. J. Masters, Mol. Phys., 1993, 79, 277–289 CrossRef CAS.
- A. Kuhnhold and T. Schilling, J. Chem. Phys., 2016, 145, 194904 CrossRef CAS PubMed.
- S. Varga and G. Jackson, Chem. Phys. Lett., 2003, 377, 6–12 CrossRef CAS.
- M. P. Rosseto and J. V. Selinger, Phys. Rev. E, 2020, 101, 052707 CrossRef CAS PubMed.
- Y. Martínez-Ratón, A. Díaz-De Armas and E. Velasco, Phys. Rev. E, 2018, 97, 052703 CrossRef PubMed.
- Y. Martínez-Ratón and E. Velasco, Phys. Rev. E, 2021, 104, 054132 CrossRef PubMed.
- A. Donev, J. Burton, F. H. Stillinger and S. Torquato, Phys. Rev. B, 2006, 73, 054109 CrossRef.
- Y. Martínez-Ratón, E. Velasco and L. Mederos, J. Chem. Phys., 2006, 125, 014501 CrossRef PubMed.
Footnote |
| † Note that this cannot be a full list of all related references, as they are too numerous. |
| This journal is © The Royal Society of Chemistry 2024 |

