
 Open Access Article
 This Open Access Article is licensed under a
 Creative Commons Attribution 3.0 Unported Licence
Drop impact on wet granular beds: effects of water-content on cratering†
Wei
Zhang
a,
Hiroaki
Katsuragi
 a and
Ken
Yamamoto
*ab
a and
Ken
Yamamoto
*ab
aDepartment of Earth and Space Science, Osaka University, 1-1 Machikaneyama, Toyonaka, Osaka 560-0043, Japan. E-mail: yam@ess.sci.osaka-u.ac.jp
bWater Frontier Research Center (WaTUS), Tokyo University of Science, 6-3-1 Niijuku, Katsushika-ku, Tokyo 125-8585, Japan
First published on 27th June 2024
Abstract
Drop impact events on a wet granular bed show a rich variety by changing the substrate composition. We observe the drop impact onto dry/wet granular substrates with different grain sizes (50–400 μm) and water contents (0–22 vol%). Despite the fixed impactor conditions (impact velocity: 4.0 m s−1, water drop radius: 1.8 mm), the experiment reveals that the post-impact behaviors of both the impactor and target are strongly influenced by the substrate composition. We categorize these behaviors into several phases concerning liquid splashing and crater shapes left after the event. As these phases are relevant to each other, we measure the mechanical characteristics of the substrates and find that the onset of splashing and particle ejection is explained via the fracture of the substrate. Furthermore, we discuss several timescales of the event to understand the phase separations in more detail. Consequently, we find that the splashing phase and the crater shape are determined by competition among the timescales of impact, penetration, and contact.
1 Introduction
The spherical beauty of liquid drops has attracted attention from numerous scientists and engineers. Even in our everyday lives, one can easily find many examples of spherical liquid drops, such as dew, mist, and milk crown formation. Due to gravity, relatively large liquid drops tend to fall and impact on the floor. The target floors are sometimes hard solids, liquid pools at other times, or even granular matter such as soil. Liquid drop impact onto various target materials, therefore, has been extensively studied to date.1,2 In particular, splashing induced by the drop impact has been studied by varying the surrounding pressure,3,4 target elasticity,5–8 target surface structure,9–14etc. Recently, the splashing modes have been classified into two types: prompt splashing and corona splashing.2,15,16 The drop impact phenomenon is one of the most active research topics in the field of fluid-related physics and engineering, and has been extensively studied. Nevertheless, the mechanics of the deformation and breaking of impacting drops are still under active debate.When the target consists of a collection of solid particles, the observed phenomena become much more complex due to the deformation and ejection of the granular target. Through the drop impact on a granular bed, various crater shapes and rebounding modes have been found.17–22 For instance, scaling for crater diameter and/or depth has been frequently discussed to characterize the crater shape.17,23,24
The drop impact cratering relates to soil erosion caused by raindrop impact. Therefore, detailed analyses of the crater formation and splashing have been performed recently in the field of agrophysics.25–27 To discuss the natural soil erosion process, complex effects of grain shape, grain-size variation, water content, etc. have to be carefully considered. This contrasts with fundamental physical studies in which an ideal situation (e.g. dry, monodispersed, and spherical glass beads) is usually employed. For example, while Zhang et al. examined the effect of slightly wet granular targets,24 systematic variation in the water content has not been studied. However, achieving a very wet situation is crucial to mimic actual soil conditions.
Crater shapes formed on complex wet granular targets also relate to planetary problems. Various types of peculiar crater shapes relating to wet granular impact have been reported.28–31 However, systematic experiments to reveal the details of geologically observed complex craters have not yet been carried out.
Under certain conditions, the liquid drop impact onto a granular surface results in a liquid marble, a water drop covered by a thin granular layer. Since liquid marble has the potential for various applications, fundamental studies on it have been extensively conducted recently.32 Liquid marble formation must be investigated to fully understand the physical origin of the variation in the crater shapes observed when the drop impacts onto a granular target. The systematic investigation of the drop impact onto a granular surface is a pressing issue also from the viewpoint of both fundamental and applicational understanding of the liquid marbles and peculiar crater shapes.
Based on the aforementioned background, we focus on the effects of water content and grain size on the drop-granular impact phenomena in this study. Both the grain size and water content of the target granular bed are systematically varied. But the drop size and impact velocity are fixed. Besides, only spherical glass beads are used to concentrate on the effects of grain size and water content. In particular, onset conditions for the drop splashing and grain ejection are measured based on high-speed imaging. To explain these observed onset conditions, the mechanical properties of the target granular bed are also measured using the indentation test. In addition, the morphology of the resultant final crater shapes is measured and analyzed. Using these data, the onset conditions of drop splashing and ejector release are linked to the effective strength of the target granular bed and resultant final crater shapes.
2 Experimental setup and procedure
2.1 Impactor and target
We release a water drop with a radius R0 of 1.8 mm from a flat-tipped needle located 80 cm above the target substrate. The drop slowly grows at the edge of the needle due to a flow supplied by a syringe pump via a connecting tube at a low infusion rate (0.1 mL min−1), and leaves the needle tip when the gravitational force exceeds the surface tension force. The drop then freefalls and impacts onto the substrate with an impact velocity U0 of 4.0 m s−1. The resultant Weber number We and Reynolds number Re are and
and  respectively, where ρw, γ, and η denote water density, water–air interfacial tension, and water viscosity, respectively.
The target granular bed substrate is composed of monodispersed spherical glass beads (density of 2500 kg m−3) and water. We prepare various substrates with four different grain diameters (dg = 50, 100, 200, and 400 μm) and seven different water contents [w = 0 (dry), 0.62, 1.2, 2.5, 4.9, 12, and 22 vol%]. The water content is defined by the total volume of substrate Vsubstrate and that of added water Vwater as  . We prepare the wet target by adding water to dry granular at a specified volume ratio and stirring it to achieve uniform water content in the substrate. The target is then loaded into a lab-made container, which has a cylindrical hole (20 mm in diameter and 55 mm in depth). The drop-impact experiment is performed immediately after the target preparation in order to avoid non-uniform-water-content conditions due to the drainage. We repeated experiments under the same conditions at least three times to confirm the reproducibility.
2.2 Measurements
![[thin space (1/6-em)]](https://www.rsc.org/images/entities/char_2009.gif) 000 fps with a spatial resolution of 25 μm per pixel.
000 fps with a spatial resolution of 25 μm per pixel.
3 Results
Single water-drop-impact events were captured using a high-speed camera from an obliquely upward angle. All the events have the same impactor conditions (U0 = 4.0 m s−1, R0 = 1.8 mm) and various target conditions (dg = 50, 100, 200, and 400 μm, w = 0–22 vol%). We also measured 3D profiles of craters left after the impact. Consequently, we observed a rich variety of the post-impact phenomena as well as the crater shapes (Fig. 1) and divided them into several phases from the perspectives of the liquid splashing, particle ejection, and crater shape as shown in Fig. 2. We describe the characteristics of these phases in the following subsections. | ||
| Fig. 1 Image sequences and crater 3D profiles of selected events. (a) dg = 50 μm, w = 0 vol% (Phase 2). (b) dg = 100 μm, w = 0 vol% (Phase 3). (c) dg = 200 μm, w = 0 vol% (Phase 4). (d) dg = 400 μm, w = 0 vol% (Phase 4). (e) dg = 50 μm, w = 2.5 vol% (Phase 1). (f) dg = 100 μm, w = 2.5 vol% (Phase 2). (g) dg = 200 μm, w = 2.5 vol% (Phase 3). (h) dg = 400 μm, w = 2.5 vol% (Phase 4). Scale bars indicate 5 mm. See also Movies S1–S8 (ESI†). | ||
 | ||
| Fig. 2 Phase diagrams of the post-impact event. Liquid splashing is categorized into four phases; phase 1 (blue open circle): prompt splash in the horizontal direction, phase 2 (orange open upper triangle): prompt splash in the upward direction, phase 3 (red open square): deep penetration and weak receding splash, phase 4 (black filled lower triangle): deep penetration without splash. (a) The diagram also indicates the boundaries of the tiny liquid fragment (<100 μm) generation (observed for dg > 50 μm) and particle ejection (ejecta observed in the blue-grayed area). (b) Boundaries for three crater types (type I: shallow flat craters, type II: a dome in the center, type III: deep bowl-like craters) with schematics of the cross-section depicted as well as the boundary of the asymmetric craters (red-dashed rectangle). | ||
3.1 Liquid splashing
We observed the prompt splash2 and receding breakup,33 and found there was a tendency for the prompt splash to be dominant for small dg and high w. We note that we refer to the splashes such as those shown in Fig. 1a, e and f as prompt splashes because the small droplets are released directly from the advancing lamella,2 which, in this study, took off the substrate.It is also noteworthy that we also observed a small amount of tiny liquid fragments (less than 100 μm in diameter) at the very early stage of the event (∼0.5 ms after the impact) for dg ≥ 100 μm (see the blue dashed line in Fig. 2a). Besides, the takeoff angle of the fragment splash showed significant variation depending on the degree of penetration of the drop into the substrate, and it was close to 90° for the deepest penetration (dg = 400 μm and w = 22 vol%). We excluded this type of splashing from the splashing phase diagram shown in Fig. 2 for clarity.
The splashing was divided into four phases as follows with respect to the difference in the splash angle, the degree of penetration, and the existence of the prompt/receding splash (see Fig. 2).
• Phase 1 (Fig. 1e and Movie S5, ESI†): prompt splash on the substrate (in the horizontal plane). This phase was only observed at w ≥ 2.5 vol% with dg = 50 μm. The spreading front of the liquid is directed parallel to the substrate. Only the prompt splash is possible due to the contact of the liquid front with the substrate, which is similar to the spread on hydrophilic substrates.34 The particles remain in the substrate during the event.
• Phase 2 (Fig. 1a, f and Movies S1, S6, ESI†): prompt splash in the upward direction. The spreading front of the liquid is redirected upwards due to the change in the substrate morphology (cratering) in the early stage of the impact and it takes off the substrate. The contactless liquid-front breaks up into small droplets due to interface instabilities as observed on flat rigid substrates, while minimizing the viscous drag stemming from the liquid–solid contact.13,35 The upward angle of the splash increases with dg and decreases with w. The spreading liquid film, which either does not contain particles or contains a small number of particles, ruptures in air.
• Phase 3 (Fig. 1b, g and Movies S2, S7, ESI†): weak receding breakup along with deep penetration. The drop penetrates deeply into the substrate and then spreads while generating ejecta particles. The spreading interface traps a significant number of particles at the same time. Eventually, it breaks up into liquid-marble-like droplets.
• Phase 4 (Fig. 1c, d, h and Movies S3, S4, S8, ESI†): no splash. The drop deeply penetrates into the substrate and generates ejecta particles, but it does not break up into small droplets.
It is also remarkable that phase 3 and phase 4 cover almost all regions where the ejecta particles were observed (Fig. 2a), which is intuitively understandable from the fact that the degree of the penetration was qualitatively small for phase 1 and phase 2.
3.2 Crater profiles
Ejecta particles were observed in the blue-grayed area in Fig. 2 (see also Fig. 1a–d, g and h), when the impactor (water drop) penetrated into the substrate, and a crater was left behind. The crater shapes were almost axi-symmetric except for the cases of dg = 50 μm, w = 0 and 0.62 vol% (Fig. 1a), but showed several variations as is noticeable in both the last sequences and 3D profiles shown in Fig. 1. To characterize the crater shape, we obtained azimuthally averaged cross-sectional profiles (r–z plane, where r and z denote the radial and vertical directions, respectively) as shown in Fig. 3. One finds that, even when the substrate is wet, a round-shaped rim is formed at the outskirts of the crater as on the dry granular. However, the profiles reveal that the water content affects the crater shape. We sort them into three types based on the shape inside the crater rim (Fig. 2b): (I) inner-rim is almost flat and slightly sagged from the original level, (II) a raised dome at the center and a deep gutter around the dome are formed, and (III) a bowl-like deep depression is formed. The center dome of type II craters is composed of particles that were trapped in the spreading drop and gathered by the retraction of the liquid front. In the case of type III crater formation, the impacting drop deeply penetrates into the substrate and does not spread widely in the horizontal direction, resulting in the formation of a bowl-like deep hole at the center. It is interesting that the boundary between type I and type II corresponds to that between phase 2 and phase 3 of splashing, while the boundary between type II and type III lies between dg = 200 and 400 μm. | ||
| Fig. 3 Azimuthally averaged cross-sectional profiles for different water content w. (a) dg = 50 μm, (b) dg = 100 μm, (c) dg = 200 μm, and (d) dg = 400 μm. | ||
In contrast to the crater morphology, the crater rim radius Rc and the maximum depth zc (defined in Fig. 4a) do not show remarkable differences for different conditions, but they tend to be slightly large when w is low as shown in Fig. 4b and c. However, a reverse tendency is found in zc for dg = 400 μm, presumably because of the different crater shape (type III).
 | ||
| Fig. 4 (a) A schematic of the crater cross-section with definitions of the crater rim radius Rc and the maximum depth zc. (b) Rc and (c) zc as a function of the water content w. | ||
3.3 Mechanical characteristics of the substrates
We measured the root-mean-square (RMS) and Ra roughness of the substrate from the 3D profiles taken before the impact (Table 1). As a result, both values increased with the grain diameter, but they did not show clear dependence on the water content w. The result is not intuitive because one would expect that the substrates become smoother when they contain liquid. This could be because of water drainage, which is non-negligible for dg > 100 μm.36| w [vol%] | d g = 50 μm | d g = 100 μm | d g = 200 μm | d g = 400 μm | ||||
|---|---|---|---|---|---|---|---|---|
| RMS [μm] | R a [μm] | RMS [μm] | R a [μm] | RMS [μm] | R a [μm] | RMS [μm] | R a [μm] | |
| 0 | 7.2 | 5.7 | 47.6 | 5.0 | 824.1 | 135.8 | 1548.7 | 480.4 |
| 0.62 | 2.8 | 2.1 | 74.8 | 4.8 | 645.7 | 83.6 | 1606.0 | 515.0 |
| 1.2 | 2.6 | 2.0 | 67.0 | 4.9 | 718.9 | 103.5 | 1712.0 | 585.5 |
| 2.5 | 2.3 | 1.8 | 66.8 | 3.4 | 746.4 | 111.5 | 1627.4 | 529.9 |
| 4.9 | 3.7 | 2.8 | 58.0 | 2.8 | 685.3 | 93.9 | 1674.9 | 560.1 |
| 12 | 2.4 | 1.8 | 94.5 | 4.3 | 642.1 | 82.5 | 1621.5 | 524.8 |
| 22 | 2.6 | 2.0 | 82.0 | 4.6 | 702.2 | 98.7 | 1754.8 | 615.5 |
| Avg. | 3.4 | 2.6 | 70.1 | 4.3 | 709.3 | 101.4 | 1649.3 | 544.5 |
| SD | 1.7 | 1.4 | 15.5 | 0.8 | 63.0 | 18.4 | 69.5 | 45.7 |
We also evaluated the mechanical characteristics of the substrate through the indentation test. Fig. 5 shows correlations between the penetration depth of the test rod S and the pressure from the substrate P, which was obtained by dividing the measured force by the rod cross-sectional area. There are tendencies for the pressure to be high for small dg and high w. However, the tendencies become unclear for large dg and high w, and the curves fluctuate for dg = 200 and 400 μm. This is presumably because of (a) the non-linearity of the water-content effect, (b) the non-uniform distribution of water due to drainage, clustering etc., and (c) the relatively large size of the grains.
 | ||
| Fig. 5 Correlations between the test-rod penetration depth S and pressure P for different water content w obtained using the indentation test. (a) dg = 50 μm, (b) dg = 100 μm, (c) dg = 200 μm, and (d) dg = 400 μm. | ||
The relationships shown in Fig. 5 cannot be directly interpreted such as the results obtained with a general elastic solid because the substrates are composed of grains and their relocation should be taken into account in this study. Because P(S) curves shown in Fig. 5 exhibit typical yielding behaviors, two quantities characterizing the early linear part and the later saturating part should be considered. Therefore, we define the effective elasticity Eeff and the effective strength Yeff from the measured pressure as follows:
 | (1) |
| Yeff = P(tb) | (2) |
 after reaching
  . The obtained Eeff and Yeff are plotted against the water content w in Fig. 6a and b, respectively. We can confirm that both of them tend to increase with w, and the substrate elasticity increases to a level of hard plates (∼106 kPa7,37) only by the addition of a small amount of water for dg = 50 and 100 μm. However, for dg = 200 and 400 μm, both Eeff and Yeff do not show an increasing trend in w > 1 vol%. This can be considered as a result of the water drainage. Moreover, Fig. 6c indicates that Eeff and Yeff have a power-law correlation (Eeff ∼ Yeff0.82) in the present system. The same diagram in a normalized form (normalized by the dynamic pressure
  ) for the abscissa is shown in Fig. 6d.
 | ||
Fig. 6 Effects of the water content w on (a) the effective elasticity Eeff and (b) the effective strength Yeff. Correlations between Eeff and (c) Yeff, and (d) Yeff/Pd . . | ||
4 Discussion
In the previous section, we described various observed phenomena as well as the mechanical characteristics of the substrate that arise from the different substrate conditions. In this section, we discuss the phenomena in more detail to understand the mechanisms and to provide some quantitative predictions.4.1 Particle ejection and crater generation
Generation of the ejecta particles can be considered to be a result of the substrate fracture. In other words, particles can remain inside the substrate if the effective strength of the substrate is sufficiently large, as we have similar experience of taking a walk on wet sands on a beach. In the present study, the threshold of the fracture is related to the dynamic pressure of the impact Pd. Fig. 7a shows a relationship between the water content w and effective strength normalized by Pd, in which the particle diameter is indicated by different sets of symbol and color, while filled symbols indicate the case where particle ejection was observed. We found that the particle ejection occurs when Yeff/Pd < 3. Moreover, the threshold of Yeff/Pd ∼ 3 is also related to the maximum depth of the crater zc as shown in Fig. 7b. Fig. 7b indicates that the degree of penetration depends on the balance between Yeff and Pd when Yeff/Pd < 3, whereas it is almost independent when Yeff/Pd > 3. These results imply that the reaction of the substrate changes across the threshold: the fracture of the substrate occurs and particles are ejected as a result of the kinetic energy transfer in the case of Yeff/Pd < 3, whereas the particles are pressed downward but not ejected from the substrate by either forming closer packing and/or tightly holding each other through the capillary bridge for Yeff/Pd > 3.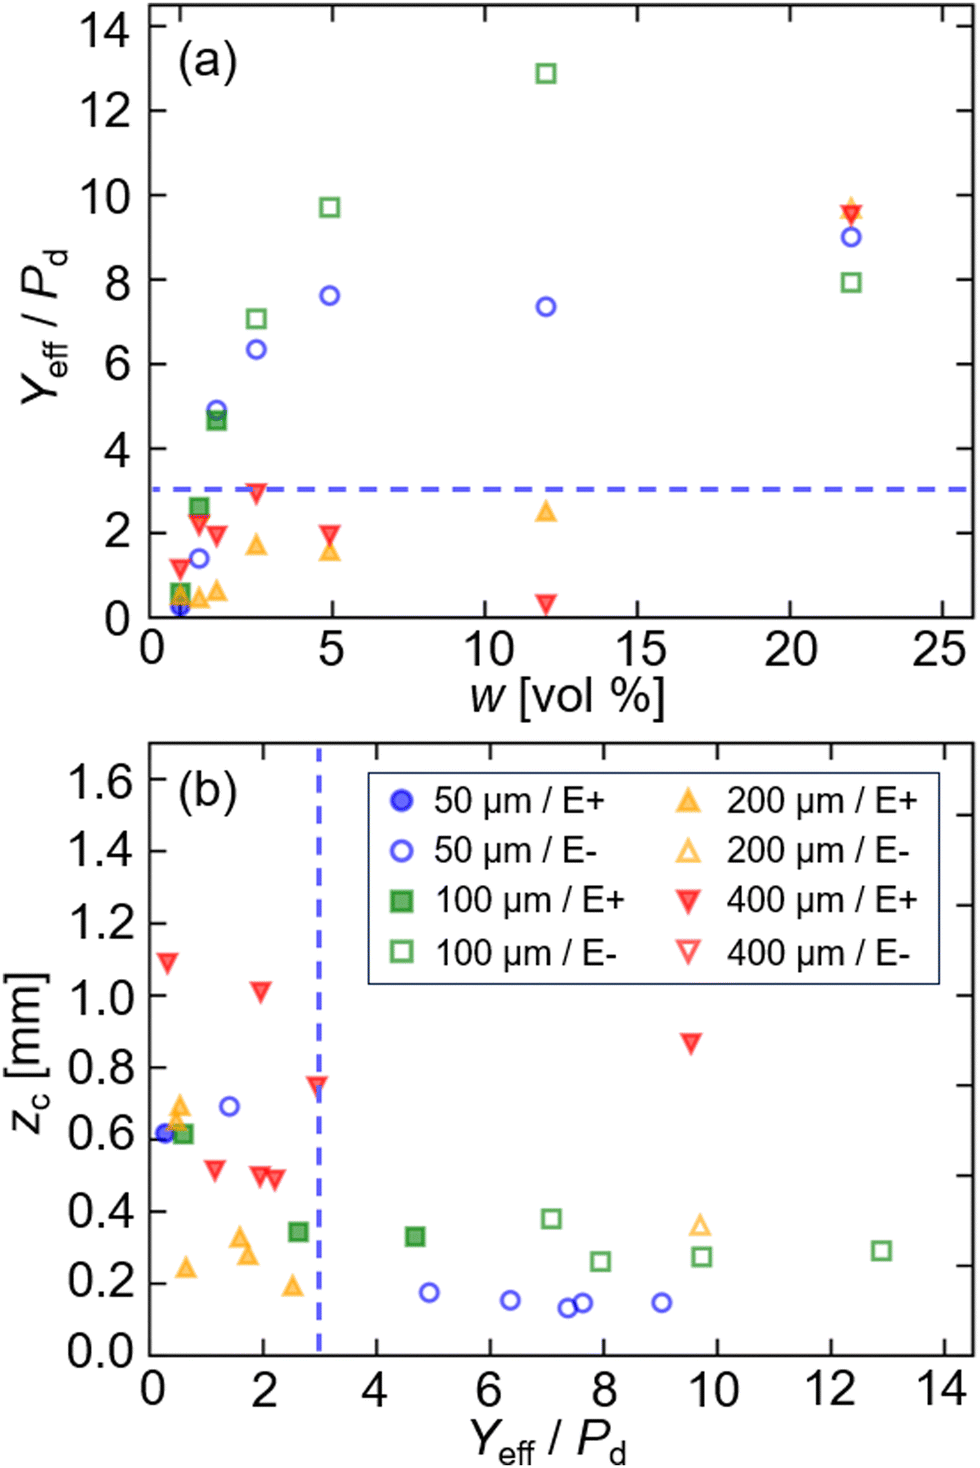 | ||
| Fig. 7 Relationships between (a) the water content w and normalized effective strength Yeff/Pd, and (b) Yeff/Pd and zc. Filled symbols indicate the cases where the ejecta particles were observed (“E+” and “E−” in legend indicate the cases with and without ejecta, respectively). Blue dashed lines indicate Yeff/Pd = 3. | ||
A similar trend is also seen in the crater radius normalized by the initial drop radius Rc/R0 (Rc/R0 is large for small Yeff/Pd and it is almost constant for Yeff/Pd > 3, see Fig. 8a). We also find that the results agree with a scaling of Rc/R0 ∼ (Pd/Y)1/5 proposed by Zhang et al.,24 which was confirmed for w < 0.5 vol% with dg = 90 μm (Y denotes the shear yield stress of the substrate). Because their experimental condition ranges from 0.4 < Pd/Y < 25, we consider that fracture occurred in their study. Contrarily, the fracture occurred in only half of the cases (Pd/Yeff > 1/3) in the present study. However, Fig. 8b shows that Rc/R0 still seems to obey the scaling for Pd/Yeff < 1/3. Although Fig. 8a implies that Rc/R0 would remain constant for lower Pd/Yeff, further work is necessitated to fully understand the Pd dependence of the crater radius.
 | ||
| Fig. 8 (a) A relationship between the normalized effective strength Yeff/Pd and crater radius normalized by the initial drop radius Rc/R0. The blue dashed line indicates Yeff/Pd = 3. (b) A log–log plot of Pd/Yeff and Rc/R0. The black line indicates Rc/R0 = 3.3(Pd/Yeff)1/5 and the blue grayed area indicates the range where Rc/R0 ∼ (Pd/Yeff)1/5 scaling was confirmed by Zhang et al.24 | ||
The above discussion suggests that the boundaries of the ejecta generation and crater type (I/II) are determined by the balance between the dynamic pressure and effective strength of the substrate. However, the boundary for crater type (II/III) cannot be explained using the relationship Yeff/Pd. The observation results imply that the type III crater is formed when the drop penetrates as deep as its apex reaching the substrate surface.
4.2 Splashing
We discussed in the previous subsection that the boundary of crater type (I/II) is determined using the relationship Yeff/Pd. As the boundary is common for splashing between phase 2 and phase 3, we can understand that the energy dissipation due to the substrate fracture is substantially reduced in phase 2 (and phase 1). On the other hand, in phase 3, penetration into the substrate occurs but still a weak receding splash is observed while no splashing phase (phase 4) also exists. In the following part, we discuss the effects of roughness, elasticity, and surface deformation on the suppression of splashing. | ||
| Fig. 9 The relationship between the water content w and normalized effective strength Yeff/Pd. Color indicates the grain diameter (blue: dg = 50 μm, green: dg = 100 μm, orange: dg = 200 μm, red: dg = 400 μm) and symbols indicate the splashing phase (open circle: phase 1, open upper triangle: phase 2, open square: phase 3, filled lower triangle: phase 4). The blue dashed line indicates Yeff/Pd = 3. | ||
The boundary between phase (1/2) may be determined from the deformed surface profile: the substrate deformation alters the spreading direction from horizontal to obliquely upward (typically 101 degrees22). This change in the spreading direction causes the spreading liquid front to lift off the substrate at r > Rc and to deform the interface through the Rayleigh–Plateau instability without energy loss due to liquid–solid contact. We qualitatively observed that the take-off angle of the lamella in phases 1 and 2 decreased with w (Fig. 1).
4.3 Event timescales
From the above discussion, we understand that phase 3, where the release of a few large droplets covered by grains was observed, is a transition region between the splashing and penetration. In this region, Yeff/Pd is slightly less than the threshold and therefore the penetration occurs. However, although the viscous dissipation in the granular layer becomes nonnegligible,40 the impacting drop still expands in the horizontal direction while trapping the surrounding grains on its interface. Finally, release of the droplets occurs during the receding process of the interface.To quantitatively evaluate the above scenario, we derive several timescales and compare them. First, the timescale of impact, representing the early stage of the event, is derived as τi ∼ R0/U0. Second, the timescale of contact, derived from a relationship between the impact energy and surface energy after the drop deformation, is derived as τc ∼ (ρwR03/γ)1/2. In this study, τi ∼ 0.5 ms and τc ∼ 8.9 ms are obtained. In addition to these timescales, we introduce the third timescale τv. This timescale represents the time at which the direction of the drop motion changes from vertical to horizontal, explaining the horizontal expansion after the penetration. We derive the timescale from the stopping force of the vertical motion. The candidates are capillarity and viscous force.
Here, we consider the impact of a drop onto a hydrophilic substrate with dense cylindrical pores (pore radius of rp). To stop the motion, the capillary pressure near the entrance of the pores (∼γ/rp) must exceed the dynamic pressure (∼ρwU02), but it is one order smaller than the counterpart in this study when we put rp = dg/2. Therefore, we consider that penetration occurs even when dg = 50 μm.
Now, our concern is how deep (long) the liquid penetrates into the substrate. In the early stage of the penetration, the viscosity effect is negligible and inertia drives the liquid motion.41 This stage ends as the viscous boundary layer grows, and this time is given by the Prandtl's law41,42 as  at which viscous stress inside the pore becomes non-negligible. As the viscous stress increases inside the pore, the velocity of the liquid front decreases, and the drop expands in the horizontal direction to satisfy mass conservation. We estimate the resistance pressure Pv as the pressure drop of the penetrating flow from the scaling of the Navier–Stokes equation. We assume that the flow is fully-developed, the flow velocity is scaled by the impact velocity U0, and the flow channel is a circular pipe of radius rp. If we neglect inertia and external forces, the pressure drop of the flow per unit length is given by the viscous term as
  where z(t) is the penetration depth inside the pore and is scaled as z(t) ∼ U0t. Thus, Pv is rewritten as:
 | (3) |
As the newly introduced timescale is proportional to rp2 (∼dg2), τv varies by almost two orders of magnitude between dg = 50 μm (∼0.2 ms) and 400 μm (∼10 ms), and τv becomes longer than τc for dg = 400 μm. This suggests that the liquid penetrates in the vertical direction and does not expand in the horizontal direction for dg = 400 μm, while the change in direction occurs at some point before the drop completely penetrates into the substrate for dg ≤ 200 μm.
The penetration affects the behavior of the drop even for dg ≤ 200 μm. For dg = 50 μm, τv < τi and therefore the effect of the penetration can be negligible. However, for dg ≥ 100 μm, τv becomes longer than τi (τv ∼ 0.6 ms for dg = 100 μm, τv ∼ 2.5 ms for dg = 200 μm). In this case, a portion of the liquid penetrates into the substrate, and the horizontal expansion is attenuated. This attenuation leads to a delay or a disappearance of splashing. This trend is evident in Fig. 10, which depicts the onset time of splashing tsp normalized by the timescale of contact τc. It also indicates that a threshold between phase (2/3) is given by tsp/τc ∼ 0.5. This is intuitive because the splashing mode is different and τc characterizes the timescale of drop expansion: the prompt splash releases droplets during the expanding stage, while the receding splash releases them during the retracting stage. It is noteworthy that although the above discussion on the timescale neglects the effects of the water content (only initially dry conditions are considered), it provides useful insights into the separation of splashing phases. It is also remarkable that the effect of water content on porosity is very small. However, a small porosity change could cause a significant difference, in general.
 | ||
| Fig. 10 Measured time of the onset of splashing tsp normalized by the contact timescale τc. Color indicates the grain diameter (blue: dg = 50 μm, green: dg = 100 μm, orange: dg = 200 μm) and symbols indicate the splashing phase (open circle: phase 1, open upper triangle: phase 2, open square: phase 3). The blue dashed line indicates tsp/τc= 0.5. | ||
5 Conclusions
We investigated the drop impact onto dry/wet granular substrates to understand the mechanisms of liquid splashing and cratering. Although we fixed the impactor condition (impact velocity: 4.0 m s−1, drop radius: 1.8 mm), observations with different grain diameters (50–400 μm) and water contents (0–22 vol%) revealed rich variations in splashing mode, crater morphology, and particle ejection. We categorized these variations into four splashing phases, three types of crater shapes, and the presence of particle ejection. Comparison of the phase diagrams for the splashing phase and crater shape types revealed that the splashing and the cratering (as well as the particle ejection) are related to each other.To quantitatively understand the physics behind the variations, we measured the mechanical characteristics (roughness, effective elasticity, and effective strength) of the substrates and characteristic lengths of the craters. Consequently, we concluded that the effective strength is a key parameter for both the splashing mode and crater morphology. When the effective strength normalized by the dynamic pressure of the impacting drop, Yeff/Pd, is smaller than a certain threshold (approximately three in this study), substrate fracture occurs, leading to the ejection of particles. On the other hand, when Yeff/Pd exceeds this threshold, only a little substrate deformation occurs.
The difference in substrate response affects both the subsequent liquid spreading and the final crater shape. Liquid penetration inhibits the drop spreading and the following splashing (splashing phase 4). In such cases, the resulting crater shape is bowl-like (crater type III). The drop starts to splash as Yeff/Pd reaches the level of the threshold. At this point, splashing is modest because the fracture still occurs (weak receding splash, splashing phase 3). In this case, small droplets generated by splashing are covered by particles because liquid penetration also occurs simultaneously, and the drop shoves the surrounding particles while spreading. The shoved particles adhere to the drop interface, and some of them are released with the splashing droplets, while the remainder are drawn towards the center of the crater by the surface tension of liquid and form a dome-like shape (crater type II). The splashing is intense (prompt splashing) when Yeff/Pd exceeds the threshold (splashing phase 2). In such cases, the resultant crater shape is almost flat, with substrate deformation in the vertical direction limited to a few particle diameters (crater type I). We qualitatively observed that the angle of splash depends on the crater depth in this regime, and the angle is almost horizontal when the substrate is wet and composed of 50-μm grains (splashing phase 1).
Finally, we discussed three timescales of the event to qualitatively understand the thresholds for phase (2/3) and phase (3/4) of splashing. A comparison of the timescales of impact, contact, and penetration suggested that the shortest timescale predominates the event. In particular, we found that the timescale of penetration, which is a quadratic function of the grain diameter  significantly affects the event because it also indicates the timescale of the change in the direction of motion from vertical (penetration) to horizontal (spreading). Although the above discussion on the timescale neglects the effects of the water content, our observation results imply that the impact event becomes more complicated when the substrate is wet, even under slightly moist conditions. This could be due to the existence of liquid inside the substrate that could shorten the penetration timescale.
In this study, we demonstrated that both liquid splashing and crater morphology vary widely even under identical impactor conditions. Our findings also suggest that splashing and cratering show different responses when the impactor is solid-like or an aggregation of grains such as a meteorite. More detailed probing into the phenomena would extend our understanding in a wide range, from our daily-life problems (such as soil erosion or an egg dropping onto flour) to planetary problems.
Author contributions
Wei Zhang: formal analysis (equal), investigation (lead), methodology (supportive), software (equal), validation (lead), visualization (lead), writing – review & editing (equal). Hiroaki Katsuragi: conceptualization (equal), data curation (equal), funding acquisition (equal), investigation (supportive), methodology (supportive), project administration (equal), resources (lead), supervision (equal), writing – original draft preparation (supportive), writing – review & editing (equal). Ken Yamamoto: conceptualization (equal), data curation (equal), formal analysis (equal), funding acquisition (equal), investigation (supportive), methodology (lead), project administration (equal), software (equal), supervision (equal), writing – original draft preparation (lead), writing – review & editing (equal).Conflicts of interest
There are no conflicts to declare.Acknowledgements
This study was financially supported by the Japan Society for the Promotion of Science (JSPS) KAKENHI grant no. JP23K17729 and JP23H04134.Notes and references
- A. L. Yarin, Annu. Rev. Fluid Mech., 2006, 38, 159–192 CrossRef.
- C. Josserand and S. Thoroddsen, Annu. Rev. Fluid Mech., 2016, 48, 1–27 CrossRef.
- L. Xu, W. W. Zhang and S. R. Nagel, Phys. Rev. Lett., 2005, 94, 184505 CrossRef PubMed.
- G. Riboux and J. M. Gordillo, Phys. Rev. Lett., 2014, 113, 024507 CrossRef PubMed.
- R. E. Pepper, L. Courbin and H. A. Stone, Phys. Fluids, 2008, 20, 082103 CrossRef.
- S. Mangili, C. Antonini, M. Marengo and A. Amirfazli, Soft Matter, 2012, 8, 10045–10054 RSC.
- C. J. Howland, A. Antkowiak, J. R. Castrejón-Pita, S. D. Howison, J. M. Oliver, R. W. Style and A. A. Castrejón-Pita, Phys. Rev. Lett., 2016, 117, 184502 CrossRef PubMed.
- M. Pegg, R. Purvis and A. Korobkin, J. Fluid Mech., 2018, 839, 561–593 CrossRef CAS.
- P. Tsai, R. C. A. van der Veen, M. van de Raa and D. Lohse, Langmuir, 2010, 26, 16090–16095 CrossRef CAS PubMed.
- L. Xu, Phys. Rev. E, 2007, 75, 056316 CrossRef PubMed.
- J. Hao, Phys. Fluids, 2017, 29, 122105 CrossRef.
- H. M. Kittel, E. Alam, I. V. Roisman, C. Tropea and T. Gambaryan-Roisman, Colloids Surf., A, 2018, 553, 89–96 CrossRef CAS.
- P. Garcia-Geijo, E. S. Quintero, G. Riboux and J. M. Gordillo, J. Fluid Mech., 2021, 917, A50 CrossRef CAS.
- T. de Goede, K. de Bruin, N. Shahidzadeh and D. Bonn, Phys. Rev. Fluids, 2021, 6, 043604 CrossRef.
- M. M. Driscoll, C. S. Stevens and S. R. Nagel, Phys. Rev. E, 2010, 82, 036302 CrossRef PubMed.
- A. Latka, A. Strandburg-Peshkin, M. M. Driscoll, C. S. Stevens and S. R. Nagel, Phys. Rev. Lett., 2012, 109, 054501 CrossRef PubMed.
- H. Katsuragi, Phys. Rev. Lett., 2010, 104, 218001 CrossRef PubMed.
- J. Marston, S. Thoroddsen, W. Ng and R. Tan, Powder Technol., 2010, 203, 223–236 CrossRef CAS.
- G. Delon, D. Terwagne, S. Dorbolo, N. Vandewalle and H. Caps, Phys. Rev. E, 2011, 84, 046320 CrossRef CAS PubMed.
- H. Katsuragi, J. Fluid Mech., 2011, 675, 552–573 CrossRef CAS.
- S.-C. Zhao, R. de Jong and D. van der Meer, Soft Matter, 2015, 11, 6562–6568 RSC.
- R. de Jong, S.-C. Zhao and D. van der Meer, Phys. Rev. E, 2017, 95, 042901 CrossRef PubMed.
- R. Zhao, Q. Zhang, H. Tjugito and X. Cheng, Proc. Natl. Acad. Sci. U. S. A., 2015, 112, 342–347 CrossRef CAS PubMed.
- Q. Zhang, M. Gao, R. Zhao and X. Cheng, Phys. Rev. E, 2015, 92, 042205 CrossRef PubMed.
- M. Beczek, M. Ryzak, A. Sochan, R. Mazur, C. Polakowski, D. Hess and A. Bieganowski, Geoderma, 2020, 378, 114592 CrossRef.
- R. Mazur, M. Ryzak, A. Sochan, M. Beczek, C. Polakowski, B. Przysucha and A. Bieganowski, Geoderma, 2022, 417, 115838 CrossRef.
- A. Sochan, M. Beczek, R. Mazur, C. Polakowski, M. Ryzak and A. Bieganowski, PLoS One, 2023, 18, e0285611 CrossRef CAS PubMed.
- D. E. Gault and R. Greeley, Icarus, 1978, 34, 486–495 CrossRef.
- K. H. Wohletz and M. F. Sheridan, Icarus, 1983, 56, 15–37 CrossRef.
- M. Manga, A. Patel, J. Dufek and E. S. Kite, Geophys. Res. Lett., 2012, 39, L01202 CrossRef.
- D. K. Weiss and J. W. Head, Meteorit. Planet. Sci., 2018, 53, 741–777 CrossRef CAS.
- A. S. Ravi and S. Dalvi, ACS Omega, 2024, 9, 12307–12330 Search PubMed.
- I. V. Roisman, A. Lembach and C. Tropea, Adv. Colloid Interface Sci., 2015, 222, 615–621 CrossRef CAS PubMed.
- H. Zhang, X. Zhang, X. Yi, F. He, F. Niu and P. Hao, Exp. Thermal Fluid Sci., 2021, 124, 110369 CrossRef.
- I. V. Roisman, Phys. Fluids, 2009, 21, 052104 CrossRef.
- H. Yasuda, M. Katsura and H. Katsuragi, Adv. Powder Technol., 2023, 34, 103896 CrossRef.
- B. C. Basso and J. B. Bostwick, Langmuir, 2020, 36, 15010–15017 CrossRef CAS PubMed.
- H. Zhang, X. Zhang, X. Yi, Y. Du, F. He, F. Niu and P. Hao, Phys. Fluids, 2022, 34, 022111 CrossRef CAS.
- A. Alizadeh, V. Bahadur, W. Shang, Y. Zhu, D. Buckley, A. Dhinojwala and M. S. Sohal, Langmuir, 2012, 29, 4520–4524 CrossRef PubMed.
- S.-C. Zhao, R. de Jong and D. van der Meer, Phys. Rev. Lett., 2017, 118, 054502 CrossRef PubMed.
- D. Quéré, Europhys. Lett., 1997, 39, 533–538 CrossRef.
- P.-G. de Gennes, F. Brochard-Wyart and D. Quéré, Capillarity and wetting phenomena: drops, bubbles, pearls, waves, Springer, 2004 Search PubMed.
Footnote |
| † Electronic supplementary information (ESI) available. See DOI: https://doi.org/10.1039/d4sm00386a |
| This journal is © The Royal Society of Chemistry 2024 |