 Open Access Article
Significant anisotropic deformation and optical shifts in stretched cholesteric liquid crystal elastomers
Saki
Mori
a,
Hideaki
Takagi
 b,
Nobutaka
Shimizu
b,
Noriyuki
Igarashi
b,
Shinichi
Sakurai
c and
Kenji
Urayama
b,
Nobutaka
Shimizu
b,
Noriyuki
Igarashi
b,
Shinichi
Sakurai
c and
Kenji
Urayama
 *d
*d
aDepartment of Macromolecular Science and Engineering, Kyoto Institute of Technology, Kyoto, 606-8585, Japan
bHigh Energy Accelerator Research Organization, Tsukuba, Ibaraki 305-0801, Japan
cDepartment of Biobased Materials Science, Kyoto Institute of Technology, Kyoto, 606-8585, Japan
dDepartment of Material Chemistry, Kyoto University, Kyoto, 615-8510, Japan. E-mail: urayama.kenji.2s@kyoto-u.ac.jp
First published on 26th April 2024
Abstract
This study explores the opto-mechanical response of cholesteric liquid crystal elastomers (CLCEs) subjected to uniaxial stretching along the x-axis, perpendicular to their helical z-axis. A definitive crossover is observed in the strain (εx) dependencies of various optical and mechanical properties, such as the transmission spectra, degree of mesogen orientation, Poisson's ratios, and tensile stress. At low strains, CLCEs exhibit a blue shift in the selective reflection band due to a reduction in the helical pitch, accompanied by a decrease in reflection selectivity for circularly polarized light. Beyond a certain critical strain  further pitch alterations halt. This strain regime is marked by substantial anisotropic lateral contractions without any z-axis contraction, as indicated by a Poisson's ratio (μxz) of zero. Within this intermediate strain regime, local directors predominantly reorient towards the x-direction within the xy-plane, resulting in a quasi-plateau of tensile stress. Approaching a higher critical strain
  a complete loss of reflective selectivity occurs. Past this threshold, while the mechanical responses resemble those of isotropic conventional rubber, they retain a periodic structure albeit without phase chirality. These observed features are accounted for by the Mao–Terentjev–Warner model, especially when the network anisotropy parameter is adjusted to match the critical strain magnitude
  associated with the cessation of selective reflection.
1. Introduction
Cholesteric liquid crystals (CLCs) exhibit unique optical properties due to their helical director configurations with a pitch in the range of several hundred nanometers.1,2 In particular, they exhibit the selective reflection of circularly polarized light that matches the handedness of the helix, with a wavelength that corresponds to the helical pitch. Cholesteric liquid crystal elastomers (CLCEs) combine the elasticity of rubber with the optical properties of CLCs.3,4 The dual nature of CLCEs allows for the modulation of the optical behavior through external mechanical stimuli,5–7 and for the deformation through temperature variation3,8–10 and electric fields11,12 affecting the director alignments. Specifically, applying strain to CLCE films and fibers has been shown to significantly alter their optical traits, including shifts in the reflected color due to changes in the helical pitch prompted by macroscopic dimensional variations.13,14 This strain-induced variation in optical properties for CLCE films was used for tunable lasing.5,15–18 The mechanochromic response also allows for their use in tensile and pressure sensors with high spatial resolution.13,14,19–22 These opto-mechanical features make CLCEs particularly interesting as tunable photonic soft materials.CLCEs may undergo complex deformations depending on their geometries when employed as photonic materials. When the original helical axis is along the z-direction, uniaxial compression along this axis15 or equal-biaxial stretching perpendicular to it5,16 leads to a straightforward reduction in the helical pitch while preserving the initial orientation symmetry within the xy plane. In these cases, the reflection band exhibits a blue-shift proportionally to the dimensional change in the z-direction, and the reflection selectivity is retained even at high strains. Conversely, stretching along the axis perpendicular to the original helical axis complicates the opto-mechanical response due to the disruption of the initial orientation symmetry in the xy plane, resulting in the loss of reflection selectivity in many cases. Most of the previous studies have found that the variation in helical pitch with applied stretch λx is less than what isotropic contraction and affine displacement would predict,6–8,17,18 while one study reported the agreement between them.13 They have analyzed this behavior using a power law of Λred = λx−γ, where Λred is the ratio of the characteristic wavelengths in deformed and undeformed states. When lateral contractions in the y- and z-directions are equal, and the helical pitch varies proportionally with the material's dimension, the γ value is 0.5. However, most of the previous studies have reported lower γ values in the early stage of stretching, suggesting that the helical configuration resists macroscopic contraction along the helical axis, with γ serving as an analogue to the Poisson's ratio under affine deformation assumptions. Nevertheless, the exact relationship between these microscopic and macroscopic deformations remains unclear due to the absence of direct measurements of Poisson's ratio. Understanding the λx dependence of Λred and its relationship with the Poisson's ratio will shed light on how these deformation scales are interconnected.
When CLCEs are sufficiently stretched, it is expected that their helical structure will unwind entirely. Previous studies have demonstrated the total loss of selective reflection at extensive elongations.6–8,13,18 However, the details concerning how stretching influences the unwinding of the helical director configuration remain to be elucidated. This research aims to clarify the opto-mechanical response of main-chain type CLCEs synthesized through thiol–ene reactions. We examine CLCEs with different cross-link geometries—one with an explicit tetra-functional cross-linker and another without, because some studies reported that the flexibility, length and functionality of cross-linker molecules have pronounced effects on the orientation coupling between the mesogens and network backbone.23–25 Our analysis discerns a three-stage strain response defined by two strain thresholds. We investigate changes in transmission spectra, Poisson's ratio, degree of mesogen orientation, and tensile stress in relation to stretching. Notably, for CLCEs with a tetra-functional cross-linker, we identify an intermediate strain regime where neither helical pitch variation nor macroscopic contraction along the z-axis occurs. During this strain regime, tensile stress remains nearly constant while there is significant rotation of local directors within the xy plane. Beyond this strain threshold, the material begins to exhibit characteristics akin to conventional isotropic rubber, including isotropic lateral contractions and an increase in stress. We demonstrate that the Mao–Terentjev–Warner model26,27 captures the key phenomena observed in the experiments. These insights deepen our understanding of the complex interaction between LC alignment and macroscopic deformation in CLCEs, providing a foundation for harnessing and refining their opto-mechanical responses.
2. Experimental
2.1. Sample preparation
We prepared two types of main-chain CLCE films, designated as CLCE-0 and CLCE-4, with different cross-link geometries. These were prepared via a thiol–ene reaction.28 The reactant mixtures comprise a liquid crystalline diacrylate, specifically 1,4-bis[4-(6-acryloxypropoxy)benzoyloxy]-2-methylbenzene (RM82; Osaka Organic Chemical Industry), and a chiral diacrylate, 1,4:3,6-dianhydro-, 2,5-bis[4-[[4-[[[4-[(1-oxo-2-propen-1-yl)oxy]butoxy]carbonyl]oxy]benzoyl]oxy]benzoate] (LC756; BASF). Additionally, 1,4-benzenedimethanethiol (BDMT; Tokyo Chemical Industry) served as a chain extender. For the preparation of CLCE-4, we introduce an explicit tetrafunctional cross-linker, pentaerythritol tetrakis(3-mercaptopropionate) (PETMP; Tokyo Chemical Industry). The chemical structure of each reactant is shown in Fig. 1a. The compositions of each specimen are detailed in Table 1, and “X” in the sample code CLCE-X represents the molar ratio of PETMP to RM82. Bis(cyclopenta-2,4-dien-1-yl)bis[2,6-difluoro-3-(1H-pyrrol-1-yl)phenyl]titanium (Irgacure 784®) was used as the photoinitiator. The initiator solution (0.229 mol L−1) using dichloromethane as a solvent was added to the reactant mixtures, and dried under vacuum conditions.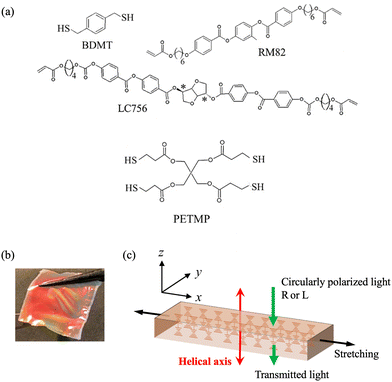 | ||
| Fig. 1 (a) Chemical structures of BDMT, RM82, LC756 and PETMP. (b) Appearance of CLCE-0 with iridescent color. (c) Schematic diagram of experimental geometry. | ||
| Specimen | RM82 | LC756 | BDMT | PETMP | Thickness (μm) | Young's modulus (MPa) |
|---|---|---|---|---|---|---|
| CLCE-0 | 1 | 0.036 | 1.08 | 0 | 28.5 | 5.8 |
| CLCE-4 | 1 | 0.036 | 1.08 | 0.040 | 28.6 | 4.5 |
The melted reactant mixtures, heated to 110 °C, were loaded into a glass cell with a 30 μm gap. The cell surfaces had been previously coated with a uniaxially rubbed polyimide layer to induce planar orientation.9,15 The glass cell was cooled at a rate of 0.5 °C min−1 to the cholesteric phase onset temperature (65 °C for CLCE-0 and 57 °C for CLCE-4). The cooling then proceeded at a reduced rate of 0.1 °C min−1 to a temperature 5 °C below the cholesteric–isotropic phase transition temperature for each system, and the temperature was maintained for 24 hours. The formation of a monodomain cholesteric phase, with the helical axis perpendicular to the substrate, was confirmed by the appearance of iridescent color and oily streak textures, using a polarizing microscope. The glass cells were then exposed to light with a wavelength of 525 nm for 30 minutes to induce photopolymerization. After irradiation, the cells were immersed in dichloromethane, causing the resultant gel films to detach from the glass substrates due to swelling pressure. The detached gel films were subsequently allowed to deswell gradually by the stepwise addition of methanol to the solvent mixture. The final elastomer films with iridescent color as shown in Fig. 1b were obtained after drying the deswollen gels. Table 1 lists the thickness of each film specimen which was measured at 25 °C using a double-scan high-precision laser measuring instrument, LT-9010M (Keyence, Japan). The Young's modulus for each specimen listed in Table 1 was estimated from the initial slope of the stress–strain curve, which will be shown later. The two types of CLCE have comparable moduli, despite a difference in the amount of PETMP. This suggests that they have an almost similar density of elastically effective cross-links. Nonetheless, prior studies showed that despite similar moduli, the cross-linker geometry can influence how the mesogens align with the network backbone,23–25 thereby affirming the significance of the comparison of the opto-mechanical responses for these two types.
2.2 Measurements
The experimental geometry, indicating the stretching direction, helical axis and direction of the incident light, is depicted in Fig. 1c. A strip-shaped specimen with dimensions of 3 mm × 1 mm × 30 μm was incrementally stretched along the x-direction (perpendicular to the helical axis) using a home-built, precision-controlled extensometer. This device ensures symmetric extension from both ends, facilitating continuous observation of the sample's central region throughout the stretching process.Transmitted light spectra were obtained for both right- (R) and left-handed (L) circularly polarized light aligned with the helical axis. Each spectral measurement was conducted after a five-minute stabilization period under the target strain at 25 °C to ensure the tensile stress reached quasi-equilibrium. A Hamamatsu Photonics PMA12C detector was employed to quantify the light spectra. Illumination was provided by a tungsten lamp, with circular polarization achieved by using circular polarizers.
The strip specimens were progressively extended using an elongation device coupled to an optical microscope. The lateral contraction in the y-direction during uniaxial stretching in the x-direction was examined. The axial ratio λy (λy = ly/ly0 where ly is the length in the y-direction, and ly0 is the initial length) was evaluated as a function of λx. The ratio λz in the thickness direction was computed from volume conservation (λxλyλz = 1) during stretching. The volume constancy was validated by a complementary tensile test by measuring directly the thickness variation using a double-scan high-precision laser measuring instrument Keyence LT-9010M, which will be shown in the later section.
The stress–strain relationships under uniaxial elongation were investigated for a strip-shaped specimen (3 mm × 1 mm × 30 μm) using a tensile tester AC-500N-CM (T.S.E., Japan). The specimens were elongated in the x-direction with a crosshead speed of 0.1 mm s−1. This strain rate was sufficiently slow to observe the quasi-equilibrium stress–strain behavior.
Director reorientation behavior driven by elongation was examined using wide-angle X-ray scattering (WAXS) measurements. The experiments were conducted at the BL-6A beamline of the photon factory of the high energy accelerator research organization (Tsukuba, Ibaraki, Japan) using an imaging plate as the detector. The X-ray wavelength was 0.15 nm, and the sample-to-detector distance was 1.0 m. To intensify the scattering intensity, multiple layers of the sample, composed of four strips each 30 mm × 10 mm × 30 μm, were laminated together. The two-dimensional scattering patterns were sequentially recorded at the central specimen region for various tensile strains, with a waiting period of five minutes after each strain to equilibrate the tensile stress. The specimens were stretched up to a given true-stretching ratio by using a compact tensile testing machine (ISUT-2207; IS Giken Co., Japan) at room temperature. The imaging plate, BAS-IP MS 2025 (Fuji Photo Film Co., Japan; size: 200 × 250 μm2), has an actual pixel size of 100 × 100 μm2. The typical exposure time was in the range of 10–30 s. BAS2500 (Fuji Photo Film Co., Japan) was used for the development of exposed images on the imaging plate. A polyethylene crystal was used as the standard sample to calibrate the magnitude of the scattering vector.
For each measurement, the data reproducibility was verified by multiple tests on the same specimens, yielding an error margin within 10%.
3. Results and discussion
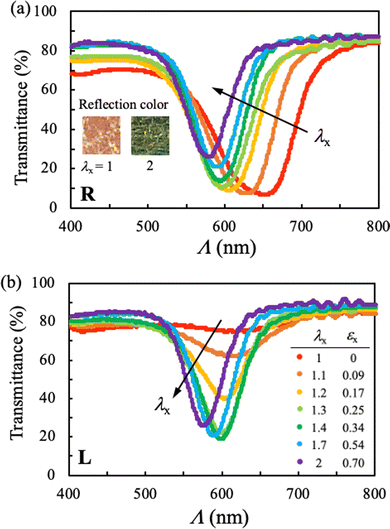
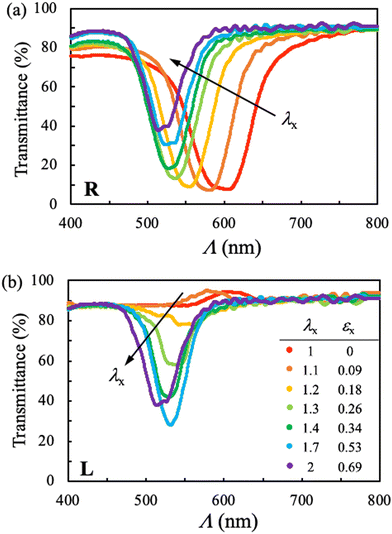
Fig. 2 and 3 illustrate the transmission spectra of CLCE-0 and CLCE-4 when exposed to right- (R) and left-handed (L) circularly polarized light. These figures depict the spectral changes as the specimens are stretched along the x-axis by a factor of λx. In their initial, undeformed state (λx = 1), both CLCE specimens exhibit selective reflection, characterized by a significant dip of transmittance in a specific wavelength range for R light, due to reflection at these wavelengths. In contrast, L light shows nearly complete transmittance across the entire wavelength range. The central wavelength of the reflection band, ΛR, is evaluated to be 650 for CLCE-0 and 600 nm for CLCE-4. As λx increases, ΛR shifts toward shorter wavelengths. This trend continues until a saturation point is reached at higher values of λx. The spectral shift for CLCE-0 at a stretch of λx = 2 is visually represented by a color transition from red to dark green in the inset of Fig. 2a. Notably, a slight stretch (λx = 1.1) begins to reduce the transmittance for L around ΛR, indicating a disturbance in the selective reflection. As λx further increases, this reduction in L light transmission intensifies, and the specific wavelength for L light (ΛL) also shifts to shorter wavelengths. At higher elongation, the transmission spectra for R and L progressively converge, eventually becoming indistinguishable. This convergence is indicative of a complete loss of selective reflection.The reduction of selectivity under stretching can be attributed to the deformation of the helical structure. The initial uniform helical director configuration undergoes a noticeable distortion by minimal stretching, leading to a reduction of selectivity. The transmittance for L decreases because the distorted helix can no longer efficiently guide this polarization through. Conversely, the transmittance for R increases since the disruption allows light of this polarization, which was previously filtered out, to pass more readily. Further stretching beyond a critical stretch can ultimately destroy the helical structure yet preserving a degree of regularity along the original helical axis. Consequently, although the material loses its selective reflective capabilities, a form of Bragg's reflection persists. The theoretical calculations for the stretching driven structural variation will be discussed later.
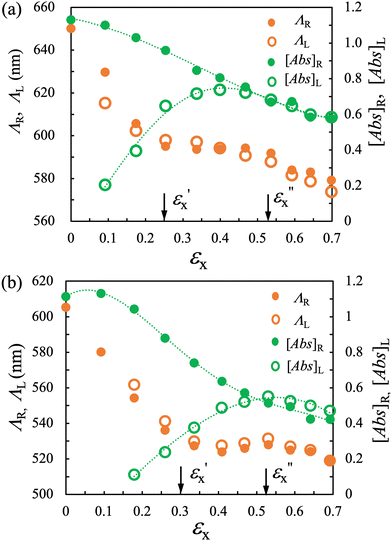
Parts a and b of Fig. 4 present the variations in ΛR and ΛL, as well as the corresponding absorbance [Abs]R and [Abs]L, for CLCE-0 and CLCE-4, respectively. These values are plotted against the longitudinal true strain εx, which is defined as εx ≡ ln![[thin space (1/6-em)]](https://www.rsc.org/images/entities/char_2009.gif) λx. Both CLCE samples exhibit similar qualitative trends in these quantities as a function of εx. The behavior of ΛR, ΛL and [Abs] can be categorized into three distinct regimes, using the two strain thresholds
λx. Both CLCE samples exhibit similar qualitative trends in these quantities as a function of εx. The behavior of ΛR, ΛL and [Abs] can be categorized into three distinct regimes, using the two strain thresholds  and
and  . In region I
  as εx increases, the differences between
  and
and  diminish, indicating a progressive alternation in the original helical director configuration induced by the applied strain. In region II
  ΛR and ΛL converge and remain constant with respect to εx. The disparity in [Abs]R and [Abs]L progressively diminishes as εx approaches
  . In region III
  with the convergence of Λ and [Abs] between L and R light, the material maintains a periodic structure in the thickness (z-) direction, characterized by Λ. As εx increases, there is a slight reduction in Λ. The strain thresholds
  and
and  for both specimens are comparable, with
  for both, while
  and 0.30 for CLCE-0 and CLCE-4, respectively. These threshold values demarcate the transition points where the reflection wavelengths and absorbance values for R and L light begin to align and where they nearly converge.
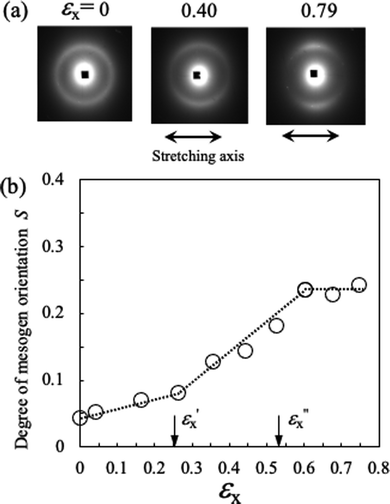
Fig. 5a depicts the two dimensional WAXS patterns of CLCE-0 at various εx values when elongated in the x-direction, with the incident X-ray beam aligned parallel to the helical axis (z-axis). The patterns exhibit diffraction at approximately 0.41 nm, characteristic of the spacing between mesogenic groups in nematic liquid crystals.29 In the undeformed state, an isotropic diffraction ring is evident, indicative of a random director distribution in the xy-plane. As εx increases, the diffraction patterns evolve into arc shapes perpendicular to the elongation direction, signifying an increase in the orientation of directors aligned with the stretch. Fig. 5b shows the degree of mesogen orientation (S) along the x-direction as a function of εx. This parameter, derived from the analysis of the scattering intensity distribution,30 is nearly zero in the undeformed state, reflecting the isotropic director orientation in the xy-plane. Notably, the εx dependence of S is classified into three distinct regimes, corresponding to the  and
and  thresholds determined from the Λ and [Abs] data in Fig. 4. When εx increases from zero, S incrementally rises, yet the relationship between S and εx undergoes a marked transition near
  . The pronounced change in S within region II is indicative of the predominant rotation of the directors within the xy-plane towards the x-axis. Beyond
  (in region III), S stabilizes at approximately 0.25, indicating the full alignment of the local directors toward the x-direction.
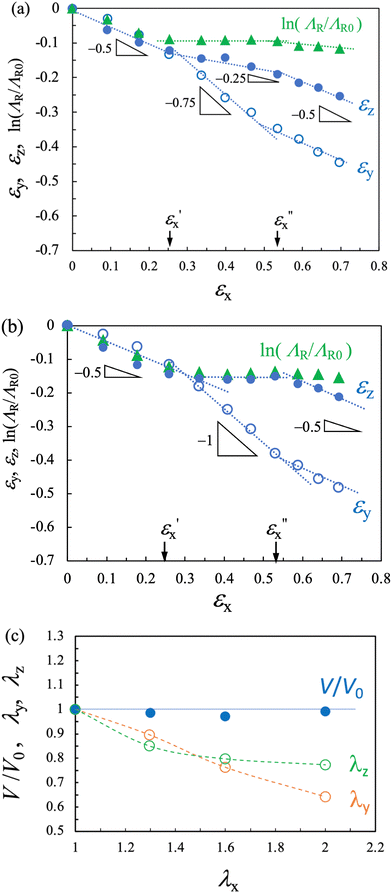
Fig. 6a and b display the lateral true strains (εy ≡ ln![[thin space (1/6-em)]](https://www.rsc.org/images/entities/char_2009.gif) λy and εz ≡ ln
λy and εz ≡ ln![[thin space (1/6-em)]](https://www.rsc.org/images/entities/char_2009.gif) λz) as a function of longitudinal true strain (εx) for CLCE-0 and CLEC-4, respectively. The strain in the thickness direction (εz) is calculated using the incompressibility conditions (λxλyλz = 1, i.e., εx + εy + εz = 0). This incompressibility under uniaxial stretching has been independently verified by measuring strains in all three directions, which is shown in Fig. 6c. Lateral contractions in the y- and z-directions during uniaxial stretching in the x-direction are quantified by Poisson's ratios μxy and μxz, defined as εy = −μxyεx and εz = −μxzεx. In incompressible and isotropic materials such as conventional rubber, these ratios are identical with μxy = μxz = 0.5. In the figures, the slope represents the μ value. For both CLCE-0 and CLCE-4, a pronounced transition in μ values is observed around two specific strain thresholds,
λz) as a function of longitudinal true strain (εx) for CLCE-0 and CLEC-4, respectively. The strain in the thickness direction (εz) is calculated using the incompressibility conditions (λxλyλz = 1, i.e., εx + εy + εz = 0). This incompressibility under uniaxial stretching has been independently verified by measuring strains in all three directions, which is shown in Fig. 6c. Lateral contractions in the y- and z-directions during uniaxial stretching in the x-direction are quantified by Poisson's ratios μxy and μxz, defined as εy = −μxyεx and εz = −μxzεx. In incompressible and isotropic materials such as conventional rubber, these ratios are identical with μxy = μxz = 0.5. In the figures, the slope represents the μ value. For both CLCE-0 and CLCE-4, a pronounced transition in μ values is observed around two specific strain thresholds,  and
and  . In region II, μxz is substantially lower than μxy, whereas in regions I and III, they are similar, approximating to 0.5. Notably, in region II for CLCE-0 and CLCE-4, μxz values are 0.25 and 0, respectively. Specifically, for CLCE-4, μxz = 0 and μxy = 1 signify a marked anisotropic deformation pattern, where lateral contraction occurs solely in the y-direction without any dimensional reduction in the z-direction (i.e., along the helical axis). This behavior indicates a unique deformation pattern where the local directors predominantly rotate within the xy-plane, as illustrated in Fig. 5. This significant anisotropic lateral contraction during uniaxial stretching is similar to the response seen in monodomain nematic elastomers when stretched perpendicular to their initial director axis.31–34 In LCEs, there is a strong interdependency between the alignment of the liquid crystals and the macroscopic deformation. Therefore, the absence of noticeable deformation along the z-axis (μxz = 0) can be logically attributed to the director realignment primarily taking place with the xy-plane. As depicted in Fig. 5, in region III, S remains constant with increasing εx, indicating that the local directors are fully rotated towards the x-axis. Consequently, macroscopic deformation in this regime resembles that of conventional isotropic rubber, with μxy = μxz = 0.5. In region I, the modest change in S with respect to εx suggests that the director realignment toward the x-direction within the xz-plane occurs alongside that within the xy-plane, likely resulting in isotropic lateral contractions.
The compression of the helical director configuration due to uniaxial stretching is characterized by ΛR/ΛR0 where ΛR0 is the initial value in the undeformed state. We also plot the corresponding true compressive strain, ln(ΛR/ΛR0), as a function of εx in Fig. 6a and b. The slope of ln(ΛR/ΛR0) exhibits a significant change around  similar to the change observed for the μ values, albeit the change around
  is less pronounced. Importantly, the value of ΛR remains unchanged during stretching for both CLCEs, highlighting a unique correlation with negligible dimensional change along the helical axis in region II as shown in Fig. 6a and b. In particular, CLCE-4 shows no change in εz, mirroring the behavior of ΛR, while CLCE-0 exhibits a slight change in εz.
Fig. 7 presents the nominal tensile stress (σx) as a function of εx. The σx − εx relationship for each specimen is divided into three regimes, delineated by two strain thresholds,  and
and  . In regime I, both specimens exhibit an initial increase in stress, with the slope corresponding to their initial Young's moduli: 5.8 MPa for CLCE-0 and 4.5 MPa for CLCE-4. Regime II is characterized by a considerably gentler increase in stress, and the quasi-plateau stress is approximately 0.75 MPa for both specimens. Upon entering region III, there is an appreciable increase of stress with further strain. The quasi-plateau stress is attributed to the predominant rotation of local directors within the xy plane in the corresponding strain regime. Many studies of nematic elastomers have shown that stretching-induced director rotation can lead to a plateau in tensile stress due to the coupling of LC alignment and macroscopic stretch.4 Similar stress plateau behavior was observed in a CLCE13 and a twisted nematic elastomer35 subjected to uniaxial stretching. For CLCE-4, the absence of dimensional change in the z-direction (μxz = 0) signifies a pure director rotation confined to the xy plane, aligning with the observed pronounced stress-plateau characteristic.
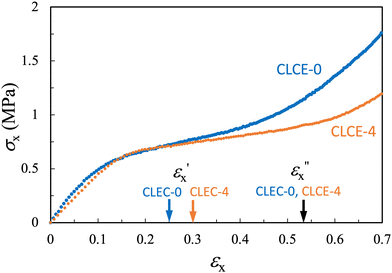 | ||
| Fig. 7 Quasi-equilibrium nominal stress (σx) as a function of tensile true strain in the x-direction (εx) for (a) CLCE-0 and (b) CLCE-4. | ||
Fig. 8 shows the schematic of the helical director configuration changes and the macroscopic dimensions of CLCEs during uniaxial stretching. This stretching alters the original helical structure that selectively reflects R light. The progression of this alteration is classified into three distinct phases, delineated by strain values  and
and  . At a mere 10% stretch, the transmission spectra exhibit a noticeable decrease in L light transmission, signaling the onset of helical disruption. In region I
  there is a gradual realignment of the local directors within both the xy- and xz-planes toward the x-direction. This realignment is accompanied by a decrease in helical pitch proportional to the dimensional reduction along the helical axis. Transitioning to region II
  the rotation of directors within the xy-plane toward the x-direction becomes dominant, leading to the eventual disappearance of reflective selectivity. In this phase, the helical pitch does not change, and there is minimal dimensional reduction along the helical axis. In region III
  the director orientation stabilizes. The CLCEs behave mechanically like conventional elastomers whereas a periodic structure persists in the z-direction. While similar qualitative behaviors are observed in uniaxially stretched CLCEs with various chemical compositions,6–8,13 this study distinctly categorizes the process into three separate strain regimes defined by two strain thresholds. At each threshold strain, several optical and mechanical properties display definitive crossovers in the strain dependencies. These include the absorbances at characteristic wavelengths, the degree of mesogen orientation in the xy plane (S), both Poisson's ratios (μxy and μxz) related to macroscopic lateral contractions and microscopic compression of the helical pitch, and the tensile stress.
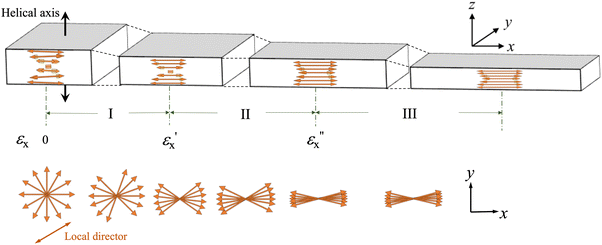 | ||
| Fig. 8 Schematic diagram of changes in helical director configuration and macroscopic dimensions of CLCE in the three strain regimes (Regions I, II, III) during uniaxial stretching. | ||
The opto-mechanical behavior of CLCEs under this stretching geometry was theoretically explored by Warner and co-workers.26,27,36 In this section, we compare our experimental results for the εx dependencies of ln(ΛR/ΛR0), μxy, μxz (Fig. 6) and tensile stress (Fig. 7) with the model predictions. They derived an expression of the free energy F(λx, λy, r, Φ, Φ0) for this system (inset in Fig. 9a) where r represents the polymer network anisotropy, Φ0 and Φ denote the director angles in the initial and deformed states, respectively.26,27,36 The free energy function F is expressed as:
 | (1) |
 | (2) |
 | (3a) |
 | (3b) |
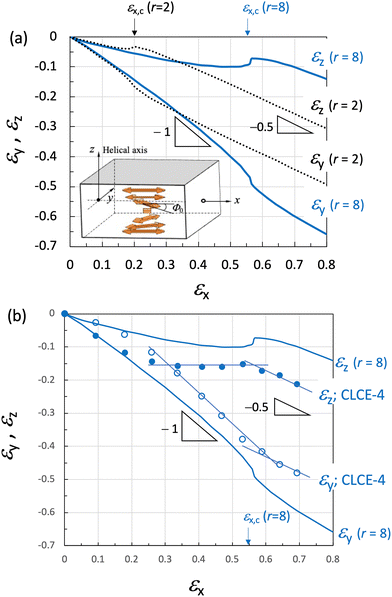 | ||
| Fig. 9 (a) Initial director angle Φ0 of a cholesteric helix in the model. Lateral true strains εy and εz as a function of longitudinal true strain εx calculated for r = 8 and 2. The critical strain is εx,c ≈ 0.55 (λc ≈ 1.73) or 0.20 (λc ≈ 1.20) for r = 8 or 2, respectively. (b) Comparison of the model prediction with r = 8 with the data of CLCE-4 reproduced from Fig. 6b. | ||
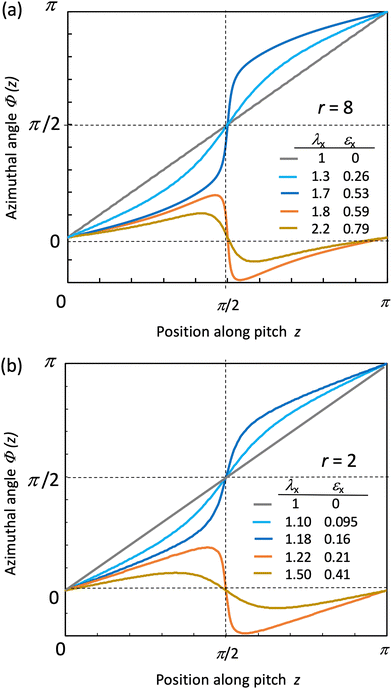
Fig. 10a illustrates the stretch-induced Φ variation for r = 8 which is calculated using the numerical solutions for λy and λz at each λx shown in Fig. 9a. Initially, at λx = 1, the ideal helix is represented by a straight line, indicating a linear variation of Φ from 0 to π along z. A small stretch causes a noticeable helix distortion, reducing reflection selectivity as observed in the experiments. Beyond a critical stretch (λx,c ≈ 1.73, εx,c ≈ 0.55), the helix totally loses the chiral nature, and Φ(z) begins to oscillate around 0. This corresponds to the transition behavior from region II to region III observed experimentally. Even at higher stretch of λx = 3, the structure maintains periodicity, as shown by the finite degree of oscillation around zero. This periodicity is observed as a form of Bragg's reflection in the transmission spectra. The selected r value (r = 8) was determined by numerical calculation so that the theoretical strain threshold (εx,c) could align with the experimental value of  . Mao et al. derived a relationship of λx,c ≈ r2/7 assuming small deformation of εx ≈ 0,26,27 but it does not hold for larger experimental
  values (≈0.5) observed in this study. Importantly, the theoretical results for r = 8 predict a transition from a significant anisotropic deformation characterized by μxz = ln(ΛR/ΛR0) = 0 and μyz = 1 to conventional isotropic deformation of μxy = μxz = 1/2 (Fig. 9b), in agreement with the experimental observations for CLCE-4.
The nominal tensile stress σ(λx) is obtained by coarse-graining the derivative of F with respect to λx over one turn of the helix as  :
:
 | (4) |
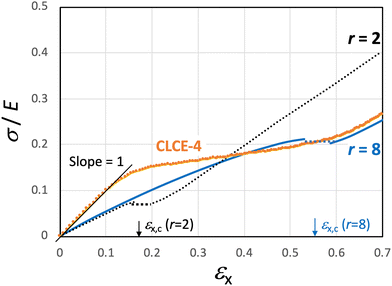 | ||
| Fig. 11 Nominal tensile stress (σ) reduced by Young's modulus (E) as a function of longitudinal true strain (εx) calculated for r = 8 and 2. The critical strain εx,c ≈ 0.55 (λx,c ≈ 1.73) and 0.20 (λx,c ≈ 1.20) for r = 8 and 2, respectively. The data of CLCE-4 are reproduced from Fig. 7. | ||
The network anisotropy parameter r correlates with the nematic order parameter in the globally aligned state, S = (r −1)/(r + 2), yielding S = 0.7 for r = 8.27 This is larger than the S value obtained from WAXS measurements (SWAXS = 0.25). However, an r value that corresponds to an S value of 0.25 (r = 2) fails to account for the experimental results. Computations using r = 2 yields a significantly diminished critical strain (approximately 0.2; Fig. 10b), a less anisotropic distortion of the helix (μxz ≈ 0.3; Fig. 9a) and a lower plateau stress (approximately 0.07; Fig. 11). The discrepancy between S = 0.7 for r = 8 and SWAXS values can be attributed to the differences in the degree of mesogen orientation for the network backbone and the total network including elastically inert dangling portions. The main-chain type CLCE specimens under study are expected to contain finite amounts of such dangling portions due to imperfections in the network structure and a side reaction between a thiol and the carbonate group of the chiral molecules.37 While the WAXS tests capture the entire mesogen orientation including dangling portions, the dangling chains do not contribute to stress-induced distortion of the helical structure, as they are elastically inactive. Davidson et al.35 employed almost the same value of r = 8.5 in this model to explain the opto-mechanical response for a twisted nematic elastomer with an almost similar structure to the CLCEs in this study.
Summary
We investigate the opto-mechanical behavior of two CLCE films, referred to as CLCE-0 and CLCE-4 with or without an explicit tetra-functional cross-linker, respectively, under uniaxial stretching perpendicular to the initial helical axis (z-axis).Stretching along the x-axis causes a blue shift of the characteristic reflection band, as a result of helical pitch reductions accompanied by initial disruption of helical director configurations. Notably, beyond a certain strain threshold  the helical pitch ceases to change in both CLCEs. Correspondingly, macroscopic lateral contractions become markedly anisotropic, particularly in CLCE-4, where the contraction along the helical axis is absent, characterized by a Poisson's ratio (μxz) of zero. CLCE-0 undergoes less anisotropic contractions, with μxz ≈ 0.25, which aligns with prior studies23–25 that highlighted the appreciable influence of the cross-linker geometry on the coupling between mesogen alignment and macroscopic deformation. In this intermediate strain regime, the rotation of local directors toward the x-direction occurs predominantly in the xy-plane, accompanied by a quasi-plateau stress. In the higher end of this strain regime
  the transmission spectra for right- and left-handed circularly polarized light become almost identical, indicative of the total loss of reflection selectivity. In higher strain regions, the mechanical behaviors of both CLCEs align with isotropic conventional rubbers, yet they retain a periodic structure capable of Bragg reflection without selectivity for circular polarization of light. The key features of the observations align with the Mao–Terentjev–Warner model predictions when the network anisotropy parameter (r) is tailored in line with the observed critical strain
  for the total loss of reflection selectivity.
These findings enhance our comprehension of the intricate interplay between the liquid crystal alignment and mechanical strain in CLCEs. These insights provide a basis for future explorations into the opto-mechanical and mechanochromic properties of CLCEs under diverse deformations toward their innovative applications in smart materials and adaptive optics.
Conflicts of interest
There are no conflicts to declare.Acknowledgements
The authors appreciate BASF, Japan and Osaka Organic Chemical Industry Ltd. for the provision of LC756 and RM-82, respectively. This work is partly supported by JSPS KAKENHI Grant No. 22H02143.References
- P. Oswald and P. Pieranski, Nematic and Cholesteric Liquid Crystals, ed. G. W. Gray, J. W. Goodby and A. Fukuda, CRC Press, Boca Raton, 2005 Search PubMed.
- P. G. de Gennes and J. Prost, The Physics of Liquid Crystals, Oxford University Press, New York, 2nd edn, 1993 Search PubMed.
- S. T. Kim and H. Finkelmann, Cholesteric Liquid Single-Crystal Elastomers (LSCE) Obtained by the Anisotropic Deswelling Method, Macromol. Rapid Commun., 2001, 22(6), 429–433 CrossRef CAS.
- M. Warner and E. M. Terentjev, Liquid Crystals Elastomers, Clarendon Press, London, 2003 Search PubMed.
- H. Finkelmann, S. T. Kim, A. Munoz, P. Palffy-Muhoray and B. Taheri, Tunable Mirrorless Lasing in Cholesteric Liquid Crystalline Elastomers, Adv. Mater., 2001, 13(14), 1069–1072 CrossRef CAS.
- P. Cicuta, A. R. Tajbakhsh and E. M. Terentjev, Evolution of Photonic Structure on Deformation of Cholesteric Elastomers, Phys. Rev. E: Stat., Nonlinear, Soft Matter Phys., 2002, 65(5), 51704 CrossRef CAS PubMed.
- P. Cicuta, A. R. Tajbakhsh and E. M. Terentjev, Photonic Gaps in Cholesteric Elastomers under Deformation, Phys. Rev. E: Stat., Nonlinear, Soft Matter Phys., 2004, 70(1), 11703 CrossRef CAS PubMed.
- C. Bourgerette, B. Chen, H. Finkelmann, M. Mitov, J. Schmidtke and W. Stille, Variation of the Network Anisotropy of Cholesteric Side Chain Elastomers, Macromolecules, 2006, 39(23), 8163–8170 CrossRef CAS.
- H. Nagai and K. Urayama, Thermal Response of Cholesteric Liquid Crystal Elastomers, Phys. Rev. E: Stat., Nonlinear, Soft Matter Phys., 2015, 92(2), 022501 CrossRef PubMed.
- M. T. Brannum, A. M. Steele, M. C. Venetos, L. T. J. Korley, G. E. Wnek and T. J. White, Light Control with Liquid Crystalline Elastomers, Adv. Opt. Mater., 2019, 7(6), 1801683 CrossRef.
- Y. Fuchigami, T. Takigawa and K. Urayama, Electrical Actuation of Cholesteric Liquid Crystal Gels, ACS Macro Lett., 2014, 3(8), 813–818 CrossRef CAS PubMed.
- A. M. Menzel and H. R. Brand, Cholesteric Elastomers in External Mechanical and Electric Fields, Phys. Rev. E: Stat., Nonlinear, Soft Matter Phys., 2007, 75(1), 11707 CrossRef PubMed.
- R. Kizhakidathazhath, Y. Geng, V. S. R. Jampani, C. Charni, A. Sharma and J. P. F. Lagerwall, Facile Anisotropic Deswelling Method for Realizing Large-Area Cholesteric Liquid Crystal Elastomers with Uniform Structural Color and Broad-Range Mechanochromic Response, Adv. Funct. Mater., 2020, 30(7), 1909537 CrossRef CAS.
- Y. Geng, R. Kizhakidathazhath and J. P. F. Lagerwall, Robust Cholesteric Liquid Crystal Elastomer Fibres for Mechanochromic Textiles, Nat. Mater., 2022, 21(12), 1441–1447 CrossRef CAS PubMed.
- A. Varanytsia, H. Nagai, K. Urayama and P. Palffy-Muhoray, Tunable Lasing in Cholesteric Liquid Crystal Elastomers with Accurate Measurements of Strain, Sci. Rep., 2015, 5, 17739 CrossRef CAS PubMed.
- J. Schmidtke, S. Kniesel and H. Finkelmann, Probing the Photonic Properties of a Cholesteric Elastomer under Biaxial Stress, Macromolecules, 2005, 38(4), 1357–1363 CrossRef CAS.
- F. Serra, M. A. Matranga, Y. Ji and E. M. Terentjev, Single-Mode Laser Tuning from Cholesteric Elastomers Using a “Notch” Band-Gap Configuration, Opt. Express, 2010, 18(2), 575–581 CrossRef CAS PubMed.
- Y. Hirota, Y. Ji, F. Serra, A. R. Tajbakhsh and E. M. Terentjev, Effect of Crosslinking on the Photonic Bandgap in Deformable Cholesteric Elastomers, Opt. Express, 2008, 16(8), 5320–5331 CrossRef CAS PubMed.
- O. T. Picot, M. Dai, E. Billoti, D. J. Broer, T. Peijs and C. W. M. Bastiaansen, A Real Time Optical Strain Sensor Based on a Cholesteric Liquid Crystal Network, RSC Adv., 2013, 3(41), 18794–18798 RSC.
- P. Zhang, X. Shi, A. P. H. J. Schenning, G. Zhou and L. T. de Haan, A Patterned Mechanochromic Photonic Polymer for Reversible Image Reveal, Adv. Mater. Interfaces, 2020, 7(3), 1901878 CrossRef CAS.
- M. Kishino, N. Akamatsu, R. Taguchi, K. Hisano, K. Kuwahara, O. Tsutsumi, J. Takeya and A. Shishido, Neutral Mechanical Plane Shifting in Bending Elastomer Film Revealed by Quantification of Internal Strain, Adv. Eng. Mater., 2022, 24(6), 2101041 CrossRef CAS.
- A. M. Martinez, M. K. McBride, T. J. White and C. N. Bowman, Reconfigurable and Spatially Programmable Chameleon Skin-Like Material Utilizing Light Responsive Covalent Adaptable Cholesteric Liquid Crystal Elastomers, Adv. Funct. Mater., 2020, 30(35), 2003150 CrossRef CAS.
- S. M. Clarke, A. Hotta, A. R. Tajbakhsh and E. M. Terentjev, Effect of Cross-Linker Geometry on Equilibrium Thermal and Mechanical Properties of Nematic Elastomers, Phys. Rev. E, 2001, 64(6), 61702 CrossRef CAS PubMed.
- A. Tsuchitani, H. Ashida and K. Urayama, Pronounced Effects of Cross-Linker Geometries on the Orientation Coupling between Dangling Mesogens and Network Backbones in Side-Chain Type Liquid Crystal Elastomers, Polymer, 2015, 61, 29–35 CrossRef CAS.
- M. O. Saed, A. H. Torbati, C. A. Starr, R. Visvanathan, N. A. Clark and C. M. Yakacki, Thiol-Acrylate Main-Chain Liquid-Crystalline Elastomers with Tunable Thermomechanical Properties and Actuation Strain, J. Polym. Sci., Part B: Polym. Phys., 2017, 55(2), 157–168 CrossRef CAS.
- M. Warner, E. M. Terentjev, R. B. Meyer and Y. Mao, Untwisting of a Cholesteric Elastomer by a Mechanical Field, Phys. Rev. Lett., 2000, 85(11), 2320–2323 CrossRef CAS PubMed.
- Y. Mao, E. M. Terentjev and M. Warner, Cholesteric Elastomers: Deformable Photonic Solids, Phys. Rev. E: Stat., Nonlinear, Soft Matter Phys., 2001, 64(4 Pt 1), 41803 CrossRef CAS PubMed.
- C. M. Yakacki, M. Saed, D. P. Nair, T. Gong, S. M. Reed and C. N. Bowman, Tailorable and Programmable Liquid-Crystalline Elastomers Using a Two-Stage Thiol-Acrylate Reaction, RSC Adv., 2015, 5(25), 18997–19001 RSC.
- A. J. Leadbetter and A. I. Mehta, Molecular Packing in the Nematic Phase of Cyano Compounds with Different Ring Systems, Mol. Cryst. Liq. Cryst., 1981, 72(2–3), 51–57 CrossRef CAS.
- S. Sakurai, S. Aida, S. Okamoto, T. Ono, K. Imaizumi and S. Nomura, Preferential Orientation of Lamellar Microdomains Induced by Uniaxial Stretching of Cross-Linked Polystyrene-Block-Polybutadiene-Block-Polystyrene Triblock Copolymer, Macromolecules, 2001, 34(11), 3672–3678 CrossRef CAS.
- P. M. S. Roberts, G. R. Mitchell and F. J. Davis, A Single Director Switching Mode for Monodomain Liquid Crystal Elastomers, J. Phys. II, 1997, 7(10), 1337–1351 CrossRef CAS.
- K. Urayama, R. Mashita, I. Kobayashi and T. Takigawa, Stretching-Induced Director Rotation in Thin Films of Liquid Crystal Elastomers with Homeotropic Alignment, Macromolecules, 2007, 40(21), 7665–7670 CrossRef CAS.
- H. Higaki, K. Urayama and T. Takigawa, Memory and Development of Textures of Polydomain Nematic Elastomers, Macromol. Chem. Phys., 2012, 213(18), 1907–1912 CrossRef CAS.
- S. Okamoto, S. Sakurai and K. Urayama, Effect of Stretching Angle on the Stress Plateau Behavior of Main-Chain Liquid Crystal Elastomers, Soft Matter, 2021, 17(11), 3128–3136 RSC.
- Z. S. Davidson, N. Kapernaum, J. Fiene, F. Giesselmann and M. Sitti, Twisting and Untwisting of Twisted Nematic Elastomers, Phys. Rev. Mater., 2020, 4(10), 105601 CrossRef CAS.
- P. A. Bermel and M. Warner, Photonic Band Structure of Cholesteric Elastomers, Phys. Rev. E, 2002, 65(5), 56614 CrossRef CAS PubMed.
- T. Wang, H. Deng, H. Zeng, J. Shen, F. Xie and C. Zhang, Self-Blowing Non-Isocyanate Polyurethane Foams from Cyclic Carbonate Linseed Oil, ACS Sustainable Resour. Manag, 2024, 1(3), 462–470 CrossRef CAS.
| This journal is © The Royal Society of Chemistry 2024 |

