
 Open Access Article
 This Open Access Article is licensed under a
 Creative Commons Attribution 3.0 Unported Licence
Switchable origami adhesives†
Wathsala M.
A. Jayawardana‡
 a,
Theresa
Elder‡
b,
Timothy
Twohig
a and
Andrew B.
Croll
*ab
a,
Theresa
Elder‡
b,
Timothy
Twohig
a and
Andrew B.
Croll
*ab
aDepartment of Physics, North Dakota State University, Fargo, USA. E-mail: andrew.croll@ndsu.edu; Tel: +1-413-320-3810
bMaterials and Nanotechnology, North Dakota State University, Fargo, USA
First published on 16th April 2024
Abstract
Creating a reusable adhesive that can hold objects on a wall and can yet be easily removed al for researchers in the adhesives community for many years. Geckos and other climbing organisms demonstrate just this ability: to hold large loads (on-state) due to specialized digits and microstructures, yet they are also able to quickly peel their feet from a surface while climbing (off-state). Inspired by the simplicity of the gecko's geometric switching mechanism, we have investigated the use of origami design methods to create geometries that can transition from a stiff configuration to a more flexible and easily peeled configuration. Specifically, we examined three different origami designs (Kresling, Waterbomb and Ron Resch) fabricated in polycarbonate and supplemented with 3D printed structures. Although the polycarbonate could be coated with a commercial adhesive, we investigated the devices in contact with polydimethylsiloxane adhesive pads in order to chemically control interfaces and create a range of differing adhesion levels. We show that the devices are capable of moderate switching ratios (Fon/Foff up to ∼50). We give a simple model to aid design and provide many options for scaling design performance through size, adhesive strength or through repetition of the pattern beyond a single unit cell.
1 Introduction
Reversible or switchable adhesives are generally useful in day-to-day life.1 For example, sticky tape is frequently used to temporarily attach an object to a wall. Tape works well because it is difficult for the object to shear the tape off the wall, but the tape is easily peeled off when there is a desire to remove the object that it is holding.2 Additionally, tape can be altered through cutting (kirigami) to create differences in peel strength or other mechanical properties depending on which end of the tape is peeled.3–6 Unfortunately, sticky tape is limited in many situations. Consider hanging a painting on the wall. One could use a large portion of double sided tape between the painting and the wall but removing the painting then requires tremendous force (and will likely damage the wall). The tape cannot simply be peeled off because the solid painting frame confines the geometry. A smaller piece may enable removal without damage but may not have the strength to hold the painting at all. Hence, scaling is difficult. Other strategies aimed at solving this problem choose to decrease the tape's cohesive strength (say with a Velcro layer). In this case removing the painting does not remove the tape but breaks it into a piece which remains on the wall and a piece that remains on the painting. This strategy typically utilizes a strong viscoelastic adhesive layer on a less flexible foam layer rendering the pieces of tape difficult to remove from the painting or wall without additional removal mechanisms being designed in.It is now well-known that many climbing insects and lizards demonstrate phenomenally well-controlled adhesive switching which scales with many different body sizes.7 They can hold relatively large loads on arbitrary surfaces and geometries, and are able to release the adhesion whenever they desire. Careful observation of these animals has identified the importance of tiny structures on their climbing appendages which in turn has spurred the development of many microstructured “mimic” materials.8–18 While these engineered materials have many impressive performance metrics, they do not play a significant role in the animals adhesion switching abilities.18–23 In fact, many of the biological systems switch from high to low adhesion states when the animal moves between a low compliance normal or shear loading configuration to a peel configuration, similar to the piece of sticky tape discussed above. However, we note most insects and lizards do not use any viscoelastic material – their adhesion is dry. Essentially, both biology and industry have convergently evolved toward a peel mechanism for removal, rather than specialized materials.
In this work our goal is to develop a new, scalable method of switching between a rigid state capable of holding a large load and a soft state capable of easy peel removal. We exploit origami, the well-known paper folding art, in the design of our switchable adhesive devices. Our motive is to study origami designs that have two stable configurations: mechanically stiff for the load-bearing state and flexible to facilitate peel in the removal state. In this work three origami designs which have two stable mechanical states were studied. Each design can transition between a rigid configuration (on-state) and a soft configuration (off-state). The switch in compliance of the devices between on and off states can lead to changes in peak load held, however, in this case, the switching is driven by a change in interfacial fracture geometry (a post geometry to a peel geometry). While most tapes rely on a lossy adhesive (a pressure sensitive adhesive), we note that this is not necessary for a device to peel. All that is needed for peel is a thin flexible layer which can deform and focus stress at the crack tip and create a progressive failure front. This geometry can be found in many origami designs.
First we consider the traditional Kresling pattern19,24–29 which is characterized by a linear array of mountain and valley folds, which define triangular facets and can be arranged into a cylinder-like shape. This pattern was observed many years ago in the buckling of cylinders,26 but first discussed as origami by Biruta Kresling24 by studying microscopic, deployable patterns in natural organisms. Bhovad et al. further developed the pattern into a multi-stabile configuration25 to use in robotic applications. The pattern used here is shown in Fig. 1c, f and i, and was developed with perforated crease lines similar to that of Hwang.30 Constructed designs are bistable, having two modes that can be switched through torsion. We consider the twisted state as the soft state and the untwisted state as the stiff state for this pattern. Generating an array of Kresling devices is feasible, although would require the use of more than one sheet.
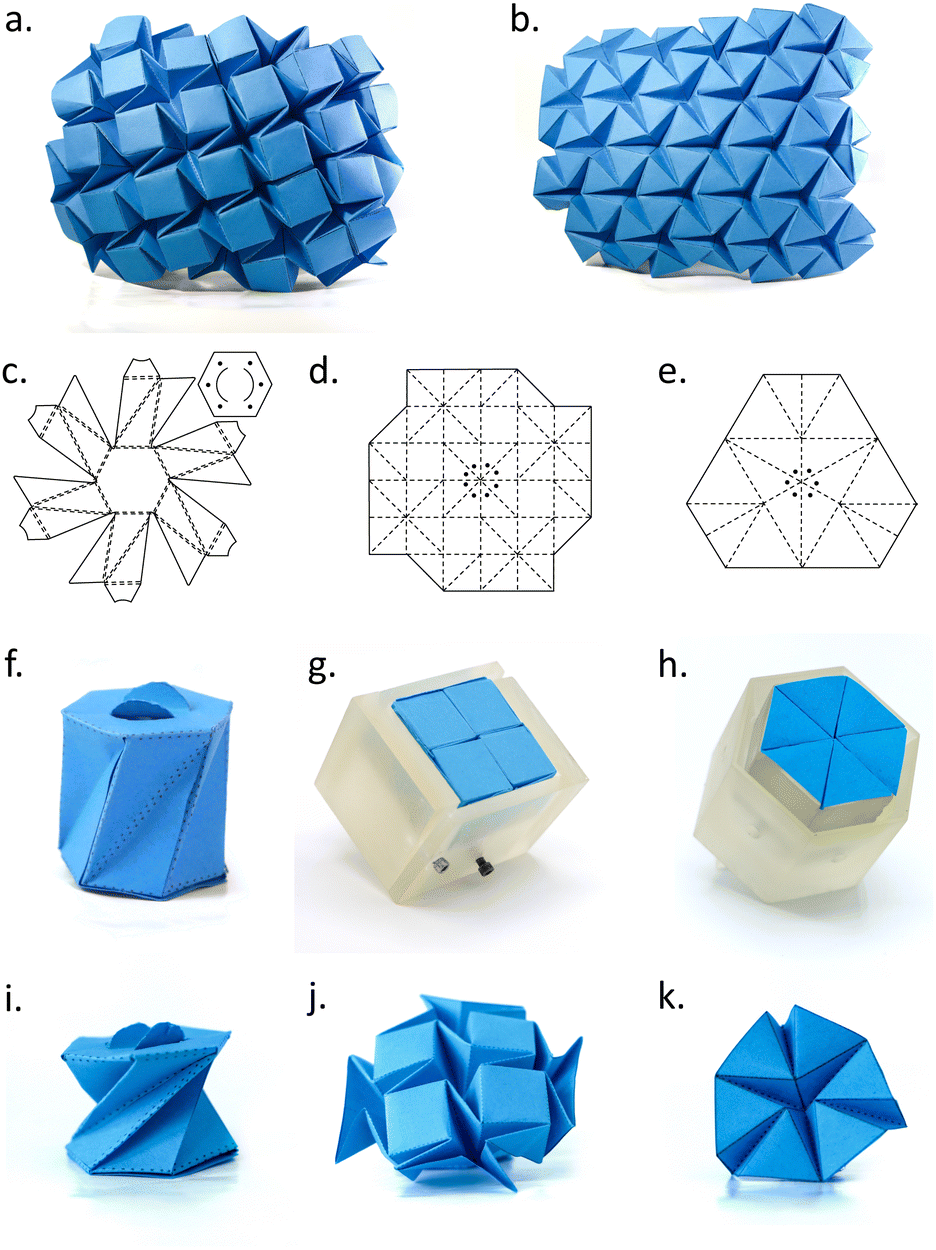 | ||
| Fig. 1 Origami adhesive structures. (a) Square (waterbomb) origami tessellation pattern folded in paper. (b) Triangular (Ron Resch) origami tessellation pattern folded in paper. (c) Single cell Kresling origami pattern used for the switchable adhesive device. Solid dots indicate string attachment locations. (d) Single cell of the square origami pattern used for the switchable adhesive device. (e) Single cell of the Resch origami pattern used for the switchable adhesive device. (f) Stiff-on the state of Kresling origami device. (g) Stiff-on state of square origami device. (h) Stiff-on state of Kresling origami tessellation device. (i) Soft-off state of the Kresling origami tessellation device. (j) Soft-off (holder-off) state of the square origami device. (k) Soft-off state of Resch origami device. | ||
Next we consider a repeated square pattern, commonly referred to as the “water bomb”,31 is shown in Fig. 1a, d, g and j. The unit cell of the square pattern consists of four folded squares and showcases a “curved” open configuration (the facets are not coplanar) as well as a closed flat configuration (Fig. 1g). Furthermore, we point out that a repeated pattern of unit cells resembles the contact-splitting mechanisms utilized by insects.20 By possessing numerous small contacts that collectively form a substantial contact area, insect legs effectively partition the contact region. The ability to repeat the square pattern provides another advantage in the form of tunable surface area. By incorporating more squares into the lattice, the overall size of a device can be modularly scaled enabling, for example, the creation of rectangular or other “tetris inspired” configurations. This tunability offers flexibility and adaptability in utilizing the square pattern in various applications.
Finally, we consider a hexagonal design in order to increase functionality.32 The Ron Resch pattern consists of folded equilateral triangles arranged in a periodic radial formation, as depicted in Fig. 1b, e, h and k. Once again, for simplicity, we focus on a single unit cell of this tessellation (Fig. 1h). When the shape is folded, six of the triangles, positioned radially around a central point are compressed together, resulting in the formation of a flat-surfaced hexagon (the triangular facets are coplanar). This flat surface can be pressed flush against another flat surface, establishing a high degree of contact area. Upon removal of the external load that maintains the compressed state the triangles begin to separate due to the energy stored in the pattern's creases. As the shape opens up, the triangles tilt out of the plane, causing a gradual curvature that prevents the structure from laying flat against a surface. Thus, the system also exhibits two distinct modes: an “on” mode characterized by strong adhesion when the triangular facets are coplanar, and an “off” mode characterized by weak adhesion when the triangles separate and develop a non-planar surface shape.
The structure of this paper unfolds as follows: we commence by detailing our materials and methods within the experimental section. Subsequently, in Section 3, we develop a simple scaling argument to describe the adhesive performance of the different states and make predictions of how the switching ratio (adhesive force in the on-state to adhesive force in the off-state) will scale with increased contact area or changes in overall interfacial strength. Next, in the results and discussion section, the peak adhesion forces for three different origami-based designs in rigid and soft states are reported and discussed. We highlight the most effective mechanism that combines additively manufactured components with the origami shapes can achieve switching ratios of up to approximately 50, though more often show a moderate value of approximately 5 due to creep in the materials used. The manuscript ends with a succinct summary and key conclusions.
2 Experimental
2.1 Device fabrication
Three origami patterns (Fig. 1c, d and e) were printed out on paper and then folded into prototypes. The prototypes were used to refine the area of interest for the unit cell and to test the switching mechanism. Then the selected unit cell patterns were redrawn in PowerPoint software where several minor modifications to the pattern were made, such as replacing regular lines from the design with perforated lines to facilitate more accurate, guided folding.30 Patterns were uploaded to the Cricut designing space and then loaded to the Cricut cutter. Ultimately, the patterns were cut in polycarbonate sheets (thickness 128 microns) used as received from McMaster-Carr company.The first pattern, the bi-stable Kressling pattern (Fig. 2a and b) used polycarbonate as outlined above but was supplemented with some double-sided tape to adhere overlapping elements of the pattern and form the cylindrical final state. In principle solvent or heating could ‘weld’ the pieces together for one-material construction. The device switches between a rigid state and a soft state through a rotation.30 We used a thin, rigid string (Zebco Outcast Monofilament Fishing Line) to apply forces to the top of the device in order to reduce the need for complex orientation schemes.
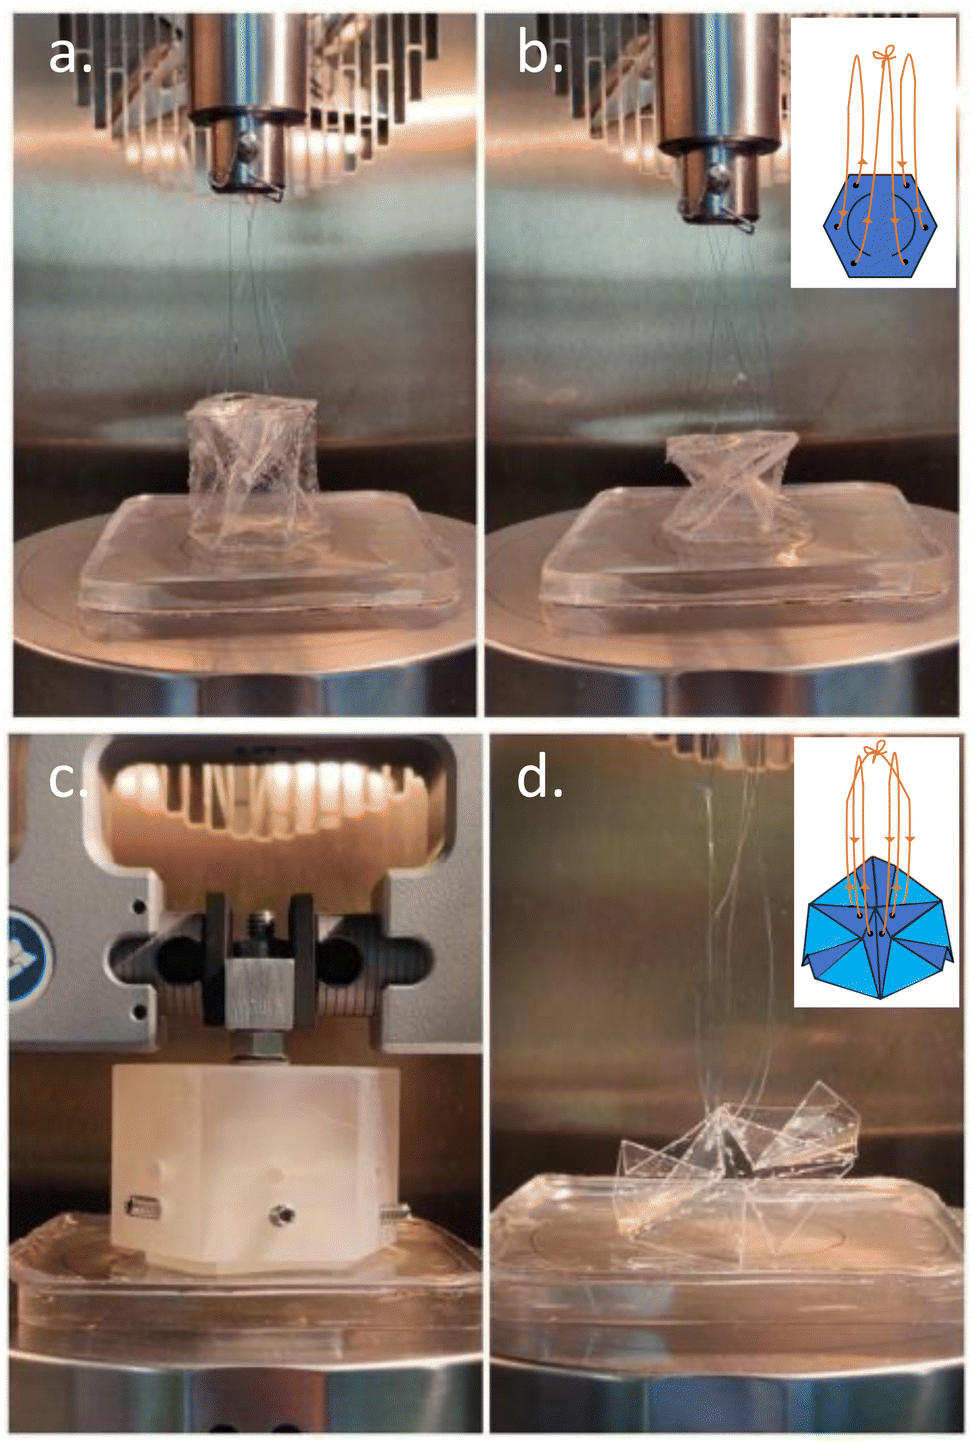 | ||
| Fig. 2 Images of the experimental setup. (a) A Kressling device in the on state. (b) A Kressling device in the off state. Inset indicates the location of the strings. (c) A Resch device in the on state. (d) A Resch device in the off state, where the holder body has been removed. Inset indicates the locations of the strings. | ||
The other two origami switch patterns were more efficient when supplemented with a 3D-printed ‘holder’. 3D-printed cubes and triangular prisms designed to fit inside the origami patterns were rendered with clear methacrylate resin. Fig. 2c shows the assembled device during testing. The soft state (off-state) can be achieved by releasing the ‘holder’ and allowing the patterns to articulate freely. To perform pull-off tests, we used the same technique as the previous design, passing a string through the pattern in order to apply forces.
2.2 Substrate fabrication
To test device performance, it is useful for at least one side of the system (adhesive device or substrate) to have easily controlled adhesion. We have successfully coated polycarbonate sheets with a pressure sensitive adhesive in the past, but the adhesive allows little tuning of the interaction. Here we elect to use a weaker but tunable elastomer layer on the substrate in order to create more experimental control. Specifically, Sylgard 184 polydimethylsiloxane (PDMS) was used in 20![[thin space (1/6-em)]](https://www.rsc.org/images/entities/char_2009.gif) :1, 30:1, 35:1, 40:1, 45:1, and 50:1 weight ratio (prepolymer to crosslinker). The polymer mixture was then drop cast into polystyrene dishes to make thick (∼1 cm) adhesive pads. We don't expect the moduli of these materials to have a strong frequency dependence in the range of speeds explored in this work. Typical DMA can be found in ref. 33.
:1, 30:1, 35:1, 40:1, 45:1, and 50:1 weight ratio (prepolymer to crosslinker). The polymer mixture was then drop cast into polystyrene dishes to make thick (∼1 cm) adhesive pads. We don't expect the moduli of these materials to have a strong frequency dependence in the range of speeds explored in this work. Typical DMA can be found in ref. 33.
2.3 Mechanical testing
Mechanical tests were performed on a universal test frame (Instron 34TM-5) for all three origami devices. Adhesive PDMS pads were placed on a compression platten, and a clamp was used to pull a string attached to each device. With the additional printed holders, Instron grips could be attached directly to the device. Tests began with bringing a device into contact with the adhesive pad using a pressure such that full (macroscopically observed) contact would take place between the device and the PDMS layer. This observation could not be made with the opaque, filled devices so the same pressure was used in the on (opaque) and off (observable) cases. After this recorded forces would return to approximately zero (no tension in string or clamps open). Clamps were then gently closed on a device, or string tension was increased. Forces and displacements were recorded until a crack between the substrate and device nucleated and propagated across the whole interface.2.4 Alignment
In the device's on state, we loosely secure the holder to the top grip jaw of the Instron, as illustrated in Fig. 2c. To ensure proper alignment, the Instron is then manually lowered until the origami holder makes contact with the adhesive pad on the bottom. It is important to note that the setup isn't entirely rigid at this stage. There is some flexibility facilitated by our nuts-and-bolts configuration which allows for slight movement by hand. Once alignment is complete, the grip is tightened. During the off-state, where origami designs are affixed to strings, we thread all string loops through the Instron's upper connector. Gradually, we lower the setup while applying gentle tension to the strings, aligning the top strings and the bottom of the pattern with the upper connector rod until they touch the adhesive pad. Note that each string is the same length and can slide along the upper Instron connector. Before data collection, we perform a test run and manually adjust the Instron's upper connector to ensure proper alignment.2.5 Adhesion
While it is not the focus of this manuscript to exhaustively evaluate the strength of adhesion between PDMS and PC, it is useful to have direct measures with which the scaling models can be compared. We therefore conduct standard 90° peel tests with a 50 mm wide strip of 128 μm thick PC and a mat of 40 to 1 PDMS. Each test was repeated 3 times and the average is reported in Fig. 3, with error bars given by the standard deviation of the measurements. We note that the data is well fit by eqn (8) with n = 0.6, v* = 18.2 mm min−1 and G0 = 3.9 N m−1.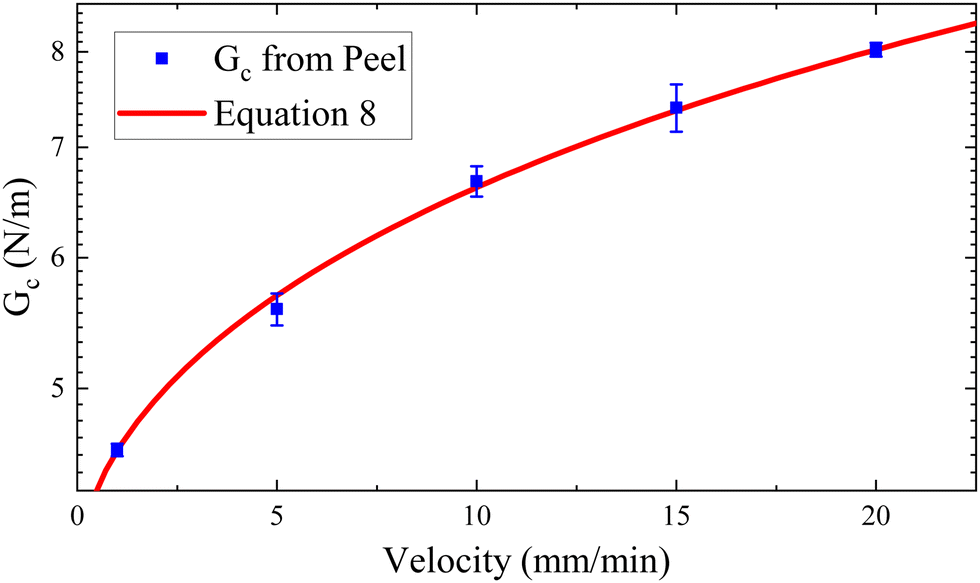 | ||
| Fig. 3 Results of peel adhesion tests between a thin PC strip and 40 to 1 PDMS. | ||
3 Scaling model
The failure force, F, of an adhesive often scales as,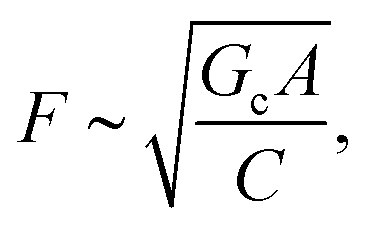 | (1) |
From our observations of the failure modes during pull-off, we identify all off-state failure as peel type (see ESI† for a movie of the off-state failure). The peel can occur in this state because the polycarbonate can easily flex and bend away from the surface during this stage of operation. In the on-state, we desire high stiffness in the devices and thus hypothesize that the device operates as a solid post. The rigidity of each device changes, so the model may be less accurate for the softer waterbomb and Kressling devices, but seems robust for the Resch (hexagonal) device.
When detaching/debonding an origami device from a substrate, the scenario for the crack will differ depending whether the device is in its stiff (on-state) or soft (off-state) configuration. We hypothesize that the on-state devices resemble a cylindrical post type pull-off test. If this is the case, then an effective radius, a, can be identified and the compliance will scale as:
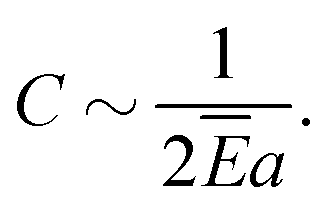 | (2) |
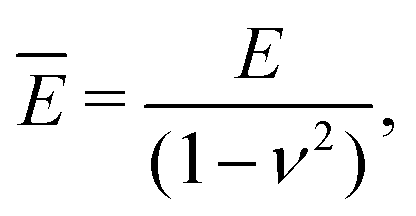 | (3) |
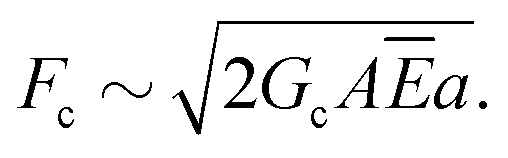 | (4) |
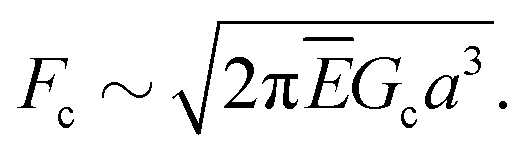 | (5) |
To model the soft state, we switch to the peel theory described by Kendall and others.2,34 The peel geometry is shown in Fig. 4b, where a thin tape with thickness t and width a creates a peeling force F which scales as (or is exact when θ = 90),
| Fc ∼ Gca. | (6) |
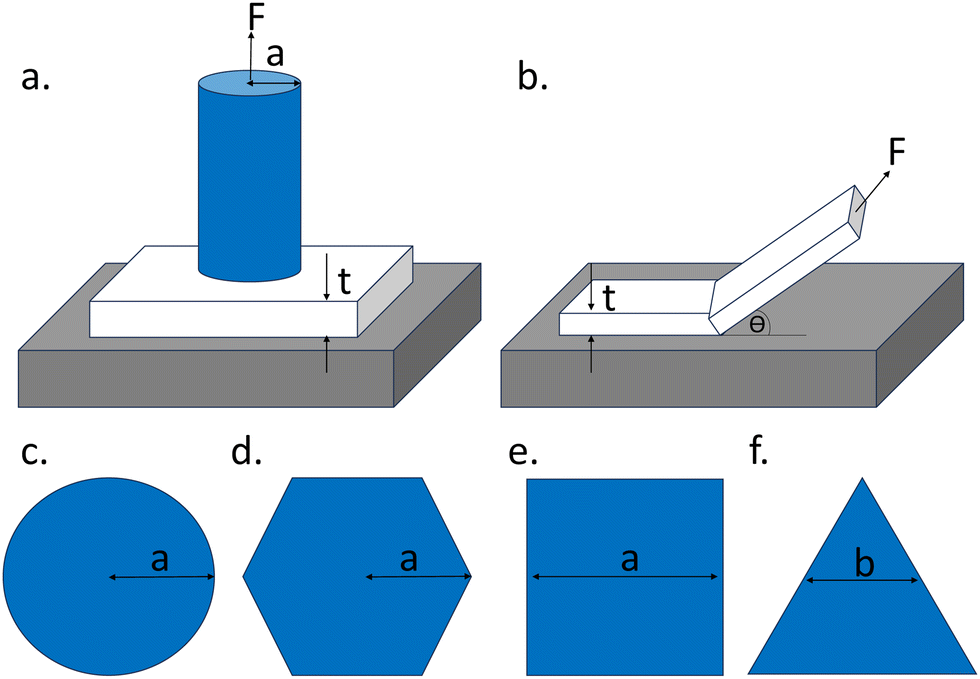 | ||
| Fig. 4 Geometric details of the models. (a) A post adhesion measurement. (b) A peel experiment. (c)–(f) Different post cross-sections. | ||
Ultimately, the two different regimes allow us to model the switching ratio of a device as:
 | (7) |
4 Results and discussion
The force vs. displacement data obtained from typical experiments is presented in Fig. 5. Fig. 5a shows the performance of the Kressling patterned structure of 1.9 cm dimensions at a speed of 10 mm min−1. In the on-state a peak force of ∼3 N is reached, and in the off-state a force of ∼2 N is reached for a switching ratio of 1.5. We attribute the unimpressive performance of this structure to the small change in compliance between the on and off states. The compliance when directly measured for this experiment is found to be 1.7 × 10⁻³ m N−1 in the on-state and 4.4 × 10⁻³ m N−1 in the off-state, verifying this claim. In short, the ridged state was not stiff enough, and the soft state was still too ridged to easily peel.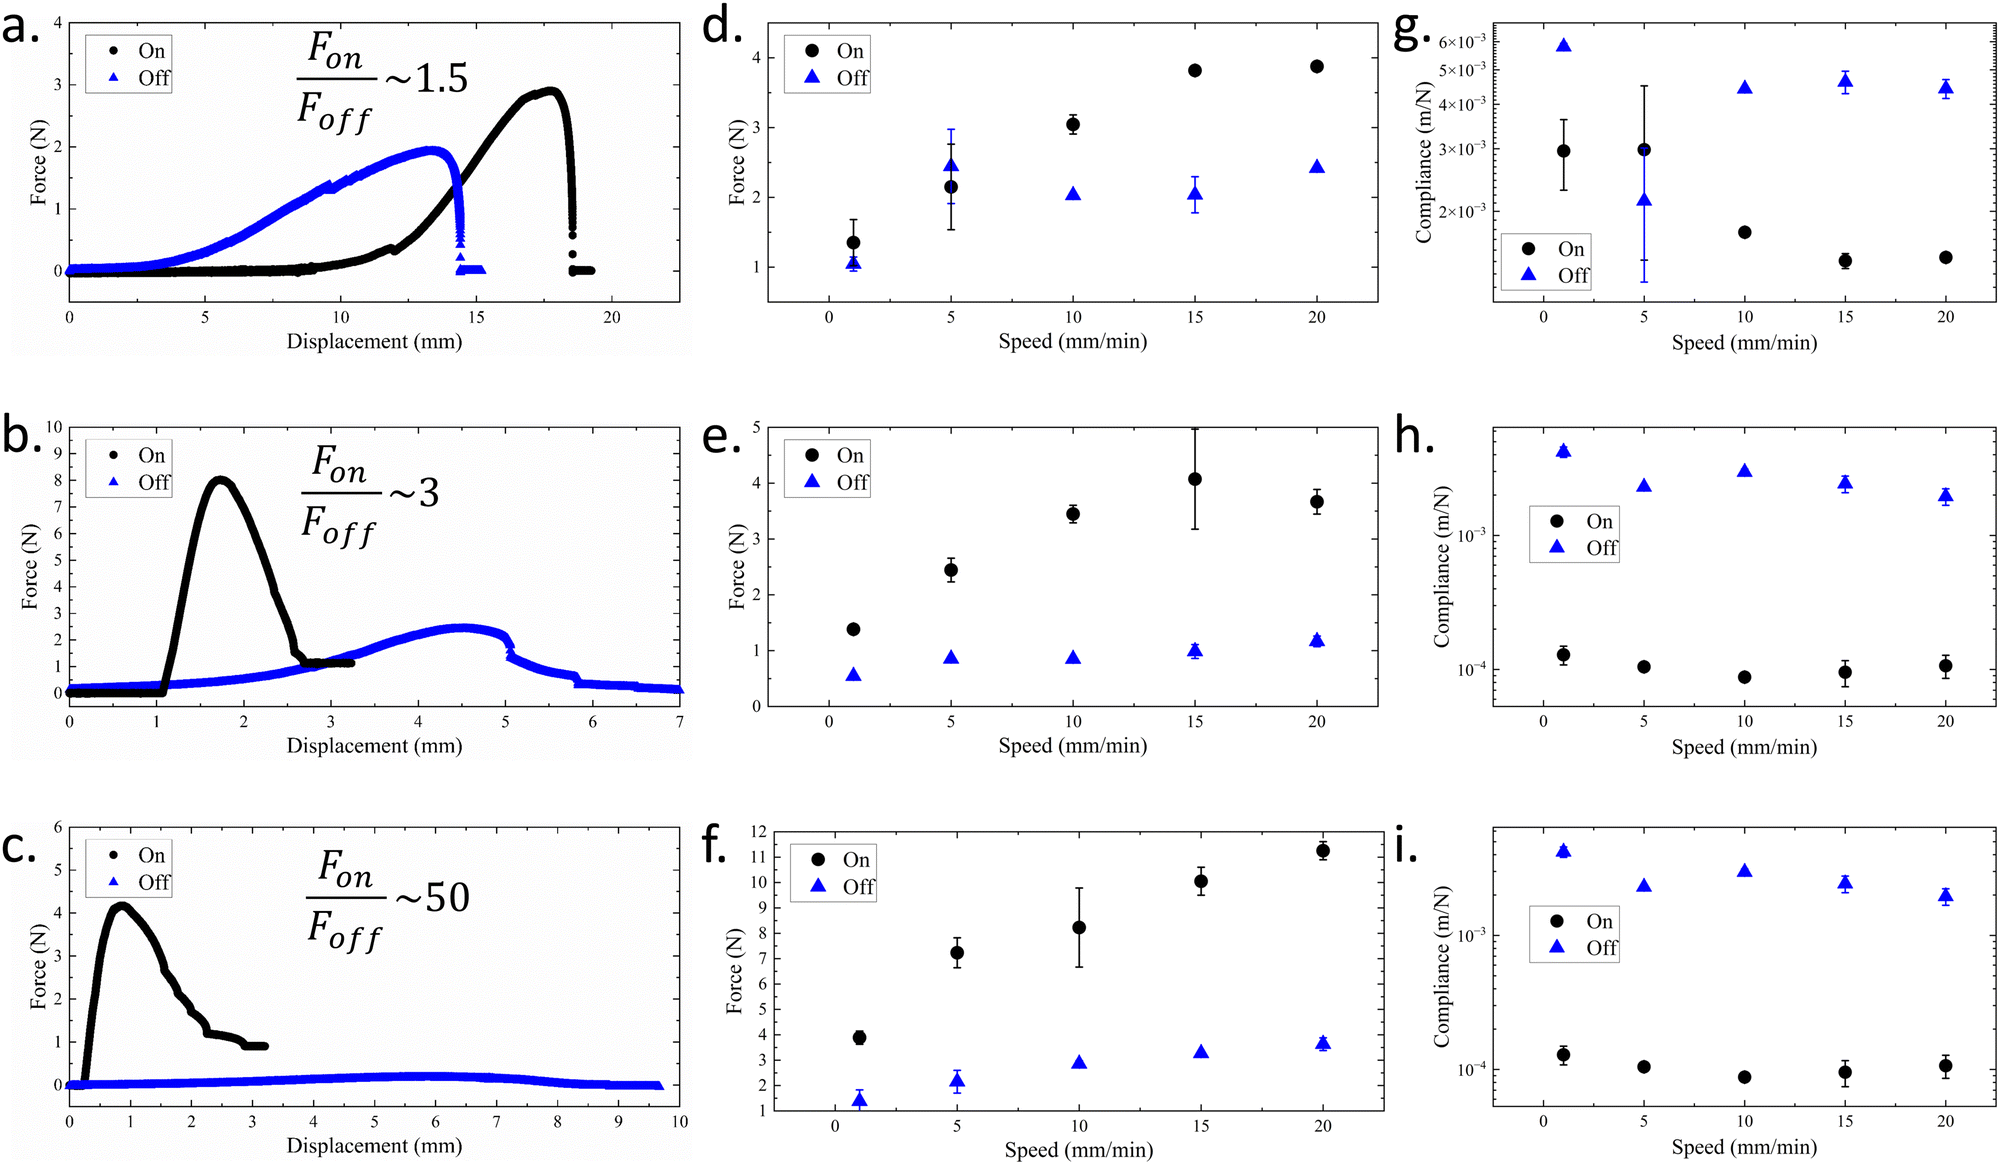 | ||
| Fig. 5 Force measurements for origami devices. Force vs. displacement curves for (a) Kresling (b) square (c) Resch origami patterns at a speed of 10 mm min−1. (d)–(f) Speed dependence of peak force for the corresponding devices. (g)–(i) Compliance as a function of speed for the corresponding devices. | ||
We believe the structure could be improved with different material choices, for example, metal or thick thermoplastic placards with hinges rather than being formed from a single sheet as in pure origami. Another limitation of the Kresling pattern is that its contact remains a solid hexagon for both on and off states, rather than splitting the contact area into an array of smaller squares or triangles.20 It has also been shown that the adhesion is twice as strong in the center of a contact patch compared to its borders,21 motivating a change in our design.
To alter stress concentration at contact we next used the waterbomb design, which in addition to breaking the contact patch into 4 units remains relatively open after folding. The open structure then allows easy supplementation of the origami folded sheet with additional structure. In this case, solid cubes of material were designed to fit into the folded PDMS sheet and an enclosure which could clamp down on the cubes and ultimately decreasing compliance of the on state. One could envision robotic actuation of the cubes, though this is beyond our current capabilities. With the supplemented structure, the on state is very stiff, and the off state can be reached by removing the outer clamping component. Fig. 5b shows the outcome for the on and off states of the waterbomb device. In this case a ratio of 3 is reached, doubling the performance of the Kressling design. Once again, the compliance mirrors the peak forces (Fig. 5h). In this case we find the on-state to have a compliance of 6.5 × 10⁻⁵ m N−1 whereas the off-state shows a compliance of 8.1 × 10⁻⁴ m N−1. The limitations of this device become apparent when observing the adhesive failure in the on state. Here the corners of the square face often bend during failure indicating that the design, while stiffer, was initiating peel in the on state (rather than a behaving as a rigid post).
Finally, a hexagonal Ron Resch pattern was developed. In this case a hexagonal unit cell was used, creating a contact face of 6 triangular units. Again, the folding is open and can be supplemented with triangular prisms and a clamping outer shell. Results showed considerable improvement resulting in a switching ratio of up to 50. In this device, stiffness is high in the on-state but the peak force of the off-state was more noticeably reduced. This is for two reasons, first there are 6 separate units to initiate peel (rather than 4 or 1), and secondly the larger amount of folding results in considerable elastic energy storage, even though the fold is partially plastically deformed.35,36 The stored elastic energy aids peeling because unfolding the structure causes the contacting surface to lose its planarity. Occasionally, devices would spontaneously open resulting in a force of zero in the off state, and thus a ratio of infinity. We specifically increased substrate adhesion to the point where this became uncommon in order to be able to systematically investigate the details of the fracture process. We also note that after holding the device in the folded state, creep occurs in the folds reducing their drive to open. Devices that had creeped significantly due to the materials elasto-plasticity, showed a significantly reduced switching ratio (to approximately 6) indicating a clear path towards designs with increased performance (increasing the sheet elasticity). Finally, we note that the changes in compliance (Fig. 5i) mirrors the increased switching ratios of this device.
Additionally, as one would expect for a plastic material such as polycarbonate, repeated opening and closing cycles reduced the “spring” of the fold and thus the switching ratio.36Fig. 6 shows a set of experiments with a 5 cm Resch device to illustrate the effect. In this experiment, the device is tested in the off-state with a new PC sheet, then the on-state, then the off-state is repeated. As is typical, the initial off-state measurement shows a much lower release force than does the repeated measurement (the ratio for the fastest speed drops from 30 to about 3). In what we report below, we ensure to used “worked” polycarbonate as this is a more realistic state for the device and more replicable measurement.
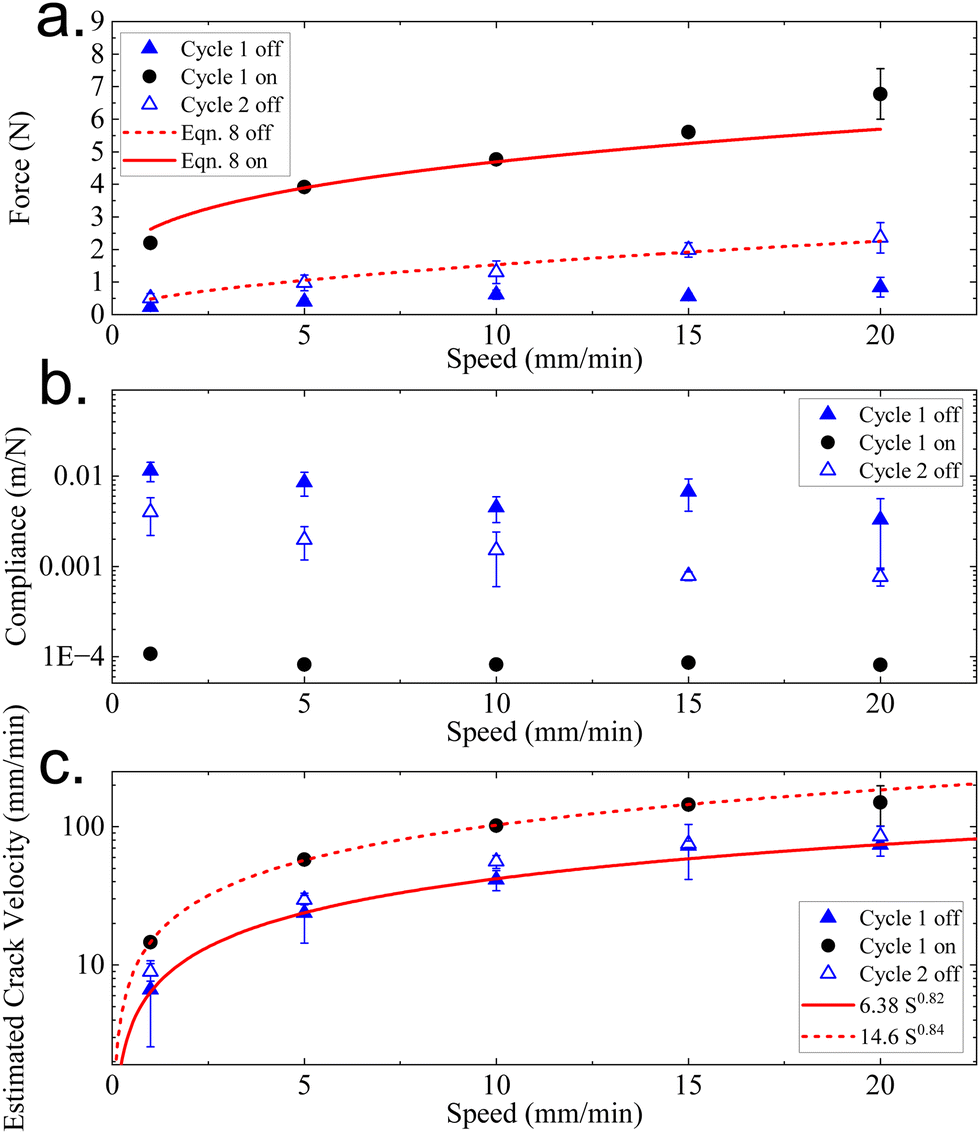 | ||
| Fig. 6 The effect of creep. Solid blue triangles depict data collected with a 5 cm Resch device at various speeds. The same device was then immediately tested in the on state (solid black circles). When the on-state measurement was complete, the off-state measurement was repeated (open blue triangles). We note a significant increase in the off state forces due to creep in the polycarbonate. Eqn (8) is fit to the on state data (solid line) and the second cycle of the off data (dashed line). Fit parameters are discussed in the text. | ||
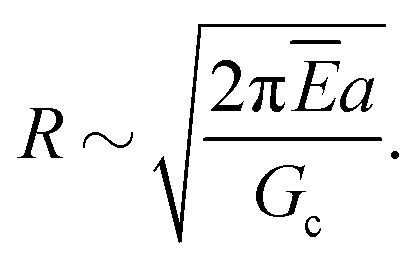
The speed a test is performed at is well known to affect adhesion of soft materials due to viscoelastic losses at the crack tip.37–40Fig. 5d–f, depict the variation in peak on and off forces as a function of Instron speed. It is evident that both the peak on and off forces increase with speed, and the difference between the peak on and peak off forces also increases with speed. The trends of Fig. 5 and 6 could, in principal, be related to the predictions of equation eqn (5) and (6) through the commonly used empirical formula describing the speed dependence of the energy release rate:
| Gc(v) = G0(1 + (v/v*)n) | (8) |
Direct measurements of the crack speed were not possible due to the opaque nature of the devices. However, estimates can be made from the device size (a) and the time it takes for the force to drop from its peak value to zero. Fig. 6c shows that the estimated speed is approximately linearly related to the machine speed and that the on-state device has cracks that move about twice as fast as in the off-state. Using the peel data (Fig. 3) as reference, this would imply that the on-state device is probing a larger Gc than the off state, though the magnitude of the difference would be less than an order of magnitude. The combination of the two effects, changing compliance and crack speed likely contribute to the differences in G0 noted above.
Our experiments did permit us to directly alter Gc through changes in the adhesive substrate. Because we found the best behaviour with the hexagonal device, we proceed to explore Gc with this particular geometry. Fig. 7 shows how the peak force for both the on state and off state increases as crosslinker density decreases for the 5 cm diameter device. In both cases a monotonic increase in force is noted. This again agrees qualitatively with eqn (5) and (6) because Gc will increase as the crosslinker density drops.42–52 We also note that the modulus will drop as the crosslinker density decreases, which does not necessarily agree with the trend shown for the on-state forces.42–52 Once again, without knowledge of the exact crack speed, it is not possible to make a direct quantitative comparison (E will not appreciably depend on crack speed, but Gc will). However, if we assume the accuracy of the relation, Gc = 200E0.49, developed in ref. 42 then both on and off-state data will scale linearly with Gc. If this is true, then normalizing each set of data by the peak force measured on a 20 to 1 sample would remove any dependence on other variables and we would expect data from both the on and off state to fall on a single master curve. Fig. 7b shows the data normalised in this way, and indeed shows a collapse to a master curve as expected. This plot can be considered a quantitative measure of the relative difference in Gc for these materials and again an indication of the accuracy of the scaling models we use in this work. For example, we expect the 50 to 1 material to have a Gc of about 2.6 times that of the 30 to 1 sample. The data of ref. 42 shows a ratio of about 3 (note the work in the reference is for Gc between glass and PDMS, not polycarbonate and PDMS as is the case here).
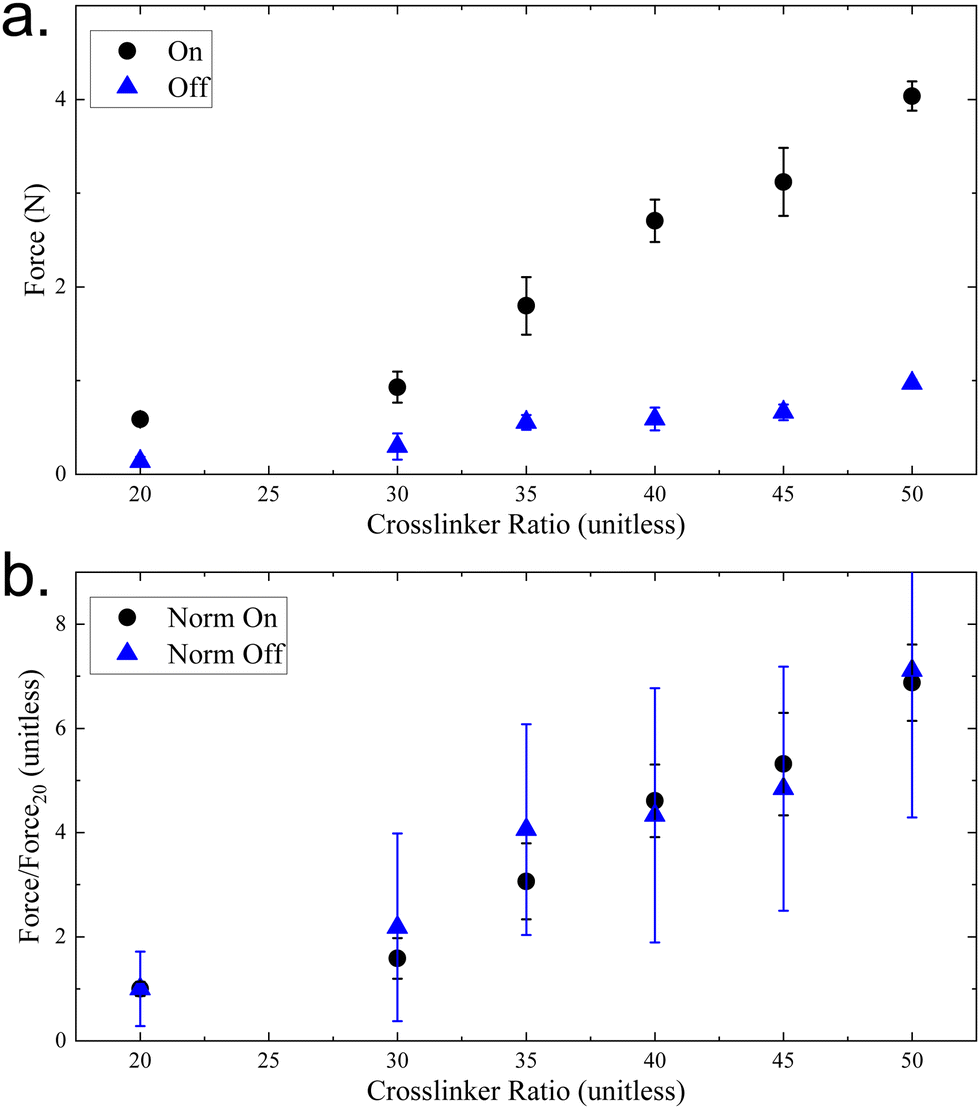 | ||
| Fig. 7 The effect of Gc. Peak force measured in the on state and in the off state plotted as a function of cross-linker density. (a) As discussed in the text, both on-state and off-state forces increase with decreasing cross-link density. (b) Each curve in (a) can be normalized by the lowest cross-link density measurement (20 to 1). Both curves collapse to a master curve showing how both modulus and Gc change identically for both modes of operation of the devices. Error in a is a standard deviation from repeated measurement. In (b) error is calculated from the error in a. using standard methods. | ||
If we make the assumption that the crack between the device and the adhesive interface will propagate at the same speed if the driving speed and the material are fixed, then a semi-quantitative evaluation of eqn (5) and (6) is possible if the focus is on geometry. To do so, several different sizes of hexagonal device were constructed and on and off-state forces were measured against a slab of 40:1 Sylgard. Fig. 8a. shows a plot of the triangle dimension (a) against subsequent detachment forces for experiments run at 5 mm min−1. For the on state a represents the post diameter, whereas in the off state a represents the width of the peeling region. The agreement between the scaling predictions is noteworthy – on state data is well fit with a power law of F ∼ Cona3/2, and off state data is consistent with an F ∼ Coffa1 power law fit. We find Con = 1330 N m−3/2, which would be consistent with a Gc of approximately 51 N m−1 (given the modulus of 40:1 Sylgard is about 50 kPa). On the other hand, we find Coff = 42 N m−1, which would imply Gc ∼ 42 N m−1, which is not far from the on-state result.
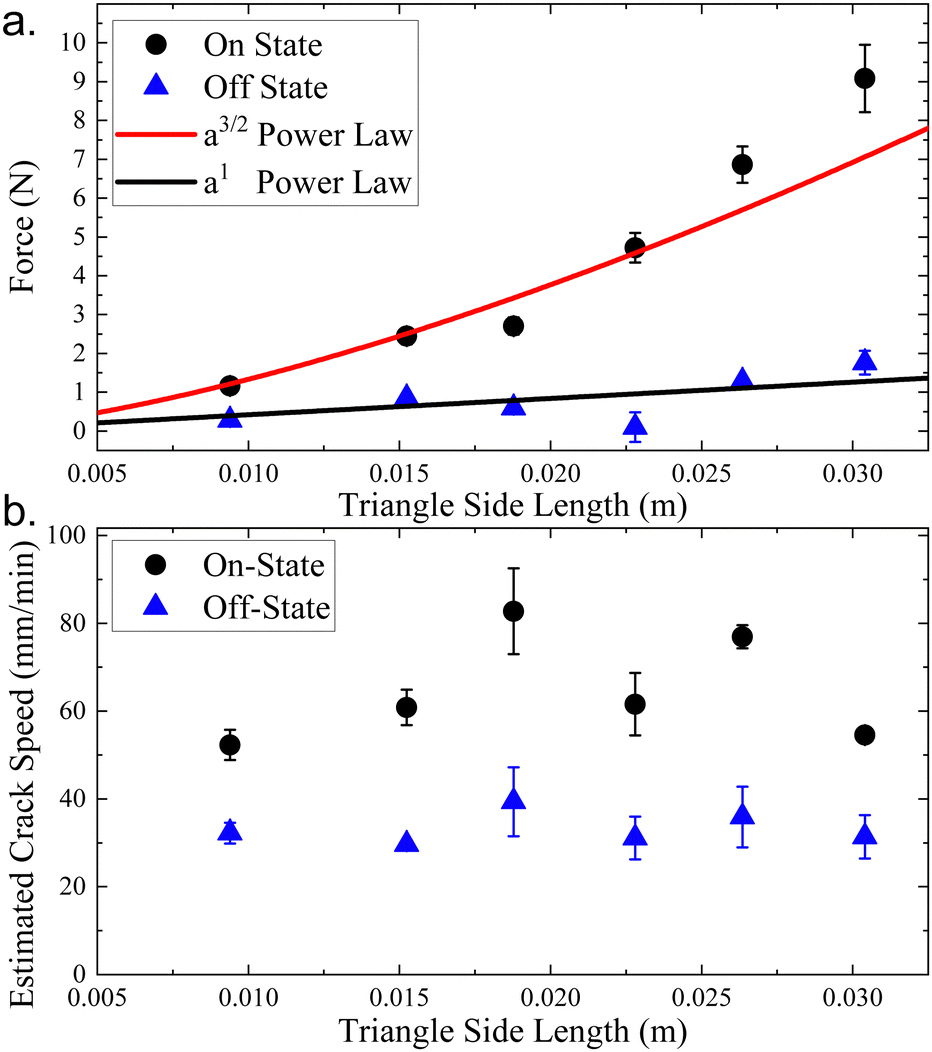 | ||
| Fig. 8 Size dependence of adhesive force. (a) Plot shows force data for various sized devices in the on (black circles) and off (blue triangles) states. Fits to the model described in the text are shown. (b) Estimated crack speed for each device and state. While some noise is evident, both on and off states show relatively constant crack speeds. The on-state has a higher crack speed than the off-state. | ||
To verify the assumption of constant crack speed, we once again estimate the speed of the crack from the force–displacement data. Fig. 8b. shows that crack speed does not vary with the device size (though the data is noisy) and that the on-state device has a higher crack speed of approximately 65 mm min−1 when compared to the off-state cracks (speed approximately 33 mm min−1). Once again the difference is approximately a factor of 2 as noted earlier. At these speeds the peel data of Fig. 3 would suggest Gc = 12 N m−1 for the on-state and 9.5 for the off-state. The ratio between the accepted peel Gc values and those obtained via scaling indicates that a constant of order 4.4 to 4.2 is needed to make the scaling models quantitative.
5 Conclusions
In conclusion, the exploration of reversible or switchable adhesives holds great promise in addressing challenges related to temporary attachment and detachment of various applications. In this work we found that origami devices with two stable states could be used to create mechanically switchable adhesive devices. We found a Kresling pattern allowed a switching ratio of 1.5, a waterbomb pattern a ratio of 3, but a Ron Resch patterned device could attain a ratio of 50, but more typically showed a ratio of about 6 due to creep. The difference in the latter ratios being attributed to the degree of plasticity in the creases of the origami shape. Increased working of the creases reduced the switching ratio.Switching ratios typically increased with increasing motor speed, and showed a predictable size dependence. Further, compliance is found to change dramatically between the on and off states and cracks are found to propagate approximately twice as fast in the on-state as in the off-state. Ultimately, the function of our devices have proven the utility of origami based design for switchable adhesive development. We believe that further investigation of supplemented origami devices could lead to devices with improved performance and that could be easily integrated into soft robotic gripping systems. In this case, origami grippers would be ideal for repetitive pick and place operations which don't require huge switching ratios for function but do require low power consumption. Finally, other modern techniques in adhesive design could be combined with the basic idea behind our mechanical switching scheme. For example, origami schemes could be combined with directional peel through kirigami for increased control over the adhesive performance or with modern post-style adhesives for increased roughness and dirt tolerance.
Author contributions
Conceptualization – ABC, formal analysis – ABC, TE, WJ funding acquisition – ABC, investigation – TE, WJ, TT, methodology – TE, WJ, ABC, supervision – ABC, visualization – WJ, ABC, writing – original draft – WJ, TE, writing – review & editing – WJ, ABC.Conflicts of interest
There are no conflicts to declare.Acknowledgements
The authors gratefully acknowledge the support of the National Science Foundation through grant number CMMI-2011681.Notes and references
- A. B. Croll, N. Hosseini and M. D. Bartlett, Adv. Mater. Technol., 2019, 4, 1900193 CrossRef.
- M. D. Bartlett, S. W. Case, A. J. Kinloch and D. A. Dillard, Prog. Mater. Sci., 2023, 137, 101086 CrossRef CAS.
- D.-G. Hwang, K. Trent and M. D. Bartlett, ACS Appl. Mater. Interfaces, 2018, 10, 6747–6754 CrossRef CAS PubMed.
- A. B. M. T. Haque, D. Hwang and M. D. Bartlett, Adv. Mater. Technol., 2022, 7, 2101241 CrossRef.
- A. Rafsanjani, Y. Zhang, B. Liu, S. M. Rubinstein and K. Bertoldi, Sci. Rob., 2018, 3, eaar7555 CrossRef PubMed.
- D.-G. Hwang, C. Lee, X. Yang, J. M. Pérez-González, J. Finnegan, B. Lee, E. J. Markvicka, R. Long and M. D. Bartlett, Nat. Mater., 2023, 22, 1030–1038 CrossRef CAS PubMed.
- R. Spolenak, S. Gorb, H. Gao and E. Arzt, Proc. R. Soc. A, 2005, 461, 305–319 CrossRef.
- H. E. Jeong, J.-K. Lee, H. N. Kim, S. H. Moon and K. Y. Suh, Proc. Natl. Acad. Sci. U. S. A., 2009, 106, 5639–5644 CrossRef CAS PubMed.
- L. Qu, L. Dai, M. Stone, Z. Xia and Z. L. Wang, Science, 2008, 322, 238–242 CrossRef CAS PubMed.
- C. Greiner, E. Arzt and A. Del Campo, Adv. Mater., 2009, 21, 479–482 CrossRef CAS.
- M. P. Murphy, S. Kim and M. Sitti, ACS Appl. Mater. Interfaces, 2009, 1, 849–855 CrossRef CAS PubMed.
- H. Lee, B. P. Lee and P. B. Messersmith, Nature, 2007, 448, 338–341 CrossRef CAS PubMed.
- J. M. Bullock, P. Drechsler and W. Federle, J. Exp. Biol., 2008, 211, 3333–3343 CrossRef PubMed.
- G. Huber, S. N. Gorb, R. Spolenak and E. Arzt, Biol. Lett., 2005, 1, 2–4 CrossRef PubMed.
- B. Chen, P. Wu and H. Gao, Proc. R. Soc. A, 2008, 464, 1639–1652 CrossRef.
- M. D. Bartlett, A. B. Croll, D. R. King, B. M. Paret, D. J. Irschick and A. J. Crosby, Adv. Mater., 2012, 24, 1078–1083 CrossRef CAS PubMed.
- M. D. Bartlett, A. B. Croll and A. J. Crosby, Adv. Funct. Mater., 2012, 22, 4985–4992 CrossRef CAS.
- G. Wan, Y. Tang, K. T. Turner, T. Zhang and W. Shan, Adv. Funct. Mater., 2023, 33, 2209905 CrossRef CAS.
- N. Kidambi and K. Wang, Phys. Rev. E, 2020, 101, 063003 CrossRef CAS PubMed.
- E. Arzt, S. Gorb and R. Spolenak, Proc. Natl. Acad. Sci. U. S. A., 2003, 100, 10603–10606 CrossRef CAS PubMed.
- S. N. Gorb, Am. Entomol., 2005, 51, 31–35 CrossRef.
- T. Jules, A. Reid, K. E. Daniels, M. Mungan and F. Lechenault, Phys. Rev. Res., 2022, 4, 013128 CrossRef CAS.
- H. Tian, H. Liu, J. Shao, S. Li, X. Li and X. Chen, Soft Matter, 2020, 16, 5599–5608 RSC.
- B. Kresling, Proceedings of the 6th International Conference on Computation of Shell and Spatial Structures-IASS-IACM 2008: “Spanning Nano to Mega”, 2008, pp. 1–4.
- P. Bhovad, J. Kaufmann and S. Li, Extreme Mech. Lett., 2019, 32, 100552 CrossRef.
- L. H. Donnell, Stability of thin-walled tubes under torsion, National Advisory Committee for Aeronotics technical report, 1935.
- S. Guest and S. Pellegrino, J. Appl. Mech., 1994, 61, 773–777 CrossRef.
- S. Guest and S. Pellegrino, J. Appl. Mech., 1994, 61, 778–783 CrossRef.
- S. Guest and S. Pellegrino, J. Appl. Mech., 1996, 63, 77–83 CrossRef.
- H.-Y. Hwang, Int. J. Solids Struct., 2021, 230, 111158 CrossRef.
- Y. Chen, H. Feng, J. Ma, R. Peng and Z. You, Proc. R. Soc. A, 2016, 472, 20150846 CrossRef PubMed.
- R. D. Resch, Proceedings of the June 4–8, 1973, National Computer Conference and Exposition, 1973, pp. 643–650.
- K. R. VanDonselaar, D. A. Bellido-Aguilar, M. Safaripour, H. Kim, J. J. Watkins, A. J. Crosby, D. C. Webster and A. B. Croll, J. Chem. Phys., 2023, 159, 184708 CrossRef CAS PubMed.
- K. Kendall, J. Phys. D: Appl. Phys., 1975, 8, 1449 CrossRef.
- F. Lechenault, B. Thiria and M. Adda-Bedia, Phys. Rev. Lett., 2014, 112, 244301 CrossRef CAS PubMed.
- T. Jules, F. Lechenault and M. Adda-Bedia, Phys. Rev. E, 2020, 102, 033005 CrossRef CAS PubMed.
- D. H. Kaelble, J. Colloid Sci., 1964, 19, 413–424 CrossRef.
- A. N. Gent and J. Schultz, J. Adhes., 1972, 3, 281–294 CrossRef CAS.
- E. H. Andrews, A. J. Kinloch and H. W. Melville, Proc. R. Soc. London, Ser. A, 1973, 332, 385–399 CAS.
- Q. Han, L. Zhang and Y. Wu, RSC Adv., 2019, 9, 29813–29820 RSC.
- L. Brely, F. Bosia and N. M. Pugno, Bioinspir. Biomim., 2018, 13, 026004 CrossRef PubMed.
- T. Elder, T. Twohig, H. Singh and A. B. Croll, Soft Matter, 2020, 16, 10611–10619 RSC.
- E. Kroner, R. Maboudian and E. Arzt, Adv. Eng. Mater., 2010, 12, 398–404 CrossRef CAS.
- E. Kroner, D. R. Paretkar, R. M. McMeeking and E. Arzt, J. Adhesion, 2011, 87, 447–465 CrossRef CAS.
- A. Galliano, S. Bistac and J. Schultz, J. Colloid interface Sci., 2003, 265, 372–379 CrossRef CAS PubMed.
- S. Vlassov, S. Oras, M. Antsov, I. Sosnin, B. Polyakov, A. Shutka, M. Y. Krauchanka and L. Dorogin, Rev. Adv. Mater. Sci., 2018, 56, 62–78 CAS.
- S. Perutz, E. Kramer, J. Baney, C.-Y. Hui and C. Cohen, J. Polym. Sci., Part B: Polym. Phys., 1998, 36, 2129–2139 CrossRef CAS.
- F. Carrillo, S. Gupta, M. Balooch, S. J. Marshall, G. W. Marshall, L. Pruitt and C. M. Puttlitz, J. Mater. Res., 2005, 20, 2820–2830 CrossRef CAS.
- Y. Cao, D. Yang and W. Soboyejoy, J. Mater. Res., 2005, 20, 2004–2011 CrossRef CAS.
- F. Schneider, T. Fellner, J. Wilde and U. Wallrabe, J. Micromech. Microeng., 2008, 18, 065008 CrossRef.
- I. D. Johnston, D. K. McCluskey, C. K. L. Tan and M. C. Tracey, J. Micromech. Microeng., 2014, 24, 035017 CrossRef CAS.
- T. K. Kim, J. K. Kim and O. C. Jeong, Microelectron. Eng., 2011, 88, 1982–1985 CrossRef CAS.
Footnotes |
| † Electronic supplementary information (ESI) available: Movie 1 showing adhesive failure of an off-state Ron Resch sample. See DOI: https://doi.org/10.1039/d4sm00082j |
| ‡ These authors contributed equally to this work. |
| This journal is © The Royal Society of Chemistry 2024 |