 Open Access Article
Spontaneous pattern formation in monolayers of binary mixtures with competing interactions
O.
Patsahan
 a,
A.
Meyra
 bc and
A.
Ciach
 *d
*d
aInstitute for Condensed Matter Physics of the National Academy of Sciences of Ukraine, 1 Svientsitskii St., 79011 Lviv, Ukraine
bInstituto de Física de Líquidos y Sistemas Bilógicos, UNLP-CONICET, 59-789, 1900 La Plata, Argentina
cDepto. Ing. Mecánica 60 124, UTN-FRLP, 1900 La Plata, Argentina
dInstitute of Physical Chemistry, Polish Academy of Sciences, 01-224 Warszawa, Poland. E-mail: aciach@ichf.edu.pl
First published on 5th January 2024
Abstract
A model for a monolayer of two types of particles spontaneously forming ordered patterns is studied using a mesoscopic theory and MC simulations. We assume hard-cores of the same size a for both components. For r > a, like particles attract and repel each other at short and large distances, respectively, with the same potential u(r) for both species, and the cross-interaction is −u(r). The model is inspired by oppositely charged particles or macromolecules with preferential solubility in different components of a solvent that is close to a miscibility critical point, in particular by inclusions in biological membranes. We obtain the phase diagram in the chemical potentials and temperature variables as well as in the concentration, density and temperature variables, using the mean-field one-shell approximation. We find that the presence of the second component significantly extends the temperature range of stability of the ordered phases. We obtain three stable phases with periodic concentration: the lamellar L phase with alternating stripes of the two components for similar chemical potentials, and a hexagonal arrangement of the clusters of the minority component in the liquid of the majority component. The latter two phases, however, are stable only at relatively high temperatures. At lower temperatures, the L phase coexists with a disordered one-component fluid or with very dilute gas with mixed components. At still lower temperatures, the one-component phase coexisting with the L phase can be disordered or ordered, depending on the chemical potentials. The theoretical results are confirmed by MC simulations for selected thermodynamic states.
I. Introduction
Spontaneous pattern formation in soft matter or biological systems1–5 is often induced by competing interactions between particles or macromolecules. Due to the presence of electric charges, the particles or proteins repel each other at distances determined by the screening length, but at shorter distances, solvent-induced attraction can dominate. The attraction can result in particular from the thermodynamic Casimir potential induced by critical concentration fluctuations in the solvent when it is close to the miscibility critical point.6–8 An important example of a system that is close to the miscibility critical point is a multicomponent lipid bilayer in living organisms.9,10 Because of the fluctuation-induced Casimir interactions, membrane inclusions preferentially soluble in the same or in different membrane components attract or repel each other, respectively. The electrostatic interactions between charged membrane proteins were typically disregarded because the concentration of ions in their surroundings is large,11 and according to classical theories, the screening length should be very short. Recently, however, it was discovered that in concentrated ionic solutions, the screening length increases linearly with the increasing density of ions and can become very large.12–15 Thus, the electrostatic interactions between the charged membrane inclusions may be important, and further studies are required to clarify their role.While for particular membrane proteins, the interactions resulting from the Casimir and the electrostatic forces are not known yet, in the case of charged selective particles in the critical mixture with a small amount of dissolved ions, the interactions are known very well.8,16 Parallel flat surfaces separated by distance L and immersed in the near-critical mixture with ionic impurities interact with the potential
v(L) ≈ AC![[thin space (1/6-em)]](https://www.rsc.org/images/entities/char_2009.gif) exp(−L/ξ) + Ael exp(−L/ξ) + Ael![[thin space (1/6-em)]](https://www.rsc.org/images/entities/char_2009.gif) exp(−L/λD), exp(−L/λD), | (1) |
For identical weakly charged and strongly selective surfaces, the interactions can have a form of short-range attraction long-range repulsion (SALR) when ξ/λD < 1. On the other hand, if ξ/λD < 1, oppositely charged hydrophilic and hydrophobic surfaces can repel and attract each other at short and large distances, respectively. Thus, the interactions between like particles and the cross-interaction are of opposite sign. Note that in view of the nonmonotonic dependence of the screening length on the density of ions, the interactions can have similar features for small and large densities. In the case of curved surfaces of spherical particles, the exponential terms in (1) should be divided by the particle distance L, and the double Yukawa potential with an opposite sign of the two terms is obtained.
The SALR potential is sometimes called “a mermaid potential” because of an attractive head and a repulsive tail.17 Such interactions are interesting because they can lead to self-assembly into aggregates with the size determined by the shape of the potential.2,18–21 The models with the SALR interactions were intensively studied using theoretical and simulation methods in three (3D) and two dimensions (2D),18–34 the latter case being suitable for the self-assembly in quasi 2D membranes at fluid interfaces or at solid substrates. The universal sequence of ordered patterns for increasing density in 2D is as follows: disordered gas – hexagonal pattern of clusters – stripes – hexagonal pattern of voids – disordered liquid.18,20,25,26,35 In the gas and the liquid, randomly distributed clusters and voids with well-defined size are present. If the interactions between the membrane inclusions were of the SALR form, then clusters of well-defined size would be present. Notably, clusters of membrane proteins are necessary for signaling and other important functions of life.4,5
It is natural to ask the question how the presence of different particles or macromolecules influences the self-assembly and pattern formation. Mixtures of particles with competing interactions having spherical symmetry, however, were much less studied. Only recently, several models for inhomogeneous binary mixtures were introduced and studied using theory and simulations.36–42 As far as we know, experimental studies of self-assembly induced by the electrostatic and Casimir potentials were restricted to particles of the same type.43–45 As a result, fundamental questions such as the symmetries of the ordered phases and the sequence of patterns for varying chemical potentials and temperature in mixtures with competing interactions remain open.
In this work, we attempt to fill this gap by considering a model with the interactions inspired by the oppositely charged hydrophilic and hydrophobic particles in the near-critical solvent with ξ/λD < 1. We assume the SALR interactions between like particles, and the cross interaction of the opposite sign. The model was introduced in ref. 36 and named “two mermaids and a peacock” model because of the mermaid potential between like particles, and a repulsive head and an attractive tail of the cross-interaction. We should stress that although the model is inspired by the oppositely charged particles or macromolecules with different adsorption preferences for the components of the critical solvent, it is not restricted to such physical systems, and can be considered as a generic model for spontaneous pattern formation in binary mixtures with competing interactions. Similar competing interactions may have different origins in different mixtures, and the ordered patterns on the length scale of nanometers or micrometers self-assembled at lipid bilayers, fluid interfaces or solid substrates may find numerous applications.
A phase diagram for the two mermaids and a peacock model was determined theoretically and by molecular dynamics (MD) simulations in ref. 46 for equal chemical potentials of the two components in 3D. It was found that a gas coexists with a dense lamellar phase of alternating layers rich in the first and the second component. At low temperature T, the dense phase has a crystalline structure and the gas is very dilute. The crystal melts upon heating, but the alternating composition is preserved in the liquid layers. The density difference between the gas and the lamellar phase decreases with increasing T.
In this work, we determine the (μ1, μ2, T) phase diagram for this mixture within the mesoscopic theory in the mean-field approximation for a broad range of the chemical potentials μ1, μ2 and temperature T for a monolayer of the particles. The results are verified by Monte Carlo (MC) simulations for selected thermodynamic states.
Vertical displacements of particles embedded in biological membranes or adsorbed at fluid interfaces are typically smaller than their radius a/2, and such monolayers can be considered as quasi-2D systems. In simulations, we consider particles confined in a slit of a width 1.5a that should mimic a monolayer with average positions of particle centers on a plane, and focus on patterns formed by the projections of the particles on this plane. In the theoretical model, we neglect the vertical displacements of the particles that could lead to slight modification of the internal energy and entropy, but no extra patterns would emerge, and only slight shifts of the coexistence lines would appear. In a 2D model, the unnecessary complication of the calculations is avoided.
In Section IIA, we briefly summarize the mesoscopic theory in the mean-field (MF) approximation and determine the boundary of stability of the disordered phase in Section IIB. The one-shell approximation and the method of obtaining the phase equilibria are described in Section IIC. In Section III, we introduce the interaction potential for which the theoretical and simulation results are obtained. The theoretical results are described in Section IVA, and in Section IVB, the representative patterns obtained in the MC simulations are presented. In Section V, we discuss and summarize the results.
II. Mesoscopic theory for symmetrical binary mixtures
A. Mesoscopic grand-potential functional in mean-field approximation
The theory for mixtures with spontaneously formed inhomogeneities on the mesoscopic length scale was developed in ref. 47. Here we briefly summarize it for binary symmetrical mixtures of particles having the same diameter a that sets the length unit. For simplicity of calculations, we assume that the interaction between particles of the same component is u11 = u22 = u and depends only on distance r between the particles. In addition, we assume that for r > 1 (in a-units), u(r) is attractive at short distances and repulsive at large distances (SALR or ‘mermaid’ potential17,19). With such interactions, the particles in the one component system self-assemble into various aggregates and can form regular patterns at sufficiently low temperature T.20,21,31,48 Finally, we assume that the cross-interaction is of opposite sign, and to simplify the calculations, we postulate that u12(r) = −u(r) for r > 1.For the description of the ordering on the mesoscopic length scale, we consider volume fractions ζi(r) with i = 1, 2 in the mesoscopic regions around r. For given forms of ζi(r), i.e. with neglected fluctuations on the mesoscopic length scale, the pair distribution function for our symmetrical mixture is approximated by gij = θ(r − 1), where θ(x) = 1 for x > 0, and θ(x) = 0 for x < 0 is the Heaviside unit step function, and the internal energy takes the form
 | (2) |
 . The factor
  is present because the volume fraction rather than density is used in (2). We use the tilde for functions in Fourier representation. At this stage, we do not specify the form of V, and only require that Ṽ(k) takes a global negative minimum for k = k0 > 0. With such interactions, the concentration wave with the wavenumber k0 leads to the largest decrease of the internal energy compared to the homogeneous state. This decrease of U competes with the decrease of the entropy, for which we assume the same form as for the hard-sphere mixture in the local density approximation,
 | (3) |
 is the local dimensionless density of the i-th component, and ζ = ζ1 + ζ2. The first two terms come from the entropy of mixing, and the last term is the contribution to the free energy associated with the packing of the hard cores. In an open system, the last factors determining the structure are the chemical potentials μi of the two components.
In this MF approximation, the grand potential functional takes in terms of c = ζ1 − ζ2 and ζ = ζ1 + ζ2 the following form
 | (4) |
 and
and  , and U and S are given in (2) and (3), respectively. In equilibrium, c and ζ correspond to the minimum of ΩMF[c,ζ] for given T, μ+, and μ−. In this work, we neglect the fluctuation contribution to the grand potential that can play a significant role for weakly ordered phases. The role of the variance of the local concentration will be studied in future works.
B. Boundary of stability of the homogeneous phase in the mean-field approximation
At high temperature, the system is homogeneous and c(r) =![[c with combining macron]](https://www.rsc.org/images/entities/i_char_0063_0304.gif) and ζ(r) =
and ζ(r) = ![[small zeta, Greek, macron]](https://www.rsc.org/images/entities/i_char_e0c7.gif) . When T decreases, oscillatory perturbations of the concentration, c −
. When T decreases, oscillatory perturbations of the concentration, c − ![[c with combining macron]](https://www.rsc.org/images/entities/i_char_0063_0304.gif) ∝ cos(xk0) and superposition of such waves in different directions can induce instability of the disordered homogeneous phase because such waves lead to the largest decrease of U. Although the volume-fraction waves are not directly energetically favored (see (2)), the coupling between c and ζ in the entropic contribution to Ω can support such waves.
∝ cos(xk0) and superposition of such waves in different directions can induce instability of the disordered homogeneous phase because such waves lead to the largest decrease of U. Although the volume-fraction waves are not directly energetically favored (see (2)), the coupling between c and ζ in the entropic contribution to Ω can support such waves.
Let us consider periodic perturbations about the space-averaged concentration and volume fraction, ![[c with combining macron]](https://www.rsc.org/images/entities/i_char_0063_0304.gif) and
and ![[small zeta, Greek, macron]](https://www.rsc.org/images/entities/i_char_e0c7.gif) , of the form
, of the form
c(r) = ![[c with combining macron]](https://www.rsc.org/images/entities/i_char_0063_0304.gif) + Φg(r), ζ(r) = + Φg(r), ζ(r) = ![[small zeta, Greek, macron]](https://www.rsc.org/images/entities/i_char_e0c7.gif) + Ψg(r), + Ψg(r), | (5) |
 and
and  , with Vu denoting the volume or the area of the unit cell of the periodic structure in three or two dimensional systems, respectively. Here, we limit ourselves to 2D patterns expected for particles confined in narrow slits or embedded in bilayers.
In the one-component system with the SALR interactions, stripes and hexagonal arrangement of clusters or voids were found in the previous studies of the 2D models.18,20,26 In the symmetrical binary mixture with ![[c with combining macron]](https://www.rsc.org/images/entities/i_char_0063_0304.gif) = 0, alternating stripes of the first and second component were observed for this type of interactions.46 For a certain range of
= 0, alternating stripes of the first and second component were observed for this type of interactions.46 For a certain range of ![[c with combining macron]](https://www.rsc.org/images/entities/i_char_0063_0304.gif) ≠ 0, the hexagonal arrangement of clusters of the minority component filling the voids formed by the majority component can be expected based on the layers adsorbed at a surface attracting particles of the first species, and on the results obtained for a triangular lattice model of a similar mixture.49,50 In principle, a chess-board pattern can occur in addition to the alternating stripes for
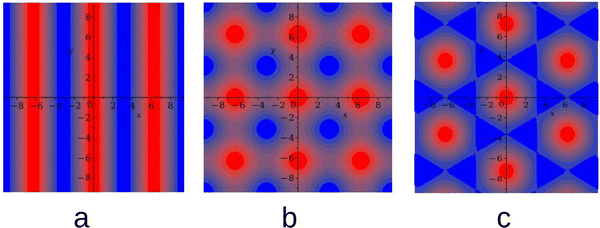
≠ 0, the hexagonal arrangement of clusters of the minority component filling the voids formed by the majority component can be expected based on the layers adsorbed at a surface attracting particles of the first species, and on the results obtained for a triangular lattice model of a similar mixture.49,50 In principle, a chess-board pattern can occur in addition to the alternating stripes for ![[c with combining macron]](https://www.rsc.org/images/entities/i_char_0063_0304.gif) = 0. We assume that such patterns can be stable or metastable in the considered mixture and shall verify this assumption by MC simulations at different parts of the phase space. The g(r) functions for the above patterns are shown in Fig. 1. The mathematical formulas for g(r) describing the 2D patterns are given in Appendix. Note that different combinations of signs and magnitudes of Φ, Ψ can correspond to different hexagonal patterns for the same form of g(r), namely to clusters or bubbles in the one-component system, or to clusters of the minority component in the liquid of the majority component.
= 0. We assume that such patterns can be stable or metastable in the considered mixture and shall verify this assumption by MC simulations at different parts of the phase space. The g(r) functions for the above patterns are shown in Fig. 1. The mathematical formulas for g(r) describing the 2D patterns are given in Appendix. Note that different combinations of signs and magnitudes of Φ, Ψ can correspond to different hexagonal patterns for the same form of g(r), namely to clusters or bubbles in the one-component system, or to clusters of the minority component in the liquid of the majority component.
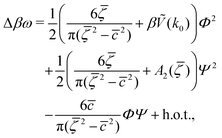
In the case of 2D patterns, we consider the grand potential per unit area, ω = ΩMF/A. For c and ζ of the form (5), the grand potential per unit area takes the form
 | (6) |
 | (7) |
 | (8) |
 | (9) |
![[c with combining macron]](https://www.rsc.org/images/entities/i_char_0063_0304.gif) ,
, ![[small zeta, Greek, macron]](https://www.rsc.org/images/entities/i_char_e0c7.gif) , T*) with
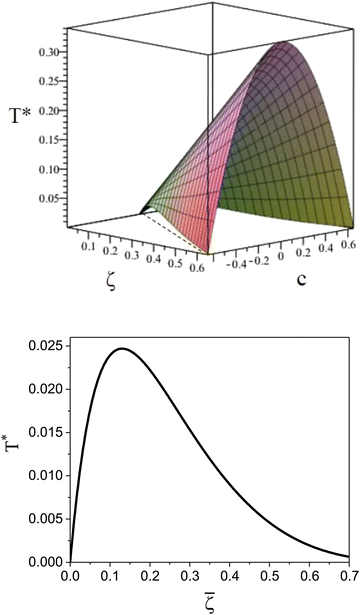
, T*) with  , the homogeneous phase is unstable, and either one of the periodic structures is present, or different phases coexist. Note that when the dimensionless temperature is given by the ratio of the thermal energy and the energy gain due to the excitation of the concentration wave with the optimal wavelength and unitary amplitude, the λ-surface is universal, i.e. independent of the form of the interactions. This universality resembles the law of the corresponding states in the van der Waals theory.
It is instructive to compare  for the one-component system with
 ![[small zeta, Greek, macron]](https://www.rsc.org/images/entities/i_char_e0c7.gif) =
= ![[c with combining macron]](https://www.rsc.org/images/entities/i_char_0063_0304.gif) (i.e. with ζ2 = 0), where
(i.e. with ζ2 = 0), where  , and the symmetrical mixture with
 ![[c with combining macron]](https://www.rsc.org/images/entities/i_char_0063_0304.gif) = 0 where
= 0 where  (see Fig. 2). Note that the ordered phases can be present at much higher temperature when the second component is added. For given
 ![[small zeta, Greek, macron]](https://www.rsc.org/images/entities/i_char_e0c7.gif) , the temperature at the instability of the homogeneous phase takes the maximum when both components are in equal proportions. Moreover, in the one component case, the temperature at the instability takes the maximum at much smaller
, the temperature at the instability of the homogeneous phase takes the maximum when both components are in equal proportions. Moreover, in the one component case, the temperature at the instability takes the maximum at much smaller ![[small zeta, Greek, macron]](https://www.rsc.org/images/entities/i_char_e0c7.gif) than in the mixture with
than in the mixture with ![[c with combining macron]](https://www.rsc.org/images/entities/i_char_0063_0304.gif) = 0, where it linearly increases with
= 0, where it linearly increases with ![[small zeta, Greek, macron]](https://www.rsc.org/images/entities/i_char_e0c7.gif) .
.
It is also interesting to analyze the λ-surface in the (μ−, μ+, T*) variables, because in these variables, we construct the phase diagram. From the minimum condition of the grand potential with respect to c and ζ in the homogeneous phase, including its boundary of stability, we have the relations
 | (10) |
 | (11) |
C. One-shell approximation for the periodic phases
At relatively high T* in the one-component SALR model, the density in the ordered phases can be approximated by a superposition of plane waves, but for low temperatures, the shape of ζ(r) −![[small zeta, Greek, macron]](https://www.rsc.org/images/entities/i_char_e0c7.gif) strongly deviates from the sinusoidal function.31 Similar behavior can be expected in the inhomogeneous mixture. The purpose of this work, however, is to determine the (μ−, μ+, T*) and (
strongly deviates from the sinusoidal function.31 Similar behavior can be expected in the inhomogeneous mixture. The purpose of this work, however, is to determine the (μ−, μ+, T*) and (![[c with combining macron]](https://www.rsc.org/images/entities/i_char_0063_0304.gif) ,
, ![[small zeta, Greek, macron]](https://www.rsc.org/images/entities/i_char_e0c7.gif) , T*) phase diagrams on a qualitative level, and in this first study of the global phase diagram, we restrict ourselves to the one-shell approximation (5).
, T*) phase diagrams on a qualitative level, and in this first study of the global phase diagram, we restrict ourselves to the one-shell approximation (5).
In order to get the qualitative phase diagram, we truncate the Taylor expansion of βΔω in terms of Φ and Ψ at the fourth-order terms, by which the stability of the functional (6) with (7) for  is restored. The truncation of the Taylor expansion is valid for small Φ and Ψ, and is consistent with the one-shell approximation. The explicit expressions in the φ4 theory for the higher-order terms in Δβω (see (7)) can be obtained easily, and are not given here.
In the stable or metastable phase, the derivative of βω(![[c with combining macron]](https://www.rsc.org/images/entities/i_char_0063_0304.gif) ,
, ![[small zeta, Greek, macron]](https://www.rsc.org/images/entities/i_char_e0c7.gif) , Φ, Ψ) with fixed T*, μ+, μ− vanishes. We need to solve 4 equations, ∂βω/∂
, Φ, Ψ) with fixed T*, μ+, μ− vanishes. We need to solve 4 equations, ∂βω/∂![[c with combining macron]](https://www.rsc.org/images/entities/i_char_0063_0304.gif) = ∂βω/∂
= ∂βω/∂![[small zeta, Greek, macron]](https://www.rsc.org/images/entities/i_char_e0c7.gif) = ∂βω/∂Φ = ∂βω/∂Ψ = 0 with fixed T*, μ+, and μ− to determine
= ∂βω/∂Φ = ∂βω/∂Ψ = 0 with fixed T*, μ+, and μ− to determine ![[c with combining macron]](https://www.rsc.org/images/entities/i_char_0063_0304.gif) ,
, ![[small zeta, Greek, macron]](https://www.rsc.org/images/entities/i_char_e0c7.gif) , Φ, and Ψ in the stable or metastable phase for the given thermodynamic state. Two phases coexist for the state-point T*, μ+, and μ−, when βω in these phases takes the same value. At the minimum, in our approximation, the grand potential per unit area takes the form
, Φ, and Ψ in the stable or metastable phase for the given thermodynamic state. Two phases coexist for the state-point T*, μ+, and μ−, when βω in these phases takes the same value. At the minimum, in our approximation, the grand potential per unit area takes the form
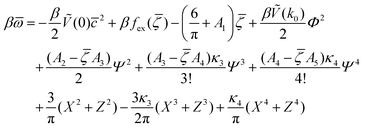 | (12) |
 are the geometric factors characterizing different structures, An are defined in (8), we introduced the notation
 | (13) |
![[c with combining macron]](https://www.rsc.org/images/entities/i_char_0063_0304.gif) ,
, ![[small zeta, Greek, macron]](https://www.rsc.org/images/entities/i_char_e0c7.gif) , Φ, and Ψ satisfy the equations ∂βω/∂
, Φ, and Ψ satisfy the equations ∂βω/∂![[c with combining macron]](https://www.rsc.org/images/entities/i_char_0063_0304.gif) = ∂βω/∂
= ∂βω/∂![[small zeta, Greek, macron]](https://www.rsc.org/images/entities/i_char_e0c7.gif) = ∂βω/∂Φ = ∂βω/∂Ψ = 0 for the considered state-point T*, μ+, μ−. The explicit forms of the above equations in our approximate φ4 theory are given in Appendix.
= ∂βω/∂Φ = ∂βω/∂Ψ = 0 for the considered state-point T*, μ+, μ−. The explicit forms of the above equations in our approximate φ4 theory are given in Appendix.
Our general framework with c ≤ ζ includes the symmetrical case with ![[c with combining macron]](https://www.rsc.org/images/entities/i_char_0063_0304.gif) = 0 already studied in ref. 46, as well as the one component case with ζ2 = 0, i.e. ζ = c, studied in ref. 48. Determination of
= 0 already studied in ref. 46, as well as the one component case with ζ2 = 0, i.e. ζ = c, studied in ref. 48. Determination of ![[c with combining macron]](https://www.rsc.org/images/entities/i_char_0063_0304.gif) ,
, ![[small zeta, Greek, macron]](https://www.rsc.org/images/entities/i_char_e0c7.gif) , Φ, and Ψ in the one-shell approximation for given T*, μ+, μ− and κn is in principle an easy algebraic problem. However, as can be seen from (6) and (7), when
, Φ, and Ψ in the one-shell approximation for given T*, μ+, μ− and κn is in principle an easy algebraic problem. However, as can be seen from (6) and (7), when ![[c with combining macron]](https://www.rsc.org/images/entities/i_char_0063_0304.gif) →
→ ![[small zeta, Greek, macron]](https://www.rsc.org/images/entities/i_char_e0c7.gif) , singularities in Δβω appear. In the one-component system, we have Φ = Ψ in addition to
, singularities in Δβω appear. In the one-component system, we have Φ = Ψ in addition to ![[c with combining macron]](https://www.rsc.org/images/entities/i_char_0063_0304.gif) =
= ![[small zeta, Greek, macron]](https://www.rsc.org/images/entities/i_char_e0c7.gif) , and the singularities present in individual terms cancel out, giving the grand potential of the form
, and the singularities present in individual terms cancel out, giving the grand potential of the form
 | (14) |
![[small mu, Greek, macron]](https://www.rsc.org/images/entities/i_char_e0cd.gif) 1 = μ+ + μ− and
1 = μ+ + μ− and | (15) |
![[small zeta, Greek, macron]](https://www.rsc.org/images/entities/i_char_e0c7.gif) with fixed T* and β
with fixed T* and β![[small mu, Greek, macron]](https://www.rsc.org/images/entities/i_char_e0cd.gif) 1 are given in Appendix.
1 are given in Appendix.
Note that when a small amount of the second component is added, (i.e. ![[c with combining macron]](https://www.rsc.org/images/entities/i_char_0063_0304.gif) →
→ ![[small zeta, Greek, macron]](https://www.rsc.org/images/entities/i_char_e0c7.gif) ), the coefficients of the individual terms in βω are very large (see (7)). We introduced X and Z (see (13)) and transformed the original Taylor expansions to the form where the dependence on 1/(
), the coefficients of the individual terms in βω are very large (see (7)). We introduced X and Z (see (13)) and transformed the original Taylor expansions to the form where the dependence on 1/(![[small zeta, Greek, macron]](https://www.rsc.org/images/entities/i_char_e0c7.gif) −
− ![[c with combining macron]](https://www.rsc.org/images/entities/i_char_0063_0304.gif) )n is through Zn = [(Ψ − Φ)/(
)n is through Zn = [(Ψ − Φ)/(![[small zeta, Greek, macron]](https://www.rsc.org/images/entities/i_char_e0c7.gif) −
− ![[c with combining macron]](https://www.rsc.org/images/entities/i_char_0063_0304.gif) )]n. Since we expect Φ → Ψ for
)]n. Since we expect Φ → Ψ for ![[c with combining macron]](https://www.rsc.org/images/entities/i_char_0063_0304.gif) →
→ ![[small zeta, Greek, macron]](https://www.rsc.org/images/entities/i_char_e0c7.gif) , our expression (12) and formulas in Appendix are suitable for numerical calculations.
, our expression (12) and formulas in Appendix are suitable for numerical calculations.
III. Interactions
We choose for the interaction u(r) between particles of the same species the hard-core repulsion plus the double Yukawa potential, | (16) |
As discussed in Introduction, the double-Yukawa form is inspired by oppositely charged particles with different adsorption preferences for the components of the near-critical binary solvent. The parameters of the effective potential in such physical systems can be finely tuned by changing temperature, salinity of the solvent, as well as charge and adsorption properties of the particles. We choose the parameters leading to relatively large thickness of the self-assembled aggregates. The correlation functions in the disordered phase were calculated for the same parameters in ref. 36 in the 3D system.
As discussed in Sections IIA and B (see (2), (6) and (7)), the phase diagram in our one-shell approximation depends only on 3 parameters characterizing the interaction potential in Fourier representation, k0, Ṽ(k0) and Ṽ(0) (recall that  ). π/k0 characterizes the size of self-assembled aggregates, and |Ṽ(k0)| sets the temperature scale. The last parameter,
  , determines whether in the absence of periodic patterns, the homogeneous mixed phase (for Ṽ(0) > 0) or separated homogeneous components (for Ṽ(0) < 0) are energetically favored. For the interaction (16), the relevant parameters take the values: k0 ≃ 0.6088, Ṽ(k0) ≃ −10.092, Ṽ(0) ≃ −0.363. With the chosen interactions, the size of the clusters is π/k0 ≈ 5, and separation of the homogeneous components is energetically favored over the homogeneous mixture. The function u(r) in the real space and the function Ṽ(k) in Fourier representation are shown in Fig. 4.
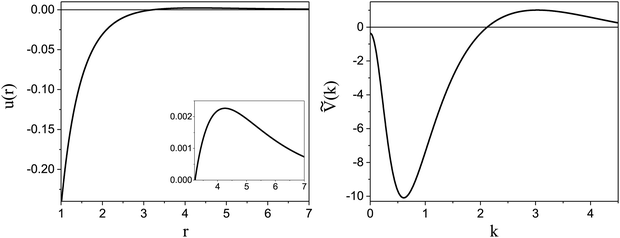 | ||
Fig. 4 Left: The interaction potential u(r) in the real space in units of the attraction strength (see (16)). Note the deep minimum at short distances and low but broad maximum for large distances. The repulsive part of the potential, u(r) > 0, is shown in the inset. Right: The Fourier transform Ṽ(k) of  (see eqn (2)). The length unit is the particle diameter a, and k is in 1/a units. In simulations, the particles are confined to a 3D slit with the thickness 1.5a, therefore the Fourier transform is calculated for a 3D system. (see eqn (2)). The length unit is the particle diameter a, and k is in 1/a units. In simulations, the particles are confined to a 3D slit with the thickness 1.5a, therefore the Fourier transform is calculated for a 3D system. | ||
IV. Results
In this section, the results are presented in reduced units. The length unit is the particle diameter a, the dimensionless temperature is T* = kBT/|Ṽ(k0)|, and the chemical potentials are , where
  and μi denotes the chemical potential of the i-th species (see eqn (4) and below). Recall that Ṽ(k0) is the energy gain due to the excitation of the concentration wave with the optimal wavelength and unitary amplitude.
A. Theoretical results
We first present the phase diagram in the one-component system. Next, we show the estimated (![[c with combining macron]](https://www.rsc.org/images/entities/i_char_0063_0304.gif) ,T*) diagram for the fixed large value of
,T*) diagram for the fixed large value of ![[small zeta, Greek, macron]](https://www.rsc.org/images/entities/i_char_e0c7.gif) and relatively large T* based only on the minimization of Δβω with respect to Φ and Ψ. Finally, we present the
and relatively large T* based only on the minimization of Δβω with respect to Φ and Ψ. Finally, we present the  diagrams for a few selected temperatures, obtained from the minimization of βω for fixed
  and T*. The corresponding (
![[c with combining macron]](https://www.rsc.org/images/entities/i_char_0063_0304.gif) ,
, ![[small zeta, Greek, macron]](https://www.rsc.org/images/entities/i_char_e0c7.gif) ) diagrams are shown too. We choose T* above and below the boundary of stability of the homogeneous phase in the one-component system. Our results are verified by MC simulations, and representative configurations are shown for selected state points.
) diagrams are shown too. We choose T* above and below the boundary of stability of the homogeneous phase in the one-component system. Our results are verified by MC simulations, and representative configurations are shown for selected state points.
The sequence of ordered phases in the one-component system was previously determined using our mesocopic theory by considering only the excess grand potential associated with periodic oscillations of the volume fraction, Δβω1 (see (15)). Here, we take into account different densities in the coexisting phases. The obtained phase diagram is shown in Fig. 5. Note that the two-phase regions are quite narrow.
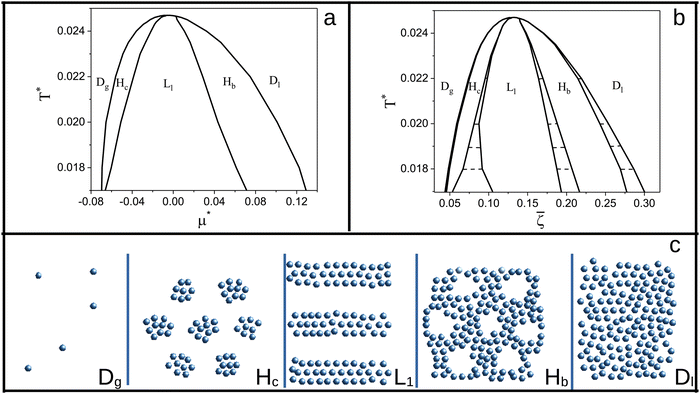 | ||
Fig. 5 The phase diagram in the one-component SALR system obtained by minimization of the grand potential (eqn (14)). In panels (a) and (b), the diagram in the (μ*,T*) and (![[small zeta, Greek, macron]](https://www.rsc.org/images/entities/i_char_e0c7.gif) ,T*) variables is shown, respectively. Dg, Hc, L1, Hb and Dl denote the disordered gas, hexagonal pattern of clusters, stripes separated by empty layers, hexagonal pattern of bubbles and disordered liquid, respectively, shown schematically in panel (c). ,T*) variables is shown, respectively. Dg, Hc, L1, Hb and Dl denote the disordered gas, hexagonal pattern of clusters, stripes separated by empty layers, hexagonal pattern of bubbles and disordered liquid, respectively, shown schematically in panel (c). ![[small zeta, Greek, macron]](https://www.rsc.org/images/entities/i_char_e0c7.gif) is the average volume fraction, T* = kBT/|Ṽ(k0)| and is the average volume fraction, T* = kBT/|Ṽ(k0)| and  , where μ denotes the chemical potential. , where μ denotes the chemical potential. | ||
Following the one-component case, we construct the (![[c with combining macron]](https://www.rsc.org/images/entities/i_char_0063_0304.gif) ,T*) phase diagram for fixed
,T*) phase diagram for fixed ![[small zeta, Greek, macron]](https://www.rsc.org/images/entities/i_char_e0c7.gif) based on the minima of Δβω, which can be done easily. In Fig. 6, the diagram obtained by the minimization of Δβω with respect to Φ, Ψ for fixed
based on the minima of Δβω, which can be done easily. In Fig. 6, the diagram obtained by the minimization of Δβω with respect to Φ, Ψ for fixed ![[c with combining macron]](https://www.rsc.org/images/entities/i_char_0063_0304.gif) ,
, ![[small zeta, Greek, macron]](https://www.rsc.org/images/entities/i_char_e0c7.gif) is presented for
is presented for ![[small zeta, Greek, macron]](https://www.rsc.org/images/entities/i_char_e0c7.gif) = 0.4 and T* > 0.08. Importantly, this procedure can give the correct sequence of the ordered phases when the concentrations and densities in the coexisting periodic phases are similar. We verify the diagram shown in Fig. 6 by the minimization of the grand potential with fixed
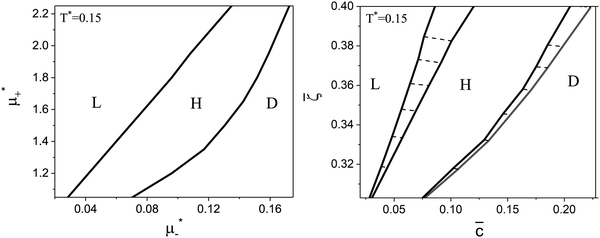
= 0.4 and T* > 0.08. Importantly, this procedure can give the correct sequence of the ordered phases when the concentrations and densities in the coexisting periodic phases are similar. We verify the diagram shown in Fig. 6 by the minimization of the grand potential with fixed  . The diagrams obtained in this way are shown in Fig. 7–9, for fixed T* higher than the temperature at which the one-component system forms ordered patterns.
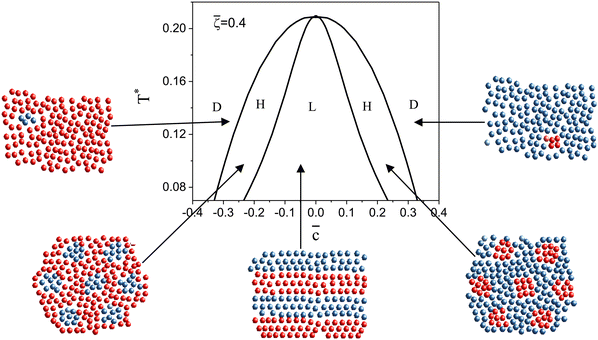 | ||
Fig. 6 The (![[c with combining macron]](https://www.rsc.org/images/entities/i_char_0063_0304.gif) ,T*) phase diagram obtained by minimization of Δβω (see eqn (6)) with respect to Φ, Ψ in our φ4 approximation for ,T*) phase diagram obtained by minimization of Δβω (see eqn (6)) with respect to Φ, Ψ in our φ4 approximation for ![[small zeta, Greek, macron]](https://www.rsc.org/images/entities/i_char_e0c7.gif) = 0.4. D, H, and L denote the disordered phase rich in the majority component, the hexagonal phase of clusters of the minority component in the liquid of the majority component, and the lamellar phase of alternating stripes of the two components, respectively. In the schematically shown structures of the phases, the blue and red spheres represent the first and the second component particles, respectively. T* = kBT/|Ṽ(k0)| and = 0.4. D, H, and L denote the disordered phase rich in the majority component, the hexagonal phase of clusters of the minority component in the liquid of the majority component, and the lamellar phase of alternating stripes of the two components, respectively. In the schematically shown structures of the phases, the blue and red spheres represent the first and the second component particles, respectively. T* = kBT/|Ṽ(k0)| and ![[c with combining macron]](https://www.rsc.org/images/entities/i_char_0063_0304.gif) = = ![[small zeta, Greek, macron]](https://www.rsc.org/images/entities/i_char_e0c7.gif) 1 − 1 − ![[small zeta, Greek, macron]](https://www.rsc.org/images/entities/i_char_e0c7.gif) 2 with 2 with ![[small zeta, Greek, macron]](https://www.rsc.org/images/entities/i_char_e0c7.gif) i denoting the average volume fraction of the i-th component. i denoting the average volume fraction of the i-th component. | ||
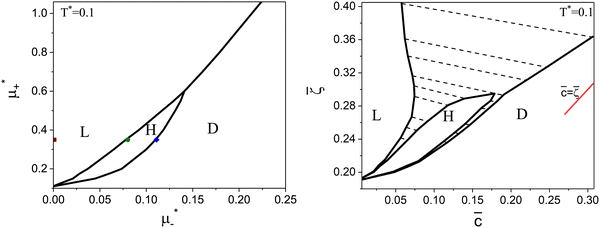 | ||
Fig. 8 The phase diagram in the chemical potentials  (left) and in concentration-volume fraction, ( (left) and in concentration-volume fraction, (![[c with combining macron]](https://www.rsc.org/images/entities/i_char_0063_0304.gif) , , ![[small zeta, Greek, macron]](https://www.rsc.org/images/entities/i_char_e0c7.gif) ) (right) for T* = 0.1. L, H, and D denote the lamellar (stripe), hexagonal and disordered phases, respectively. The symbols indicate the state points for which the volume fractions ζ1 and ζ2 are shown in Fig. 10 and 11. The dashed lines in the right panel are the tie lines. In the D phase coexisting with the H and L phases, ) (right) for T* = 0.1. L, H, and D denote the lamellar (stripe), hexagonal and disordered phases, respectively. The symbols indicate the state points for which the volume fractions ζ1 and ζ2 are shown in Fig. 10 and 11. The dashed lines in the right panel are the tie lines. In the D phase coexisting with the H and L phases, ![[small zeta, Greek, macron]](https://www.rsc.org/images/entities/i_char_e0c7.gif) > > ![[c with combining macron]](https://www.rsc.org/images/entities/i_char_0063_0304.gif) , i.e. D contains some amount of the second component. The short red line is a piece of the line , i.e. D contains some amount of the second component. The short red line is a piece of the line ![[c with combining macron]](https://www.rsc.org/images/entities/i_char_0063_0304.gif) = = ![[small zeta, Greek, macron]](https://www.rsc.org/images/entities/i_char_e0c7.gif) ; the region with ; the region with ![[small zeta, Greek, macron]](https://www.rsc.org/images/entities/i_char_e0c7.gif) < < ![[c with combining macron]](https://www.rsc.org/images/entities/i_char_0063_0304.gif) is unphysical. T* = kBT/|Ṽ(k0)| and is unphysical. T* = kBT/|Ṽ(k0)| and  , where , where  , and μi is the chemical potential of the i-th species. , and μi is the chemical potential of the i-th species. ![[c with combining macron]](https://www.rsc.org/images/entities/i_char_0063_0304.gif) = = ![[small zeta, Greek, macron]](https://www.rsc.org/images/entities/i_char_e0c7.gif) 1 − 1 − ![[small zeta, Greek, macron]](https://www.rsc.org/images/entities/i_char_e0c7.gif) 2 and 2 and ![[small zeta, Greek, macron]](https://www.rsc.org/images/entities/i_char_e0c7.gif) = = ![[small zeta, Greek, macron]](https://www.rsc.org/images/entities/i_char_e0c7.gif) 1 + 1 + ![[small zeta, Greek, macron]](https://www.rsc.org/images/entities/i_char_e0c7.gif) 2 with 2 with ![[small zeta, Greek, macron]](https://www.rsc.org/images/entities/i_char_e0c7.gif) i denoting the average volume fraction of the i-th component. i denoting the average volume fraction of the i-th component. | ||
As can be seen in Fig. 7 and 8, the diagram obtained by the minimization of Δβω as shown in Fig. 6 is qualitatively correct for T* = 0.15 but incorrect for T* = 0.1. For T* = 0.1, the hexagonal phase is absent at ![[small zeta, Greek, macron]](https://www.rsc.org/images/entities/i_char_e0c7.gif) = 0.4, and instead of it, a two-phase coexistence region between the L and D phases is present. Thus, by disregarding the different values of
= 0.4, and instead of it, a two-phase coexistence region between the L and D phases is present. Thus, by disregarding the different values of ![[c with combining macron]](https://www.rsc.org/images/entities/i_char_0063_0304.gif) and
and ![[small zeta, Greek, macron]](https://www.rsc.org/images/entities/i_char_e0c7.gif) in the coexisting phases, one can obtain a wrong sequence of the stable phases. Minimization of βω with fixed chemical potentials, where
in the coexisting phases, one can obtain a wrong sequence of the stable phases. Minimization of βω with fixed chemical potentials, where ![[c with combining macron]](https://www.rsc.org/images/entities/i_char_0063_0304.gif) and
and ![[small zeta, Greek, macron]](https://www.rsc.org/images/entities/i_char_e0c7.gif) in the coexisting phases can be different, is necessary to get a qualitatively correct phase diagram in the self-assembling mixture.
in the coexisting phases can be different, is necessary to get a qualitatively correct phase diagram in the self-assembling mixture.
For the illustration of the structure of the L and H phases, we choose T* = 0.1,  , and several values of
  , namely
  inside the stability region of the L phase,
  at the L–H phase coexistence and
  at the H–D phase coexistence. The volume fractions of the two components in the L and H phases at the above state points are shown in Fig. 10 and 11. In both phases, |Φ| ≫ |Ψ|, i.e. mainly the concentration oscillates. Moreover, in the L-phase,
 ![[c with combining macron]](https://www.rsc.org/images/entities/i_char_0063_0304.gif) is quite small, meaning rather small asymmetry between the stripes rich in the first and the second component even at the coexistence with the H or D phases, where the largest asymmetry between the stripes takes place (see Fig. 10).
is quite small, meaning rather small asymmetry between the stripes rich in the first and the second component even at the coexistence with the H or D phases, where the largest asymmetry between the stripes takes place (see Fig. 10).
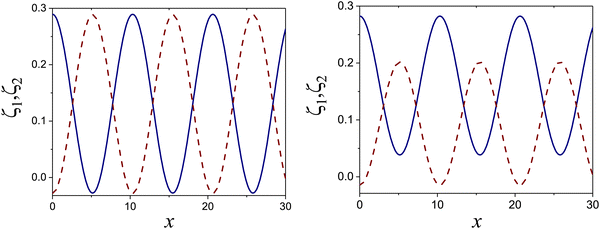 | ||
Fig. 10 The volume fractions ζ1(x,0) (blue solid line) and ζ2(x,0) (red dashed line) in the L phase in the direction x of the density oscillations for T* = 0.1 and  . In the left and right figure, . In the left and right figure,  (in the middle of the stability region of the L phase, red square in Fig. 8) and (in the middle of the stability region of the L phase, red square in Fig. 8) and  (at the coexistence with the H phase, green circle in Fig. 8), respectively. Negative volume fraction is the artifact of the one-shell approximation. T* = kBT/|Ṽ(k0)| and (at the coexistence with the H phase, green circle in Fig. 8), respectively. Negative volume fraction is the artifact of the one-shell approximation. T* = kBT/|Ṽ(k0)| and  , where , where  , and μi is the chemical potential of the i-th species. Distance is in units of the particle diameter a. , and μi is the chemical potential of the i-th species. Distance is in units of the particle diameter a. | ||
 | ||
Fig. 11 The volume fractions ζ1(x,y) and ζ2(x,y) of the first and the second component, respectively, in the H phase. Left and central panels: At the coexistence with the L phase with  (green circle in Fig. 8). Right panel: At the coexistence with the D phase with (green circle in Fig. 8). Right panel: At the coexistence with the D phase with  (blue diamond in Fig. 8). Negative volume fraction is the artifact of the one-shell approximation. In the right panel, ζ1(x,0) (blue solid line) and ζ2(x,0) (red dashed line) are shown in the same plot for comparison. T* = kBT/|Ṽ(k0)| and (blue diamond in Fig. 8). Negative volume fraction is the artifact of the one-shell approximation. In the right panel, ζ1(x,0) (blue solid line) and ζ2(x,0) (red dashed line) are shown in the same plot for comparison. T* = kBT/|Ṽ(k0)| and  , where , where  , and μi is the chemical potential of the i-th species. Distance is in units of the particle diameter a. , and μi is the chemical potential of the i-th species. Distance is in units of the particle diameter a. | ||
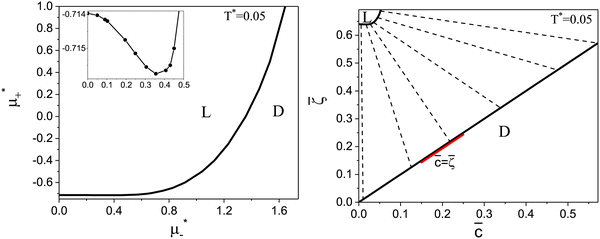
The diagram for temperature low enough for ordering of the one-component system is shown in Fig. 12 for T* = 0.02. We can see that the L phase with oscillating concentration coexists with very dilute gas (almost vacuum) for  , and with the liquid of the first component for
  . In the corner with
  , the L phase with oscillating concentration coexists with the one-component ordered phases stable between the parallel lines
  , where
  is the chemical potential of the first component at the coexistence between the one-component ordered phases. We verified that for the considered temperatures, the chess-board pattern was only metastable.
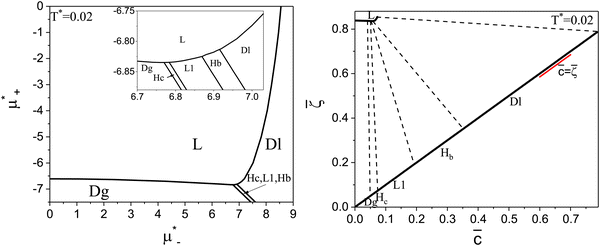 | ||
Fig. 12 The phase diagram in the chemical potentials plane  (left) and in the ( (left) and in the (![[c with combining macron]](https://www.rsc.org/images/entities/i_char_0063_0304.gif) , , ![[small zeta, Greek, macron]](https://www.rsc.org/images/entities/i_char_e0c7.gif) ) plane (right) for T* = 0.02. The L phase with parallel stripes of alternating components coexists with the disordered gas (Dg) and the disordered liquid rich in the first component (Dl), and with periodic phases in the one-component system between the two triple points L–Dg–Hc and L–Hb–Dl, where Hc and Hb denote the hexagonal pattern of clusters and bubbles, respectively, and L1 denotes the one-component lamellar phase with stripes separated by empty layers. The structure of the odered phases is shown schematically in Fig. 5 and 6. In the inset in the left panel, the bottom-right corner where the ordered phases in the one-component system are stable is expanded. The dashed lines in the right panel are the tie lines. The ) plane (right) for T* = 0.02. The L phase with parallel stripes of alternating components coexists with the disordered gas (Dg) and the disordered liquid rich in the first component (Dl), and with periodic phases in the one-component system between the two triple points L–Dg–Hc and L–Hb–Dl, where Hc and Hb denote the hexagonal pattern of clusters and bubbles, respectively, and L1 denotes the one-component lamellar phase with stripes separated by empty layers. The structure of the odered phases is shown schematically in Fig. 5 and 6. In the inset in the left panel, the bottom-right corner where the ordered phases in the one-component system are stable is expanded. The dashed lines in the right panel are the tie lines. The  part of the diagram is not shown because part of the diagram is not shown because  is the symmetry axis. T* = kBT/|Ṽ(k0)| and is the symmetry axis. T* = kBT/|Ṽ(k0)| and  , where , where  , and μi is the chemical potential of the i-th species. , and μi is the chemical potential of the i-th species. ![[c with combining macron]](https://www.rsc.org/images/entities/i_char_0063_0304.gif) = = ![[small zeta, Greek, macron]](https://www.rsc.org/images/entities/i_char_e0c7.gif) 1 − 1 − ![[small zeta, Greek, macron]](https://www.rsc.org/images/entities/i_char_e0c7.gif) 2 and 2 and ![[small zeta, Greek, macron]](https://www.rsc.org/images/entities/i_char_e0c7.gif) = = ![[small zeta, Greek, macron]](https://www.rsc.org/images/entities/i_char_e0c7.gif) 1 + 1 + ![[small zeta, Greek, macron]](https://www.rsc.org/images/entities/i_char_e0c7.gif) 2 with 2 with ![[small zeta, Greek, macron]](https://www.rsc.org/images/entities/i_char_e0c7.gif) i denoting the average volume fraction of the i-th component. i denoting the average volume fraction of the i-th component. | ||
B. Simulation results
To verify and illustrate our predictions, we performed MC simulations in the μVT ensemble. The purpose of this study was to check if the patterns obtained in our MF theory indeed occur in some part of the phase space, and if these are the only patterns that can be present in the considered mixture. For this purpose, we chose hard spheres with the same diameter a that sets the length unit, u11(r) = u22(r) = u(r) = − u12(r) and the double Yukawa potential (16) for u. The cut-off radius was 15a. This distance was chosen because the potential energy of pairs separated by 15a is less than 10−6.In the simulations, the particles can be displaced, destroyed or created. The acceptance probability for both these moves is determined using the Metropolis criterion min[1,exp(−βΔU)], where ΔU is the change of the total energy due to a trial move. In a creation trial move, a new molecule is created at a random location in the simulation box with volume Vs, with the acceptance probability min[1,zi![[thin space (1/6-em)]](https://www.rsc.org/images/entities/char_2009.gif) exp(−βΔU)Vs/(Ni + 1)], where zi is the configurational activity of species i defined by zi = exp(−βμi)/Îi3 and Îi is the de Broglie thermal wavelength; in a deletion trial move, a molecule is randomly chosen and deleted from the system with the acceptance probability min[1,Ni
exp(−βΔU)Vs/(Ni + 1)], where zi is the configurational activity of species i defined by zi = exp(−βμi)/Îi3 and Îi is the de Broglie thermal wavelength; in a deletion trial move, a molecule is randomly chosen and deleted from the system with the acceptance probability min[1,Ni![[thin space (1/6-em)]](https://www.rsc.org/images/entities/char_2009.gif) exp(−βΔU)/(ziVs)].52,53
exp(−βΔU)/(ziVs)].52,53
In all the simulated cases, the initial configurations were with around one hundred of particles, randomly distributed in the slit. Higher densities as initial configurations were tested as well, and the final mean density was the same.
In order to simulate quasi-2D systems such as inclusions in biological membranes, we considered a simulation box with the edges Lx, Ly, and Lz, with Lx = Ly = 80a, (in some cases Lx = Ly = 45a to speed up the simulations), and applying periodical boundary conditions with the minimum image convention in these two directions. We verified that the mean density and the observed patterns were independent of the system size when the side of the simulations box was larger than 30a. In the z direction, however, the particles were confined by impenetrable hard walls and Lz = 1.5a. Each system has run 106 MC steps for equilibration and 5 × 10⁵ MC steps for production. A larger number for production was not necessary because the average results were stable with this number of simulated steps.
We performed simulations along several paths in the phase space  . In the first family of paths,
  , and in the second one
  was fixed, and
  varied. The obtained patterns generally agree with our theoretical predictions. In particular, for the same region of the chemical potentials, the clusters of the minority component appear at higher T* than the symmetrical stripes.
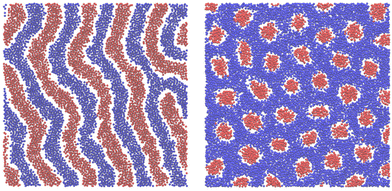
Representative snapshots are shown in Fig. 13–15. In Fig. 13, we show the disordered phase with mixed components, whereas in Fig. 14, the disordered liquid rich in the first component is shown. In the symmetrical mixture, we show how the structure evolves for increasing density, i.e. for decreasing T*. Note the increasing inhomogeneity of the concentration for increasing density. For ![[c with combining macron]](https://www.rsc.org/images/entities/i_char_0063_0304.gif) > 0, the self-assembly of the minority component into clusters occupying the voids present in the majority component is clearly seen in Fig. 14. The number and size of the clusters decrease for increasing
> 0, the self-assembly of the minority component into clusters occupying the voids present in the majority component is clearly seen in Fig. 14. The number and size of the clusters decrease for increasing  , and the formation of the pure one-component liquid can be observed.
In Fig. 15, we show the alternating stripes of the two components for ![[c with combining macron]](https://www.rsc.org/images/entities/i_char_0063_0304.gif) = 0, and clusters of the minority component for
= 0, and clusters of the minority component for ![[c with combining macron]](https://www.rsc.org/images/entities/i_char_0063_0304.gif) > 0. The stripes can be interpreted as the L phase with some defects that are typically present in the experimental lamellar phase as well. The clusters shown in Fig. 15 show hexagonal order with some displacements of the clusters. This snapshot (as well as several other ones) suggests that the ordered H phase can occur in the true equilibrium state in this region of the phase diagram at the level of ensemble-averaged densities.
> 0. The stripes can be interpreted as the L phase with some defects that are typically present in the experimental lamellar phase as well. The clusters shown in Fig. 15 show hexagonal order with some displacements of the clusters. This snapshot (as well as several other ones) suggests that the ordered H phase can occur in the true equilibrium state in this region of the phase diagram at the level of ensemble-averaged densities.
In Fig. 16, we present an example of the potential energy and the volume fraction as functions of the chemical potential. Because of the finite system used in simulations, instead of discontinuities, we obtained a continuous function with a very large slope at the transition.
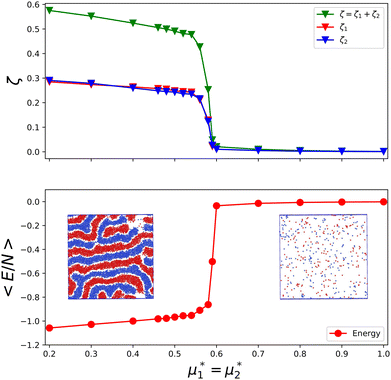 | ||
Fig. 16 The volume fractions and the potential energy for T* = kBT/|Ṽ(k0)| = 0.15 as functions of the chemical potentials of the two components.  , where μi is the chemical potential of the i-th species. The energy is in the original dimensionless units of the interactions (16). The blue and red circles in the insets represent the first and the second component particles, respectively. , where μi is the chemical potential of the i-th species. The energy is in the original dimensionless units of the interactions (16). The blue and red circles in the insets represent the first and the second component particles, respectively. | ||
In principle, one could also expect a chess-board pattern (see Fig. 1, central panel) or chains of particles separated by empty spaces, observed in ref. 50 for the lattice version of the model but with Ṽ(0) > 0. We did not see such ordered patterns in MC simulations of our model (16), except from the local chess-board pattern shown in Fig. 13. In the theory, we found that the chess-board structure was metastable.
V. Discussion and summary
We have found that when two types of SALR particles are mixed together and the cross-interaction is repulsive at short separations and attractive at large separations, then ordered patterns can be formed up to much higher temperature than in the one-component system. This conclusion concerns the class of models with the interactions u12(r) = −uii(r), such that takes in Fourier representation a global minimum for k0 > 0. According to our MF stability analysis, the disordered phase in the one-component system looses stability with respect to periodic ordering at the largest temperature
  for
for ![[small zeta, Greek, macron]](https://www.rsc.org/images/entities/i_char_e0c7.gif) ≈ 0.15. For the same density of each component in the mixture (for
≈ 0.15. For the same density of each component in the mixture (for ![[c with combining macron]](https://www.rsc.org/images/entities/i_char_0063_0304.gif) = 0), the temperature at the instability of the disordered phase is
= 0), the temperature at the instability of the disordered phase is  , i.e. it is much higher. Our λ-surface depends on the interaction potential V only through the temperature scale set by |Ṽ(k0)|. Based on this universality, we conclude that it is much easier to obtain self-assembled ordered structures in a mixture with the two mermaids and a peacock interactions than in the absence of the second component.
Ordered patterns are observed at higher temperature in the case of the binary mixture because when regions occupied by the first component are separated by regions occupied by the second one (the L and H phases), the energy gain is larger than when the first component-occupied regions are separated by voids (the L1 and Hc, Hb phases). This is because in the mixture, in addition to the lack of repulsion between like particles, the attraction between different ones is present. As a result of lower energy of the ordered pattern, the ordered phase can be stable at higher temperature.
Interestingly, the presence of the second component may significantly influence the self-assembly and pattern formation for different forms of interactions as well. For example, temperature at the onset of clustering increases when hard spheres attracting the SALR particles are added.54 Thus, it will be interesting to investigate the effect of different forms of cross-interactions on spontaneous pattern formation.
In our theory, apart from the temperature and chemical potentials’ scale set by |Ṽ(k0)|, the phase diagram depends on the interactions only through the single parameter Ṽ(0) (see eqn (12)). This means that our results, when expressed in terms of dimensionless variables, should concern all versions of the two mermaids and a peacock model, in which the integral of V(r) takes the same value. We considered interactions such that Ṽ(0) = −0.363 < 0 (Ṽ(0)/|Ṽ(k0)| ≈ −0.036), leading to rather large clusters.
For equal chemical potentials, alternating stripes of the first and the second component of the width π/k0 were obtained in the previous theoretical and simulation study of a 3D system.46 The natural question was how this structure evolves upon changing the chemical potentials or temperature. Our results show that in 2D systems, the phase with alternating stripes of the two components is stable only up to a quite small density difference of the two components, |![[c with combining macron]](https://www.rsc.org/images/entities/i_char_0063_0304.gif) | ≪
| ≪ ![[small zeta, Greek, macron]](https://www.rsc.org/images/entities/i_char_e0c7.gif) , for all temperatures studied (Fig. 7–9 and 12). When the density in the stripes of the second component decreases to about 0.7 times the density in the stripes of the majority component, a first-order transition to a phase poor in the second component takes place (see Fig. 10 for ζi at the L–H phase coexistence).
, for all temperatures studied (Fig. 7–9 and 12). When the density in the stripes of the second component decreases to about 0.7 times the density in the stripes of the majority component, a first-order transition to a phase poor in the second component takes place (see Fig. 10 for ζi at the L–H phase coexistence).
At low T*, the L phase is very dense and occupies a small region in the (![[c with combining macron]](https://www.rsc.org/images/entities/i_char_0063_0304.gif) ,
, ![[small zeta, Greek, macron]](https://www.rsc.org/images/entities/i_char_e0c7.gif) ) diagram (see Fig. 9 and 12). The density in the L phase at the coexistence with the dilute gas decreases from very large values to rather small values upon increasing T* (see Fig. 7 and 8).
) diagram (see Fig. 9 and 12). The density in the L phase at the coexistence with the dilute gas decreases from very large values to rather small values upon increasing T* (see Fig. 7 and 8).
One could expect that upon increasing the chemical potentials’ difference, a transition from the L phase to the H phase with clusters of the minority component in the liquid of the majority component would occur because of relatively similar ![[c with combining macron]](https://www.rsc.org/images/entities/i_char_0063_0304.gif) and
and ![[small zeta, Greek, macron]](https://www.rsc.org/images/entities/i_char_e0c7.gif) in the two phases. We found out, however that at low T*, the L phase coexists with the phase rich in the first component, either disordered for large
in the two phases. We found out, however that at low T*, the L phase coexists with the phase rich in the first component, either disordered for large  , or ordered for
  . This is because the H phase appears only at relatively large T*, and its stability region on the
  plane increases with increasing T*. We should stress that the jump of
 ![[c with combining macron]](https://www.rsc.org/images/entities/i_char_0063_0304.gif) or
or ![[small zeta, Greek, macron]](https://www.rsc.org/images/entities/i_char_e0c7.gif) in the coexisting L and Dg, Hc, L1, Hb, and Dl phases is very large, and that the density in the Hc, L1, and Hb phases is significantly smaller than the density of the L phase coexisting with them (see Fig. 12).
in the coexisting L and Dg, Hc, L1, Hb, and Dl phases is very large, and that the density in the Hc, L1, and Hb phases is significantly smaller than the density of the L phase coexisting with them (see Fig. 12).
We should note that in the model, the interaction potentials are fixed, i.e. they depend only on the distance between the particles, whereas in particular systems, the effective interactions may depend on the thermodynamic state. For example, the range of the Casimir potential induced by concentration fluctuations in the near-critical solvent depends sensitively on temperature. Our results, however, shed light on the possible ordered phases, and on the coexistence between them.
Let us finally comment on the validity of the phenomenological Landau–Brazovskii (LB) functional55 that correctly predicts the sequence of the ordered phases for the SALR particles and for the block copolymers, where the order parameter was identified with the excess density and concentration, respectively. The same sequence of phases for increasing ![[c with combining macron]](https://www.rsc.org/images/entities/i_char_0063_0304.gif) would be predicted by the LB functional for the two mermaids and a peacock model in the case of fixed density. We have found, however that for our model, the LB functional can be valid only for relatively high temperatures (see Fig. 6–9). For lower temperatures, however, predictions of the LB functional are qualitatively incorrect. It is necessary to take into account different densities and concentrations, and equal chemical potentials and pressure are required in the coexisting phases, as done in this work.
would be predicted by the LB functional for the two mermaids and a peacock model in the case of fixed density. We have found, however that for our model, the LB functional can be valid only for relatively high temperatures (see Fig. 6–9). For lower temperatures, however, predictions of the LB functional are qualitatively incorrect. It is necessary to take into account different densities and concentrations, and equal chemical potentials and pressure are required in the coexisting phases, as done in this work.
We conclude that although the ordered patterns are relatively simple, the phase diagram in the considered mixture is quite complex. We expect that the topology of the phase diagram will remain the same for various shapes of the interactions having the property Ṽ(0) < 0. The question how the phase diagram changes when the long-range repulsion between like particles is strong, such that Ṽ(0) > 0 and small aggregates are formed, will be a subject of our future studies.
Author contributions
Conceptualization: AC; formal analysis: OP, AM, AC; investigation: OP, AM, AC; methodology: OP, AM, AC; software: AM; visualization: OP, AM, AC; writing – original draft: AC, OP, AM, writing – review and editing: AC.Conflicts of interest
There are no conflicts to declare.Appendix
A. The g functions and the geometric factors
In the lamellar, hexagonal and chess-board phases, the g(x,y) functions take the following forms, respectively: | (17) |
 | (18) |
| gchess(r) = cos(kbx) + cos(kby) | (19) |
 | (20) |
 | (21) |
 | (22) |
B. Expressions for ![[c with combining macron]](https://www.rsc.org/images/entities/h3_i_char_0063_0304.gif) ,
, ![[small zeta, Greek, macron]](https://www.rsc.org/images/entities/h3_i_char_e0c7.gif) , Φ, and Ψ in our MF approximation
, Φ, and Ψ in our MF approximation
In the binary mixture, the minimization of the grand potential per unit area, as expressed through eqn (6), with respect to ![[small zeta, Greek, macron]](https://www.rsc.org/images/entities/i_char_e0c7.gif) ,
, ![[c with combining macron]](https://www.rsc.org/images/entities/i_char_0063_0304.gif) , Φ and Ψ gives in the φ4 MF approximation
, Φ and Ψ gives in the φ4 MF approximation | (23) |
 | (24) |
 | (25) |
 | (26) |
![[c with combining macron]](https://www.rsc.org/images/entities/i_char_0063_0304.gif) ,
, ![[small zeta, Greek, macron]](https://www.rsc.org/images/entities/i_char_e0c7.gif) , Φ, and Ψ for given T*, μ+, and μ−.
, Φ, and Ψ for given T*, μ+, and μ−.
C. One-component SALR system
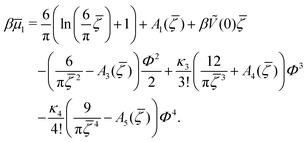
In the one-component SALR system, the amplitude of the volume-fraction oscillations and the average volume fraction satisfy at the minimum of βω the following equations in our MF φ4 theory | (27) |
 | (28) |
Acknowledgements
We gratefully acknowledge the financial support from the European Union Horizon 2020 research and innovation programme under the Marie Skłodowska-Curie grant agreement no. 734276 (CONIN). OP received the financial support from the Ministry of Education and Science of Ukraine for the implementation of the joint Ukrainian-Polish project (grant agreement no. M/43-2023).References
- M. Seul and D. Andelman, Science, 1995, 267, 476–483 CrossRef CAS PubMed.
- A. Stradner, H. Sedgwick, F. Cardinaux, W. Poon, S. Egelhaaf and P. Schurtenberger, Nature, 2004, 432, 492–495 CrossRef CAS PubMed.
- A. I. Campbell, V. J. Anderson, J. S. van Duijneveldt and P. Bartlett, Phys. Rev. Lett., 2005, 94, 208301 CrossRef.
- P. Li, S. Banjade, H.-C. Cheng, S. Kim, B. Chen, L. Guo, M. Llaguno, J. V. Hollingsworth, D. S. King, S. F. Banani, P. S. Russo, Q.-X. Jiang, B. T. Nixon and M. K. Rosen, Nature, 2012, 483, 336–340 CrossRef CAS PubMed.
- X. Su, J. A. Ditlev, E. Hui, W. Xing, S. Banjade, J. Okrut, D. S. King, J. Taunton, M. K. Rosen and R. D. Vale, Science, 2016, 352, 595–599 CrossRef CAS.
- M. E. Fisher and P. G. de Gennes, C. R. Acad. Sci., Ser. B, 1978, 287, 207–209 CAS.
- M. Krech, J. Phys.: Condens. Matter, 1999, 11, R391 CrossRef CAS.
- C. Hertlein, L. Helden, A. Gambassi, S. Dietrich and C. Bechinger, Nature, 2008, 451, 172–175 CrossRef CAS PubMed.
- S. L. Veatch, O. Soubias, S. L. Keller and K. Gawrisch, Proc. Natl. Acad. Sci. U. S. A., 2007, 104, 17650–17655 CrossRef CAS.
- B. B. Machta, S. L. Veatch and J. P. Sethna, Phys. Rev. Lett., 2012, 109, 138101 CrossRef.
- B. Eisberg, Biophys. Chem., 2003, 100, 507–517 CrossRef.
- A. M. Smith, A. A. Lee and S. Perkin, J. Phys. Chem. Lett., 2016, 7, 2157–2163 CrossRef CAS.
- A. Lee, C. S. Perez-Martinez, A. M. Smith and S. Perkin, Phys. Rev. Lett., 2017, 119, 026002 CrossRef.
- A. Ciach and O. Patsahan, J. Mol. Liq., 2023, 377, 121453 CrossRef CAS.
- S. A. Safran and P. A. Pincus, Soft Matter, 2023, 19, 7907–7911 RSC.
- F. Pousaneh, A. Ciach and A. Maciołek, Soft Matter, 2012, 8, 7567–7581 RSC.
- C. P. Royall, Soft Matter, 2018, 14, 4020–4028 RSC.
- A. Imperio and L. Reatto, J. Phys.: Condens. Matter, 2004, 18, S2319 Search PubMed.
- A. Ciach, Phys. Rev. E: Stat., Nonlinear, Soft Matter Phys., 2008, 78, 061505 CrossRef CAS PubMed.
- A. J. Archer, Phys. Rev. E: Stat., Nonlinear, Soft Matter Phys., 2008, 78, 031402 CrossRef.
- Y. Zhuang, K. Zhang and P. Charbonneau, Phys. Rev. Lett., 2016, 116, 098301 CrossRef PubMed.
- P. Bartlett and A. I. Campbell, Phys. Rev. Lett., 2005, 95, 128302 CrossRef.
- A. Imperio and L. Reatto, J. Chem. Phys., 2006, 124, 164712 CrossRef CAS.
- A. J. Archer and N. B. Wilding, Phys. Rev. E: Stat., Nonlinear, Soft Matter Phys., 2007, 76, 031501 CrossRef.
- J. Pȩkalski, A. Ciach and N. G. Almarza, J. Chem. Phys., 2014, 140, 114701 CrossRef.
- N. G. Almarza, J. Pȩkalski and A. Ciach, J. Chem. Phys., 2014, 140, 164708 CrossRef CAS.
- M. B. Sweatman, R. Fartaria and L. Lue, J. Chem. Phys., 2014, 140, 124508 CrossRef.
- B. A. Lindquist, R. B. Jadrich and T. M. Truskett, Soft Matter, 2016, 12, 2663–2667 RSC.
- Y. Zhuang and P. Charbonneau, J. Phys. Chem. B, 2016, 120, 6178–6188 CrossRef CAS PubMed.
- M. Edelmann and R. Roth, Phys. Rev. E, 2016, 93, 062146 CrossRef.
- D. Pini and A. Parola, Soft Matter, 2017, 13, 9259–9272 RSC.
- K. Marolt, M. Zimmermann and R. Roth, Phys. Rev. E, 2019, 100, 052602 CrossRef CAS.
- Y. Liu and Y. Xi, Curr. Opin. Colloid Interface Sci., 2019, 39, 123–136 CrossRef CAS PubMed.
- J. Ruiz-Franco and E. Zaccarelli, Annu. Rev. Condens. Matter Phys., 2021, 12, 51–70 CrossRef CAS.
- A. Ciach, J. Pȩkalski and W. T. Góźdź, Soft Matter, 2013, 9, 6301–6308 RSC.
- A. Ciach, O. Patsahan and A. Meyra, Condens. Matter Phys., 2020, 23, 23601 CrossRef.
- K. von Konigslow, E. D. Cardenas-Mendez, R. B. Thompson and K. Ø. Rasmussen, J. Phys.: Condens. Matter, 2013, 25, 325101 CrossRef CAS PubMed.
- C. A. Ferreiro-Rangel and M. B. Sweatman, Mol. Phys., 2018, 116, 3231–3244 CrossRef CAS.
- J. Tan, N. D. Afify, C. A. Ferreiro-Rangel, X. Fan and M. B. Sweatman, J. Chem. Phys., 2021, 154, 074504 CrossRef CAS.
- A. Scacchi, M. Sammalkorpi and T. Ala-Nissila, J. Chem. Phys., 2021, 155, 014904 CrossRef CAS.
- G. Munao, D. Costa, G. Malescio, J. Bomont and S. Prestipino, Soft Matter, 2022, 18, 6453–6464 RSC.
- D. Costa, G. Munao, J. Bomont, G. Malescio, A. Palatella and S. Prestipino, Phys. Rev. E, 2023, 108, 034602 CrossRef CAS.
- P. B. Shelke, V. D. Nguyen, A. V. Limaye and P. Schall, Adv. Mater., 2013, 25, 1499–1503 CrossRef CAS PubMed.
- V. D. Nguyen, S. Faber, Z. Hu, G. H. Wegdam and P. Schall, Nat. Commun., 2013, 4, 1584 CrossRef PubMed.
- E. Marino, O. A. Vasilyev, B. B. Kluft, M. J. B. Stroink, S. Kondrat and P. Schall, Nanoscale Horiz., 2021, 6, 751–758 RSC.
- O. Patsahan, M. Litniewski and A. Ciach, Soft Matter, 2021, 17, 2883–2899 RSC.
- A. Ciach, Mol. Phys., 2011, 109, 1101–1119 CrossRef CAS.
- A. Ciach and W. T. Góźdź, Condens. Matter Phys., 2010, 13, 23603 CrossRef.
- M. Litniewski and A. Ciach, Molecules, 2021, 26, 4532 CrossRef CAS.
- A. Ciach, A. D. Virgiliis, A. Meyra and M. Litniewski, Molecules, 2023, 28, 1366 CrossRef CAS PubMed.
- N. F. Carnahan and K. E. Starling, J. Chem. Phys., 1969, 51, 635–636 CrossRef CAS.
- M. P. Allen and D. J. Tildesley, Computer Simulation of Liquids, Oxford University Press, 2017 Search PubMed.
- D. Frenkel and B. Smit, Understanding Molecular Simulation: From Algorithms to Applications, Elsevier, 3rd edn, 2023 Search PubMed.
- G. Munao, S. Prestipino, J.-M. Bomont and D. Costa, J. Phys. Chem. B, 2022, 126, 2027–2039 CrossRef CAS PubMed.
- S. A. Brazovskii, Sov. Phys. – JETP, 1975, 41, 85 Search PubMed.
| This journal is © The Royal Society of Chemistry 2024 |

