
 Open Access Article
 This Open Access Article is licensed under a Creative Commons Attribution-Non Commercial 3.0 Unported Licence
Tuning disorder in structurally colored bioinspired photonic glasses†
Ahmet F.
Demirörs
 *a,
Kalpana
Manne
a,
Sofia
Magkiriadou
a and
Frank
Scheffold
*ab
*a,
Kalpana
Manne
a,
Sofia
Magkiriadou
a and
Frank
Scheffold
*ab
aSoft Matter and Photonics, Department of Physics, University of Fribourg, Chemin du Musée 3, 1700, Fribourg, Switzerland. E-mail: ahmet.demiroers@unifr.ch; frank.scheffold@unifr.ch
bNCCR Bio-inspired Materials, University of Fribourg, 1700 Fribourg, Switzerland
First published on 19th January 2024
Abstract
Colloidal crystals, such as opals, display bright and iridescent colors when assembled from submicron particles. While the brightness and purity of iridescent colors are well suited for ornaments, signaling, and anticounterfeiting, their angle dependence limits the range of their applications. In contrast, colloidal glasses display angle-independent structural color that is tunable by the size and local arrangement of particles. However, the angle-independent color of colloidal photonic glasses usually yields pastel colors that are not vivid due to the disorder in the particle assembly. Here, we report an electrophoretic assembly platform for tuning the level of disorder in the particle system from a colloidal crystal to a colloidal glass. Altering the electric field in our electrophoretic platform allows for deliberate control of the assembly kinetics and thus the level of order in the particle assembly. With the help of microscopy, X-ray scattering, and optical characterization, we show that the photonic properties of the assembled films can be tuned with the applied electric field. Our analyses reveal that angle-independent color with optimum color brightness can be achieved in typical colloidal suspensions when the range of order is at ∼3.2 particle diameters, which is expected at a moderate electric field of ∼15 V mm−1.
Introduction
Structural coloration is a frequently observed strategy in nature, ranging from biological structures to geological formations.1–3 Iridescent opals,4,5 butterfly wings,6,7 and beetle scales8 are some of the geological and biological hallmarks of structural color. Inspired by nature, engineered microplatelets,9,10 colloid-based pigments,11,12 and fibers13 have been suggested as routes for obtaining photonic structures in synthetic systems. Unlike conventional pigments, structurally colored materials resist photobleaching and can be easily designed to avoid environmental and chemical hazards, which makes them an attractive sustainable alternative for various photonic applications.14–16 Structurally colored materials have been reported to address challenges in different fields including displays,17,18 sensing,19–21 camouflage,22 or anti-counterfeiting.23 Color in these materials emerges from the constructive interference of light reflected by periodic structural features with sizes comparable to the wavelengths of the visible spectrum. Diffraction gratings, photonic crystals, multilayered Bragg reflectors, and photonic glasses are examples of structures that lead to optical interference effects.24,25Photonic glasses, assembled from colloidal building blocks, offer a notably interesting strategy for the generation of structural color.26 Photonic glasses exhibit local order in the short-range but disorder in the long range. Contrary to iridescent ordered structures, the combination of short-range order and long-range disorder of a photonic glass allows for the emergence of isotropic color that is uniform in all view angles.26–32 The structure of the assemblies, and in particular parameters such as the size of and distance between the colloidal particles and their organization, defines the color.29,33 In this way isotropic blue, green, and red color tones have been created by tuning the size and packing density of the colloidal particles.34,35 Due to the advantage of their isotropic optical response, photonic glasses have been exploited in the forms of films, photonic balls, and 3D-printed objects.26,29,33–36 Research to expand the set of tools to manufacture photonic colloidal glasses37 is currently active. Recently, three-dimensional printing has been used as an effective way to manufacture such materials.38–44
Despite these appealing assets, photonic structures created by colloidal glasses are limited to mostly pastel colors and they lack vivid and bright colors. Although brightness can be increased by inducing long-range order to the assemblies, this in return decreases the angle independency and terminates the isotropic coloration.45 Vivid colors can also be achieved by using well engineered colloidal building blocks, such as core–shell particles or capsules,29,46,47 and methods for engineering the index contrast in photonic glasses have been discussed.48 However, these requirements complicate the upscaling of the method.49,50 While control of the order via surface charges51,52 and the transition from ordered to disordered colloidal photonic arrays has been studied before,53 a systematic study to identify what range of order can provide the maximum color brightness while sustaining the color isotropy has not yet been addressed. Here, we suggest a method to systematically tune the order of the colloidal assembly from a long-range ordered crystalline to a short-range ordered amorphous structure by using an electrophoretic assembly setup. The applied field during the electrophoretic assembly defines the kinetics of the assembly and therefore finely tunes the range of order in the assembled films. The range of order in the films was characterized via electron microscopy and small-angle X-ray scattering methods and compared with their corresponding optical performance via optical microscopy and reflectance spectroscopy techniques.
To evaluate the presence of colloidal assemblies with finely tuned disorder, we first investigate the level of disorder in the fabricated thin films under various electric field strengths. This is followed by the evaluation of the optical performance and angle dependence of the photonic assemblies with varying electric field strengths. Next, we analyze the microstructure and scattering behavior of these colloidal photonic glasses, which also helps us to estimate the range of order in the colloidal assembly.
Results and discussion
Electrophoresis is a well established54 method that has also been used for the assembly of colloidal particles since the pioneering work of Aksay and co-workers.55 The electrophoretic assembly of colloidal particles requires electrodes and a suspension of colloidal particles that exhibit surface electric charges. Upon application of a DC electric field, the colloidal particles with an electric charge will be attracted toward the oppositely charged electrode. For instance, typical colloids such as silica and polystyrene exhibit a negative surface charge, therefore, they would be attracted to the positive electrode. The size, charge, and density of the colloids, and the applied field strength control the deposition rate of the colloids. As previously shown by Takeoka and co-workers,56 the deposition kinetics of the colloids directly influence the order of the colloids assembled. In the case of low Reynolds number and moderate electric field strength E a constant drift velocity can be assumed. For a constant velocity, the drag on the moving particles due to the viscosity of the dispersant should be equal to the electrophoretic force. Thus, when the drift velocity of a dispersed particle v is considered, it is found that v should be proportional to the applied field, E. Based on this, the electrophoretic mobility μe will be defined as:57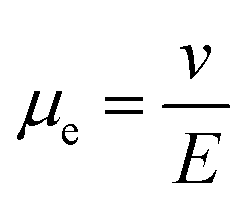 . This gives us good control over the assembly kinetics of the colloids. In other words, when the electrophoretic potential that drives the assembly is low and on the order of the thermal potential (∼kT), particles have time to equilibrate and form long-range ordered crystals. In contrast, when the electrophoretic potential exceeds the thermal potential (≫kT) then the kinetics of the assembly is fast, and particles tend to jam and form disordered assemblies that exhibit short-range order.
In the two extreme cases of ordered and disordered assemblies, various observables are expected to differ significantly, including their reflection spectra, small-angle X-ray scattering (SAXS) pattern, visual appearance, and microstructure, as evidenced by electron microscopy. Ordered assemblies are expected to exhibit a periodically repeating arrangement of particles as shown in the schematic Fig. 1A and the electron microscopy panel, Fig. 2A. Disordered assemblies, depicted in Fig. 1B, are expected to exhibit only short-range order. In the case of the reflection spectrum, the ordered samples exhibit a reflection spectrum where the peak maximum shifts with the view angle. However, for the disordered case, the reflection spectrum is expected to be relatively unchanged with the view angle. The SAXS pattern or in a broader sense the diffraction pattern (which can be studied via light scattering of small angle neutron scattering (SANS), depending on the accessible q-range)58 of the ordered sample is expected to exhibit Bragg peaks because of the long-range order, while the SAXS pattern of the disordered sample is expected to exhibit a concentric ring pattern because of the lack of long-range order.
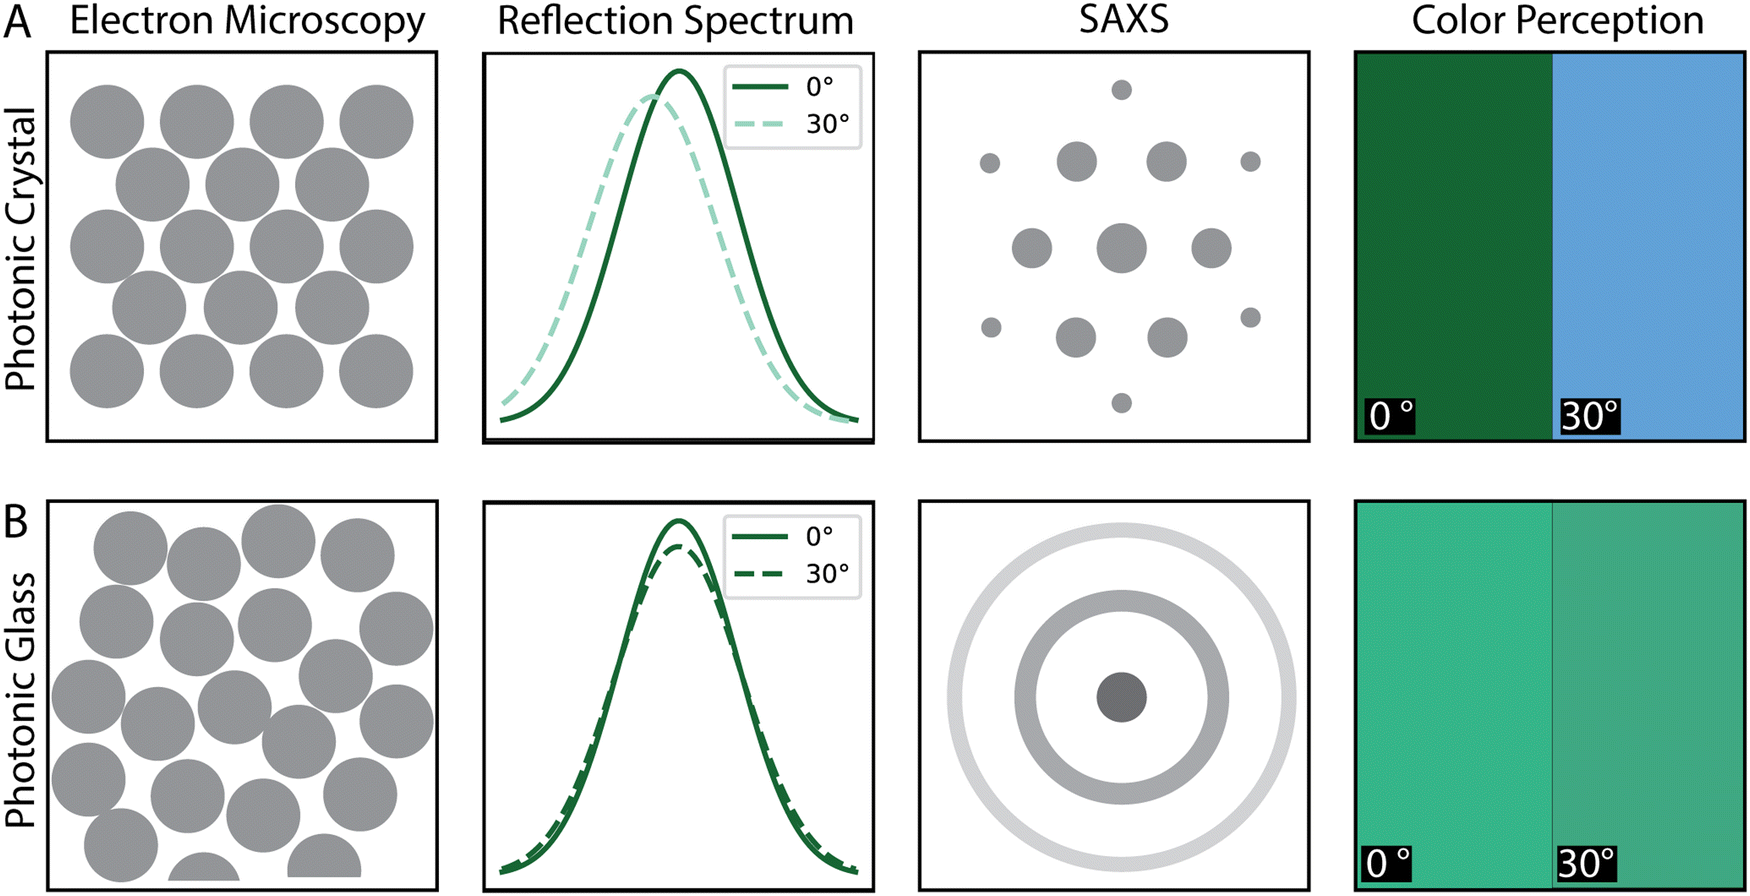 | ||
| Fig. 1 Schematics of the expected colloidal assemblies tuned by the electrophoretic assembly and their microstructure and behavior under various characterization conditions. Microstructure and scattering behavior of (A) ordered photonic crystals, (B) disordered photonic glasses. The expected schematics for electron microscopy, reflection spectroscopy, SAXS, and the perceived color are shown for the ordered and disordered assemblies. The predicted angle-dependence of the structural color is also highlighted by showing the behavior at two different scattering angles, namely 0° and 30°. | ||
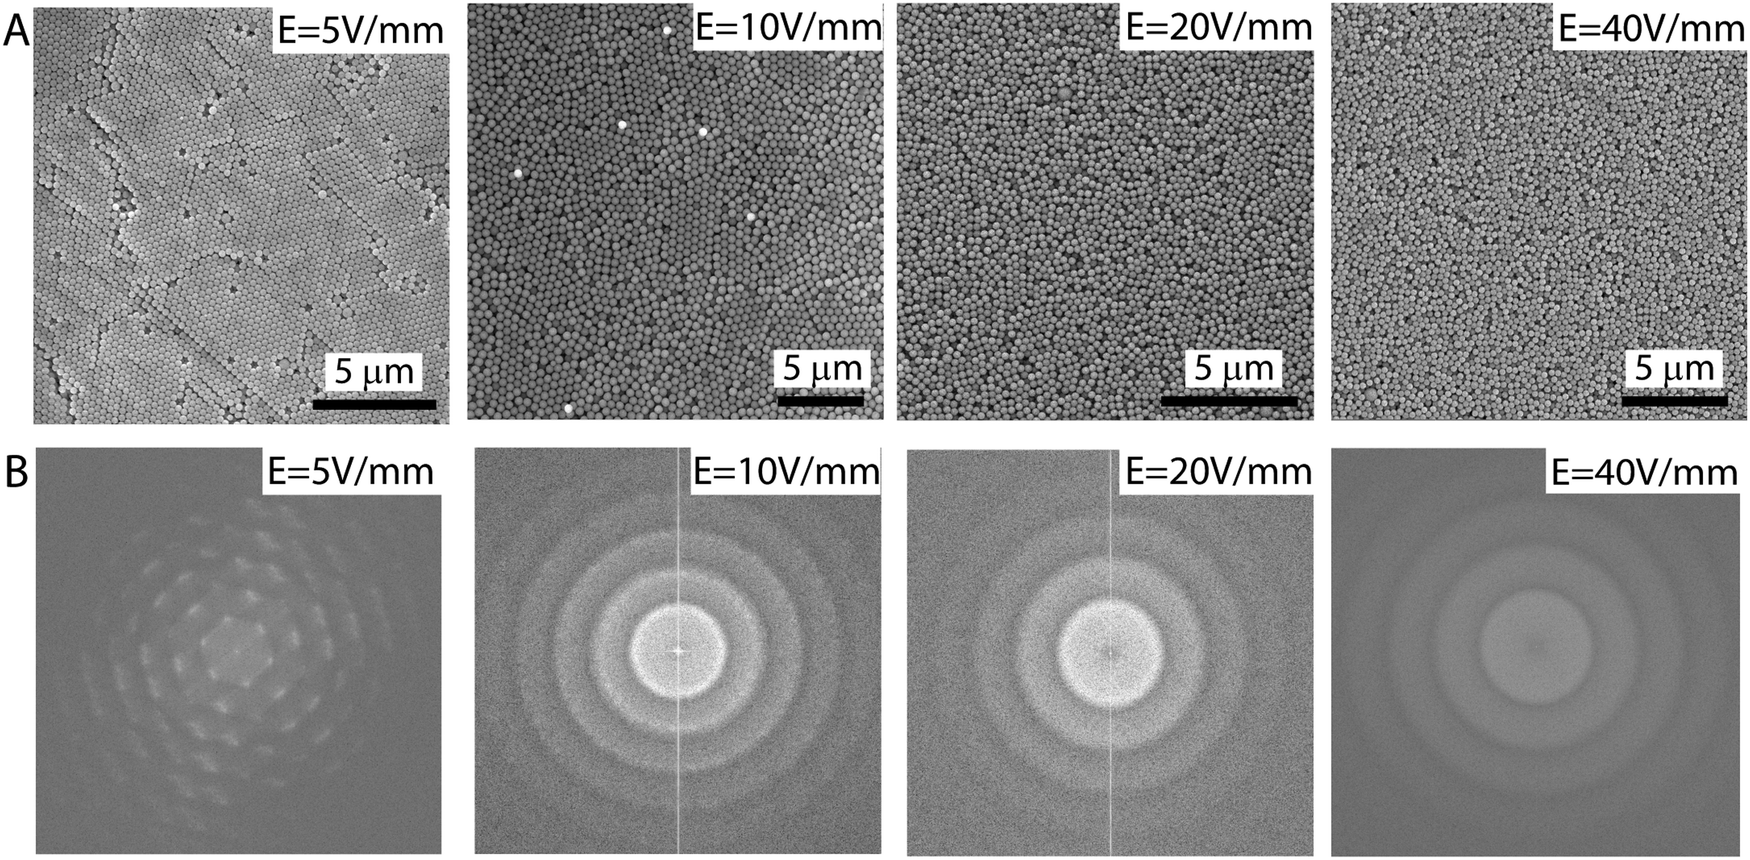 | ||
| Fig. 2 Characterization of the microstructural evolution of the colloidal assembly with the electric field change. (A) Scanning electron microscopy images of the samples electrodeposited at varying electric field strengths from 5 V mm−1 up to 40 V mm−1. (B) Fast Fourier transformation (FFT) of the SEM images from 5 V mm−1 up to 40 V mm−1 electric field strengths. Scale bars for (A) are 5 μm. | ||
The perceived color, which can be evidenced by photography of the sample, is expected to be brighter for the ordered samples, but the color changes with the view angle. For the disordered phase although the color is expected to be pastel and less bright, it remains unchanged with the view angle.
In the experiments, monodisperse polystyrene (PS) particles of sizes 180, 270, and 310 nm were used, which were suspended in a water-ethanol mixture at 1 wt%. An electric field strength of 5 to 40 V mm−1 was applied between two ITO slides sandwiched with their conductive sides facing each other (see Experimental section for details).
The order in the assembly of colloids depends highly on the strength of the applied electric field which allows for a clear route to tune the order of the system. The electron microscopy images of the samples assembled from 310 nm particles with varying electric field strengths reveal this dependence. For an electric field of 5 V mm−1 colloidal particles crystallize and exhibit long-range order, Fig. 2A. However, increasing the field to 10, 20, and 40 V mm−1 gradually decreases the order of the samples as evidenced by the electron microscopy images shown in Fig. 2A. The change in the order of the assembly is also observed in the fast fourier transformation (FFT) images given in Fig. 2B. These FFT images were generated by applying the transformations to the SEM images displayed in Fig. 2A. The hexagonal pattern observed for the FFT of the 5 V mm−1 sample is a sign of long-range order. This pattern evolves into a ring pattern for the higher-field samples. The spikes and the thin and sharp ring patterns observed for the 10 V mm−1 samples disappear and turn into broad and faded ring structures for the 20 and 40 V mm−1 samples, indicating an increase in disorder, see Fig. 2B.
The electric field strength directly affects the optical properties and visual appearance of the assembled samples. To evaluate the optical properties and appearance of the samples, we conducted reflection microscopy imaging and reflection spectroscopy of the samples assembled from 310 nm (Fig. 3A–E) and 270 nm (Fig. 3F and G) particles at distinct electric fields. The visual appearance was investigated with a reflection microscope (Fig. 3A). In addition, the reflection spectra of the samples which were fabricated at distinct electric fields were recorded with a spectrometer connected to the microscopy setup (Fig. 3B and C). Furthermore, the spectra taken from the spectrometer were fed into a modified open-source Python package (colour59) to simulate the colors arising from the spectra shown in Fig. 3B. The reflection microscopy images in Fig. 3A reveal that the color fades and its brightness decreases as the disorder in the samples increases with increasing electric field. The reflection spectra shown in Fig. 3C display a strong dependence on the degree of order of the sample evaluated. The peak height and its steepness exhibit a significant decrease as the disorder of the system increases with higher field strength. The FWHM values increase from 67 to 150 nm over the 5 V mm−1 to 40 V mm−1 electric field range, indicating the increase of disorder, in Fig. 3C inset. For the FWHM analyses we fit the peak between 550–720 nm to a Gaussian and take the width at the half of the peak height. The decrease in the reflected intensity is observed as color fading in the reflection images, which nicely agrees with the colors simulated from the spectra, Fig. 3A and B. The CIE 1931 chromatography diagram in Fig. 3D displaying the observed colors indicates that increasing disorder causes the color saturation to decrease; this results in the domination of white, thus fading of the structural color. The hue (H), saturation (S) and value (V, i.e. brightness), HSV representation of the observed colors was found and plotted for the increasing electric field strength in Fig. 3E. Because the size of the particles is unchanged, and therefore the change in their average distance is relatively small, the hue (H) of the color should remain relatively unchanged. The HSV plot against the applied electric field shows a clear decrease in saturation and value while the hue remains relatively unchanged.
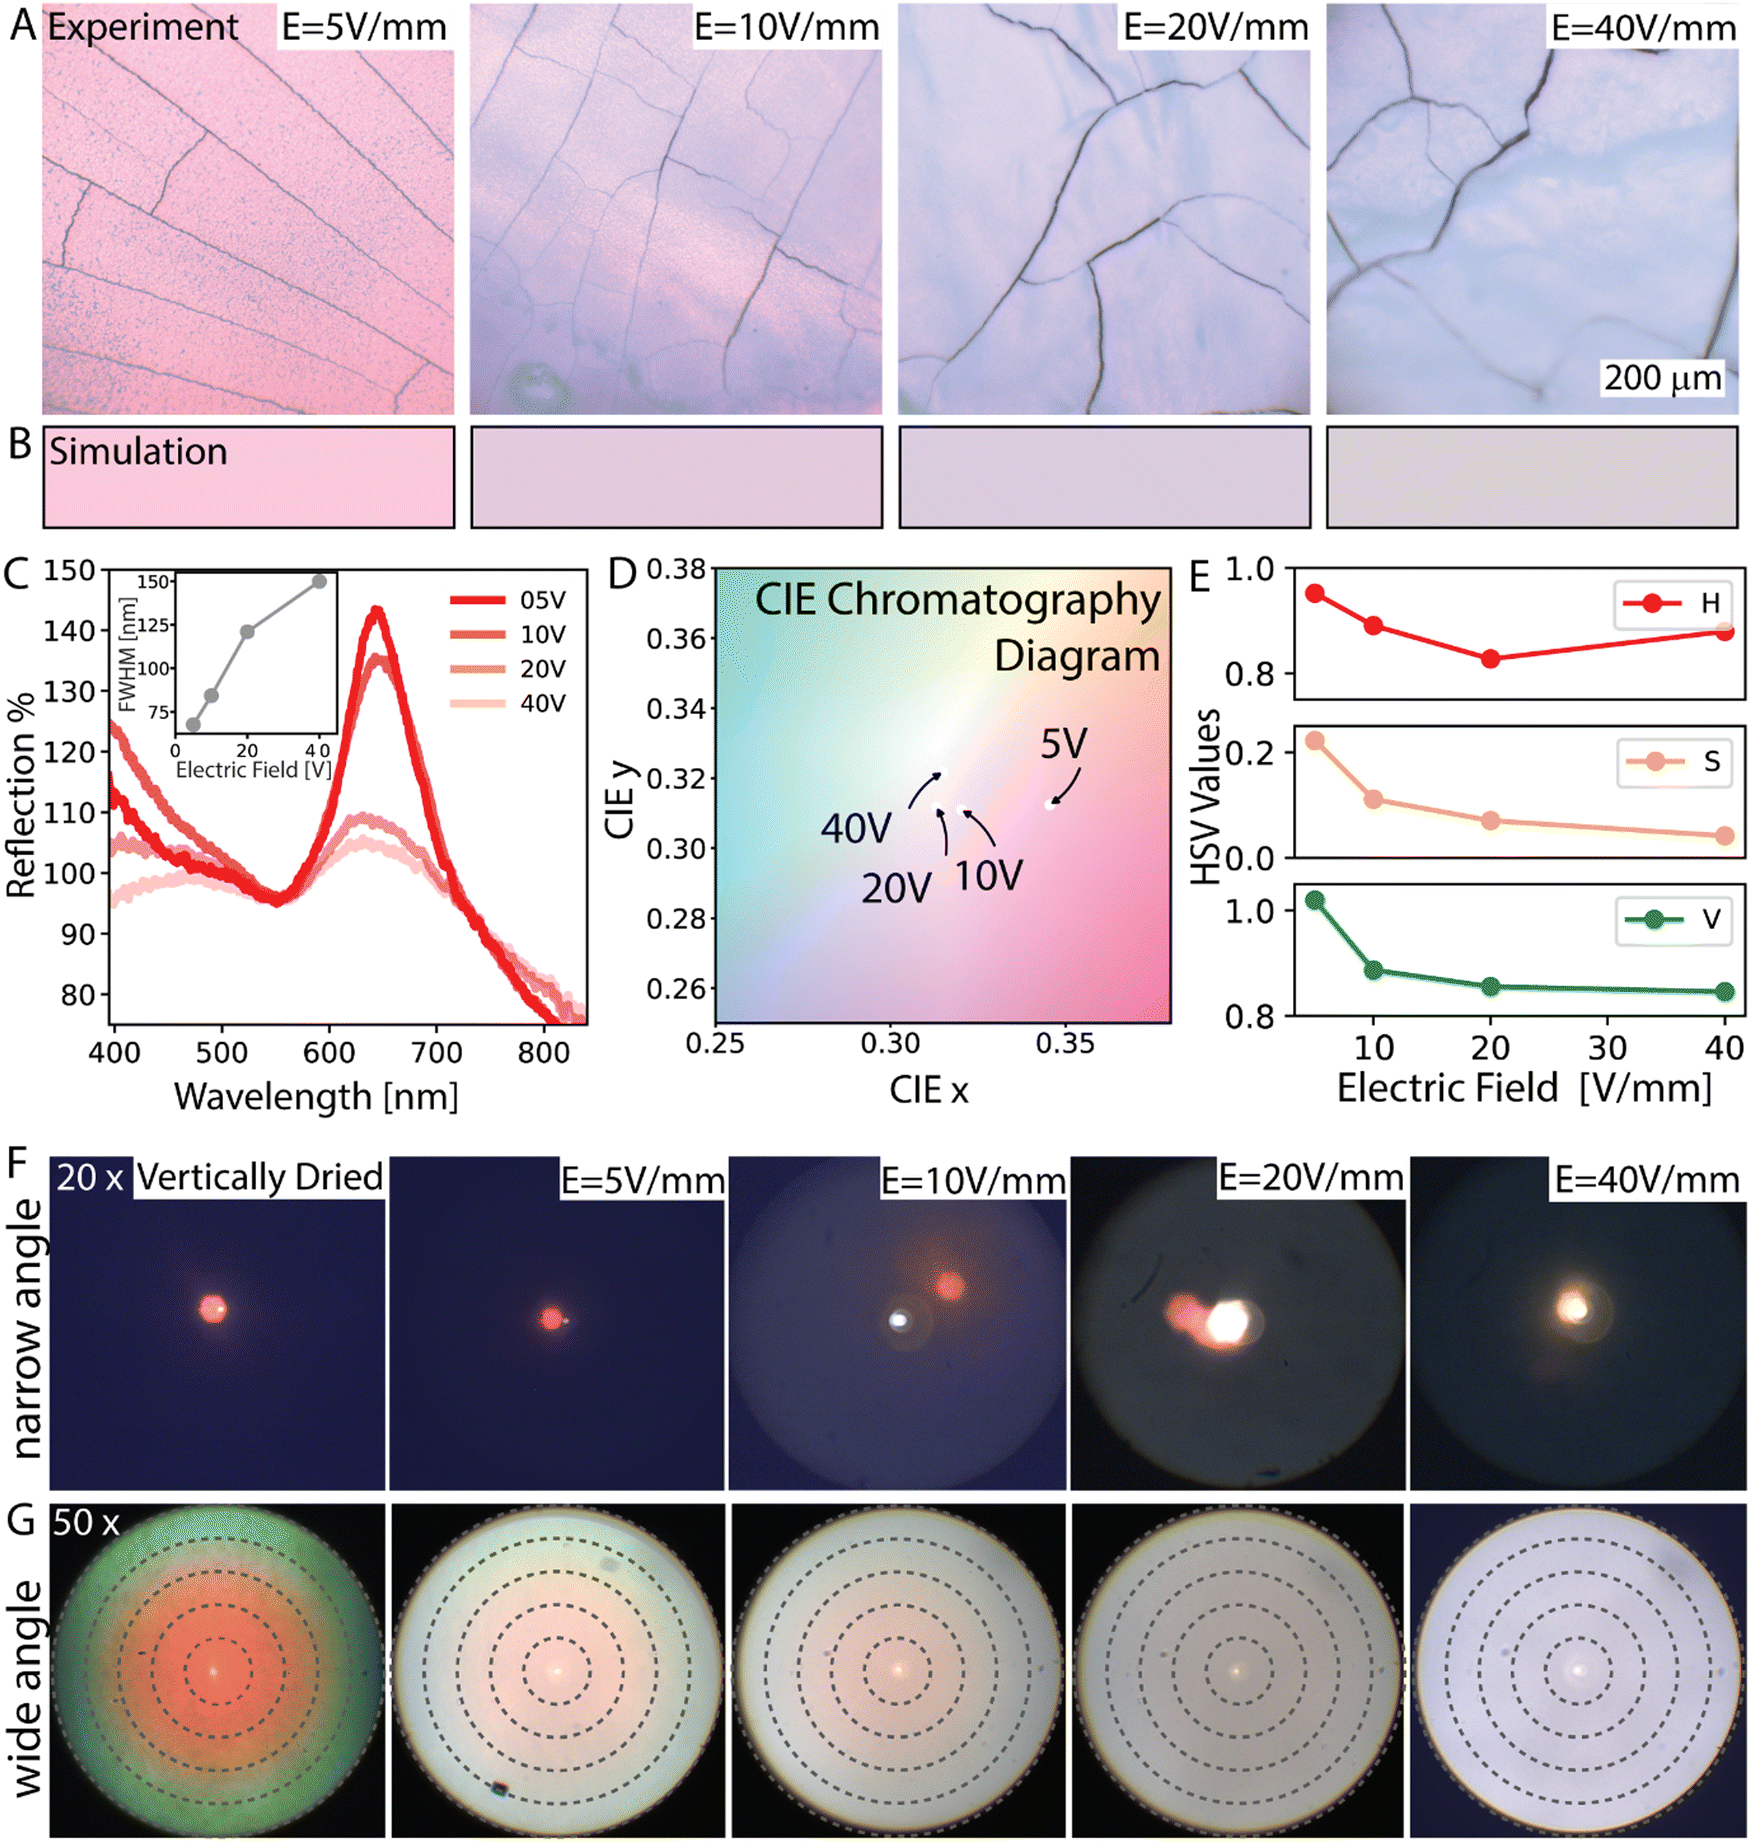 | ||
| Fig. 3 Optical reflectance characterization of electrodeposited colloidal assemblies. (A) Photographs of samples assembled from monodisperse polystyrene particles with an average size of 310 nm at various electric field strengths varying from 5 V mm−1 to 40 V mm−1 as depicted in the panels. (B) The colors simulated from the optical reflectance spectra of these samples are shown below the experimental photographs. (C) Optical reflectance spectra of the assemblies with varying levels of disorder, obtained by varying the electric field strength. Reflectance values are expressed as a percentage relative to a white Lambertian diffuser employed as a reference. It's important to note that our configuration does not incorporate an integrating sphere. Inset: plot of the FWHM of the peaks against the applied electric field. (D) CIE 1931 Chromatography diagram showing the evolution of colors with varying electric fields. (E) HSV values of the colors observed in experiments. (F) Optical narrow-angle k-space micrographs of the samples with varying disorder captured in reflection mode under a 20×/0.8 NA objective with wide-field illumination. (G) Wide angle k-space micrographs of the same samples captured under a 50×/0.8 NA objective. The rings represent scattering angles of 10°, 20°, 30°, 40°, 53.15° from inner to outer, respectively. | ||
Because the goal of this work is to find out the assembly parameters for the highest color brightness and saturation while having view-angle independence, the influence of disorder on the angle dependence of the samples was evaluated by capturing their scattering profiles in k-space, so-called scatterograms.60 Here samples were illuminated in both narrow and wide-angle and scattered light was collected either with a 20× objective or with a 50× objective, respectively. Narrow-angle and wide-angle represent the range of angles of the incident beam. The narrow-angle k-space scatterograms are shown in Fig. 3F and highlight the level of order in the samples. In these scatterograms narrow-angle illumination results in a single colored spot scattered into a narrow spatial angle, indicating that the structure reflects directionally, which is expected in a system with ordered colloids exhibiting specular reflection. A vertically dried sample given here represents a control for an ideal crystalline assembly case, see ESI,† Fig. S1. When the assembly becomes disordered, local illumination results in diffuse reflection. The narrow-angle scatterograms given in Fig. 3F exhibit single spots at narrow spatial angles for assemblies up to 10 V mm−1 electric fields and agree qualitatively with the SEM results. Note that at 40 V mm−1 the spot significantly diffuses such that the intensity of spots becomes almost undetectable with our setup.
Under wide-angle illumination, the iridescence emerges for ordered samples where the reflected colors appear to blue shift with increasing observation/incidence angles. The wide-angle scatterograms with the 50× objective, given in Fig. 3G, display scattering in angles ranging from 0° to 53.15°. In these scatterograms, the blue-shifting colors fade as the disorder dominates the structure with an increasing electric field. Therefore, over a 20 V mm−1 field, a uniform faded color across the angles prevails. The uniformity of the color indicates its angle-independent nature and the presence of an amorphous structure. By considering the evolution of the angle dependence and the color brightness of the samples concerning the applied electric field as observed in Fig. 3F and G, an angle-independent color with optimum color brightness can be expected at a moderate electric field of ∼15 V mm−1. This prediction assumes that the gradual change in the state of the order allows for a brighter reflection at 15 V mm−1 than at 20 V mm−1 and that the level of order at 15 V mm−1 already provides an angle-independent color performance.
To better understand the origin of the level of order change, we investigated the X-ray scattering behavior of the samples electrodeposited from 180 nm particles. Here a smaller particle size was taken to ensure that the Q range of the particle assembly distinguishes well from the incident beam. The incident beam of the SAXS starts to interfere with the first minima of the samples assembled from particles larger than ∼300 nm.
To this end, we performed small-angle-X-ray scattering (SAXS) experiments to quantify the local order within the densely packed particles. The SAXS results show concentric rings in the scattering pattern, which indicates the local ordering of the particles in agreement with the long-range disordered, isotropic nature of the structure for samples with 20 and 40 V mm−1 electric field (Fig. 4A and B). For the low electric field cases, our results show concentric rings in the scattering pattern but with clearly uneven scattering intensity in the first and second rings, which is not present in the 20 and 40 V mm−1 samples (Fig. 4A and B). This directionality is a clear sign of order with polycrystallinity. Samples prepared with lower electric fields exhibit crystalline domains as evidenced by SEM images (Fig. 2A), however, these crystalline domains are on the order of ∼30 μm and therefore are smaller than the size of the X-ray beam which is ∼150 μm. Due to this size difference, many crystalline domains with different crystallinity orientations fit into the X-ray beam volume and this means that multiple scattering orientations are probed, giving rise to the concentric ring patterns seen in the SAXS measurements also for the ordered samples. Note that we observed similar SAXS patterns also for the well-ordered samples fabricated via vertical drying experiments (Fig. S1, ESI†).
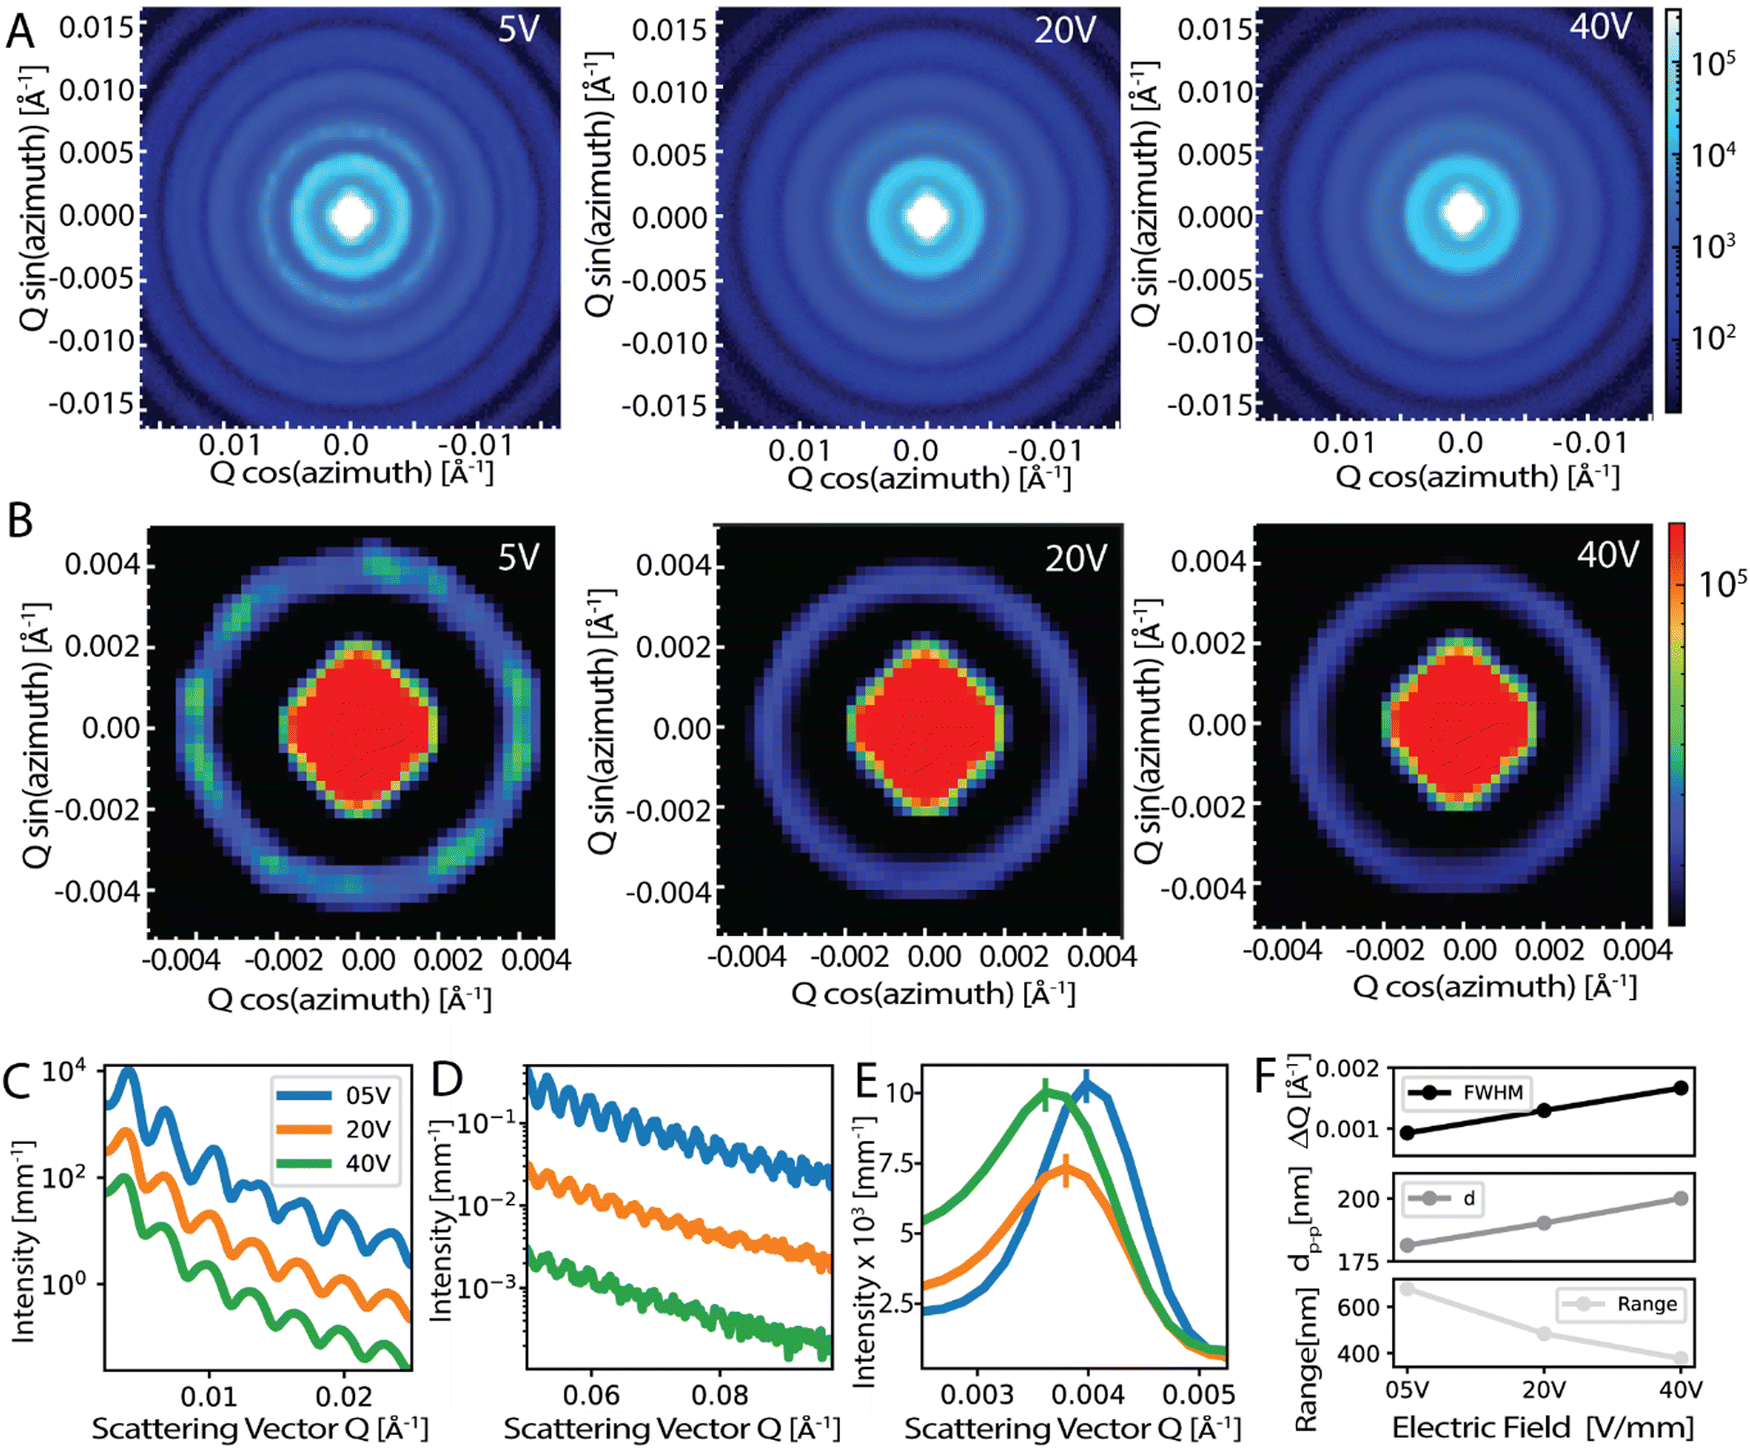 | ||
| Fig. 4 X-ray scattering characterization of electrodeposited samples. (A) Small-angle-X-ray-scattering (SAXS) patterns of samples with tunable order electrodeposited at field strengths of 5 V mm−1, 20 V mm−1, and 40 V mm−1, as tabulated. (B) SAXS patterns of the same samples depicting the first ring of the pattern to highlight the different degrees of homogeneity of the scattering ring pattern. (C) and (D) Averaged azimuthal scattering intensity measured for the samples given in (A) and (B) comparing the scattering peaks at (C) low scattering vector Q and at (D) large scattering vector Q. (E) Averaged azimuthal scattering intensity of the same samples highlighting the scattering peak positions and the full-width-at-half-maximum (FWHM, ΔQ) values of the 1st peak. (F) Evolution of the FWHM value ΔQ (top), the particle–particle distance dp–p (middle), and the range-of-the-order estimates (bottom) over the applied electric field strengths. | ||
SAXS results exhibit significant differences in the range of order and packing for the samples. The averaged azimuthal scattering intensity of the samples given in Fig. 4C and D shows many peaks for the samples but some of the peaks in the 5 V mm−1 sample show signs of splitting which indicates long-range order. In addition, the extent of these scattering peaks, which is visibly longer for 5 V mm−1 and decreases with increasing applied field, shows a clear indication of the longer range of order for the low-electric field samples, see Fig. 4D. To reveal the difference in the packing, we looked at the scattering intensity distributions which peak at a Qpeak (i.e. first peak in Fig. 4C) for the samples prepared with 5, 20, and 40 V mm−1 electric field strengths and 180 nm-sized particles. The Qpeak values were 0.00398, 0.00379, 0.00361 Å−1, respectively (Fig. 4E). For colloidal assemblies, the peak scattering vector is given by: Qpeak ≈ 2.3(π/dp–p), where dp–p estimates the particle–particle distance.61,62 Taking the experimental Qpeak values we find the particle–particle distances dp–p as 181, 190, and 200 nm, for the 5, 20, and 40 V mm−1 samples, respectively (Fig. 4E and F). The increase of the particle–particle distance indicates that the packing becomes loser and more disordered as the electric field is increased for the assembly of the colloids.
By fitting a Gaussian distribution to the scattering curve, we also measured the range of local order (ξ) from the full-width-at-half-maximum (ΔQ) using the relation: ξ = 2π/ΔQ. With a measured ΔQ of 0.00093, 0.00148 and 0.00185 Å−1 for the 5, 20 and 40 V mm−1 electric field strengths, this analysis predicts a range of local order of 678, 484, and 376 nm for the samples prepared with 180 nm particles, respectively (Fig. 4F). The observed decrease in the range of order confirms the increase of disorder with an increasing field strength in the sample preparation. Considering that angle-independent color with optimum color brightness is expected at a moderate electric field of ∼15 V mm−1, a range of order for optimal optical response can be estimated based on the SAXS analyses. If the dependence of the range of the order on electric field strength shown in Fig. 4F is assumed to behave linearly, the range of order for an optimal optical response can be estimated. This approach discloses an optimal range of 569 nm which corresponds to ∼3.2 particle diameters. Note that the optimal range provided here pertains to colloidal assemblies and signifies a trade-off between brightness and minimal angle-dependence.
To evaluate whether the measured reflectance peaks are caused by the resonant scattering from the packing, we compared the wavelength at maximum reflectance with theoretical predictions based on the SAXS analyses. The Qpeak value obtained from the SAXS measurements can be correlated with the wavelength of the selectively scattered light (λpeak) through the equation: 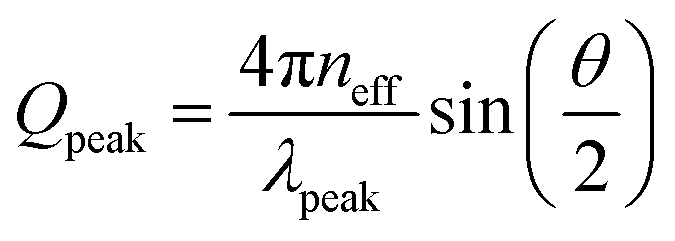 , where neff is the effective refractive index of the scattering system and θ is the scattering angle, i.e. the angle between the incoming and the scattered wavevectors. Assuming θ = π, and using Qpeak ≈ 2.3(π/dp–p), we arrive at the following prediction for the peak wavelength:
 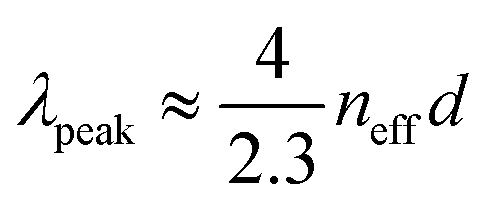 .61,62 In the case of optically soft materials, such as dielectric composites with minimal index contrast like polystyrene particles in water or silica particles in air, it has been demonstrated that one can estimate the effective refractive index, neff, using the Maxwell-Garnett (MG) approximation.63 When dealing with materials exhibiting a higher index contrast, it has been noted that the MG approximation tends to overestimate the effective index.64
For an effective medium consisting of 60% polystyrene (n = 1.59) in air, we obtain a MG neff = 1.33 while the approach of Reufer et al.64 would predict neff = 1.22. Based on these estimates, we expect the peak wavelength for particles with diameters of 310 nm to lie at 717 nm or 658 nm, respectively. This range of predictions is reasonably close to the value of ∼680 nm obtained from the reflectance measurements, see Fig. 3C. This confirms that the color of the electrodeposited samples emerges from the selective scattering of light by the particle assemblies.
The ability to create tunably ordered colloidal glasses by electrodeposition opens the possibility to fabricate structurally colored films with tunable colors (Fig. 5). We illustrate this by manufacturing a set of films from 180 nm PS particles and carbon black as the absorber with varied color performance. Here the addition of the absorber essentially increases the saturation and helps the macroscopic visualization of the color.33 Photographs reveal that the color response can change significantly with the applied field (Fig. 5A). With the increased field strength, the brightness decreases, and color becomes dull. To evaluate the color response beyond visual perception we performed image analyses and examined the evolution of the hue (H), saturation (S), and value (V, brightness) over the samples with varying order. These analyses reveal that the hue of the sample remains unchanged as expected. Because the particle size is the same for all samples, the reflected wavelength of the color, which relates to hue, is not expected to change significantly. The saturation value decreases with increasing disorder but levels off at a value of ∼0.7 most likely due to the presence of an absorber which enhances color saturation. The most significant change is observed in the value (brightness) of the samples, which decreases as the disorder increases. Such an effect is indeed expected because disorder triggers the reflected light to diffuse in many directions, thus decreasing the observed reflected light which is what we perceive as brightness.
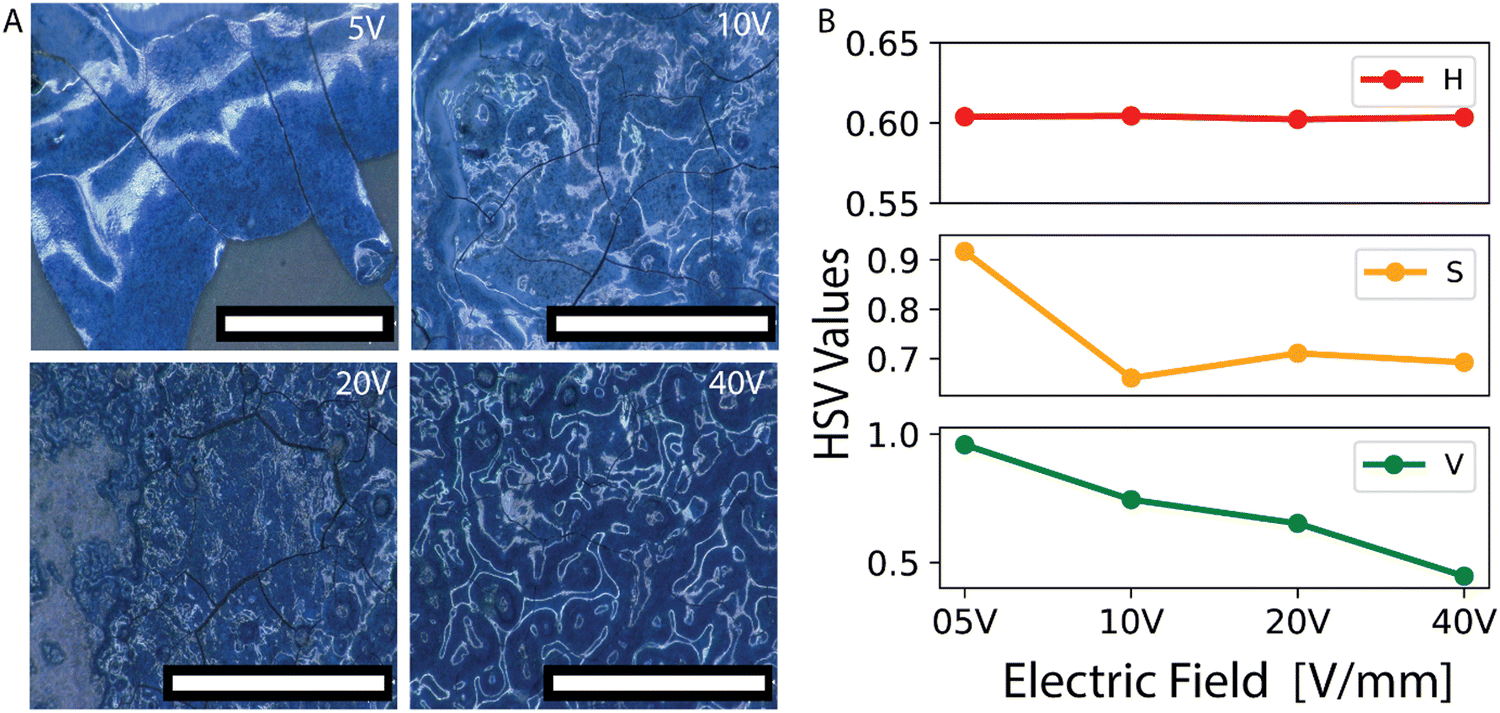 | ||
| Fig. 5 Photographs and image analyses of electrodeposited films. (A) Photographs of films with 0.3% carbon black absorber at various applied electric fields from 5 to 40 V mm−1. Scale bars are 1 mm. (B) Plots of the hue (H), saturation (S), and value (V, brightness) analyses of the images from the samples in (A) demonstrate how the HSV values evolve with the change of order tuned with the electric field. | ||
Conclusions
Structurally colored thin films and coatings with tunable disorder can be manufactured by electrodeposition of colloidal particles. The electric field strength acts as a tuning knob for the disorder of the assembled structures. By applying this principle, we demonstrate that it is possible to tune the structure from a crystalline assembly to a glassy structure. With the help of microscopy, X-ray scattering, and optical characterization, we show that the photonic properties of the assembled films can be deliberately tuned with the applied electric fields. Structures at 5 and 10 V mm−1 electric fields exhibit high reflection but angle-dependent color, whereas structures above 20 V mm−1 electric fields exhibit low reflection but angle-independent color. Our analyses suggest that angle-independent color with optimum color brightness can be achieved for typical colloidal particles when the range of order is at ∼3.2 particle diameters, which is expected at a moderate electric field of ∼15 V mm−1. This report of a range of orders estimated from SAXS analyses and the electrodeposition platform, which is already used in industry, e.g. in the automotive sector for coloration, has the potential to set the stage for optimizing the isotropic color performance of structural colors in numerous applications.Experimental section
Particle synthesis
Polystyrene nanoparticles (PS) were synthesized using standard surfactant-free polymerization using 4-vinyl benzenesulfonate as an ionic comonomer and methanol as a cosolvent.65 By varying the methanol content, we could obtain particles of different sizes. Scanning electron microscopy SEM (Tescan Mira3 LM FE) determined the mean diameter of the spheres to be as 180, 270, and 310 nm, with a polydispersity of approximately 5%.Electrodeposition of colloids
PS dispersions were prepared in a water–ethanol mixture with a 1![[thin space (1/6-em)]](https://www.rsc.org/images/entities/char_2009.gif) :4 water-to-ethanol ratio. A total of 20 mL suspension consisted of PS 1 wt% of particles. To this dispersion, 150 μL of concentrated NH4OH aqueous solution was added before electrodeposition. The solution was placed in an ultrasonic water bath, to disperse the particles homogeneously. Indium-tin oxide (ITO) – coated glass coverslips were used as coating substrates. For a homogenous electric field, two ITO slides were sandwiched with a 1 mm gap in between while the conductive sides were facing each other. ITO slides were connected to a DC power supply to apply voltages varying between 2–40 V. For the deposition of samples with carbon black we prepared an aqueous 1 wt % carbon black suspension using sodium dodecylbenzene sulfonate (SDBS) surfactant. The CB used in this work is type Cabot Vulcan XC72R GP-3919 and has a reported average size of 50 nm. Given the nature of the assembly method, we presume that the particle arrangement is approximately isotropic. This implies that the partial order in the lateral direction is akin to the order observed in the vertical direction in our samples.
:4 water-to-ethanol ratio. A total of 20 mL suspension consisted of PS 1 wt% of particles. To this dispersion, 150 μL of concentrated NH4OH aqueous solution was added before electrodeposition. The solution was placed in an ultrasonic water bath, to disperse the particles homogeneously. Indium-tin oxide (ITO) – coated glass coverslips were used as coating substrates. For a homogenous electric field, two ITO slides were sandwiched with a 1 mm gap in between while the conductive sides were facing each other. ITO slides were connected to a DC power supply to apply voltages varying between 2–40 V. For the deposition of samples with carbon black we prepared an aqueous 1 wt % carbon black suspension using sodium dodecylbenzene sulfonate (SDBS) surfactant. The CB used in this work is type Cabot Vulcan XC72R GP-3919 and has a reported average size of 50 nm. Given the nature of the assembly method, we presume that the particle arrangement is approximately isotropic. This implies that the partial order in the lateral direction is akin to the order observed in the vertical direction in our samples.
Color mapping
The images of the samples were taken with a Keyence (Keyence, VHX-5000) digital microscope under constant illumination and controlled light conditions. Color mapping in the HSV space was done with a modified open-source OpenCV Python code.66SEM imaging
Samples for scanning electron microscopy (SEM) were imaged on a Tescan Mira3 LM FE instrument using an in-lens detector and an acceleration voltage of 5 kV.Small-angle X-ray scattering
The scattering pattern of deposited colloidal structures was characterized for samples with particle diameters of 180 nm. SAXS X-ray scattering measurements were performed with a Xeuss 3.0 UHR SAXS/WAXS system (Xenocs SAS, Grenoble, France) equipped with a GeniX 3D Cu K-alpha radiation source (λ ≈ 1.54 Å) and a Q-Xoom in-vacuum motorized Eiger2 R 1M detector (Dectris Ltd, Switzerland) for data collection. The reduction of 2D data into 1D plots of the scattering intensities, I(Q), was performed automatically using the Xenocs XSACT software. The scattering vector Q was calculated using the relation: Q = 4πsinθ/λ, where θ is half the scattering angle.
Optical properties
Optical microscopy images were taken with a Point Grey Grasshopper 3 USB3 camera (GS3-U3-28S5C-C, Point Grey/FLIR Integrated Imaging Solutions Inc., Richmond, Canada), a Zeiss Axioskop A1 microscope (Zeiss AG, Oberkochen, Germany) and a Xenon light source (Thorlabs SLS401; Thorlabs GmbH, Dachau, Germany). A white diffuser standard was used as a reference.Spectroscopy measurements were taken with a modified Zeiss Axioskop A1 (Zeiss AG, Oberkochen, Germany) and a photodiode spectrometer (Ocean Optics Maya2000 Pro; Ocean Optics, Dunedin, FL, USA). The reflectance spectra were taken with an optical fiber with a 230 μm core and spot size of 13 μm, and a Zeiss Epiplan Neofluar 20 × (NA = 0.6) or a Zeiss Epiplan Neofluar 50 × (NA = 0.8) lens.
Statistical analyses
Experimental data shown in graphs correspond to mean values.Author contributions
A.F. D. performed most of the experiments. A. F. D., S. M., and F. S. designed the research. A. F. D. conceived the research project and the original idea. K. M. and A. F. D. prepared the manuscript content. K. M. and S. M. assisted with the experiments and the interpretation of the results. A. F. D. wrote the original manuscript draft. All authors discussed and critically assessed the results and their implications and revised the manuscript at all stages.Conflicts of interest
There are no conflicts to declare.Acknowledgements
We thank Pavel Yazghur (Uni. Fribourg) for particle synthesis and Thomas Weber (ETH Zurich, D-MATL) for the assistance with the SAXS measurements. We acknowledge Prof. André Studart (ETH Zurich, D-MATL) for letting us use the laboratory and equipment. This research was supported by the Swiss National Science Foundation through the National Centre of Competence in Research Bio-Inspired Materials (No. 205603) and projects No. 188494 and No. 169074.References
- J. Sun, B. Bhushan and J. Tong, RSC Adv., 2013, 3, 14862 RSC.
- P. Vukusic and J. R. Sambles, Nature, 2003, 424, 852 CrossRef CAS PubMed.
- R. O. Prum, R. H. Torres, S. Williamson and J. Dyck, Nature, 1998, 396, 28 CrossRef CAS.
- R. K. Iler, Nature, 1965, 207, 472 CrossRef CAS.
- F. Marlow, P. Sharifi, R. Brinkmann and C. Mendive, Angew. Chem., Int. Ed., 2009, 48, 6212 CrossRef CAS PubMed.
- S. Kinoshita, Structural Colors in the Realm of Nature, World Scientific, 2008 Search PubMed.
- P. Vukusic, J. R. Sambles, C. R. Lawrence and R. J. Wootton, Proc. R. Soc. London, Ser. B, 1999, 266, 1403 Search PubMed.
- V. Sharma, M. Crne, J. O. Park and M. Srinivasarao, Science, 2009, 325, 449 CrossRef CAS PubMed.
- E. Poloni, A. Rafsanjani, V. Place, D. Ferretti and A. R. Studart, Adv. Mater., 2021, 34, 2104874 CrossRef PubMed.
- G. Pfaff, in High Performance Pigments, ed. E. B. Faulkner and R. J. Schwartz, 2009, pp. 75–104 Search PubMed.
- E. S. A. Goerlitzer, R. N. Klupp Taylor and N. Vogel, Adv. Mater., 2018, 30, 1706654 CrossRef PubMed.
- H. S. Lee, T. S. Shim, H. Hwang, S.-M. Yang and S.-H. Kim, Chem. Mater., 2013, 25, 2684 CrossRef CAS.
- H. Galinski, E. Jeoffroy, A. Zingg, L. Grob, P. A. Ruhs, R. Spolenak and A. R. Studart, Appl. Phys. Lett., 2020, 117, 5 CrossRef.
- A. B. dos Santos, F. J. Cervantes and J. B. van Lier, Bioresour. Technol., 2007, 98, 2369 CrossRef CAS PubMed.
- L. Ren, H. Lin, F. Meng and F. Zhang, Ceram. Int., 2019, 45, 9646 CrossRef CAS.
- M. Yasir, T. Sai, A. Sicher, F. Scheffold, U. Steiner, B. D. Wilts and E. R. Dufresne, Small, 2021, 17, 2103061 CrossRef CAS PubMed.
- Q. Fu, W. Yu, G. Bao and J. Ge, Nat. Commun., 2022, 13, 7007 CrossRef CAS PubMed.
- H. Wang, H. Zhang, Z. Chen, Y. Zhao, Z. Gu and L. Shang, Prog. Mater. Sci., 2023, 135, 101091 CrossRef CAS.
- F. Chen, Y. Huang, R. Li, S. Zhang, B. Wang, W. Zhang, X. Wu, Q. Jiang, F. Wang and R. Zhang, Chem. Commun., 2021, 57, 13448 RSC.
- H. Wang, Y. Liu, Z. Chen, L. Sun and Y. Zhao, Sci. Adv., 2020, 6, eaay1438 CrossRef CAS PubMed.
- H. Wang, L. Cai, D. Zhang, L. Shang and Y. Zhao, Research, 2021, 2021, 9829068 CAS.
- R. Li, S. Zhang and R. Zhang, Chem.: Methods, 2023, 3, e202200081 CAS.
- Z. Xuan, J. Li, Q. Liu, F. Yi, S. Wang and W. Lu, Innovation, 2021, 2, 100081 CAS.
- J. H. Moon and S. Yang, Chem. Rev., 2010, 110, 547 CrossRef CAS PubMed.
- J. Wang, Y. Zhang, S. Wang, Y. Song and L. Jiang, Acc. Chem. Res., 2011, 44, 405 CrossRef CAS PubMed.
- L. Schertel, L. Siedentop, J.-M. Meijer, P. Keim, C. M. Aegerter, G. J. Aubry and G. Maret, Adv. Opt. Mater., 2019, 7, 1900442 CrossRef.
- G. Shang, M. Eich and A. Petrov, APL Photonics, 2020, 5, 060901 CrossRef CAS.
- P. D. García, R. Sapienza and C. López, Adv. Mater., 2010, 22, 12 CrossRef PubMed.
- S. Magkiriadou, J.-G. Park, Y.-S. Kim and V. N. Manoharan, Phys. Rev. E: Stat., Nonlinear, Soft Matter Phys., 2014, 90, 062302 CrossRef CAS PubMed.
- G. J. Aubry, L. S. Froufe-Pérez, U. Kuhl, O. Legrand, F. Scheffold and F. Mortessagne, Phys. Rev. Lett., 2020, 125, 127402 CrossRef CAS PubMed.
- L. Schertel, I. Wimmer, P. Besirske, C. M. Aegerter, G. Maret, S. Polarz and G. J. Aubry, Phys. Rev. Mater., 2019, 3, 015203 CrossRef CAS.
- Y. Takeoka, S. Yoshioka, A. Takano, S. Arai, K. Nueangnoraj, H. Nishihara, M. Teshima, Y. Ohtsuka and T. Seki, Angew. Chem., Int. Ed., 2013, 52, 7261 CrossRef CAS PubMed.
- J. D. Forster, H. Noh, S. F. Liew, V. Saranathan, C. F. Schreck, L. Yang, J.-G. Park, R. O. Prum, S. G. J. Mochrie, C. S. O’Hern, H. Cao and E. R. Dufresne, Adv. Mater., 2010, 22, 2939 CrossRef CAS PubMed.
- Y. Takeoka, M. Honda, T. Seki, M. Ishii and H. Nakamura, ACS Appl. Mater. Interfaces, 2009, 1, 982 CrossRef CAS PubMed.
- J. G. Park, S. H. Kim, S. Magkiriadou, T. M. Choi, Y. S. Kim and V. N. Manoharan, Angew. Chem., Int. Ed., 2014, 53, 2899 CrossRef CAS PubMed.
- Y. Naoi, T. Seki, R. Ohnuki, S. Yoshioka and Y. Takeoka, Langmuir, 2019, 35, 13983 CrossRef CAS PubMed.
- L. Schertel, S. Magkiriadou, P. Yazhgur and A. Demirörs, Chimia, 2022, 76, 833 CrossRef CAS PubMed.
- B. M. Boyle, T. A. French, R. M. Pearson, B. G. McCarthy and G. M. Miyake, ACS Nano, 2017, 11, 3052 CrossRef CAS PubMed.
- Y. Liu, H. Wang, J. Ho, R. C. Ng, R. J. H. Ng, V. H. Hall-Chen, E. H. H. Koay, Z. Dong, H. Liu, C.-W. Qiu, J. R. Greer and J. K. W. Yang, Nat. Commun., 2019, 10, 4340 CrossRef PubMed.
- B. B. Patel, D. J. Walsh, D. H. Kim, J. Kwok, B. Lee, D. Guironnet and Y. Diao, Sci. Adv., 2020, 6, eaaz7202 CrossRef CAS PubMed.
- W. Zhang, H. Wang, H. Wang, J. Y. E. Chan, H. Liu, B. Zhang, Y.-F. Zhang, K. Agarwal, X. Yang, A. S. Ranganath, H. Y. Low, Q. Ge and J. K. W. Yang, Nat. Commun., 2021, 12, 112 CrossRef CAS PubMed.
- A. T. L. Tan, J. Beroz, M. Kolle and A. J. Hart, Adv. Mater., 2018, 30, 1803620 CrossRef PubMed.
- A. F. Demirörs, E. Poloni, M. Chiesa, F. L. Bargardi, M. R. Binelli, W. Woigk, L. D. C. de Castro, N. Kleger, F. B. Coulter, A. Sicher, H. Galinski, F. Scheffold and A. R. Studart, Nat. Commun., 2022, 13, 4397 CrossRef PubMed.
- J. S. Llorens, L. Barbera, A. F. Demirörs and A. R. Studart, Adv. Mater., 2023, 2302868 CrossRef CAS PubMed.
- M. Xiao, A. B. Stephenson, A. Neophytou, V. Hwang, D. Chakrabarti and V. N. Manoharan, Opt. Express, 2021, 29, 21212 CrossRef CAS PubMed.
- S.-H. Kim, S. Magkiriadou, D. K. Rhee, D. S. Lee, P. J. Yoo, V. N. Manoharan and G.-R. Yi, ACS Appl. Mater. Interfaces, 2017, 9, 24155 CrossRef CAS PubMed.
- X. Liu, J. Liu, B. Wei, D. Yang, L. Luo, D. Ma and S. Huang, Adv. Sci., 2023, 10, 2302240 CrossRef CAS PubMed.
- G. Shang, L. Maiwald, H. Renner, D. Jalas, M. Dosta, S. Heinrich, A. Petrov and M. Eich, Sci. Rep., 2018, 8, 7804 CrossRef PubMed.
- A. Kawamura, M. Kohri, S. Yoshioka, T. Taniguchi and K. Kishikawa, Langmuir, 2017, 33, 3824 CrossRef CAS PubMed.
- A. Kawamura, M. Kohri, G. Morimoto, Y. Nannichi, T. Taniguchi and K. Kishikawa, Sci. Rep., 2016, 6, 33984 CrossRef CAS PubMed.
- Y. Häntsch, G. Shang, B. Lei, B. Winhard, A. Petrov, M. Eich, E. Holm, G. A. Schneider and K. P. Furlan, ACS Appl. Mater. Interfaces, 2021, 13, 20511 CrossRef PubMed.
- D. Yang, Y. Hu, Y. Hu and S. Huang, J. Phys. Chem. C, 2020, 124, 6328 CrossRef CAS.
- M. Harun-Ur-Rashid, A. Bin Imran, T. Seki, M. Ishii, H. Nakamura and Y. Takeoka, ChemPhysChem, 2010, 11, 579 CrossRef CAS PubMed.
- B. Michov, Electrophoresis Fundamentals: Essential Theory and Practice, Walter De Gruyter GmbH & Co KG, 2022 Search PubMed.
- D. A. Saville, I. A. Aksay, M. Trau and S. Sankaran, Nature, 1995, 374, 437 CrossRef.
- K. Katagiri, Y. Tanaka, K. Uemura, K. Inumaru, T. Seki and Y. Takeoka, NPG Asia Mater., 2017, 9, e355 CrossRef CAS.
- D. A. H. Hanaor, M. Michelazzi, P. Veronesi, C. Leonelli, M. Romagnoli and C. C. Sorrell, J. Eur. Ceram. Soc., 2011, 31, 1041 CrossRef CAS.
- F. García-Santamaría, J. F. Galisteo-López, P. V. Braun and C. López, Phys. Rev. B, 2005, 71, 195112, DOI:10.1103/PhysRevB.71.195112.
- Colour Science for Python, can be found at https://www.colour-science.org/, 2015.
- D. G. Stavenga, H. L. Leertouwer, P. Pirih and M. F. Wehling, Opt. Express, 2009, 17, 193 CrossRef CAS PubMed.
- J. Liu, H.-J. Schöpe and T. Palberg, Part. Part. Syst. Charact., 2000, 17, 206 CrossRef CAS.
- P. Yazhgur, G. J. Aubry, L. S. Froufe-Pérez and F. Scheffold, Opt. Express, 2021, 29, 14367 CrossRef CAS PubMed.
- J. C. M. Garnett, Philos. Trans. R. Soc. London, 1904, 203, 385 CrossRef CAS.
- M. Reufer, L. F. Rojas-Ochoa, S. Eiden, J. J. Sáenz and F. Scheffold, Appl. Phys. Lett., 2007, 91, 171904 CrossRef.
- P. Yazhgur, N. Muller and F. Scheffold, ACS Photonics, 2022, 9, 2809 CrossRef CAS PubMed.
- “click_and_crop.py,” can be found under https://gist.github.com/nikgens/c2f9d0dfba12f5e8789d9258d4538899.
Footnote |
| † Electronic supplementary information (ESI) available. See DOI: https://doi.org/10.1039/d3sm01468a |
| This journal is © The Royal Society of Chemistry 2024 |