
 Open Access Article
 This Open Access Article is licensed under a Creative Commons Attribution-Non Commercial 3.0 Unported Licence
In situ interface reaction-enabled electrochemiluminescence imaging for single-cell formaldehyde release analysis†
Juanhua
Zhou
and
Yang
Liu
 *
*
Department of Chemistry, Beijing Key Laboratory for Analytical Methods and Instrumentation, Key Lab of Bioorganic Phosphorus Chemistry and Chemical Biology of Ministry of Education, Tsinghua University, Beijing, 100084, China. E-mail: liu-yang@mail.tsinghua.edu.cn
First published on 20th August 2024
Abstract
Monitoring metabolites in situ at the single-cell scale is important for revealing cellular heterogeneity and dynamic changes of cell status, which provides new possibilities for disease research. Benefiting from the advantages of both electrochemical and optical methods, electrochemiluminescence (ECL) has great potential in this field. However, developing real-time in situ imaging methods is full of challenges. In this study, an ECL imaging method for formaldehyde (FA), a kind of cellular metabolite, was developed based on the in situ generation of co-reactants at the electrode interface and was successfully applied to the monitoring of single-cell FA release. Amino groups can undergo a rapid nucleophilic addition reaction with FA to form amino alcohol intermediates, which can be used as co-reactants for tris(2,2′-bipyridyl)ruthenium(II) [Ru(bpy)32+] to significantly enhance the strength of ECL. Poly(amidoamine) (PAMAM), with a large number of amino groups, and reduced graphene oxide (rGO), with excellent electrical conductivity and electrocatalytic properties, were introduced as the modification layer on the electrode surface to realize the “turn on” detection of FA. This sensing method also eliminated the use of the classic toxic co-reactant tripropylamine (TPrA) and was further applied to in situ imaging of single-cell FA release. It successfully obtained ECL images at different time points after the stimulation of HeLa cells with thapsigargin (TG), revealing the change pattern in drug efficacy over time. This work proposes a new ECL imaging approach for real-time in situ monitoring of FA release from single cells, further broadening the application of ECL imaging in single-cell analysis.
Introduction
Formaldehyde (FA) can be produced by various metabolic pathways in organisms and easily penetrates any cellular compartment and cell membrane.1–3 Under normal physiological conditions, the concentration of intracellular FA is maintained at a relatively low physiological level (0.2–0.5 mM) through metabolic clearance mechanisms,4 participating in physiological activities such as anti-cancer immunity and memory formation.5 However, when the detoxification system is weakened or fails, FA spreads outside the cell and accumulates in the body, causing harm to human health. FA content in the body is closely related to human health, and high concentrations of FA (>800 mM) are thought to cause various diseases, including cancer,6 cardiovascular diseases,7 and neurodegenerative diseases.8 In addition, the distribution location and metabolic characteristics of FA in the body have been shown to correlate with pathological states. For example, endogenous FA secreted by tumour cells can diffuse into the extracellular space and synergistically induce bone cancer pain in the acidic tumour microenvironment.9,10 Therefore, spatiotemporal resolution analysis of FA metabolism is beneficial for a comprehensive understanding of the complex role of FA in organisms. However, there is often heterogeneity within the cell population.11,12 So real-time in situ detection of FA metabolism at the single cell scale can reveal the differences of FA metabolism in different single cells, analyze the distribution and dynamic changes of FA in the cell microenvironment, help clarify the metabolism mechanism of FA in different physiological states, and provide a powerful support tool for monitoring and treating diseases related to the imbalance of FA metabolism.To date, various highly sensitive FA sensing methods have been developed, including chromatography,13 electrochemistry,14 and piezoresistive15 or semiconductor sensors.16 However, due to the inherent difficulties in obtaining location information, these methods still face significant challenges in real-time in situ monitoring of dynamic changes in extracellular FA content. In recent years, optical imaging methods have been widely used to monitor dynamic changes in signalling molecules in vivo due to their ability to obtain real-time in situ information. Among them, various fluorescence imaging methods for FA analysis in live samples have been reported.17–19 Although fluorescence imaging has advantages in spatial resolution, its inherent need for external light sources brings problems such as photobleaching and background interference, limiting its further development.20 Electrochemiluminescence (ECL), as a combination of electrochemical and optical methods, avoids the background light interference caused by the spontaneous bioluminescence from external light sources in fluorescence methods, showing great potential in biological analysis.21–25 Recently, there have been some reports on ECL imaging of metabolic molecules at the single-cell level.26 For example, Jiang's team was the first to develop an ECL imaging method for hydrogen peroxide efflux at the single-cell scale.27 To further improve the sensitivity of ECL imaging methods, various single-cell extracellular hydrogen peroxide ECL imaging methods based on chitosan-modified electrodes or single nanoparticle modified electrodes have also been reported successively.28–30 In addition to continually improving the sensitivity of methods, the analytical scope of ECL imaging is expanding. For example, Wang et al. developed a confined ECL imaging microarray for high-throughput sensing of dopamine released from single cells.31 Despite extensive research in the field of ECL imaging of single-cell metabolites, ECL imaging methods for single-cell FA release remain to be developed. Moreover, tris(2,2′-bipyridyl)ruthenium(II) (Ru(bpy)32+) is one of the most widely used luminophores due to its electrochemical reversibility, high quantum yield and high stability. However, the volatility and toxicity of its classic co-reactant tri-n-propylamine (TPrA) have limited the application of this ECL system to cellular process research.32 Therefore, the use of biofriendly co-reactants helps to improve the biocompatibility of this ECL system to expand its application field.33,34 Consequently, it is necessary to develop a biocompatible ECL imaging strategy to achieve real-time in-situ monitoring of FA release from single cells.
To solve the above problems, an ECL imaging method was designed to convert analyte FA into biocompatible co-reactants based on the in situ reaction at the electrode interface. FA is a reactive carbonyl compound that has been reported to undergo a rapid nucleophilic addition reaction with primary amine groups to form amino alcohol intermediates.35,36 The amino alcohol intermediates can be oxidized by electrogenerated Ru(bpy)33+ to produce stronger ECL emission.37 Poly(amidoamine) (PAMAM) dendrimers are widely used in the field of biomedicine owing to their high biocompatibility and multifunctionality.38,39 Because of the abundant primary amine groups on the terminals of the polymer, they are suitable for modification on the electrode surface to provide numerous reaction sites for FA molecules. Simultaneously, modifying reduced graphene oxide (rGO) with high conductivity, transparency, and excellent electrocatalytic performance on an ITO electrode can provide a highly transparent catalytic electrode interface.40,41 On this basis, this work developed an in-situ electrode interface reaction enhanced ECL sensing method for FA based on a PAMAM/rGO composite nanomaterial modified ITO electrode interface, as demonstrated in Scheme 1. By in situ conversion of metabolites to co-reactants on the electrode surface, it can effectively capture how to fix metabolites to reduce their free diffusion in the extracellular space, which contributes to visualizing the spatial distribution of FA. At the same time, the method also avoided the interference of additional toxic co-reactants on cells, and was applied to the dynamic monitoring of FA secretion by HeLa cells after thapsigargin (TG) stimulation, which further expanded the application of ECL imaging in the field of pathology research.
 | ||
| Scheme 1 Schematic illustration of the ECL imaging setup and mechanism of the ECL visualization of FA release from HeLa cells by TG stimulation. | ||
Experimental
Reagents and apparatus
Graphene oxide (GO) was prepared using an improved Hummer's method as previously reported.42 Reduced graphene oxide (rGO) was prepared by reducing GO with vitamin C as previously reported.43 PAMAM, G3.0 was purchased from Weihai CY Dendrimer Technology Co., Ltd. Tris(2,2′-bipyridine)ruthenium(II) chloride hexahydrate [Ru(bpy)3Cl2·6H2O] was purchased from Sigma-Aldrich. Potassium hexacyanoferrate(III) [K3Fe(CN)6] and potassium ferrocyanide [K4Fe(CN)6] were obtained from Jinke Co. (Tianjin, China). Phosphate-buffered saline (PBS, pH 7.4) was purchased from Shanghai Sangon Biotech Co., Ltd. Fetal bovine serum (FBS) was purchased from Zhejiang Tianhang Biotechnology. Dimethyl sulfoxide (DMSO) was purchased from Beijing Solarbio Science & Technology Co., Ltd. Human cervical cancer cell line (HeLa cells) was purchased from Procell Life Science &Technology Co., Ltd. Ultrapure water (≥18 MΩ cm) was used throughout the experiment.Preparation of the PAMAM/rGO modified ITO electrode
The ITO was soaked overnight in a 2 M NaOH solution, followed by sequential ultrasonic treatment for 20 minutes each in acetone, ethanol, and water to clean the surface. Subsequently, 60 μL of a 0.1 mg mL−1 rGO aqueous solution was dropcast onto a 10 mm × 10 mm ITO area and dried at 37 °C. After this, 60 μL of a 0.5 mg mL−1 PAMAM aqueous solution was further dropcast onto the rGO-coated ITO and dried to obtain a PAMAM/rGO/ITO electrode.Cell culture
HeLa cells were cultured in DMEM medium supplemented with 10% FBS and 1% penicillin/streptomycin at 37 °C under a humidified atmosphere containing 5% CO2. The cells in the exponential growth phase were digested for 2 min with trypsin (0.1%, m/v), and then separated from the cell culture medium. The cells were gathered by centrifugation and resuspended in DMEM. Then the living cells were seeded on the PAMAM/rGO/ITO electrode and incubated for 12 h in culture medium at 37 °C and 5% CO2. Before ECL measurement, the cells were gently rinsed with 10 mM PBS (pH 7.4) to remove the culture medium.Electrochemical measurements and imaging
For conventional ECL intensity test, the working electrode (WE) was the modified ITO electrode, the auxiliary electrode (AE) was a Pt wire and the reference electrode (RE) was an Ag/AgCl electrode. The ECL experiments were carried out in PBS (0.1 M, pH 7.4) containing 1 mM Ru(bpy)32+, and the light/current/voltage curves were recorded by collecting the preamplified PMT output signal with an MPI-M ECL analyzer.For ECL imaging, the ECL imaging system was assembled with an inverted microscope from Olympus, an electron-multiplying CCD camera, an objective (NA 0.5, 50×, Olympus, Japan) and a translation stage to adjust the sample position. A three-electrode system was used, including the modified ITO electrode as the WE, a Pt wire as the AE and an Ag/AgCl electrode as the RE. The ECL experiments were carried out in PBS (0.1 M, pH 7.4) containing 1 mM Ru(bpy)32+, with the potential applied to the electrodes using an SP-150e potentiostat electrochemical workstation (BioLogic, France). The ECL image was analysed using ImageJ software.
Result and discussion
Characterization of the PAMAM/rGO modified electrode
Firstly, GO was synthesized using the improved Hummers method,42 and then rGO was obtained by reducing GO with vitamin C.43 The successful synthesis of GO and rGO was confirmed by transmission electron microscopy (TEM), Fourier transform infrared (FTIR) spectroscopy, and Raman spectroscopy. The morphology of GO was characterized by TEM, as shown in Fig. S1A.† GO exhibited a typical layered structure with obvious curling and wrinkling characteristics. Moreover, the chemical structure of GO was further validated using FTIR and Raman spectroscopy. As shown in Fig. S1B,† the peaks at 3401, 1722, and 1024 cm−1 in the FTIR spectrum of GO correspond to the OH out-of-plane bending, C![[double bond, length as m-dash]](https://www.rsc.org/images/entities/char_e001.gif) O stretching, and C–O stretching, respectively.44,45 The Raman spectrum in Fig. S1D† showed two bands at 1350 cm−1 (D band) and 1590 cm−1 (G band), respectively, attributed to the first-order scattering of the E2g phonon from sp2 carbon bonds and structural defects. The rGO obtained by chemical reduction of GO exhibited a layered morphology similar to GO (Fig. S1C†), and its Raman spectrum also displayed two characteristic bands, the D band and G band, caused by sp2 carbon bonds, as shown in Fig. S1D.† However, the significant reduction or even disappearance of the peaks at 3401, 1722, and 1024 cm−1 in the FTIR spectrum of rGO indicated the disappearance of OH bonds, CO bonds, and C–O bonds, implying the successful synthesis of rGO.43
O stretching, and C–O stretching, respectively.44,45 The Raman spectrum in Fig. S1D† showed two bands at 1350 cm−1 (D band) and 1590 cm−1 (G band), respectively, attributed to the first-order scattering of the E2g phonon from sp2 carbon bonds and structural defects. The rGO obtained by chemical reduction of GO exhibited a layered morphology similar to GO (Fig. S1C†), and its Raman spectrum also displayed two characteristic bands, the D band and G band, caused by sp2 carbon bonds, as shown in Fig. S1D.† However, the significant reduction or even disappearance of the peaks at 3401, 1722, and 1024 cm−1 in the FTIR spectrum of rGO indicated the disappearance of OH bonds, CO bonds, and C–O bonds, implying the successful synthesis of rGO.43
After sequentially modifying rGO and PAMAM on the surface of the ITO electrode using the drop-casting method, TEM was used to characterize the morphology of the PAMAM/rGO composite layer, as shown in Fig. 1A. The morphology was similar to that of rGO, indicating that the composite of PAMAM did not significantly change the morphology of rGO. In situ FTIR and Raman spectra were obtained to demonstrate the successful modification of PAMAM/rGO on the electrode surface. Raman spectroscopy was performed on bare ITO, rGO/ITO, and PAMAM/rGO/ITO to demonstrate the presence of rGO on ITO, as shown in Fig. 1C. The D and G bands of PAMAM/rGO/ITO indicated successful modification of rGO. To further evaluate the presence of PAMAM on the modified electrode, in situ FTIR was performed on PAMAM/rGO/ITO, rGO/ITO and PAMAM/ITO. As depicted in Fig. 1B, ITO modified with only rGO did not exhibit significant characteristic peaks in the infrared spectrum, while PAMAM/ITO and PAMAM/rGO/ITO both displayed several peaks at 3270, 2916, 2842, 1643, 1548, 1463, and 1191 cm−1. The peak near 3270 cm−1 can be attributed to NH and NH2 stretching, while the peak around 1548 cm−1 is related to N–H bending vibrations. In addition, the peak at 1191 cm−1 is associated with C–N stretching vibrations. The peak at 1643 cm−1 originates from CO stretching vibrations, and the two peaks at 2916 and 2842 cm−1 are attributed to C–H vibrations. All the above peaks indicate the presence of NH2, CO, and –CH2– groups, consistent with the structure of PAMAM,46,47 indicating the presence of PAMAM on the electrode surface. In summary, these results demonstrate the successful modification of the PAMAM/rGO nanomaterial layer on the electrode surface.
 | ||
| Fig. 1 (A) TEM image of PAMAM/rGO. (B) FTIR spectra of rGO/ITO (black line), PAMAM/rGO (blue line), and PAMAM/rGO/ITO (red line). (C) Raman spectra of bare ITO (black line), rGO/ITO (blue line), and PAMAM/rGO/ITO (red line). | ||
To further characterize the electrochemical performance of PAMAM/rGO/ITO, its conductivity was tested in a 0.1 M KCl solution containing 5.0 mM [Fe(CN)6]3−/4−via electrochemical impedance spectroscopy (EIS) and cyclic voltammetry (CV), as illustrated in Fig. S2.† Fig. S2A† provides the Nyquist plots of the impedance spectra for bare ITO, rGO/ITO, and PAMAM/rGO/ITO. As shown in Fig. S2A,† the semicircle diameter from rGO/ITO (blue line) was smaller than that from ITO (black line), while it was nearly identical to that from PAMAM/rGO/ITO (red line), suggesting an enhancement in conductivity owing to the modification of rGO.
ECL measurement and possible mechanisms
To verify the effective signal conversion from FA to ECL at the PAMAM/rGO/ITO electrode interface, the ECL of PAMAM/rGO/ITO was studied in 10 mM PBS solution containing 1 mM Ru(bpy)32+, ranging from 0 V to 1.6 V, with or without FA as shown in Fig. 2A (red line) and B. In the absence of FA, due to the inherent ECL of Ru(bpy)32+, the electrode exhibited a weak ECL signal. With the introduction of 10 mM FA, the ECL signal was significantly enhanced on the electrode, indicating the potential for high sensitivity FA sensing. Furthermore, after changing the electrochemical method to chronoamperometry (including potential switching between 1.3 V and 0 V at 1 s intervals), PAMAM/rGO/ITO continued to display a significant ECL intensity enhancement in the presence of FA, as shown in Fig. S3.† Subsequently, the chronoamperometry was used for ECL imaging analysis of FA. | ||
| Fig. 2 (A) ECL curves of bare ITO (black line), rGO/ITO (blue line), and PAMAM/rGO/ITO (red line) in 1 mM Ru(bpy)32+ with or without 10 mM FA, respectively. The electrochemical method is CV. (B) CV curves of PAMAM/rGO/ITO in different electrolyte solutions. (C) Raman spectrum of PAMAM before (black line) or after the reaction with FA. (D) FTIR spectrum of PAMAM/rGO/ITO after the reaction with FA. | ||
To further investigate the mechanism by which FA significantly enhances ECL at the PAMAM/rGO/ITO electrode interface, the CV and ECL curves of bare ITO, rGO/ITO, and PAMAM/rGO/ITO were plotted in 10 mM PBS solution containing 1 mM Ru(bpy)32+, with and without FA, as shown in Fig. 2A and B, and S4.† By comparing Fig. 2A and B, it can be observed that the peak potential of ECL matches that of CV, corresponding to the oxidation potential of Ru(bpy)32+, indicating that ECL emission originates from Ru(bpy)32+. Fig. S4† indicates that the introduction of FA enhances the ECL of Ru(bpy)32+ on bare ITO, rGO/ITO, or PAMAM/rGO/ITO, which can be attributed to FA directly acting as a co-reactant of Ru(bpy)32+, consistent with previous reports.48 However, as seen in Fig. 2A, in the presence of FA, the ECL intensity on the PAMAM/rGO/ITO electrode was significantly higher than that on bare ITO and rGO/ITO, implying an additional ECL enhancement mechanism at the PAMAM/rGO/ITO electrode interface, where PAMAM plays a crucial role in ECL enhancement. Considering that the aldehyde group in FA can easily undergo a nucleophilic addition reaction with the amine groups at the ends of PAMAM, forming amino alcohols,36 to explore the changes in the terminal amine groups of PAMAM on the electrode surface before and after the addition of FA, Raman and IR spectra of the electrode surface were tested, as shown in Fig. 2C and D. In Fig. 2C, the Raman spectrum of PAMAM (black line) shows peaks at 1334 cm−1 and 3400 cm−1, corresponding to the deformation and stretching vibrations of saturated amine –NH2, 1443 cm−1 corresponding to –CH2– bending vibration, and 1672 cm−1 corresponding to CO. Additionally, peaks near 2860 cm−1 and 3030 cm−1 are related to C–H stretching vibrations, confirming the presence of carbonyl, amine, and methylene groups in PAMAM.49,50 After the reaction with FA (red line), peaks at 1400 cm−1 and 1450 cm−1 represent secondary/tertiary amine vibrations, 1650 cm−1 corresponds to C–N stretching, and 2830 cm−1 and 2944 cm−1 correspond to C–H stretching, indicating the presence of methyl and methylene. Notably, the disappearance of the peak near 3400 cm−1 in the post-reaction Raman spectrum suggests the absence of –NH2, indicating the disappearance of the terminal primary amine group. Furthermore, the peak near 3280 cm−1 in Fig. 2D can be correlated with –OH out-of-plane bending, suggesting the transformation of the terminal amine groups of PAMAM to amino alcohols, thereby indicating a significant role of amino alcohols in the enhancement of ECL. Considering previous studies indicating that amino alcohols can be oxidized by Ru(bpy)33+ (produced by the electrooxidation of Ru(bpy)32+),37 which then participates in the ECL reaction, the potential enhancement mechanism is assumed to be as follows (Scheme 2).
 | ||
| Scheme 2 The proposed mechanism for ECL enhancement in the presence of FA. | ||
ECL analytical performance of the PAMAM/rGO modified electrode
Before evaluating the FA sensing performance of the electrode interface, the effects of different modification concentrations of rGO and PAMAM on the sensing ability were first investigated, as shown in Fig. S5.† When the PAMAM concentration was fixed as 0.5 mg mL−1, the higher concentration of rGO led to a stronger ECL response to 10 mM FA. The ECL response intensity stabilized when the rGO concentration reached 0.1 mg mL−1 or higher. Therefore, in subsequent experiments, the rGO modification concentration was set as 0.1 mg mL−1. Similarly, with the rGO concentration fixed at 0.1 mg mL−1, the higher concentration of PAMAM resulted in a stronger ECL response intensity. When the PAMAM concentration reached 0.5 mg mL−1 or higher, the change in ECL response intensity was not significant. Therefore, the modification concentration of PAMAM was set at 0.5 mg mL−1 in subsequent experiments. Additionally, repeatability of analytical measurement is crucial.51 As a result, the reproducibility across different electrodes was examined, as shown in Fig. S6.† Upon adding 10 mM FA, the ECL signal generated between the three electrodes showed a relatively small relative standard deviation (RSD) of 1.49%.In order to further evaluate the FA sensing performance of the electrode, the ECL stability at the electrode interface was studied. As shown in Fig. 3A, at the potential switching between 1.3 V and 0 V, stable ECL emission was observed in 1× PBS containing 1 mM Ru(bpy)32+ and 10 mM FA using PAMAM/rGO/ITO, with a RSD of 0.44%, indicating the excellent stability of the ECL biosensor and potential for further application in ECL detection and imaging of FA.
 | ||
| Fig. 3 (A) ECL intensity vs. time curve of the PAMAM/rGO/ITO electrode in PBS containing 1 mM Ru(bpy)32+ and 10 mM FA. ECL curves (B) and corresponding calibration plot (C) of the PAMAM/rGO/ITO electrode at different concentrations of FA: 0 mM, 0.01 mM, 0.1 mM, 0.2 mM, 0.5 mM, 0.8 mM, 1 mM, 3 mM, 5 mM, 7 mM, 10 mM and 20 mM. D) ECL intensity at the rGO/PAMAM/ITO electrode in 10 mM PBS containing 10 mM FA or other interferents. Legend: (1) KNO3, (2) CaCl2, (3) MgCl2, (4) NaNO2, (5) Na2SO4, (6) H2O2, (7) MeOH, (8) glutaraldehyde, (9) ethanol, (10) acetone, (11) glutaraldehyde, (12) cyclohexanone (13) NaClO, (14) L-cysteine, (15) glycine, (16) glutathione, (17) DMSO, (18) TG, (19) FA. | ||
Additionally, sensitivity is an important indicator of FA sensing. To investigate the sensitivity of the biosensor to FA, ECL signals were recorded at various FA concentrations ranging from 0.01 mM to 20 mM. As shown in Fig. 3B, the ECL intensity increased with the increase of FA concentration. Meanwhile, Fig. 3C shows that the linear range of the FA biosensor is 0.01–3 mM. When the FA concentration exceeds 3 mM, the enhancement of ECL intensity slowed down. And when the FA concentration is greater than 10 mM, the change in ECL intensity tended to be flat. The detection limit of the method was calculated to be 0.002 mM, and the linear regression equation is I = 1524.7c(FA) + 562.9, indicating the potential applicability of this sensing approach in biological samples. Furthermore, the selectivity of the sensor was also investigated, and the ECL intensity of the PAMAM/rGO/ITO electrode was tested in the presence of a series of substances that may exist intracellularly and extracellularly, such as cations (K+, Ca2+, Mg2+), anions (NO3−, Cl−, SO42−), amino acids (glycine, glutathione), other ketone compounds (glutaraldehyde, acetone, cyclohexanone) and other reagents (reactive oxygen species, dimethyl sulfoxide, etc.). As shown in Fig. 3D, the impact of these interferences can be ignored, thus demonstrating the satisfactory specificity of the sensor. Also, this sensing interface was applied to the detection of FA in serum samples. After diluting the serum to 0.1% (v/v) with 1× PBS, different concentrations of FA were added, and the measured FA concentration was calculated using the linear regression equation. As shown in Table S1,† within the concentration range of 0.05–0.5 mM, the recovery rate of FA in diluted serum samples ranged from 94% to 101%, demonstrating the sensing ability of this interface in complex environments. In summary, the above results indicate that this sensing interface has the potential to be further applied in in situ imaging methods for monitoring single-cell release of FA.
ECL imaging of FA released from single HeLa cells
Due to the close correlation between the abnormal concentration of FA in the body and certain diseases, it is necessary to develop effective methods to achieve in situ monitoring of FA at the cellular scale to better study its function in pathology. Considering that the interface has successfully achieved the detection of FA in in vitro samples, it was further applied for in situ imaging and monitoring of FA release in single cells. It is reported that TG can activate the burst of natural FA in cells through the endoplasmic reticulum stress mechanism, and excessive formaldehyde in the cells can then diffuse to the outside.52 Therefore, TG was used as a stimulating drug to promote the production of FA in live cells; specifically, after incubating HeLa cells on the PAMAM/rGO/ITO electrode, 30 μM TG induced the production of intracellular FA and its extracellular release, leading to an increase in FA on the electrode surface enhancing the ECL intensity. As a result, ECL imaging was used to monitor the process of extracellular FA release. To avoid the interference of long-term electrical stimulation in living cells, a potential switching mode between 1.3 and 0 V was adopted to stimulate the production of ECL.53 As shown in Fig. 3A, this electrochemical excitation mode achieved stable ECL intensity. Thus, this experimental condition was applied to capture the bright field images (Fig. 4A) and ECL images (Fig. 4B) of cells in a PBS solution containing 1 mM Ru(bpy)32+. As shown in Fig. 4B, within 10 seconds of exposure time, the adhesion of cells on the electrode surface hindered the diffusion of luminescent molecules, resulting in a darker cell area in the ECL images. ECL images were recorded at the 2nd, 10th, 20th, and 30th min after TG stimulation (Fig. 4C1–F1). To further illustrate the difference in ECL images induced by extracellular FA release, the change in the brightness of the cellular areas in the ECL images (Fig. 4C2–F2) can be observed by subtracting the background luminescence (Fig. 4B) from the luminescence in Fig. 4C1–F1. Fig. 4C2–F2 indicate that with the prolongation of drug action time (2–30 minutes), the brightness of the cell region in the ECL image increased, implying that the FA released by cells after drug stimulation increased over time.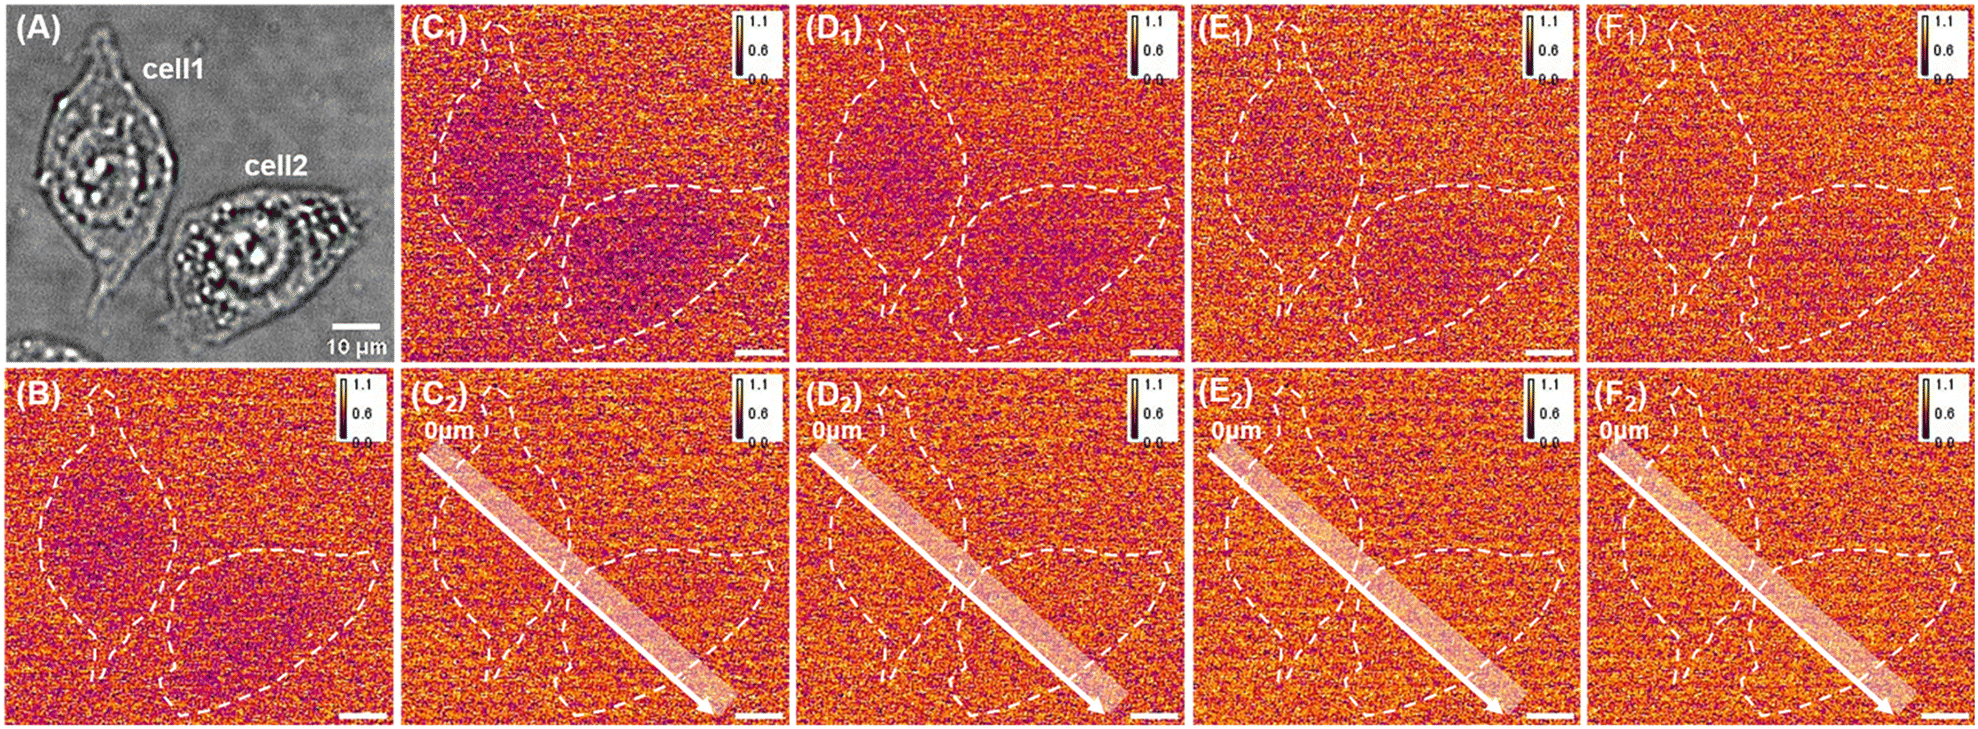 | ||
| Fig. 4 (A) BF image of HeLa cells on PAMAM–rGO/ITO. (B) ECL image of cells on PAMAM–rGO/ITO in 1 mM Ru(bpy)32+ before stimulation. (C1) ECL image of cells on PAMAM–rGO/ITO in 1 mM Ru(bpy)32+ at the second minute after the stimulation of 30 μM TG. (D1) ECL image of cells on PAMAM–rGO/ITO in 1 mM Ru(bpy)32+ at the 10th minute after the stimulation of 30 μM TG. (E1) ECL image of cells on PAMAM–rGO/ITO in 1 mM Ru(bpy)32+ at the 20th minute after the stimulation of 30 μM TG. (F1) ECL image of cells on PAMAM–rGO/ITO in 1 mM Ru(bpy)32+ at the 30th minute after the stimulation of 30 μM TG. (C2) Image of luminescence difference between images in C1 and B. (D2) Image of luminescence difference between images in D1 and B. (E2) Image of luminescence difference between images in E1 and B. (F2) Image of luminescence difference between images in F1 and B. | ||
To more intuitively compare the change in brightness over time between different single cells, Fig. 5A shows the distribution of relative gray values along the white line in Fig. 4C2–F2. In Fig. 5A, the regions of 10–40 μm and 40–75 μm correspond to the areas where cell 1 and cell 2 adhere to the electrode, respectively. From Fig. 5A, it can be seen that there was no significant difference in the relative gray values between the two cell regions at the 2nd and 10th min of drug stimulation. However, when the drug action time reached 20th min or longer, the increase in relative gray values in both cell regions indicates that the cells release FA. Moreover, comparing the cell 1 region (10–40 μm) and the cell 2 region (40–75 μm) after 20 minutes of drug action, the brightness of the cell 1 region was slightly higher than that of the cell 2 region, indicating that different cells have different responses to the same concentration of drug stimulation.
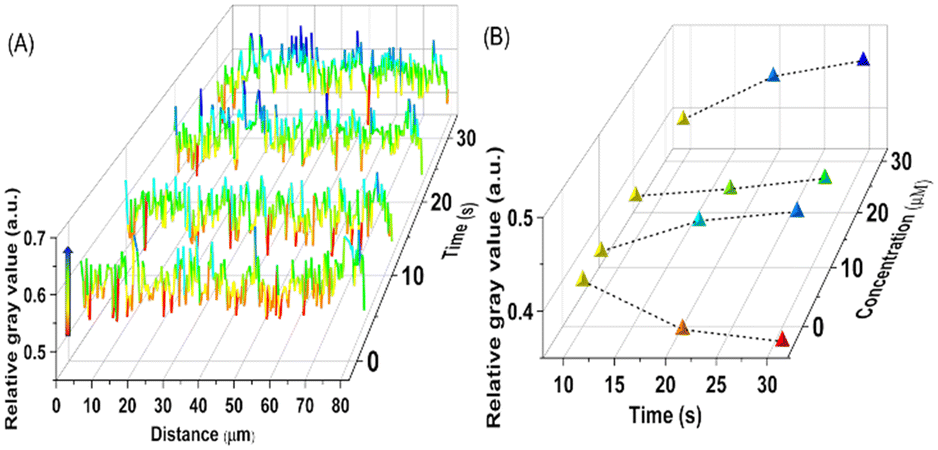 | ||
| Fig. 5 (A) The relative grayscale value across the white line in Fig. 4C2–F2. (B) The trend of the relative grayscale value of individual cells over time after stimulation with TG of different concentrations. | ||
Furthermore, to evaluate the stimulating effect of different concentrations of TG on individual cells, Fig. 5B shows the trend of relative gray values per unit area of a single cell area over 30 minutes of stimulation at different drug concentrations (5 μM, 15 μM and 30 μM). From Fig. 5B, it can be seen that the stimulation of cells with the three concentrations of TG led to an increasing trend in the gray value of individual cells over time, indicating that the outflow of FA increases with the duration of TG action. However, the release amount of FA within 30 minutes did not show a significant increasing trend with higher concentrations of TG. In order to further demonstrate the correlation between the increase in grayscale values of cell regions in Fig. 4C2–F2 and the release of extracellular FA, a control experiment was set up. Specifically, DMSO was used instead of TG to image non-stimulated cells, and the results are shown in Fig. S7.† Fig. S7† demonstrates that in the absence of TG stimulation, the gray values of the cell regions did not increase over time. The correlation between luminescence and FA release indicates that this sensing interface has successfully visualized the extracellular release of FA from individual cells, confirming the feasibility of using ECL imaging to monitor drug efficacy. At present, TG is widely used to induce the production of endoplasmic reticulum stress in live cells to study the pathogenesis of various metabolic diseases. However, a standard model for endoplasmic reticulum stress for different application targets has yet to be established. The above results indicate that the ECL imaging method is expected to become a potential tool for rapid screening of stimulus drug concentrations and action times, and also has great potential in drug molecule screening.
Conclusions
In summary, the ECL imaging method based on an in situ electrode reaction has achieved dynamic monitoring of FA release in single cells. Compared with fluorescence imaging methods for FA, the ECL FA imaging technique based on the PAMAM/rGO/ITO electrode avoids the challenge of phototoxicity generated by an external light source. Moreover, this ECL imaging method quickly captures and converts metabolites on the electrode surface, by avoiding the use of the classic toxic co-reactant TPrA, thus improving the biocompatibility of ECL imaging and achieving spatial distribution imaging of FA. In conclusion, this ECL imaging method expands the application of ECL in single-cell metabolic analysis, opening up new avenues for ECL to detect other metabolic molecules in situ and for drug screening.Data availability
The data supporting this article have been included as part of the ESI.†Author contributions
Juanhua Zhou: investigation, data curation, writing – original draft preparation. Yang Liu: conceptualization, methodology, data discussion, manuscript writing.Conflicts of interest
There are no conflicts to declare.Acknowledgements
This work was supported by the National Natural Science Foundation of China (No. 22174048).References
- A. S. Tibbetts and D. R. Appling, Annu. Rev. Nutr., 2010, 30, 57–81 CrossRef CAS PubMed.
- A. M. Geller and M. Y. Kotb, Anal. Biochem., 1989, 180, 120–125 CrossRef CAS PubMed.
- P. H. Yu and Y. Deng, Med. Hypotheses, 2000, 54, 726–728 CrossRef CAS PubMed.
- G. Liu, A. Shegiwal, Y. Zeng, Y. Wei, C. Boyer, D. Haddleton and L. Tao, ACS Macro Lett., 2018, 7, 1346–1352 CrossRef CAS PubMed.
- Z. Tong, C. Han, W. Luo, X. Wang, H. Li, H. Luo, J. Zhou, J. Qi and R. He, Age, 2013, 35, 583–596 CrossRef PubMed.
- J. C. Gonzalez-Rivera, M. W. Sherman, D. S. Wang, J. C. L. Chuvalo-Abraham, L. Hildebrandt Ruiz and L. M. Contreras, Sci. Rep., 2020, 10, 16545 CrossRef CAS PubMed.
- Y. Zhang, Y. Yang, X. He, P. Yang, T. Zong, P. Sun, R.-C. Sun, T. Yu and Z. Jiang, J. Cell. Mol. Med., 2021, 25, 5358–5371 CrossRef CAS PubMed.
- K. Tulpule and R. Dringen, J. Neurochem., 2013, 127, 7–21 CrossRef CAS PubMed.
- X. W. Wang, T. T. Li, J. Zhao, Q. L. Mao-Ying, H. Zhang, S. Hu, Q. Li, W. L. Mi, G. C. Wu, Y. Q. Zhang and Y. Q. Wang, Neuroscience, 2012, 217, 172–181 CrossRef CAS PubMed.
- Z. Tong, W. Luo, Y. Wang, F. Yang, Y. Han, H. Li, H. Luo, B. Duan, T. Xu, Q. Maoying, H. Tan, J. Wang, H. Zhao, F. Liu and Y. Wan, PLoS One, 2010, 5, e10234 CrossRef PubMed.
- T. Chen, C. Huang, Y. Wang and J. Wu, Chin. Chem. Lett., 2022, 33, 1180–1192 CrossRef CAS.
- X. Wei, M. Yang, Z. Jiang, J. Liu, X. Zhang, M. Chen and J. Wang, Chin. Chem. Lett., 2022, 33, 1373–1376 CrossRef CAS.
- H. d'A. Heck, E. L. White and M. Casanova-Schmitz, Biomed. Mass Spectrom., 1982, 9, 347–353 CrossRef CAS PubMed.
- T. Shimomura, T. Itoh, T. Sumiya, F. Mizukami and M. Ono, Sens. Actuators, B, 2008, 135, 268–275 CrossRef CAS.
- H. Seo, S. Jung and S. Jeon, Sens. Actuators, B, 2007, 126, 522–526 CrossRef CAS.
- C. Lou, G. Lei, X. Liu, J. Xie, Z. Li, W. Zheng, N. Goel, M. Kumar and J. Zhang, Coord. Chem. Rev., 2022, 452, 214280 CrossRef CAS.
- S. Singha, Y. W. Jun, J. Bae and K. H. Ahn, Anal. Chem., 2017, 89, 3724–3731 CrossRef CAS PubMed.
- T. F. Brewer, G. Burgos-Barragan, N. Wit, K. J. Patel and C. J. Chang, Chem. Sci., 2017, 8, 4073–4081 RSC.
- A. Roth, H. Li, C. Anorma and J. Chan, J. Am. Chem. Soc., 2015, 137, 10890–10893 CrossRef CAS PubMed.
- D. Sun, Z. Chen, J. Hu, H. Zeng, L. Qu and R. Yang, Chin. Chem. Lett., 2022, 33, 4478–4494 CrossRef CAS.
- J. Zhang, S. Arbault, N. Sojic and D. Jiang, Annu. Rev. Anal. Chem., 2019, 12, 275–295 CrossRef CAS PubMed.
- Y. Liu, Y. Yao, B. Yang, Y.-J. Liu and B. Liu, Chin. Chem. Lett., 2022, 33, 2705–2707 CrossRef CAS.
- X.-L. Tao, M.-C. Pan, X. Yang, R. Yuan and Y. Zhuo, Chin. Chem. Lett., 2022, 33, 4803–4807 CrossRef CAS.
- Y. Cao, Q. Bao, Y. Miao, W. Zhu and Y. Zhou, Innov. Mater., 2023, 1, 100034 CrossRef.
- C. Ma, X. Gou, Z. Xing, M.-X. Wang, W. Zhu, Q. Xu, D. Jiang and J.-J. Zhu, Research, 2023, 6, 0257 CrossRef CAS.
- C. Ma, Y. Cao, X. Gou and J.-J. Zhu, Anal. Chem., 2020, 92, 431–454 CrossRef CAS PubMed.
- J. Zhou, G. Ma, Y. Chen, D. Fang, D. Jiang and H.-Y. Chen, Anal. Chem., 2015, 87, 8138–8143 CrossRef CAS PubMed.
- G. Liu, C. Ma, B.-K. Jin, Z. Chen and J.-J. Zhu, Anal. Chem., 2018, 90, 4801–4806 CrossRef CAS PubMed.
- J. Zhang, R. Jin, Y. Chen, D. Fang and D. Jiang, Sens. Actuators, B, 2021, 329, 129208 CrossRef CAS.
- C. Cui, Y. Chen, D. Jiang, H.-Y. Chen, J. Zhang and J.-J. Zhu, Anal. Chem., 2019, 91, 1121–1125 CrossRef CAS PubMed.
- N. Wang, H. Ao, W. Xiao, W. Chen, G. Li, J. Wu and H. Ju, Biosens. Bioelectron., 2022, 201, 113959 CrossRef CAS PubMed.
- H. Wei and E. Wang, Luminescence, 2011, 26, 77–85 CrossRef CAS PubMed.
- H. Ding, W. Guo and B. Su, Angew. Chem., Int. Ed., 2020, 59, 449–456 CrossRef CAS PubMed.
- Y. J. Yan, P. Zhou, L. R. Ding, W. Hu, W. Chen and B. Su, Angew. Chem., Int. Ed., 2023, 62, e202314588 CrossRef CAS PubMed.
- M. M. Sprung, Chem. Rev., 1940, 26, 297–338 CrossRef CAS.
- Y.-Q. Ding, Y.-Z. Cui and T.-D. Li, J. Phys. Chem. A, 2015, 119, 4252–4260 CrossRef CAS PubMed.
- J. Li, Q. Yan, Y. Gao and H. Ju, Anal. Chem., 2006, 78, 2694–2699 CrossRef CAS PubMed.
- N. Taghavi Pourianazar, P. Mutlu and U. Gunduz, J. Nanopart. Res., 2014, 16, 2342 CrossRef.
- I. J. Majoros, A. Myc, T. Thomas, C. B. Mehta and J. R. Baker, Biomacromolecules, 2006, 7, 572–579 CrossRef CAS PubMed.
- R. Tarcan, O. Todor-Boer, I. Petrovai, C. Leordean, S. Astilean and I. Botiz, J. Mater. Chem. C, 2020, 8, 1198–1224 RSC.
- K. Erickson, R. Erni, Z. Lee, N. Alem, W. Gannett and A. Zettl, Adv. Mater., 2010, 22, 4467–4472 CrossRef CAS PubMed.
- J. Chen, B. Yao, C. Li and G. Shi, Carbon, 2013, 64, 225–229 CrossRef CAS.
- M. J. Fernández-Merino, L. Guardia, J. I. Paredes, S. Villar-Rodil, P. Solís-Fernández, A. Martínez-Alonso and J. M. D. Tascón, J. Phys. Chem. C, 2010, 114, 6426–6432 CrossRef.
- C. Zhu, S. Guo, Y. Fang and S. Dong, ACS Nano, 2010, 4, 2429–2437 CrossRef CAS PubMed.
- W. R. Collins, E. Schmois and T. M. Swager, Chem. Commun., 2011, 47, 8790–8792 RSC.
- J. C. Y. Chan, K. Burugapalli, H. Naik, J. L. Kelly and A. Pandit, Biomacromolecules, 2008, 9, 528–536 CrossRef CAS PubMed.
- P. Razmshoar, S. H. Bahrami, M. Rabiee, M. Hangouet, M. Martin, G. Raffin, A. Errachid and N. Jaffrezic-Renault, Appl. Surf. Sci., 2022, 579, 152221 CrossRef CAS.
- L. Hu, H. Li, S. Han and G. Xu, J. Electroanal. Chem., 2011, 656, 289–292 CrossRef CAS.
- R. C. Castro, D. S. M. Ribeiro, J. L. M. Santos, C. Nunes, S. Reis and R. N. M. J. Páscoa, Spectrochim. Acta, Part A, 2023, 287, 122118 CrossRef CAS PubMed.
- F. Rezaei and C. W. Jones, Ind. Eng. Chem. Res., 2013, 52, 12192–12201 CrossRef CAS.
- S. Sharifi, N. Reuel, N. Kallmyer, E. Sun, M. P. Landry and M. Mahmoudi, ACS Nano, 2023, 17, 4–11 CrossRef CAS PubMed.
- S. Kumaravel, S.-H. Wu, G.-Z. Chen, S.-T. Huang, C.-M. Lin, Y.-C. Lee and C.-H. Chen, Biosens. Bioelectron., 2021, 171, 112720 CrossRef CAS PubMed.
- X. Huang, B. Li, Y. Lu, Y. Liu, S. Wang, N. Sojic, D. Jiang and B. Liu, Angew. Chem., Int. Ed., 2023, 62, e202215078 CrossRef CAS PubMed.
Footnote |
| † Electronic supplementary information (ESI) available. See DOI: https://doi.org/10.1039/d4sd00177j |
| This journal is © The Royal Society of Chemistry 2024 |