 Open Access Article
Detection of TNP and sulfite ions in an aqueous medium using a pyrazinium-based chemosensor†
Pragya
a,
Krishnan
Rangan
 b and
Bharti
Khungar
 *a
*a
aDepartment of Chemistry, Birla Institute of Technology and Science Pilani, Pilani Campus, Pilani, Rajasthan 333031, India. E-mail: bkhungar@pilani.bits-pilani.ac.in
bDepartment of Chemistry, Birla Institute of Technology and Science Pilani, Hyderabad Campus, Secunderabad, Telangana 500078, India
First published on 18th April 2024
Abstract
A fluorescent pyrazinium-based 1-benzyl-3,5-diphenylpyrazin-1-ium bromide (BPPyz) chemosensor was synthesized and well-characterized. A significant reduction in blue emission of BPPyz was observed in the presence of TNP as compared to other nitroaromatic compounds, indicating high selectivity towards TNP. In the presence of sulfite ions, BPPyz showed fluorescence quenching and rapid naked-eye detection with a significant color change. The sensing mechanism was investigated through UV–visible studies, time-resolved fluorescence results, and density functional theory (DFT) calculations. The quenching constants (KSV) are 4.12 × 10⁵ M−1 for TNP and 3.8 × 10⁵ M−1 for sulfite with the detection limits of 9.5 nM and 46.17 nM for TNP and sulfite, respectively. The selectivity of BPPyz towards TNP was ascribed to the ground state charge transfer complex (GSC) formation and resonance energy transfer. Sulfite ion detection involved the formation of a GSC through hydrogen bonding with the pyrazinium proton.
1. Introduction
Detection of high-energy nitroexplosive is required due to environmental pollution and homeland security.1 Aromatic nitro compounds, such as 1,3,5-trinitroperhydro-1,3,5-triazine (RDX), 2,4-dinitrotoluene (2,4-DNT), and 2,4,6-trinitrotoluene (TNT), are commonly used as explosives.2 2,4,6-trinitrophenol acid (TNP) is more lethal than TNT due to its fast detonation velocity and low safety coefficient.3 It is extensively utilized in leather, dye, pharmaceutical,4 and fireworks industries and rocket fuel production.5 Because of its diverse uses, high water solubility, and low degradation, it can easily contaminate water and soil6 and is therefore recognized as an environmental pollutant.7 TNP carries health risks, including cancer, skin irritation, liver dysfunction, respiratory organ damage, nausea, and allergies.8,9 The allowed concentration of TNP in groundwater is 0.001 mg L−1 according to the WHO. To monitor environmental contamination and terrorist operations, selective and sensitive detection of TNP is needed.10Sulfite is used as an antioxidant, antibacterial, and enzyme inhibitor in food and beverages.11 Ingress of sulfite into the human body is through SO2, an environmental pollutant released by unrestricted combustion of fossil fuels and volcanic activity.12 In an aqueous solution at neutral pH, SO2 exists in equilibrium between sulfite ions (SO32−) and bisulfite ions (HSO3−). An abnormal level of exogenous sulfite in humans induces a free radical reaction, changing the oxidation and antioxidant levels and causing symptoms such as allergies, asthma, diarrhea, and hypotension.13 Abnormal endogenous sulfite has been linked to neurological diseases and lung cancer.14 The WHO considers a daily sulfite intake of less than 0.7 mg kg−1.15 Therefore, detecting sulfite with selectivity and sensitivity in the environment is essential.
Various instrumental techniques are employed to detect TNP, such as gas chromatography–mass spectrometry (GC-MS),16 high-performance liquid chromatography (HPLC),17 surface-enhanced Raman spectroscopy,18 and ion-mobility spectroscopy.19 A diverse range of molecules based on naphthalimide,20 pyrene,21 triazine,22 benzimidazole,23 rhodamine,24 and bisthiocarbonohydrazone25 are reported for the detection of TNP. The detection mechanism involves photo-induced electron transfer (PET),26 ground state charge transfer complex (GSC) formation,27 resonance energy transfer (RET),28 intramolecular charge transfer (ICT),29 the inner filter effect (IFE),30 and indicator displacement assay (IDA).31
The conventional methods to detect sulfite include the official Monier-Williams methods,32 titrimetry,33 electrochemical methods, chromatography,34 flow injection analysis, and capillary electrophoresis.35 Pyrazoline,36 BODIPY,37 coumarin,38 and fluorescein39-based molecules are designed to detect SO32−. The mechanism involved in sulfite ion detection includes hydrogen bond-inhibited C![[double bond, length as m-dash]](https://www.rsc.org/images/entities/char_e001.gif) N isomerization,40 hydrogen bonding recognition,41 deprotection of the levulinate group,42 the Michael addition reaction,43 and nucleophilic reaction.
N isomerization,40 hydrogen bonding recognition,41 deprotection of the levulinate group,42 the Michael addition reaction,43 and nucleophilic reaction.
Fluorescence-based detection has gained tremendous attention because of its high sensitivity, ease of use, and rapid execution time.44,45 Several fluorescent chemosensors reported in the literature for TNP and sulfite detection are associated with drawbacks such as lower water solubility, analyte interference, and low detection limits. Therefore, it is necessary to develop fluorescent chemosensors with multianalyte sensing, a low detection limit, and high water solubility for TNP and SO32−. Ion-tagged compounds are a fascinating class of organic materials because of their distinctive, tunable characteristics that result from possible combinations of cations and anions.46,47 Pyrazine derivatives exhibit excellent photostability and are often employed as luminescent materials.48 Moreover, quaternization of one of the N atoms of the pyrazine core can enhance the hydrophilicity of the molecules, thereby enabling the applications in an aqueous medium. In continuation to our work on pyrazinium-based chemosensors,49 herein we report the synthesis of another pyrazinium-based chemosensor, BPPyz, and its use as a fluorescence sensing probe for TNP and colorimetric and fluorimetric detection of sulfite ions at room temperature in an aqueous medium.
2. Experimental section
2.1 Materials and instruments
The reagents were utilized without additional purification after being purchased from commercial suppliers. Milli-Q water was used to prepare stock solutions for various experiments. 1H NMR (400 MHz) and 13C{1H} NMR (100 MHz) spectra were recorded using TMS as an internal standard and CDCl3 or DMSO-d6 as solvents. Parts per million (ppm) and hertz (Hz) are used to express chemical shifts (δ) and coupling constants (J), respectively. In the 1H NMR spectra, spin multiplicities are represented by the following abbreviations: s = singlet, d = doublet, t = triplet, and m = multiplet. An Agilent 6545 Q-TOF LC/MS spectrometer with an ESI source in both the positive and negative modes was used to analyze the mass spectra of the synthesized compounds. Melting points were measured in open glass capillaries using MPA120 automated melting point apparatus and were uncorrected. Absorption studies were conducted on a JASCO V-650 spectrophotometer using 10 mm path length quartz cuvettes in the wavelength range of 200–700 nm, and fluorescence measurements were performed on a Horiba Fluoromax-4 spectrofluorometer using 10 mm path length quartz cuvettes with a slit width of 3 nm. Fluorescence lifetime measurements were carried out using an Edinburgh FL920 fluorescence lifetime spectrometer. The sample was excited using a laser diode at 370 nm. All spectroscopic measurements were performed at room temperature. Data collection and reduction for single-crystal XRD were carried out utilizing CrysAlis PRO on a single-crystal Rigaku Oxford XtaLab Pro Kappa dual home/near diffractometer. The crystal was kept at 293(2) K during data collection using a CuKα (λ = 1.54184 Å) radiation source. Using Olex2,50 the structure was solved with the ShelXT51 structure solution program using Intrinsic Phasing and refined with the ShelXT52 refinement package using Least Squares minimization. The optimized structures and HOMO–LUMO states of the molecules were obtained by density functional theory (DFT)-based quantum chemical calculations at the level of B3LYP (Becke three-parameter exchange functional and Lee–Yang–Parr correlation functional)53 and standard 6-311G (d,p)54 in the Gaussian09 program suite.55 For the colorimetric read-out using a smartphone, a paper box with a black plastic board covering it on the outside was utilized. To provide even lighting, 3.0 W lamps were mounted on either side of the upper surface. The smartphone was placed five centimeters away from the sample holder containing an aqueous solution of BPPyz with various concentrations of SO32−. The smartphone built-in camera was used to take pictures with the best resolution available. To extract the RGB values from the photos, the colorgrab app was utilized.2.2 Synthesis of 2,6-diphenylpyrazine (PPyz)
A round-bottom flask was charged with 2,6-dichloropyrazine (0.671 mmol), phenylboronic acid (1.476 mmol), Pd(OAc)2 (0.033 mmol), and K2CO3 (1.342 mmol) in dimethylformamide (2.5 mL). The reaction mixture was irradiated in a microwave at 120 °C for 50 min. The reaction mixture was cooled to room temperature, quenched with water (5 mL), and diluted with EtOAc (15 mL). The layers were separated, and the aqueous layer was extracted three times with 10 mL of EtOAc. The organic layer was dried over Na2SO4, filtered, and concentrated under reduced pressure. The residue was purified by column chromatography on a silica gel using a 15–20% EtOAc/hexane mixture. PPyz was obtained as a white solid (137 mg, 86% yield); mp = 98–100 °C; δ1H NMR (400 MHz, CDCl3) δ 9.00 (s, 2H), 8.21–8.17 (m, 4H), 7.60–7.50 (m, 6H). 13C{1H} NMR (100 MHz, CDCl3) δ 151.6, 139.9, 136.5, 129.9, 129.0, 127.0; HRMS (ESI) m/z: [M + H]+ calcd for [C16H12N2 + H]+, 233.1002, found 233.1002.2.3 Synthesis of 1-benzyl-3,5-diphenyl pyrazin-1-ium bromide (BPPyz)
A mixture of PPyz (0.431 mmol) and benzyl bromide (0.517 mmol) was stirred in a round-bottom flask for 8 h at 75 °C. The reaction mixture was washed with ethyl acetate, and the bright yellow solid obtained was filtered and dried under vacuum (169 mg, 97.1% yield); mp = 201–210 °C; 1H NMR (400 MHz, DMSO-d6) δ 9.77 (s, 2H), 8.37–8.29 (m, 4H), 7.73 (dd, J = 8.0, 2.4 Hz, 2H), 7.68 (dd, J = 5.2, 2.0 Hz, 6H), 7.49–7.44 (m, 3H), 5.95 (s, 2H). 13C{1H} NMR (100 MHz, DMSO-d6) δ 153.1, 138.4, 134.4, 133.1, 131.2, 130.2, 130.1, 130.0, 129.6, 129.5, 65.2; HRMS (ESI) m/z: [M − Br]+ calcd for [C23H19N2]+, 323.1543; found 323.1536.2.4 Synthesis of the BPPyz–TNP complex
At room temperature, an ethanolic solution of TNP (0.247 mmol) was added dropwise to a solution of BPPyz (0.247 mmol) in ethanol. The reaction mixture was stirred for 5 h, and the obtained yellow precipitated solid was filtered and washed with ethyl acetate (130 mg, 95%); mp = 220–225 °C; 1H NMR (400 MHz, DMSO-d6) δ 9.75 (s, 2H), 8.56 (s, 2H), 8.32 (dd, J = 6.8, 2.8 Hz, 4H), 7.73–7.70 (m, 2H), 7.67 (dd, J = 5.2, 2.0 Hz, 5H), 7.46 (dd, J = 5.2, 1.8 Hz, 3H), 5.94 (s, 2H); HRMS (ESI) m/z: [M − Br]+ calcd for [C23H19N2]+, 323.1543; found 323.1536.2.5 Synthesis of the BPPyz–SO32− complex
An acetonitrile solution of BPPyz (0.247 mmol) was added dropwise to a solution of sodium sulfite (0.123 mmol) at room temperature. The reaction mixture was stirred for 5 min, and the yellow precipitated solid was filtered and washed with ethyl acetate, (125 mg, 70%); mp = 215–225 °C 1H NMR (400 MHz, DMSO-d6) δ 10.01 (s, 2H), 8.39 (dd, J = 6.6, 3.0 Hz, 4H), 7.86–7.82 (m, 2H), 7.68 (dd, J = 4.8, 1.6 Hz, 6H), 7.46 (dq, J = 3.7, 1.9 Hz, 2H), 6.05 (s, 2H). 13C{1H} NMR (100 MHz, DMSO-d6) δ 157.3, 133.7, 133.6, 132.9, 132.5, 130.1, 130.0, 129.7, 129.6, 128.1, 65.1; HRMS (ESI) m/z: [M − Br]+ calcd for [C23H19N2]+, 323.1543; found 323.1538.3. Results and discussion
3.1 Synthesis and characterization
BPPyz was synthesized by the Suzuki coupling reaction of 2,6-dichloropyrazine with phenylboronic acid to give 2,6-diphenylpyrazine (PPyz) (Fig. S1–S3†) followed by a solvent-free reaction between PPyz and benzyl bromide (Scheme 1). BPPyz was characterized using different spectroscopic techniques and single-crystal XRD. In the 1H NMR spectrum of BPPyz, a two-proton singlet at 5.65 ppm indicated the presence of benzylic protons, and aromatic protons appeared in the range of 7.09–8.26 ppm (Fig. S4†). In the 13C NMR spectrum of BPPyz, a signal at 65.1 ppm was due to the benzylic carbon, and the aromatic carbon signals appeared in the 128.1–157.4 ppm range (Fig. S5†). ESI mass spectral analysis showed an m/z peak at 323.1536, which may be attributed to [BPPyz–Br]− (Fig. S6†). The structure of BPPyz was further confirmed by single-crystal XRD analysis (CCDC number 2189176). The compound crystallized in the monoclinic P21/c space group. The ionic compound comprises an organic cation and a bromide anion; three pairs of these ions are found in the crystallographic asymmetric unit, Z′ = 3. The ORTEP diagram shown is only for one molecule in Fig. 1 (Fig. S7†).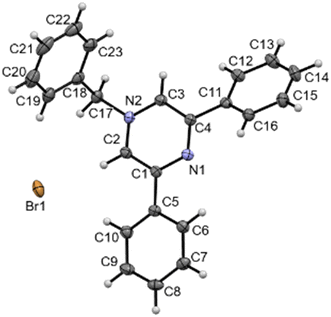 | ||
| Fig. 1 ORTEP diagram of BPPyz. CCDC 2189176. | ||
3.2 Response of BPPyz toward TNP
Nitroaromatic compounds (NACs) can interact with fluorescent probes through non-covalent and electrostatic interactions resulting in a change in the absorption and emission properties. BPPyz showed three absorption bands at λmax = 356 nm, 268 nm, and 236 nm in an aqueous medium. It also showed a strong emission (Φ = 0.35) maximum at 438 nm (λex = 359 nm) in the fluorescence spectra (Fig. S8†). The blue emission of BPPyz in an aqueous medium motivated us to explore its potential application as a fluorescent chemosensor (Fig. S9†). The UV–visible spectrum of BPPyz was examined by adding nitroaromatics 4-NT, 4-NP, NM, 4-NBA, NB, 3,4-DNT, and 2,4-DNP in 2 × 10⁻⁵ M concentration. No alteration was observed in the absorbance intensity with these NACs except for TNP, which showed an increase in the intensity with the appearance of a new band at 425 nm (Fig. S10†). The fluorescence intensity of BPPyz on the addition of 2,4-DNP, 4-NP, and TNP showed fluorescence quenching, whereas other NACs showed insignificant changes (Fig. 2). The quenching efficiencies of TNP, 2,4-DNP, and 4-NP were found to be 97.3%, 75%, and 40%, respectively (Fig. S11†).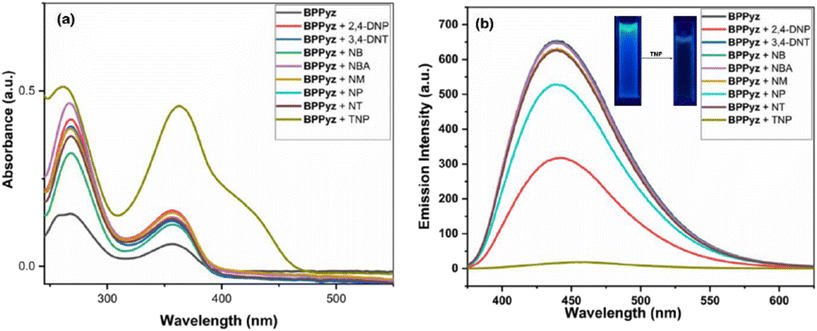 | ||
| Fig. 2 (a) Absorbance and (b) fluorescence spectra of BPPyz (2 × 10⁻⁵ M) with different nitroaromatic analytes. | ||
So far, the selectivity of BPPyz towards TNP was established among different nitro compounds. Further, interference studies were performed using competitive binding studies for TNP with BPPyz in the presence of equimolar concentrations (2 × 10⁻⁵ M) of other metal ions (Na+, Mg2+, Al3+, K+, Ca2+, Mn2+, Fe2+, Fe3+, Co2+, Ni2+, Cu2+, Zn2+, Ag+, Cd2+, Hg2+, Pb2+, La3+, Eu3+, Gd3+ and Yb3+), anions (CH3COO−, HCO3−, NO3−, I−, Br−, Cl−, and F−) and nitro compounds (4-NT, 4-NP, NM, 4-NBA, NB, 3,4-DNT, and 2,4-DNP) (Fig. S12†). No perturbation of fluorescence quenching was observed, which established the selectivity of BPPyz for TNP in the presence of several other analytes. The behavior of BPPyz towards TNP in different pH solutions was also investigated. On the addition of TNP, the maximum fluorescence quenching of BPPyz was found to be in the pH range of 6–8. This result indicated that BPPyz can be used efficiently as a fluorescent chemosensor for TNP detection under a neutral pH environment (Fig. S13†).
The general mechanisms of fluorescence quenching include static and/or dynamic quenching, Förster resonance energy transfer (FRET), photo-induced electron transfer (PET), and the inner filter effect (IFE). Absorbance and fluorescence titrations were performed to elucidate the mechanism of interactions between BPPyz and TNP. On the continuous addition of TNP, the absorption intensity of the band at 358 nm increased, and a new band at 425 nm appeared due to the formation of a ground state charge transfer complex. The intensity of the emission peak at 438 nm decreased with a gradual increase in the TNP concentration (Fig. 3). This is due to the formation of the picrate anion by the deprotonation of the phenolic –OH of TNP in an aqueous medium, followed by an anion exchange with Br−.56 Fluorescence titration studies were also performed for 2,4-DNP and 4-NP to investigate the quenching of BPPyz (Fig. S14 and S15†). The emission intensity at 438 nm decreased in the presence of 2,4-DNP and 4-NP, but to a lesser extent than TNP.
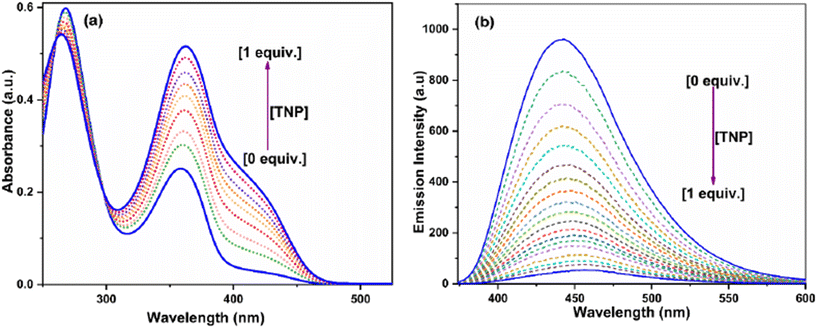 | ||
| Fig. 3 (a) Absorbance and (b) fluorescence spectra of BPPyz (2 × 10⁻⁵ M) with different amounts of TNP. | ||
The detection limit (DL) obtained from fluorescence titration studies at 438 nm was found to be 9.5 nM. The limit of detection (LOD) value was estimated by the IUPAC standard method, LOD = yblank + 3 × SDblank, where yblank is the average signal intensity at zero and SDblank is the standard deviation of the blank measurements (Fig. S16†).57,58
To examine the sensitivity of BPPyz toward TNP, the Stern–Volmer (S–V) constant (KSV) was calculated using the Stern–Volmer equation, I0/I = 1 + KSV[Q], where I0 represents the initial fluorescence intensity in the absence of the analyte, I denotes the intensity in the presence of the analyte, [Q] is the molar concentration of the analyte and KSV is the quenching constant. The quenching constant (KSV) for BPPyz was found to be 4.12 × 10⁵ M−1, confirming the high sensitivity of BPPyz toward TNP (Fig. S17†). The KSV values were also calculated for 2,4-DNP and 4-NP and were found to be 6.7 × 10³ M−1 and 2.3 × 10⁴ M−1, respectively (Fig. S18 and S19†). A Stern–Volmer plot may be linear or nonlinear depending on the static or dynamic quenching process. The linear S–V plot at the lower concentration indicated static quenching, which was attributed to the formation of the ground state charge transfer complex. This was confirmed by the appearance of a new band at 425 nm in the UV–visible spectra. The correlation coefficient (R2), obtained via regression analysis, was computed to be 0.998.
The deviation from linearity of the S–V plot at higher concentrations revealed the possibility of dynamic quenching. Dynamic quenching occurs as a result of collisional interactions or excited-state phenomena like Förster resonance energy transfer (FRET). Energy transfer through FRET is dependent on (i) a significant overlap between the absorbance and fluorescence spectra of the acceptor and donor, respectively, (ii) relative dipole orientations of the donor and acceptor, and (iii) the Förster distance between the donor and acceptor.
To validate the dynamic quenching mechanism, UV–visible absorption spectra of TNP were plotted together with the emission spectrum of BPPyz, and an effective overlap was observed with TNP only. Therefore, resonance energy can easily be transferred from the excited donor fluorophore (BPPyz) to the electron-deficient acceptor (TNP).59 To identify the extent of energy transfer, the overlap integral value (Jλ) for TNP was calculated and found to be 5.74 × 10¹⁴ M−1 cm−1 nm−4. The Förster distance, R0 for the BPPyz–TNP interaction, was 38.10 Å, which falls in the range for RET (Fig. S20†). The spectral overlap of the absorption spectra of the absorber with the emission/excitation spectra of the fluorophore also indicates the possibility of an inner filter effect. The species in the IFE process should not chemically interact with each other, i.e., no new absorption band of the ground state charge transfer complex should be observed. Further, the quencher should not change the fluorescence lifetime of the fluorophore. In the current study, a new absorption band at 425 nm was observed due to the ground state charge transfer complex formation. Furthermore, fluorescence lifetime decay profiles also showed a decrease in the lifetime of the BPPyz–TNP complex (0.5 ns) compared to BPPyz (3.50 ns). Moreover, it was observed that the reduction in the fluorescence lifetime and intensity followed the relation τ0/τ = I0/I, which is a crucial feature of collisional or dynamic quenching (Fig. S21†).
Further, to exclude the possibility of the IFE, corrections were performed using eqn (1):
| Icorr/Iobs = 10(Aex+Aem)/2 | (1) |
The emission of BPPyz was recorded in the presence of triflic acid (TFA) (pKa ∼ 0.52), a stronger acid than TNP (pKa ∼ 0.38), to investigate the acidity effect of TNP on fluorescence quenching. No change in the fluorescence emission suggested that the acidity effect was not involved in the fluorescence quenching mechanism (Fig. S23†).
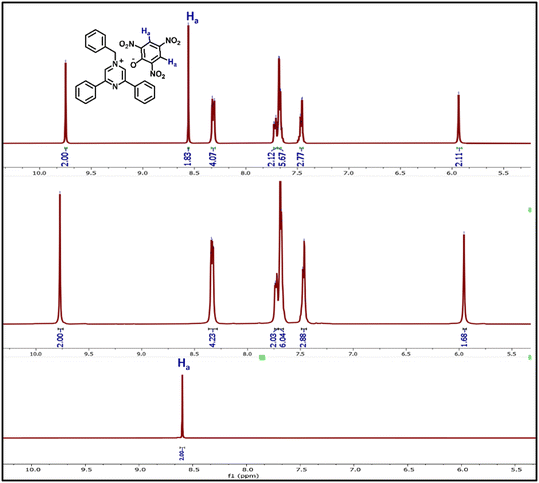
The nature of the attenuation of the fluorescence emission of BPPyz by TNP was inspected by 1H NMR, HRMS, and theoretical studies. The stoichiometric ratio was confirmed by the spectroscopic analysis of the yellow complex isolated from the ethanolic solution of BPPyz and TNP at room temperature. Comparing the 1H NMR spectra of BPPyz and the BPPyz–TNP complex suggested the complexation of the picrate ion with the BPPyz cation (Fig. 4). In the 1H NMR spectrum of the BPPyz–picrate complex, a new prominent signal at 8.58 ppm due to picrate protons and their relative integration confirmed the formation of a 1![[thin space (1/6-em)]](https://www.rsc.org/images/entities/char_2009.gif) :
:![[thin space (1/6-em)]](https://www.rsc.org/images/entities/char_2009.gif) 1 molar complex between BPPyz and TNP (Fig. S24†).
1 molar complex between BPPyz and TNP (Fig. S24†).
The HRMS analysis of BPPyz–TNP demonstrated m/z peaks attributed to the anionic [TNP–H]− and cationic [BPPyz–Br]+ species at 227.9525 and 323.1536, respectively (Fig. S25†). The crystal of BPPyz–TNP grown from an acetonitrile–methanol solvent mixture crystallized in the monoclinic system (C2/c space group). One BPPyz+ cation and one deprotonated picrate anion are found in the crystallographic asymmetric unit, Z′ = 1. The ORTEP diagram of the BPPyz–TNP crystal is shown in Fig. 5. The BPPyz–TNP complex is stabilized through short C–H⋯O non-covalent interactions. The pyrazine ring C3–H3⋯O1, methylene C17–H17A⋯O1, and phenyl ring C3–H3⋯O1 non-covalent bond distances are 2.391, 2.471, and 2.533 Å, respectively; these bond distances are shorter than the hydrogen–oxygen van der Waals radius, 2.72 Å.
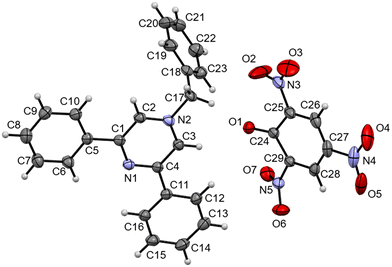 | ||
| Fig. 5 ORTEP diagram of BPPyz–TNP (CCDC 2189177). | ||
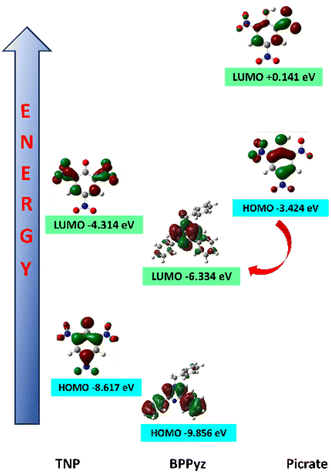
To study the interaction between BPPyz and TNP, DFT calculations were performed at the level of B3LYP/ 6-311G(d,p) in the gas phase. The energies of the highest occupied molecular orbital (HOMO) and the lowest occupied molecular orbital (LUMO) of BPPyz were −9.856 eV and −6.334 eV, respectively. The energies of the HOMO and LUMO of the picrate anion were found to be −3.424 eV and +0.1417 eV, respectively (Fig. 6). Hence, theoretical results direct the possibility of a ground state electronic charge transfer from the HOMO of the picrate anion to the LUMO of BPPyz, which results in high quenching efficiency. However, the HOMOs of other nitroaromatics were found to have lower energy levels than the LUMO of BPPyz, thereby discarding the possibility of electronic charge transfer and leading to low quenching efficiencies (Fig. S26†).
3.3 Response of BPPyz toward SO32−
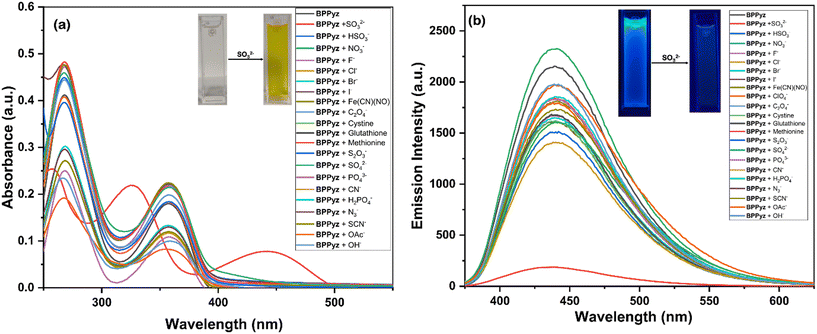
The anion sensing ability of the probe BPPyz was elucidated by the changes in the UV–visible and fluorescence spectra upon the addition of various anions, SO32−, HSO3−, NO3−, F−, Cl−, Br−, I−, ClO4−, [Fe(CN)5(NO)]2−, C2O42−, cystine, glutathione, methionine, S2O32−, SO42−, PO42−, CN−, SCN−, N3−, OH−, H2PO4−, and OAc− (2 × 10⁻⁵ M) in aqueous media. Among these anions, BPPyz was interestingly selective to SO32− with a visual change in the color of the solution from colorless to yellow. On the addition of SO32− ions, the UV–visible absorption bands of BPPyz at 268 nm and 358 nm showed a hypsochromic shift to 255 nm and 322 nm, respectively, with a simultaneous emergence of a new band at 439 nm. The BPPyz solution emitted dark brownish fluorescence in the presence of the SO32− anion under a 365 nm UV lamp. To ascertain the selectivity of the probe, emission spectra of BPPyz were recorded in the presence of various anions at 2 × 10⁻⁵ M concentration, and no alteration was observed in the emission behavior of BPPyz. The addition of SO32− resulted in 94.3% quenching of the emission intensity at 438 nm. A ground state charge transfer complex might have formed due to the exchange of Br− with SO32− (Fig. 7).To further confirm the formation of the ground state charge transfer complex, UV–vis titration studies of BPPyz were performed with the increasing concentration of SO32−. A well-defined isosbestic point at 385 nm suggested the formation of a new compound upon treatment of the probe with sulfite ions. To better understand the sensing ability of BPPyz for the SO32− anion, a fluorescence titration experiment of BPPyz was carried out with the gradual addition of SO32−. The fluorescence intensity of BPPyz decreased gradually with the increasing concentration of the SO32− anion (Fig. 8). The linear variation at low concentration was due to static quenching. The linear fit of the plot provided KSV = 3.8 × 10⁵ M−1 and a correlation coefficient (R2) of 0.9936 (Fig. S27†). The deviation from linearity indicated dynamic quenching, which was further supported by lifetime measurements. Fluorescence lifetime decay profiles showed a decrease in the lifetime of the BPPyz-SO32− complex (0.9 ns) as compared to BPPyz (3.50 ns) due to dynamic quenching (Fig. S21†). The Job plot suggested a 2![[thin space (1/6-em)]](https://www.rsc.org/images/entities/char_2009.gif) :
:![[thin space (1/6-em)]](https://www.rsc.org/images/entities/char_2009.gif) 1 stoichiometry between BPPyz and the SO32− anion (Fig. S28†).
1 stoichiometry between BPPyz and the SO32− anion (Fig. S28†).
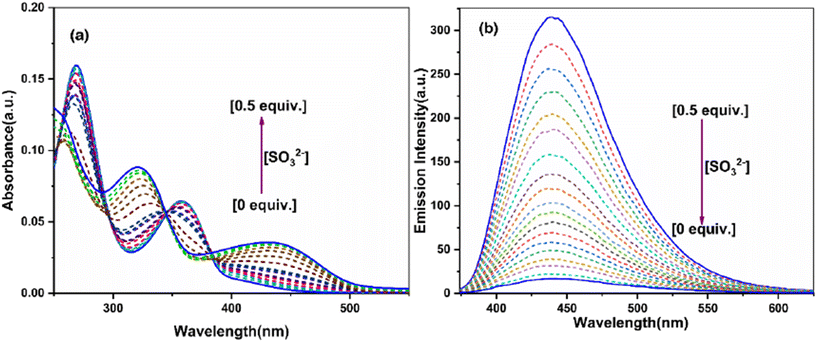 | ||
| Fig. 8 (a) Absorbance and (b) fluorescence spectra of BPPyz (2 × 10⁻⁵ M) with different amounts of SO32−. | ||
The selectivity of BPPyz for SO32− was evaluated by monitoring the fluorescence response of BPPyz toward SO32− in the presence of F−, Cl−, Br−, I−, NO3−, HCO3−, CH3COO−, S2O32−, SO42−, and PO42− (Fig. S29†). Fluorescence quenching was unaffected, indicating that BPPyz can selectively discriminate the SO32− anion in the presence of all other examined anions. The detection limit is also an important parameter that describes the sensing ability of sensors. The detection limit of BPPyz for the SO32− anion was found to be 46.17 nM (Fig. S30†). The maximum fluorescence quenching of BPPyz in the presence of SO32− was found in the pH range of 6–9, indicating its stability in a neutral pH environment (Fig. S13†).
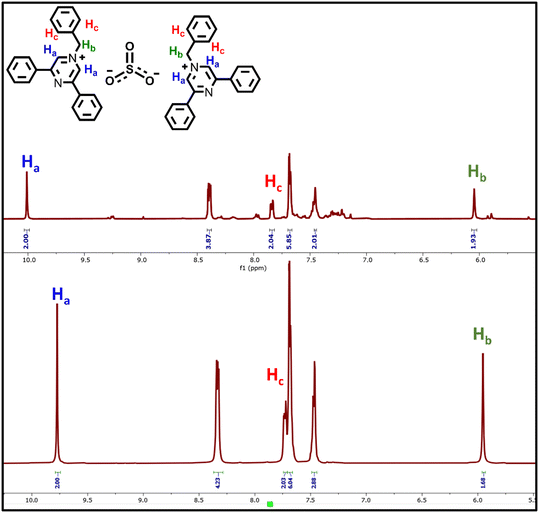
To further confirm the stoichiometric ratio of the complex, the dark yellow complex was isolated from an ethanolic solution of BPPyz and SO32− at room temperature and was analyzed by 1H and 13C NMR (Fig. S31 and 32†). In the HRMS spectrum of the BPPyz–SO32− complex, the m/z peak was observed at 323.1536 for [BPPyz–Br]+ (Fig. S33†). In the 1H NMR spectrum of the BPPyz–SO32− complex, the pyrazinium proton Ha shifted downfield from 9.77 ppm to 10.01 ppm. The prominent shift in the 1H NMR spectrum indicated the hydrogen bonding between the pyrazinium proton (Ha) of BPPyz and the O atom of SO32−. A downfield shift was also observed in the aliphatic proton (Hb) and aromatic proton (Hc) signals due to hydrogen bonding (Fig. 9).
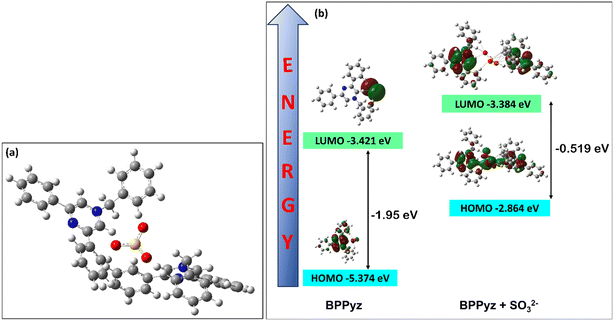
The DFT calculations were carried out at the B3LYP/6-311G(d,p) level of theory to understand the formation of the complex (Fig. 10a). The red-shifted absorption band in BPPyz–SO32− can be explained by the molecular orbitals. In the BPPyz–SO32−complex, the energy gap between the HOMO and the LUMO was −0.519 eV, which is much smaller than that in BPPyz (−1.95 eV). Such lowering of the HOMO–LUMO gap in the BPPyz–SO32− complex can be attributed to the change in the electron distribution due to anion exchange (Fig. 10b).
3.4 Smartphone-based colorimetric read-out
An affordable on-site monitoring method was developed based on the naked-eye detectable change of BPPyz in the presence of SO32− using a smartphone (Fig. S34†). The standard RGB scale is represented by whole number values from 0 to 255 for red, green, and blue colors. The values [0, 0, 0] and [255, 255, 255] correspond to absolute black and white, respectively. The change in the RGB values of BPPyz on the addition of SO32− was recorded by keeping the smartphone camera about 1 cm away from the vials enclosed inside a paper box. The changes were recorded using a smartphone app, which could directly output the RGB values (Fig. 11a). In order to compute the fitting parameters, several empirical formulae were used to assess the correlation of the RGB values processed from the smartphone (Fig. S35†). The optimal relationship was obtained when the ratio of R/(R + G + B) was used (Fig. 11b). By using this ratio, a calibration curve was obtained with good linearity from 0 μM to 20.0 μM (R2 = 0.9949). These results demonstrate that the developed smartphone-based colorimetric read-out method performs well and is more accessible, affordable, and portable than other chromatographic techniques.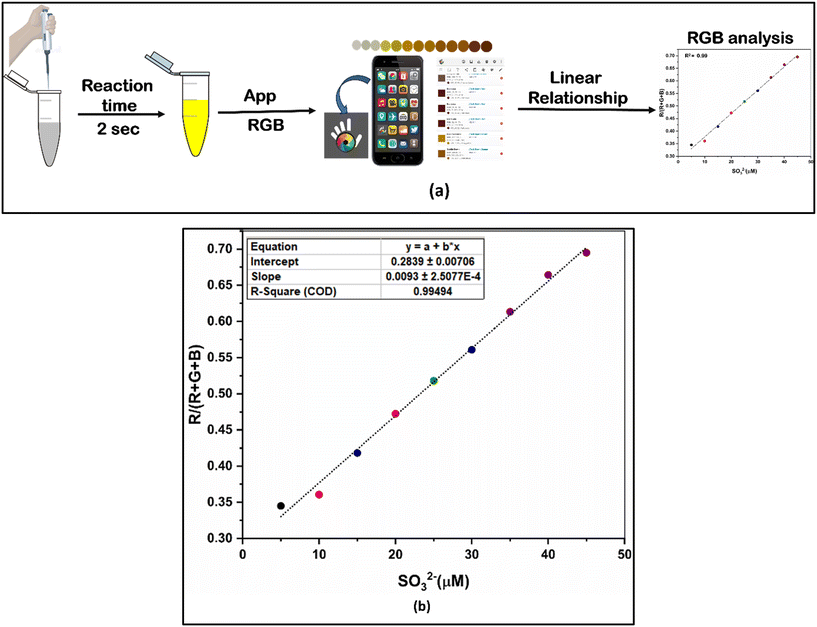 | ||
| Fig. 11 (a) Integration of the BPPyz chemosensor with a smartphone and (b) the ratio of R/(R + G + B) versus SO32− concentration in the range of 0 to 20.0 μM. | ||
3.5 Implementation of test paper strips
For rapid and on-site detection of TNP and sulfite, commercial Whatman filter paper was used to create paper test strips.60 The strips were dipped in a concentrated BPPyz solution for 10 minutes, and then allowed to dry for two hours. These test strips were dipped in aqueous solutions of TNP and sulfite solutions (10−3–10−6 M), and fluorescence quenching was seen under a 365 nm UV lamp (Fig. 12).Conclusion
In summary, a pyrazinium-based fluorescent chemosensor, BPPyz, was successfully synthesized, and its photophysical properties were studied in detail. In aqueous media, BPPyz showed high selectivity and high sensitivity for sensing TNP among nitro compounds by fluorescence quenching, which can be due to the formation of the ground state charge transfer complex and resonance energy transfer. Among anions, BPPyz exhibits good sensing ability towards SO32− by colorimetric and fluorometric responses attributed to hydrogen bond interactions between the pyrazinium of BPPyz and SO32−. Moreover, BPPyz was integrated with a smartphone for sulfite detection. The developed strategy is portable and accessible for in situ sulfite analysis and does not require advanced instruments.Author contributions
Pragya: conceptualization, methodology, data curation, validation, and writing the original draft. Krishnan Rangan: data curation, writing, and reviewing the draft. Bharti Khungar: conceptualization, supervision, writing, and reviewing and editing.Conflicts of interest
There are no conflicts of interest to declare.Acknowledgements
The authors acknowledge financial support from the Science & Engineering Research Board (SPG/2021/004711), DST-FIST [SR/FST/CSI-270/2015], UGC-SAP, and BITS Pilani for instrumentation facilities. Pragya thanks BITS Pilani for the fellowship.References
- P. Vadivel, K. Dayanidhi and N. Sheik Eusuff, Sens. Diagn., 2023, 2, 1311–1321 RSC.
- A. S. Tanwar, N. Meher, L. R. Adil and P. K. Iyer, Analyst, 2020, 145, 4753–4767 RSC.
- Y. Liu, Y. Wang, L. Chen and G. Che, Dyes Pigm., 2022, 203, 110378 CrossRef CAS.
- S. Chakravarty, B. Gogoi and N. Sen Sarma, J. Lumin., 2015, 165, 6–14 CrossRef CAS.
- S. Kasthuri, P. Gawas, S. Maji, N. Veeraiah and N. Venkatramaiah, ACS Omega, 2019, 4, 6218–6228 CrossRef CAS PubMed.
- D. Prabha, D. Singh, P. Kumar and R. Gupta, Inorg. Chem., 2021, 60, 17889–17899 CrossRef CAS PubMed.
- G. Singh, V. Saini, G. Lal, A. Saraiya and N. Singh, Mater. Sci. Eng., B, 2021, 264, 114970 CrossRef CAS.
- V. Bhalla, A. Gupta, M. Kumar, D. S. Rao and S. K. Prasad, ACS Appl. Mater. Interfaces, 2013, 5, 672–679 CrossRef CAS PubMed.
- H. Muniyasamy, C. Chinnadurai, M. Nelson, A. Veeramanoharan, M. Sepperumal and S. Ayyanar, Ind. Eng. Chem. Res., 2021, 60, 7987–7997 CrossRef CAS.
- S. K. Nandi, S. Roy Chowdhury, D. Podder, P. K. Ghorai and D. Haldar, Cryst. Growth Des., 2020, 20, 1884–1890 CrossRef CAS.
- R. Franco, G. Navarro and E. Martinez-Pinilla, Antioxidants, 2019, 8(11), 542 CrossRef CAS PubMed.
- T. Uchacz, G. Jajko, A. Danel, P. Szlachcic and S. Zapotoczny, New J. Chem., 2019, 43, 874–883 RSC.
- H. Yin, Y. Wu, X. Peng and F. Song, Chem. Commun., 2020, 56, 10549–10551 RSC.
- H. Zhang, S. Xue and G. Feng, Sens. Actuators, B, 2016, 231, 752–758 CrossRef CAS.
- S. Liu, L. Song, Q. Sun, Z. Chen, Y. Ge, W. Zhang and J. Qian, RSC Adv., 2015, 5, 91863–91868 RSC.
- B. Dawidziuk, J. Nawała, D. Dziedzic, D. Gordon and S. Popiel, Anal. Methods, 2018, 10, 5188–5196 RSC.
- M. Liu, W. Zheng, Y. Yang, G. Shi, Y. Li, S. Zhou, Y. Zhao and Z. Yao, Microchem. J., 2023, 191, 108889 CrossRef CAS.
- L. R. Terry, S. Sanders, R. H. Potoff, J. W. Kruel, M. Jain and H. Guo, Anal. Sci. Adv., 2022, 3, 113–145 CrossRef CAS.
- A. S. Tanwar, S. Patidar, S. Ahirwar, S. Dehingia and P. K. Iyer, Analyst, 2019, 144, 669–676 RSC.
- A. Kumar and P. S. Chae, Sens. Actuators, B, 2017, 240, 1–9 CrossRef CAS.
- A. Kumar, A. Pandith and H.-S. Kim, Sens. Actuators, B, 2016, 231, 293–301 CrossRef CAS.
- G. Sathiyan and P. Sakthivel, RSC Adv., 2016, 6, 106705–106715 RSC.
- J. F. Xiong, J. X. Li, G. Z. Mo, J. P. Huo, J. Y. Liu, X. Y. Chen and Z. Y. Wang, J. Org. Chem., 2014, 79, 11619–11630 CrossRef CAS PubMed.
- K. Charan Behera, D. Mallick, B. Narayan Patra and B. Bag, Spectrochim. Acta, Part A, 2022, 271, 120934 CrossRef CAS PubMed.
- K. Maiti, A. K. Mahapatra, A. Gangopadhyay, R. Maji, S. Mondal, S. S. Ali, S. Das, R. Sarkar, P. Datta and D. Mandal, ACS Omega, 2017, 2, 1583–1593 CrossRef CAS PubMed.
- A. Hazra, S. Bej, A. Mondal, N. C. Murmu and P. Banerjee, ACS Omega, 2020, 5, 15949–15961 CrossRef CAS PubMed.
- Q. Ilyas, M. T. Waseem, H. M. Junaid, Z. Ali Khan, F. Munir, A. J. Shaikh and S. A. Shahzad, Spectrochim. Acta, Part A, 2022, 272, 120994 CrossRef CAS PubMed.
- N. Jiang, G. Li, W. Che, D. Zhu, Z. Su and M. R. Bryce, J. Mater. Chem. C, 2018, 6, 11287–11291 RSC.
- S. Halder, P. Ghosh, A. Hazra, P. Banerjee and P. Roy, New J. Chem., 2018, 42, 8408–8414 RSC.
- S. Chen, Y. L. Yu and J. H. Wang, Anal. Chim. Acta, 2018, 999, 13–26 CrossRef CAS PubMed.
- I. A. Rather and R. Ali, Org. Biomol. Chem., 2021, 19, 5926–5981 RSC.
- A. M. Pisoschi, A. Pop, I. Gajaila, F. Iordache, R. Dobre, I. Cazimir and A. I. Serban, Microchem. J., 2020, 155, 104681 CrossRef CAS.
- A. M. Pisoschi and A. Pop, Open Chem., 2018, 16, 1248–1256 CrossRef CAS.
- U. T. Yilmaz and G. Somer, Anal. Chim. Acta, 2007, 603, 30–35 CrossRef CAS PubMed.
- L.-J. Zhang, Z.-Y. Wang, X.-J. Cao, J.-T. Liu and B.-X. Zhao, Sens. Actuators, B, 2016, 236, 741–748 CrossRef CAS.
- L. Săcărescu, A.-L. Chibac-Scutaru, G. Roman, G. Săcărescu and M. Simionescu, Environ. Chem. Lett., 2022, 21, 561–596 CrossRef.
- D. Sirbu, L. Zeng, P. G. Waddell and A. C. Benniston, Org. Biomol. Chem., 2019, 17, 7360–7368 RSC.
- L. Tan, W. Lin, S. Zhu, L. Yuan and K. Zheng, Org. Biomol. Chem., 2014, 12, 4637–4643 RSC.
- X. Ma, C. Liu, Q. Shan, G. Wei, D. Wei and Y. Du, Sens. Actuators, B, 2013, 188, 1196–120040 CrossRef CAS.
- Y. Q. Sun, P. Wang, J. Liu, J. Zhang and W. Guo, Analyst, 2012, 137, 3430–3433 RSC.
- S. Paul, T. Majumdar and A. Mallick, Dalton Trans., 2021, 50, 1531–1549 RSC.
- T. Wei, F. Wang, Y. Chen, J. Qiang, Z. Zhang, T. Chen and X. Chen, Dyes Pigm., 2018, 159, 322–330 CrossRef CAS.
- P. Sowmya, S. Prakash and A. Joseph, RSC Adv., 2023, 13, 2552–2560 RSC.
- J. Wu, W. Liu, J. Ge, H. Zhang and P. Wang, Chem. Soc. Rev., 2011, 40, 3483–3495 RSC.
- M. E. Moragues, R. Martinez-Manez and F. Sancenon, Chem. Soc. Rev., 2011, 40, 2593–2643 RSC.
- Y. Hu, S. Long, H. Fu, Y. She, Z. Xu and J. Yoon, Chem. Soc. Rev., 2021, 50, 589–618 RSC.
- V. Saini, A. Gupta, K. Rangan and B. Khungar, Dyes Pigm., 2020, 180, 108447 CrossRef CAS.
- K. Prabakaran, R. Manivannan and Y. A. Son, Spectrochim. Acta, Part A, 2023, 285, 121874 CrossRef CAS PubMed.
- Pragya, V. Saini, K. Rangan and B. Khungar, New J. Chem., 2022, 46, 16907–16913 RSC.
- O. V. Dolomanov, L. J. Bourhis, R. J. Gildea, J. A. K. Howard and H. Puschmann, J. Appl. Crystallogr., 2009, 42, 339–341 CrossRef CAS.
- G. M. Sheldrick, Acta Crystallogr., Sect. A: Found. Adv., 2015, 71, 3–8 CrossRef PubMed.
- G. M. Sheldrick, Acta Crystallogr., Sect. C: Struct. Chem., 2015, 71, 3–8 Search PubMed.
- A. D. Becke, J. Chem. Phys., 1993, 98, 5648–5652 CrossRef CAS.
- C. Lee, W. Yang and R. G. Parr, Phys. Rev. B: Condens. Matter, 1988, 37, 785–789 CrossRef CAS PubMed.
- M. J. Frisch, G. W. Trucks, H. B. Schlegel, G. E. Scuseria, M. A. Robb, J. R. Cheeseman, G. Scalmani and V. Barone, et al., Gaussian 09, Revis. C.01., Gaussion, Inc., Wallingford, CT, 2009 Search PubMed.
- N. Tripathi, P. Singh and S. Kumar, New J. Chem., 2017, 41, 8739–8747 RSC.
- E. Vidal, C. E. Domini, D. C. Whitehead and C. D. Garcia, Sens. Diagn., 2022, 1, 496–503 RSC.
- A. Virgilio, A. B. S. Silva, A. R. A. Nogueira, J. A. Nóbrega and G. L. Donati, J. Anal. At. Spectrom., 2020, 35, 1614–1620 RSC.
- A. H. Malik, S. Hussain, A. Kalita and P. K. Iyer, ACS Appl. Mater. Interfaces, 2015, 7, 26968–26976 CrossRef CAS PubMed.
- E. Evans, E. F. Gabriel, W. K. Coltro and C. D. Garcia, Analyst, 2014, 139, 2127–2132 RSC.
Footnote |
| † Electronic supplementary information (ESI) available. CCDC 2189176 and 2189177. For ESI and crystallographic data in CIF or other electronic format see DOI: https://doi.org/10.1039/d3sd00345k |
| This journal is © The Royal Society of Chemistry 2024 |


