 Open Access Article
Self-assembled emissive probe for efficient sensing of Fe(III) and cysteine in a physiological medium: application in real water and food samples†
Sulekha Kumari
Pandit
 ,
Sanjana
Das
and
Gopal
Das
 *
*
Department of Chemistry, Indian Institute of Technology Guwahati, Assam 781039, India. E-mail: gdas@iitg.ac.in; Tel: +91 361 258 2313
First published on 30th January 2024
Abstract
This investigation involved the synthesis of a novel naphthalimide derivative containing amide functionality (PAD). The study aimed to examine the colorimetric and fluorescence responses of PAD towards different metal ions in an aqueous HEPES buffer solution. The receptor demonstrated a notable preference for Fe(III) when challenged with a significant excess of other ions that compete for binding, resulting in detectable changes in optical and fluorescence properties. The complex between PAD and Fe(III) exhibits notable efficacy in detecting L-cysteine (Cys) with high selectivity. In addition, fluorescence microscopic investigations have indicated that the PAD compound possesses the potential to serve as an imaging probe to detect the uptake of these ions into plant cells, along with the fabrication of portable test strips. Additionally, the demetallation process is involved in the sensing of cysteine. The selective sensing behaviour of PAD towards Fe(III) can be elucidated using the chelation-enhanced fluorescence (CHEF) process, which is further validated by theoretical calculations.
1. Introduction
The importance of metals is well known in various biological processes. These metals include calcium, magnesium, zinc, copper, manganese, and iron, which play significant roles and can be found in measurable quantities within the human body, ranging from 10−2 to 10−4 mol.1 Iron is a highly prevalent vital element among the aforementioned metals, playing a crucial role in supporting vital physiological functions.2–6 Iron has a crucial role in facilitating the transportation of oxygen through heme and serves as a cofactor in numerous enzymatic processes. It fulfils significant functions in various cellular-level biological processes, encompassing oxygen metabolism and electron-transfer mechanisms, as well as DNA and RNA synthesis.7,8 The predominant form of iron in its native state is Fe(III) (rust), which has limited solubility in aqueous solutions. The solubility of [Fe(H2O)6]3+ is approximately 10−18 mol dm−3 at a healthy pH of 7.4.9 Both iron deficiency and excess can result in bodily dysfunction, leading to the development of severe illnesses. Under certain conditions, iron shortage, also known as hypoferremia, can be equally or even more harmful than iron overload, known as hyperferremia.10 Therefore, the monitoring of iron content is of utmost importance through the utilization of uncomplicated procedures. In recent years, there has been extensive research conducted on fluorescent sensors to selectively detect iron. This is primarily due to their capacity to offer a straightforward, highly sensitive, selective, accurate, and cost-effective approach for real-time monitoring, even at extremely low levels of target metal ions. Notably, these sensors possess the added benefits of spatial and temporal resolution, eliminating the need for any prior sample preparation.11–13 The majority of these sensors that have been created rely on fluorescence quenching. This is due to the paramagnetic effect induced by the existence of unpaired d-electrons in Fe(III), which facilitates the dissipation of energy in the excited state through a non-radiative mechanism.14,15 Hence, the task of creating novel fluorescent Fe(III) indicators, particularly those that demonstrate specific Fe(III) amplified emission, remains a formidable undertaking.The aggregation induced phenomenon (AIE), which was first described by Tang and his colleagues in 2001,16 is of great interest in this regard because compounds that are active in AIE do not exhibit emission when dissolved, but when they aggregate, they exhibit strong emission. This is because the restriction of intramolecular rotation suppresses non-radiative deactivation.17 AIE receptors have garnered significant interest as innovative fluorescent sensors for the sensitive and selective detection of a range of metal ions such as Fe(III), Cu(II), Co(II), Al(III), K(I), Ca(II), Cr(III), Zn(II), Ga(III), As(III), Ag(I), Cd(II), and Ni(II).18–29 Therefore, this characteristic was utilized in the development of a sensor capable of functioning as a turn-on fluorescent sensor for Fe(III).
L-Cysteine is a thiol-containing amino acid that is considered semi-essential. It is involved in a variety of crucial processes, such as irreversible detoxification reactions and cellular functions, within living cells. Additionally, it is utilized as an approved food additive and finds extensive application in the food and pharmaceutical sectors.30 As previously mentioned, maintaining an optimal level of any analyte is crucial for the efficient functioning of the human body. Any disruption in this balance can result in various health conditions. For an imbalance in Cys, these include peripheral diseases, cardiovascular diseases, neurotoxicity effects, liver damage, hair depigmentation, impaired growth, and loss of muscle and fat.31–34 Therefore, it is imperative to rapidly identify and quantify any abnormalities. Investigations have shown the existence of probes designed for the detection of Cys in animals.35 However, only a limited number of probes have demonstrated the ability to selectively identify Cys and effectively differentiate it from GSH and other amino acids. At present, the quantitative detection of Fe(III) and Cys can be achieved through the utilization of diverse fluorophores (Tables S4 and S5†). Consequently, much attention is devoted to the development of a bifunctional sensor capable of detecting both Fe(III) ions and Cys.
Therefore, as an extension of our ongoing research aimed at the advancement of fluorescent sensors based on CHEF,36–41 we successfully synthesized a novel sensor known as PAD, which is based on a naphthalimide framework. It is notable that the sequential detection of Fe(III) and Cys can be achieved using a distinct off–on–off mechanism. The sensor exhibited an initial fluorescence amplification response specifically towards Fe(III) ions, demonstrating a high level of selectivity. This response was attributed to the CHEF mechanism. The PAD⊂Fe(III) ensemble was able to detect Cys sequentially by exploiting the fluorescence quenching behaviour, which arises from the strong affinity between Cys and Fe(III) through a demetallization process.
2. Results and discussion
2.1. Design aspects and structural analysis of free receptors
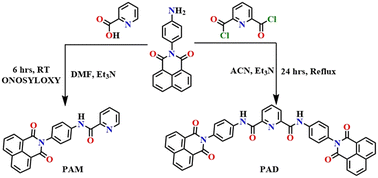
A chemosensor for cation recognition needs units that can interact selectively. This can be achieved by chemically modifying the functional arm. Additionally, a suitable complexation environment must be present to match the coordination number and sphere with an adequate number of donor atoms. Thus, two 2-(4-aminophenyl)-1H-benzo[de]isoquinoline-1,3-(2H)-dione-based receptors, PAD and PAM, having amide functionality, were quantitatively synthesized (Scheme 1).The receptors PAM and PAD were recrystallized to obtain the single crystal structures. However, on several attempts the crystal structure of PAM could only be obtained in a dimethyl sulfoxide![[thin space (1/6-em)]](https://www.rsc.org/images/entities/char_2009.gif) :
:![[thin space (1/6-em)]](https://www.rsc.org/images/entities/char_2009.gif) ethanol
ethanol![[thin space (1/6-em)]](https://www.rsc.org/images/entities/char_2009.gif) :
:![[thin space (1/6-em)]](https://www.rsc.org/images/entities/char_2009.gif) diethyl ether (1
diethyl ether (1![[thin space (1/6-em)]](https://www.rsc.org/images/entities/char_2009.gif) :
:![[thin space (1/6-em)]](https://www.rsc.org/images/entities/char_2009.gif) 1
1![[thin space (1/6-em)]](https://www.rsc.org/images/entities/char_2009.gif) :
:![[thin space (1/6-em)]](https://www.rsc.org/images/entities/char_2009.gif) 1) mixture, and no good quality crystals were obtained in the case of PAD. The goal is to explore the cation-binding properties of these receptors in the solution phase by manipulating the number of binding sites. Comparisons of their cation-binding efficiency have been made based on the differences in their spectroscopic properties in the solution phase. The PAD receptor has two arms with three binding sites in total, whereas PAM has one arm with just two binding sites. It has been shown in recent years that amino acids can be detected by metal-incorporated organic fluorophores.42 Demetallization would cause a significant alteration in the emission properties of the “metal complexes”. The thiol-facilitated fluorescence quenching of the PAD⊂Fe(III) complex can be used as a chemo-sensing “ensemble” system for Cys because of the higher affinity between Fe(III) and Cys.
1) mixture, and no good quality crystals were obtained in the case of PAD. The goal is to explore the cation-binding properties of these receptors in the solution phase by manipulating the number of binding sites. Comparisons of their cation-binding efficiency have been made based on the differences in their spectroscopic properties in the solution phase. The PAD receptor has two arms with three binding sites in total, whereas PAM has one arm with just two binding sites. It has been shown in recent years that amino acids can be detected by metal-incorporated organic fluorophores.42 Demetallization would cause a significant alteration in the emission properties of the “metal complexes”. The thiol-facilitated fluorescence quenching of the PAD⊂Fe(III) complex can be used as a chemo-sensing “ensemble” system for Cys because of the higher affinity between Fe(III) and Cys.
2.2. AIE studies of both the receptors/probes
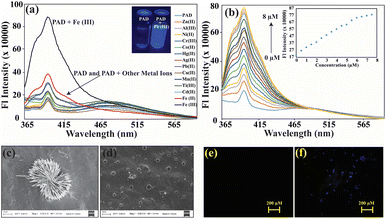
UV-vis spectra of the receptors at a concentration of 5 μM were recorded in pure acetonitrile (ACN) and water (H2O) to investigate their aggregative properties in an aqueous solvent. The absorbance maxima in the tail region decreased while the baseline increased for PAD, potentially due to Mie scattering (Fig. 1a).43 Similarly, an increase in the baseline was observed for PAM in water. However, PAM has a smaller aromatic core, and the π–π interaction was not as pronounced, and therefore, the aggregation was less significant (Fig. S9a†). Consequently, we conducted more thorough emission spectroscopy studies by gradually altering the water percentage. When dissolved in pure ACN, PAD emits weakly. As the water content is increased, it remains non-emissive up to 60%. However, when the water content is further increased, the emission intensity slowly increases, and it becomes highly emissive at 80% water content (as shown in Fig. 1b). On the other hand, PAM does not form aggregates due to a decrease in size of its aromatic core. Therefore, its fluorescence intensity remains almost identical in both organic and aqueous environments, with a slight increase in intensity at 20% water content (as shown in Fig. S9b†). PAD demonstrates aggregation induced emission properties because of restriction of the molecule's intramolecular rotational motions. As a result, there is a rise in fluorescence intensity due to aggregation. To confirm the formation of aggregates, FESEM studies were conducted in both ACN and H2O. The morphological evidence shows that when water is used as a solvent, spike-shaped clusters are formed, while the molecules remain dispersed in ACN. Additionally, an arc-shaped morphology is observed for PAD (Fig. 1c and d). As expected, the morphology of PAM did not change much. When water was used as a solvent, rod-shaped clusters arranged in the shape of a flower emerged, while the use of ACN led to network connections forming. However, both solvents resulted in similar aggregate formation, indicating that the solvent effect was not significantly different (Fig. S9c and d†). It is worth noting that the distinct aggregation properties are due to the variation in the aromatic core, which affects the spectral properties and molecular structures.2.3. Detection of Fe(III) by PAD
Due to the excellent self-assembly properties and the presence of cation binding sites, we investigated the compounds' spectroscopic properties in absorption and emission spectroscopy. In HEPES buffer (1 mM), UV-vis studies of both receptors were performed in the presence of different metal ions, including Ag(II), Zn(II), Al(III), Hg(II), Cu(II), Cr(III), Fe(II), Mn(II), Co(II), Cd(II), Pb(II), Al(III), and Fe(III). However, no selectivity for any particular cation was observed for either receptor (Fig. S10†). Therefore, we conducted fluorescence studies to explore the optical behaviour of the receptors against different biologically essential metal ions in the HEPES buffer. The emission spectra of the receptor (5 μM) were investigated in the HEPES buffer by adding 50 μM of various metal ions. Interestingly, PAD only produced a significant change in emission spectra with Fe(III) for a wide range of cations (Fig. 2a). This led us to conduct a detailed study of PAD against Fe(III). Upon adding 10 equivalents of the analyte, the emission intensity of the PAD receptor was significantly enhanced (5 fold), indicating a high level of selectivity towards Fe(III). The exceptional enhancement of the emission intensity of the PAD receptor at 398 nm towards Fe(III) suggests strong complexation/chelation of the PAD receptor with Fe(III). An investigation was also carried out to assess its capacity to detect ferric cations with different counter anions. The results were consistent, indicating a strong preference for ferric ions regardless of the accompanying anion (Fig. S18†). A more thorough examination was conducted by gradually increasing the concentration of Fe(III) ions, resulting in a consistent and proportional increase in intensity from 0 to 8 μM (Fig. 2b), where saturation was reached. To investigate further, a calibration graph was plotted between the Fe(III) concentration and emission intensity (Fig. 2b inset). The experiment showed a linear relationship between the concentration and emission intensity, indicating that it is possible to accurately estimate the concentration of Fe(III) ions. The calibration curve gave a limit of detection of 0.81 μM (Fig. S11a†), which is lower than the maximum permissible limit set by the US Environmental Protection Agency (EPA) for Fe(III) ions in drinking water, which is 5.3 μM.The Benesi–Hildebrand equation was used to calculate the binding constant of the receptor and Fe(III) ion through the linear regime (Fig. S11b†). The value obtained was 4.84 × 10⁶ M−1, indicating strong chelation and high sensitivity. A Job's plot was used to validate the binding stoichiometry by varying the mole fraction from 0 to 1 for PAD and Fe(III), which showed the formation of a 1![[thin space (1/6-em)]](https://www.rsc.org/images/entities/char_2009.gif) :
:![[thin space (1/6-em)]](https://www.rsc.org/images/entities/char_2009.gif) 1 complex (Fig. S11c†). This was further confirmed via mass spectrometry, which showed a 1
1 complex (Fig. S11c†). This was further confirmed via mass spectrometry, which showed a 1![[thin space (1/6-em)]](https://www.rsc.org/images/entities/char_2009.gif) :
:![[thin space (1/6-em)]](https://www.rsc.org/images/entities/char_2009.gif) 1 ratio for the mass peaks for the complex (Fig. S16†). Morphological changes before and after interaction with Fe(III) were examined using FESEM analysis and fluorescence microscopic studies. The spike-shaped cluster of PAD was broken down into independent sphere particles after complexation with Fe(III) (Fig. 2c and d). In fluorescence microscope analysis, the probe was initially almost non-fluorescent, but blue fluorescence emerged after chelation with Fe(III) (Fig. 2e and f).
1 ratio for the mass peaks for the complex (Fig. S16†). Morphological changes before and after interaction with Fe(III) were examined using FESEM analysis and fluorescence microscopic studies. The spike-shaped cluster of PAD was broken down into independent sphere particles after complexation with Fe(III) (Fig. 2c and d). In fluorescence microscope analysis, the probe was initially almost non-fluorescent, but blue fluorescence emerged after chelation with Fe(III) (Fig. 2e and f).
2.4. Interference studies
An interference experiment was conducted to examine the selectivity of the PAD receptor for Fe(III) in the presence of other cations. A solution of the PAD receptor of 5 μM was added to 50 equivalent cationic solutions, both with and without Fe(III), in the presence of different competitive cations. The emission spectra of these prepared solutions were recorded. The experiment showed that the PAD receptor remained unaffected even at higher concentrations (50 equiv.) of interferents (Fig. S12†). Aluminium (Al), chromium (Cr), and iron (Fe) are all trivalent elements that share similarities in their chemical properties. However, the results of the spectral analysis show that there is no similarity in their spectral signatures. They indicate that the PAD receptor has a high selectivity towards Fe(III), even in the presence of other cations. These findings confirm the efficiency of this receptor in differentiating and detecting Fe(III) ions.2.5. Plausible sensing mechanism
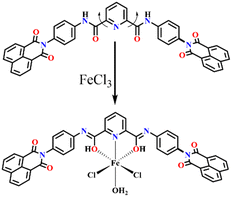
The mechanism by which the PAD receptor senses Fe(III) was investigated by studying the interaction between the receptor and the metal ion and the resulting binding characteristics. UV-vis and fluorescence spectra were recorded before and after adding Fe(III) to the PAD receptor. A slight hypochromic shift was observed in the UV-vis spectra, along with a broadening of the parent peak (Fig. S13a†). Similarly, the emission spectrum did not show any new peak as a result of the increase in the concentration of Fe(III) in the PAD receptor (Fig. 2a). Furthermore, fluorescence titration experiments were conducted, which showed a substantial increase in the fluorescence emission intensity at the same wavelength with a significant increase in the Fe(III) concentration, without any red or blue shift in the emission spectra. These spectral results indicate the non-covalent interaction between the PAD receptor and Fe(III). Based on these fluorescence titration experiments, it can be concluded that the PAD receptor has high selectivity and sensitivity for Fe(III). The strong affinity of the PAD receptor for Fe(III) can be attributed to two factors: appropriate donor atoms and proper orientation of the atoms, which lead to efficient interaction.The low fluorescence of free PAD may be due to free rotation. The entire sensing mechanism can be visualized as CHEF as Fe(III) binds to the receptor. Initially, the receptor moves freely along the C–N bond, dissipating most of its energy through non-radiative decay. On binding with Fe(III), the rotation is restricted through chelation, forming a rigid structure. The fluorescence intensity increases as it goes through the radiative pathway. An aliquot of the analysis mixture containing the ligand and metal ion in an excess ratio was analysed via HRMS to understand the in situ formed complex that results in fluorescence enhancement. A new peak, corresponding to the molecular formula [C43H25Cl2FeO6N5]+, was observed at m/z 833.0526 (Fig. S16†), which matches the theoretical value of the complex PAD⊂Fe(III). This suggests that one equivalent of the ligand (PAD) binds with one equivalent of Fe(III) ions through its amide oxygen and the nitrogen atoms of the pyridine groups. According to the hard–soft acid–base (HSAB) theory, soft acids have an affinity with soft bases and vice versa. Oxygen is a hard base, while Fe(III) is a hard acid, so there should be a significantly stronger interaction between the PAD receptor and Fe(III). The HRMS studies indicate that the formation of the complex is an important step in the fluorescence turn-on process. This follows the coordination mode obtained from the Job's plot showing 1![[thin space (1/6-em)]](https://www.rsc.org/images/entities/char_2009.gif) :
:![[thin space (1/6-em)]](https://www.rsc.org/images/entities/char_2009.gif) 1 binding from the fluorescence experiment.
1 binding from the fluorescence experiment.
To confirm the importance and involvement of coordination/chelation in the sensing of Fe(III), we conducted a study involving a control compound called PAM. PAM has a structure similar to PAD, but one of its arms has fewer coordination sites. When we performed fluorescence emission studies with PAM and added excess Fe(III) to a solution containing PAM, we found no significant change in the emission intensity. This suggests that the Fe(III) binding event does not occur without the chelating site. Based on these findings, we can conclude that PAD's chelation to Fe(III) restricts the molecule in a rigid geometry. This, in turn, triggers a switch on response in the fluorescence spectra via the CHEF mechanism (Scheme 2). This is further supported by fluorescence quantum yield calculation (Table S1†), using quinine sulphate as a reference. The quantum yield increased from 4.3% to 21.9% on addition of Fe(III). Lifetime measurements were conducted, however, there was minimal alteration in the lifetime before and after the introduction of Fe(III) ions, which changed from 0.09 ns to 0.13 ns (Fig. S17†).
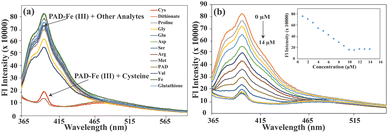
2.6. Cysteine detection by the PAD⊂Fe(III) ensemble
Cysteine (Cys) is an amino acid containing a thiol group essential for many biological activities. It has a strong ability to complex with metal ions, making it effective for detoxification. Therefore, scientists have investigated its potential activity towards metal ion coordination. The selectivity of PAD⊂Fe(III) was evaluated against various amino acids, including glycine (Gly), glutamic acid (Glu), aspartic acid (Asp), serine (Ser), arginine (Arg), methionine (Met), valine (Val), glutathione (GSH) and dithionate. The quenching response of PAD⊂Fe(III) towards the different analytes was estimated (Fig. 3a). It was observed that the emission intensity of PAD⊂Fe(III) remained unaffected after the addition of amino acids other than Cys. A quenching efficiency of 98% was achieved in the case of Cys (Fig. S14a†), which indicates a high selectivity. The presence of a thiol group in Cys helps in chelating with Fe(III), leading to its interaction with Fe(III).The PAD⊂Fe(III) complex sensing response was utilized to detect the presence of Cys, thanks to an exciting feature. When Cys was added to the PAD⊂Fe(III) complex solution (ranging from 0–14 μM), it caused a significant decrease in the emission intensity at 398 nm. However, the emission intensity of the PAD receptor was almost entirely restored after adding 14 μM of Cys. A calibration graph was plotted to demonstrate the linear response of PAD⊂Fe(III) with increasing concentrations of Cys (ranging from 0–14 μM) (Fig. 3b). The binding constant value for PAD⊂Fe(III) with Cys was calculated using the Benesi–Hildebrand equation and found to be 11.77 × 10⁶ M−1 (Fig. S14c†). The LOD was calculated from the calibration graph as 0.24 μM (Fig. S14b†), indicating that PAD⊂Fe(III) is highly sensitive to Cys.
2.7. Plausible sensing mechanism
The fluorescence emission intensity of the PAD⊂Fe(III) complex was restored to its original level upon addition of cysteine. The study involved titration with increasing concentrations of Cys, which revealed that the higher interaction ability of Cys with Fe(III) compared to the PAD receptor through demetallation was responsible for the observed reversibility in fluorescence emission intensity. The binding constant obtained for the PAD⊂Fe(III) complex is 4.84 × 10⁶ M−1, while that for the PAD⊂Fe(III)–Cys complex is 11.77 × 10⁶ M−1, almost 2.5 times higher. This suggests that the PAD⊂Fe(III)–Cys complex can quickly scavenge Fe(III) from the original complex and form a new complex. Similar observations have been made in previous studies.44 The formation of the new Cys–Fe(III) complex led to a decrease in fluorescence emission without any noticeable change in λmax, resulting in the same emission intensity as that of the receptor, and also a decrease in the quantum yield to 5.8% from 21.9%.2.8. Photostability and the effect of time
The study analysed the reaction of the PAD receptor and PAD⊂Fe(III) complex with Fe(III) and Cys at various time intervals (1 min), in terms of enhancement and quenching response. The results showed that the maximum enhancement and quenching efficiency were observed after 10 seconds, and there were no further changes detected over time, indicating that the receptor has high photostability and a quick response time to the analyte (Fig. S15†).2.9. DFT studies of the PAD receptor with Fe(III)
An examination was conducted to determine the responsiveness of the PAD receptor to Fe(III). It involved using density functional theory (DFT) calculations with the B3LYP/6-31G method basis set and Gaussian 09 program to assess the electronic characteristics of both the optimized receptor and the complex. The Job's plot and mass spectra indicated that PAD formed a 1![[thin space (1/6-em)]](https://www.rsc.org/images/entities/char_2009.gif) :
:![[thin space (1/6-em)]](https://www.rsc.org/images/entities/char_2009.gif) 1 complex with Fe(III). The optimized structure of the receptor and probable complexation are shown in Fig. 4a and b. To measure a receptor's sensing ability, it is important to assess its electronic properties, specifically the H–L energies and H–L band gap energy (in eV units). These properties are critical in explaining the receptor's sensitivity towards analytes. The study revealed that the potential PAD receptor's detection capability is improved when the highest occupied molecular orbital (HOMO) and the lowest unoccupied molecular orbital (LUMO) gap of the complex decreases (Fig. 4c and d). The HOMO–LUMO energy (eV) of the PAD receptor was calculated to be 2.04 eV. Upon complexation, the Fe(III) ion reduced the HOMO–LUMO gap of the receptor to 1.44 eV. A decrease in the energy gap suggests the formation of a favourable complex that is significantly more stable than the receptor.
1 complex with Fe(III). The optimized structure of the receptor and probable complexation are shown in Fig. 4a and b. To measure a receptor's sensing ability, it is important to assess its electronic properties, specifically the H–L energies and H–L band gap energy (in eV units). These properties are critical in explaining the receptor's sensitivity towards analytes. The study revealed that the potential PAD receptor's detection capability is improved when the highest occupied molecular orbital (HOMO) and the lowest unoccupied molecular orbital (LUMO) gap of the complex decreases (Fig. 4c and d). The HOMO–LUMO energy (eV) of the PAD receptor was calculated to be 2.04 eV. Upon complexation, the Fe(III) ion reduced the HOMO–LUMO gap of the receptor to 1.44 eV. A decrease in the energy gap suggests the formation of a favourable complex that is significantly more stable than the receptor.
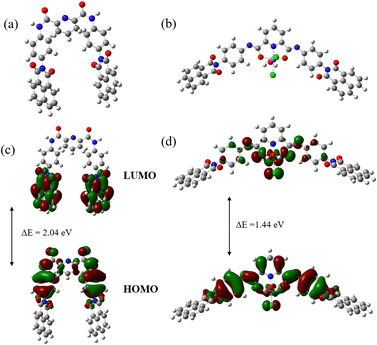 | ||
| Fig. 4 Optimized structure of (a) PAD and (b) the PAD–Fe(III) complex. DFT computed HOMO and LUMO of (c) PAD and (d) the PAD–Fe(III) complex. | ||
3. Practical application
3.1. Practical applications for PAD
In order to determine the feasibility of the receptor for real-world applications, it was tested in various water systems and food samples. To do this, a portable test kit was fabricated and used to measure the effectiveness of the receptor in detecting the Fe(III) analyte in different water samples such as drinking water, tap water, lake water, and river water. Solid impurities were removed from the water samples through filtration before spiking with a known concentration of Fe(III) analyte. Emission spectra were then recorded immediately. Assuming 100% detection in distilled water, the recovery percentage was calculated based on the spectral properties. The results showed that the probes were effective in natural water systems, with recovery percentages of 100%, 96%, 82%, and 94% for drinking water, tap water, lake water, and river water, respectively (Fig. 5a).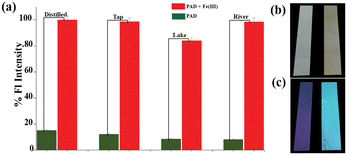 | ||
| Fig. 5 (a) Chart representing the effectiveness of the probe in different water samples when spiked with 5 μM of Fe(III); portable test kit (b) under visible light, and (c) under UV light (365 nm). | ||
To improve the application of the receptor, portable paper strips could be used as a more convenient and streamlined method for detecting Fe(III). The first step in this process involved applying PAD to Whatman filter paper (grade 1), which was then air-dried. The desiccated paper was then immersed in a solution containing Fe(III). When examined using a handheld UV 365 nm lamp, the paper displayed vivid blue fluorescence (Fig. 5c). On the other hand, the paper's colour changed slightly to yellow when observed under visible light (Fig. 5b). By capturing photographs using a smartphone application, distinct RGB values were obtained. Therefore, the use of portable paper strips in conjunction with RGB analysis through a smartphone sensing platform may provide a reliable means of visual and on-site detection.
3.2. Detection of Fe(III) in food samples through fluorescence imaging
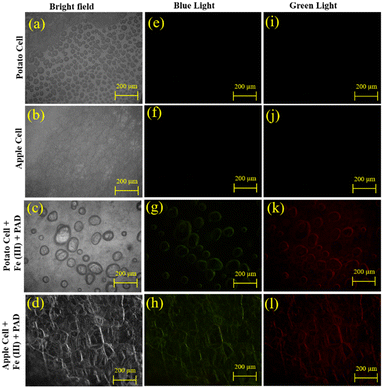
To test efficacy in cellular biology, chlorophyll-free foods like potatoes and apples were chosen as plant cell models to eliminate potential fluorescence interference. The plant cells were sectioned and treated dropwise with 100 μL (100 μM) of PAD solution. The treated slices were then left to soak for 15 minutes. Then, the soaked pieces were rinsed multiple times with deionized water. Subsequently, 100 μL (200 μM) of Fe(III) ion solution was added dropwise to the pieces. The electron eyepiece of the fluorescence microscope was configured to have a resolution of 2592 × 1944 pixels and a magnification factor of around 50 times.As anticipated, the plant cells did not exhibit any inherent fluorescence. Upon treatment with PAD and Fe(III), a fluorescence signal was observed in all three channels, indicating the ability for multi-channel detection (Fig. 6). This finding suggests promising prospects for applying cellular fluorescence imaging.
3.3. Practical applications for the PAD⊂Fe(III) ensemble
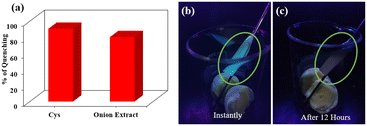
As described above, portable test kits were made with the help of Whatman filter paper. The ensemble that had bright blue fluorescence was used to detect bio-thiol vapor. Eggs are a good source of amino acid cysteine.45 It is well known that boiled egg releases H2S as an enzymatic reaction of cysteine, glutathione, and egg white at different temperatures.46 The paper strip was tied to a stainless-steel spatula and dipped inside a beaker containing boiled egg. Photographs were taken immediately, and then the sample was covered with aluminium foil, allowed to rest for 12 hours, and then photographed again under a UV 365 nm lamp (Fig. 7b and c). The bright blue fluorescence was no longer present, signifying the effectiveness in detecting bio-thiols in the vapor phase.Onion is a good source of sulphur, and the odour responsible for its pungent smell is due to cysteine sulfoxides.47 Hence, an onion extract was made by crushing it, extracting the juice by centrifugation, and diluting it with 2 mL of water. Then, 2 μL was added to the PAD⊂Fe(III) ensemble from the made solution, and fluorescence spectra were recorded. The solution could quench the fluorescence intensity to 80%, while the cysteine solution could quench 90% of the fluorescence intensity (Fig. 7a). This indicates that the receptor ensemble effectively senses the vapor and solution phases. For the onion extract used it was estimated that the strength of the total solution was 8 mM.
The reversibility and regeneration of the sensing probe are crucial considerations in practical applications. The reversible sensing behaviour of the PAD⊂Fe(III) ensemble was tested (Fig. S19†). The reversible fluorescence behaviour can be replicated by modulating the addition of Fe(III)/cysteine efficiently for up to 4 cycles exhibiting a reversible fluorescence response in an “off–on–off” manner.
4. Synthesis and characterisation
4.1. Synthesis of the PAM receptor
2-(4-Aminophenyl)-1H-benzo[de]isoquinoline-1,3-(2H)-dione (0.5 g, 2.52 mmol) was added to picolinic acid (0.545 g, 5.04 mmol) in DMF (100 mL), with an excess of triethyl amine, and the reaction mixture was stirred in the presence of 1 equivalent of ONOSYLOXY48 and reacted for 6 hours at room temperature. After the reaction was completed, the solvent was poured into ice cold water with continuous stirring. The precipitate obtained was collected by filtration. The crude product was then washed with ethanol and hexane, which gave a brown coloured precipitate (88%).1H NMR (600 MHz, DMSO-d6) δ 10.84 (s, 1H), 8.77 (d, 1H, 6 Hz), 8.52 (d, 4H, 12 Hz), 8.20 (d, 1H, 12 Hz), 8.10 (t, 1H, 12 Hz), 8.04 (d, 2H, 12 Hz), 7.91 (t, 2H, 12 Hz), 7.71 (t, 1H, 6 Hz), 7.38 (d, 2H, 8 Hz), 7.38 (d, 2H, 12 Hz) (Fig. S1†).
13C NMR (150 MHz, DMSO-d6) δ 164.11, 162.99, 150.12, 148.80, 138.42, 134.76, 131.76, 131.10, 129.62, 128.14, 127.55, 122.91, 122.80, 121.07 (Fig. S2†).
ESI-MS (positive mode, m/z): mass spectrum of receptor M, calculated for [C24H16N3O3]+ = 394.1186, found [M + H]+ = 394.1190 (Fig. S3†).
FT-IR (cm−1): 3334 (N–H), 1681 (C![[double bond, length as m-dash]](https://www.rsc.org/images/entities/char_e001.gif) O), 1522 (aromatic ring C
O), 1522 (aromatic ring C![[double bond, length as m-dash]](https://www.rsc.org/images/entities/char_e001.gif) C stretching), 1235 (C–N stretch) (Fig. S4†). Crystal structure obtained (Fig. S20, Tables S2 and S3†).
C stretching), 1235 (C–N stretch) (Fig. S4†). Crystal structure obtained (Fig. S20, Tables S2 and S3†).
4.2. Synthesis of the PAD receptor
2-(4-Aminophenyl)-1H-benzo[de]isoquinoline-1,3-(2H)-dione (258 mg, 1.03 mmol) was added to pyridine-2,6-dicarbonyl dichloride (100 mg, 0.49 mmol) in ACN (10 mL), with an excess of triethyl amine, and the reaction mixture was refluxed for 24 h. After the reaction was completed, the solvent was filtered. The crude product was washed with ACN, MeOH, and hexane, which gave a greyish coloured powder (82% yield).1H NMR (600 MHz, DMSO-d6) δ 11.22 (s, 2H), 8.55, 8.54, 8.54 (m, 8H, Hz), 8.49 (d, 2H, 6 Hz), 8.38 (t, 1H, 6 Hz), 8.08 (d, 4H, 6 Hz), 7.93 (t, 4H, 6 Hz), 7.49 (d, 4H, 6 Hz) (Fig. S5†).
13C NMR (150 MHz, DMSO-d6) δ 164.29, 162.32, 149.28, 138.28, 134.96, 132.53, 131.97, 131.29, 130.00, 127.76, 123.13, 122.06 (Fig. S6†).
ESI-MS (positive mode, m/z): mass spectrum of receptor D, calculated for [C43H26N5O6]+ = 708.1878, found [M + H]+ = 708.1879 (Fig. S7†).
FT-IR (cm−1): 3326 (N–H), 1661 (C![[double bond, length as m-dash]](https://www.rsc.org/images/entities/char_e001.gif) O), 1548 (aromatic ring C
O), 1548 (aromatic ring C![[double bond, length as m-dash]](https://www.rsc.org/images/entities/char_e001.gif) C stretching), 1236 (C–N stretch) (Fig. S8†).
C stretching), 1236 (C–N stretch) (Fig. S8†).
5. Conclusions
In summary, we have successfully synthesized a fluorophore receptor known as PAD that exhibits high selectivity towards Fe(III) ions and induces a fluorescence response characterized by a switch on effect in the spectra. We evaluated the recognition behaviour of PAD in the presence of several competing metal ions in an aqueous HEPES buffer solution. The determined detection limit for Fe(III) was 0.81 μM, a value far below the acceptable content of Fe(III) in drinking water according to established regulatory standards. Moreover, the assessment of the PAD⊂Fe(III) complex synthesized in situ demonstrated significant potential for identifying Cys in the presence of various amino acids. Therefore, the investigation additionally encompassed an examination of the efficacy of the PAD receptor to detect intracellular Fe(III) in plant cells by using fluorescence microscopy. Fe(III) ions and Cys were successfully identified in the samples obtained from real-life scenarios. Cys was quantified in onion extract, resulting in an estimated concentration of 8 mM. These findings showcase the practical efficacy of receptor-based analysis when applied to authentic samples.Author contributions
Sulekha Kumari Pandit: design, conception, data acquisition/analysis, writing original draft, validation, methodology, investigation, formal analysis, conceptualization. Sanjana Das: data acquisition and interpretation. Gopal Das: writing and reviewing, editing, supervision and funding acquisition.Conflicts of interest
There are no conflicts to declare.Acknowledgements
We thank and acknowledge DBT (BT/NER/143/SP4465/2023) and DST (SR/FST/CS-II/2017/23C), New Delhi, India, for their financial support. We also recognize the instrumental facilities provided by the Central Instrument Facility (CIF) and the Department of Chemistry at IIT Guwahati. SKP and SD acknowledge IIT Guwahati for fellowship. We thank Subarna Samanta for technical assistance in TRPL experiments.References
- W. E. Wacke and B. L. Vallee, J. Biol. Chem., 1959, 234, 3257–3262 CrossRef.
- B. Wang, J. Hai, Z. Liu, Q. Wang, Z. Yang and S. Sun, Angew. Chem., Int. Ed., 2010, 27, 4576–4579 CrossRef PubMed.
- O. Oter, K. Ertekin, C. Kirilmis, M. Koca and M. Ahmedzade, Sens. Actuators, B, 2007, 122, 450–456 CrossRef CAS.
- L. J. Fan and W. E. Jones, J. Am. Chem. Soc., 2006, 128, 6784–6785 CrossRef CAS PubMed.
- J. Mao, L. N. Wang, W. Dou, X. L. Tang, Y. Yan and W. S. Liu, Org. Lett., 2007, 9, 4567–4570 CrossRef CAS PubMed.
- C. R. Lohani and K. H. Lee, Sens. Actuators, B, 2010, 143, 649–654 CrossRef CAS.
- R. S. Eisenstein, Annu. Rev. Nutr., 2000, 20, 627–662 CrossRef CAS PubMed.
- P. Aisen and I. Listowsky, Annu. Rev. Biochem., 1980, 49, 357–393 CrossRef CAS PubMed.
- H. Boukhalfa and A. L. Crumbliss, BioMetals, 2002, 15, 325–339 CrossRef CAS PubMed.
- S. K. Sahoo, D. Sharma, R. K. Bera, G. Crisponi and J. F. Callan, Chem. Soc. Rev., 2012, 41, 7195–7227 RSC.
- M. A. Assiri, S. Hanif, H. M. Junaid, A. Hamad, H. Irshad, M. Yar, W. Rauf and S. A. Shahzad, J. Photochem. Photobiol., A, 2023, 438, 114514 CrossRef CAS.
- A. Battal, S. B. Kassa, N. A. Gultekin, M. Tavasli and Y. Onganer, J. Fluoresc., 2023, 33, 1–9 CrossRef PubMed.
- T. Verma, P. Verma and U. P. Singh, Microchem. J., 2023, 191, 108771 CrossRef CAS.
- D. P. Murale, S. T. Manjare, Y. S. Lee and D. G. Churchill, Chem. Commun., 2014, 50, 359–361 RSC.
- D. P. Murale, A. P. Singh, J. Lavoie, H. Liew, J. Cho, H. I. Lee, Y. H. Suh and D. G. Churchill, Sens. Actuators, B, 2013, 185, 755–761 CrossRef CAS.
- J. Luo, Z. Xie, J. W. Y. Lam, L. Cheng, B. Z. Tang, H. Chen, C. Qiu, H. S. Kwok, X. Zhan, Y. Liu and D. Zhu, Chem. Commun., 2001, 1740–1741 RSC.
- J. Wen, L. Dong, S. Hu, W. Li, S. Li and X. Wang, Chem. – Asian J., 2016, 11, 49–53 CrossRef CAS PubMed.
- O. Dalkilic, E. Bozkurt, F. Lafzi and H. Kilic, Org. Biomol. Chem., 2023, 21, 5406–5412 RSC.
- Y. Zhang, Y. Li, L. Sun, L. Lu, B. Zhu and J. Ma, Photochem. Photobiol. Sci., 2023, 22, 1–15 Search PubMed.
- A. Palta, G. Kumar and V. Luxami, J. Photochem. Photobiol., A, 2022, 433, 114198 CrossRef CAS.
- D. Lu, L. He, Y. Wang, M. Xiong, M. Hu, H. Liang, S. Huan, X.-B. Zhang and W. Tan, Talanta, 2017, 167, 550–556 CrossRef CAS PubMed.
- K. Morishima, F. Ishiwari, S. Matsumura, T. Fukushima and M. Shibayama, Macromolecules, 2017, 50, 5940–5945 CrossRef CAS.
- S. Gadiyaram, V. D. Ghule, A. Ghosh and D. A. Jose, Sens. Diagn., 2022, 1, 1224–1235 RSC.
- J. G. Kauno, Y. Zhao, J. Feng, T. Wang, Y. Chen, H. Xie, S. Xue and Y. Guo, Cryst. Growth Des., 2022, 22, 6564–6574 CrossRef CAS.
- Z. Wang, Y. Zhang, J. Yin, M. Li, H. Luo, Y. Yang, X. Xu, Q. Yong and S. Wang, Sens. Actuators, B, 2020, 320, 128249 CrossRef CAS.
- X. Tian, L. Chen, Y. Li, C. Yang, Y. Ni, C. Zhou and Y. Wang, J. Mater. Chem. C, 2017, 5, 3669–3672 RSC.
- C. Fang, H. Cao, C. Cai, Q. Zhang, D. Li, X. Tian, S. Li, J. Wu and Y. Tian, Sens. Actuators, B, 2020, 325, 128820 CrossRef CAS.
- A. Kasprzak and H. Sakurai, Chem. Commun., 2021, 57, 343–346 RSC.
- R. I. Khan, A. Ramu and K. Pitchumani, Sens. Actuators, B, 2018, 266, 429–437 CrossRef CAS.
- Z. Wu, W. Li, J. Chen and C. Yu, Talanta, 2014, 119, 538–543 CrossRef CAS PubMed.
- M. W. Lieberman, A. L. Wiseman, Z. Z. Shi, B. Z. Carter, R. Barrios, C. N. Ou, P. Chévez-Barrios, Y. Wang, G. M. Habib, J. C. Goodman, S. L. Huang, R. M. Lebovitz and M. M. Matzuk, Proc. Natl. Acad. Sci. U. S. A., 1996, 93, 7923–7926 CrossRef CAS PubMed.
- Y.-M. Go and D. P. Jones, Free Radical Biol. Med., 2011, 50, 495–509 CrossRef CAS PubMed.
- A. Pastore, A. Alisi, G. Di Giovamberardino, A. Crudele, S. Ceccarelli, N. Panera, C. Dionisi-Vici and V. Nobili, Int. J. Mol. Sci., 2014, 15, 21202–21214 CrossRef CAS PubMed.
- A. Barbati, B. Cappuccini, M. C. Aisa, C. Grasselli, M. Zamarra, V. Bini, G. Bellomo, A. Orlacchio and G. C. Di Renzo, J. Neonatol., 2016, 109, 154–160 CrossRef CAS PubMed.
- R. Singh and G. Das, Analyst, 2019, 144, 567–572 RSC.
- A. Gogoi, S. Samanta and G. Das, Sens. Actuators, B, 2014, 202, 788–794 CrossRef CAS.
- A. Das, S. De and G. Das, J. Photochem. Photobiol., A, 2021, 418, 113442 CrossRef CAS.
- B. K. Datta, D. Thiyagarajan, A. Ramesh and G. Das, Dalton Trans., 2015, 44, 13093–13099 RSC.
- A. Das and G. Das, New J. Chem., 2022, 46, 19002–19008 RSC.
- R. Singh and G. Das, Sens. Actuators, B, 2018, 258, 478–483 CrossRef CAS.
- C. Kar, S. Samanta, S. Mukherjee, B. K. Datta, A. Ramesh and G. Das, New J. Chem., 2014, 38, 2660–2669 RSC.
- Y. Hu, L. Lu, S. Guo, X. Wu, J. Zhang, C. Zhou, H. Fu and Y. She, Sens. Actuators, B, 2023, 382, 133534 CrossRef CAS.
- S. Mohandoss, N. Ahmad, M. R. Khan, K. S. Velu, K. Kalaiselvi, S. Palanisamy, S. You and Y. R. Lee, Spectrochim. Acta, Part A, 2023, 302, 123040 CrossRef CAS PubMed.
- M. Ö. Alaş and R. Genç, ACS Appl. Nano Mater., 2021, 4, 7974–7987 CrossRef.
- E. S. Riddle, M. H. Stipanuk and A. E. Thalacker-Mercer, Front. Biosci., 2016, 8, 326–350 CrossRef PubMed.
- A. C. Germs, J. Sci. Food Agric., 1973, 24, 7–16 CrossRef CAS PubMed.
- G. Mazza, M. LeMaguer and D. Hadziyev, Can. Inst. Food Sci. Technol. J., 1979, 12, 43–46 CrossRef CAS.
- D. Dev, N. B. Palakurthy, K. Thalluri, J. Chandra and B. Mandal, J. Org. Chem., 2014, 79, 5420–5431 CrossRef CAS PubMed.
Footnote |
| † Electronic supplementary information (ESI) available: Characterization data, detailed spectral data, etc. CCDC 2305044. For ESI and crystallographic data in CIF or other electronic format see DOI: https://doi.org/10.1039/d3sd00306j |
| This journal is © The Royal Society of Chemistry 2024 |

