
 Open Access Article
 This Open Access Article is licensed under a Creative Commons Attribution-Non Commercial 3.0 Unported Licence
Strong-field effects in the photo-induced dissociation of the hydrogen molecule on a silver nanoshell†
Natalia E.
Koval
 *a,
J. Iñaki
Juaristi
bac and
Maite
Alducin
ac
*a,
J. Iñaki
Juaristi
bac and
Maite
Alducin
ac
aCentro de Física de Materiales CFM/MPC (CSIC-UPV/EHU), Paseo Manuel de Lardizabal 5, Donostia-San Sebastián, 20018, Spain. E-mail: natalia.koval@ehu.eus
bDepartamento de Polímeros y Materiales Avanzados: Física, Química y Tecnología, Facultad de Química (UPV/EHU), Apartado 1072, Donostia-San Sebastián, 20080, Spain
cDonostia International Physics Center (DIPC), Paseo Manuel de Lardizabal 4, 20018, Donostia-San Sebastián, Spain
First published on 15th October 2024
Abstract
Plasmonic catalysis is a rapidly growing field of research, both from experimental and computational perspectives. Experimental observations demonstrate an enhanced dissociation rate for molecules in the presence of plasmonic nanoparticles under low-intensity visible light. The hot-carrier transfer from the nanoparticle to the molecule is often claimed as the mechanism for dissociation. However, the charge transfer time scale is on the order of a few femtoseconds and cannot be resolved experimentally. In this situation, ab initio non-adiabatic calculations can provide a solution. Such simulations, however, have their own limitations related to the computational cost. To accelerate plasmonic catalysis simulations, many researchers resort to applying high-intensity external fields to nanoparticle-molecule systems. Here, we show why such an approach can be problematic and emphasize the importance of considering strong-field effects when interpreting the results of time-dependent density functional theory simulations of plasmonic catalysis. By studying the hydrogen molecule dissociation on the surface of a silver nanoshell and analyzing the electron transfer at different field frequencies and high intensities, we demonstrate that the molecule dissociates due to multiphoton absorption and subsequent ionization.
1 Introduction
Plasmon-induced photocatalysis (plasmon-enhanced nanocatalysis or plasmonic catalysis) has emerged as a highly promising field that combines the unique properties of plasmonic nanoparticles (NPs) with catalytic processes.1–14 NPs have been widely explored as catalysts due to their large surface-to-volume ratio, tunable surface properties, and localized surface plasmon resonance (LSPR) effects. These properties enable the manipulation of light–matter interaction and the generation of highly localized electromagnetic fields (hotspots) and energetic charge carriers (hot electrons), leading to enhanced catalytic activity.4,14–18 The choice of NP material, shape, and size plays a critical role in determining their catalytic performance.14,19 Some common metals used for plasmonics include silver, gold, and copper. In addition, plasmonic NPs come in various shapes, most commonly being spherical NPs,20 but also nanorods, nanostars,21,22 nanotriangles,23 nanocubes,19,24 and nanoshells.25–31Experimentally, plasmonic catalysis has been demonstrated by several groups.3,32–35 Mukherjee et al.33 studied plasmon-induced dissociation of H2/D2 on Au/TiO2 at room temperature. Supporting their findings by DFT results, the authors suggested a dissociation mechanism consisting of hot-electron transfer from Au to the molecular antibonding state facilitated by H2–Au hybridization. Christopher et al.32 reported enhanced performance in the oxidation of ethylene on Ag nanocubes. They also suggested that hot electrons transfer to the lowest unoccupied molecular orbital (LUMO) and dissipate energy into the vibrational modes of the molecule, stretching the O2 bonds and eventually activating dissociation.
Employing advanced computational methods like real-time time-dependent density functional theory (RT-TDDFT),36–38 makes it possible to unravel phenomena occurring in very short times, often difficult to resolve experimentally. RT-TDDFT is a powerful tool for modeling light–matter interaction, plasmonic properties, and catalytic processes.39 In this respect, there are an increasing number of studies using RT-TDDFT combined with nonadiabatic Ehrenfest molecular dynamics (EMD) that report plasmon-assisted dissociation of molecules near plasmonic NPs.24,40–48 However, these kinds of studies are still scarce and very specific, making it difficult to extract more general conclusions regarding the mechanisms ruling the dissociation process. In particular, most of the publications only focus on resonant frequencies of the external field.24,41–43,49–51 There are a limited number of studies extending the analysis to non-resonant frequencies. A good example is the work by Yan et al.,40 showing that H2 adsorbed on one end of an Ag6 chain dissociates when external field frequency ω0 coincides with LSPR (ωp), but not at lower (ω0 < ωp) or higher (ω0 > ωp) frequencies. It is, hence, essential to perform more studies comparing frequencies both in and out of resonance with ωp to demonstrate the role of plasmon excitations in catalytic reactions.
The role of field intensity in the induced reactivity is another issue that requires further consideration. All the aforementioned RT-TDDFT-EMD research uses very high field intensities and reports on a threshold intensity for dissociation to occur, which lies in the range of 1013–1015 W cm−2 (with a pulse duration of 10–60 fs).24,40–43,48,50,51 Applying strong fields may lead to nonlinear effects such as high-harmonic generation,52 above-threshold ionization, multiphoton ionization, and tunneling.53–61 Unfortunately, strong-field effects are typically not discussed in the RT-TDDFT-EMD literature. The latter may be due to technical limitations of the methodology to properly describe these additional effects. For instance, using atom-centered basis sets,24,42,50 although computationally efficient, does not allow for the description of ionization due to the absence of any basis functions to represent unbound electrons. In contrast, the existing studies using real-space representation are able to describe ionization and emission in the continuum, but rarely discuss strong-field effects.40,41,43,44,51 Yan et al.40 briefly mentioned some electron loss without analyzing its effect on the dissociation process. Huang et al.44 demonstrated, for H2O on AuNPs, that the linear dependence of the H2O splitting on intensity breaks above Imax = 1.34 × 10¹⁴ W cm−2. The latter is attributed to nonlinear coupling of the external field to the system that may lead to multiphoton absorption and subsequent water fragmentation. At lower intensities, however, they suggest water splitting by hot-electron transfer from the nanoparticle (NP) to the molecular antibonding orbital. The maximum dissociation rate was observed not at the plasmon frequency, but at a lower one corresponding to the energy gap between the Fermi level and the antibonding state.
The field of plasmon-induced photocatalysis is certainly very active and there are still many open questions to solve. Actually, the precise mechanism of the plasmon-activated dissociation of molecules is yet to be understood.3,39 In this respect, more research is needed to get further insights into the limitations of ab initio simulations and the precise modeling and external field conditions. With this motivation in mind, we present here a systematic study of H2 dissociation induced by a silver hollow nanoshell of the Ag55 NP, (hereafter denoted as AgL155, with L1 standing for “layer 1′′, i.e., the outer layer of Ag55). Silver NPs are known for their high plasmonic activity and strong LSPR in the visible region.62 For near-spherical AgNPs, the experimental plasmon frequency varies from 3 to 4 eV (≈400–300 nm wavelength) depending on size, and thus it lies mostly in the UV range.63,64 Constructing nanoshells is another way of tuning the plasmon resonance.27 Linear-response TDDFT calculations have shown that the plasmon frequency of Ag hollow shells experiences a redshift compared to that of AgNPs of the same diameter.65 Thus, it is a practical way of shifting ωp into the visible range and reducing the computational cost because of the smaller number of atoms at the same NP diameter. We analyze in detail the underlying mechanisms and conditions of molecular dissociation and highlight some important limitations of the currently accepted modeling approach. We discuss similarities of our results with the literature focusing on the implications of applying a strong field to plasmonic systems. We improve upon the limitations of RT-TDDFT with a localized basis set and demonstrate that including strong-field effects changes our conclusions about the mechanism of dissociation. Namely, we show that the ionization of the molecule leads to its dissociation and desorption from the surface of the nanoshell at high field strength and frequency, regardless of the plasmon resonance obtained in a linear regime. We emphasize that applying strong external fields to plasmonic nanoparticles leads to nonlinear effects that play a principal role in molecular dissociation, overshadowing the expected influence of plasmonic effects.
Furthermore, it is worth mentioning that EMD, due to its mean-field nature, has inherent limitations, particularly when multiple pathways for nuclear dynamics are available.66,67 In such cases, the mean-field approximation can underestimate certain dissociation pathways by averaging over electronic states. Recent studies have applied an alternative approach based on the surface-hopping method,68–71 which allows for transitions between different potential energy surfaces and accounts for the branching of trajectories due to electron-nuclear coupling. However, these limitations of EMD are not critical for our specific study. Since our primary goal is to investigate the electronic response to strong external fields rather than to calculate dissociation probabilities, EMD combined with RT-TDDFT is expected to perform well. Moreover, the short timescale, system size, and strong-field conditions explored in this work justify the use of RT-TDDFT combined with EMD to capture the key nonlinear processes relevant to plasmonic catalysis.39,72
2 Methods
2.1 Geometry optimization
The first step in our computational approach involves the optimization of the nanoshell geometry using density functional theory (DFT). We employed the Perdew–Burke–Ernzerhof (PBE) functional73 within the CP2K software package,74–76 which implements the Gaussian plane wave (GPW) method.77,78 We used the DZVP basis set including 11 electrons for Ag explicitly. A cutoff of 600 Ry was used for the grid. Norm-conserving Goedecker–Teter–Hutter (GTH) pseudopotentials79 were used to represent the interaction of valence electrons with atomic cores. The initial coordinates of the nanoshell were obtained using the Atomic Simulation Environment (ASE) builder (function ase.cluster.Icosahedron)80 and taking only the outer layer of the Ag55 icosahedral cluster, which contains 42 atoms. We denote the nanoshell as AgL155. The geometry optimization was carried out until the maximum force on each atom was below 0.001 hartree bohr−1. Additionally, geometry optimization was performed for AgL155 + H2 placing H2 at a distance of 2 Å from the cluster facet along the z-axis. The final distance between the nanoshell facet and the molecule after the optimization is 3 Å. A non-periodic simulation cell of 20 × 20 × 20 Å3 was used in the simulations.2.2 Real-time time-dependent density functional theory calculations of the absorption spectrum
The absorption spectrum was computed using the real-time time-dependent density functional theory (RT-TDDFT) approach implemented in the CP2K software package.74–78,81,82 We employed the enforced time reversible symmetry (ETRS) real-time propagation scheme. Non-periodic boundary conditions were used with a unit cell of 20 × 20 × 20 Å3. We applied a small perturbation (a δ-kick of field strength of 0.001 a.u.) to the system along the x, y, and z directions at t = 0. Next, we let the system evolve in time during 6000 simulation steps with a time step Δt = 0.005 fs. Absorption spectra in the frequency domain were computed by applying the discrete Fourier transform to the time-dependent dipole moment in each direction and then calculating the average spectrum over the three directions. The three components are almost identical due to the symmetry of the nanoshell.We validated our computational approach by comparing the computed absorption spectrum for a full Ag55 icosahedral cluster with available calculations from the literature. Our plasmon peak at 3.8 eV is in good agreement with other TDDFT calculations,65,83–85 indicating the reliability of the methodology employed here. Compared to the full cluster, the spectrum of the nanoshell experiences a redshift, in agreement with what has been observed in ref. 65.
2.3 Ehrenfest molecular dynamics simulations
To investigate the action of the external field on the AgL155 + H2 system, we performed RT-TDDFT simulations combined with Ehrenfest molecular dynamics (EMD) implemented in the CP2K software package.74–78,81,82 A converged time step Δt = 0.002 fs was used in all the RT-TDDFT-EMD simulations. Each simulation was run for 55 fs. The external field was modeled by using a Gaussian envelope (see Fig. 1(c)): | (1) |
 | ||
| Fig. 1 (a) Atomic structure of the relaxed AgL155 nanoshell with H2 (interatomic distance of 0.75 Å) at a distance of 3 Å from the nanoshell facet. (b) Absorption spectrum of AgL155 + H2. (c) Time-dependent field strength of the external field pulse with a Gaussian envelope (σ = 5 fs, t0 = 18 fs) with ℏω0 = ℏωp = 3.15 eV. The maximum field strength E0 = 1.94 V Å−1 (0.038 a.u.) corresponds to the maximum intensity Imax = 1 × 10¹⁴ W cm−2. | ||
For each frequency and intensity, the RT-TDDFT-EMD simulations were initiated from the optimized geometry of the H2 molecule adsorbed on the nanoshell, while the initial atomic velocities correspond to an initial temperature of 300 K. All the atoms were allowed to move freely without any geometry constraint (i.e., no frozen atoms) during the dynamics. The unit cell size in the EMD simulations was changed to 20 × 20 × 30 Å3 to allow for possible desorption of the molecule.
In the calculations with the ghost-augmented basis set (Section 3.2), the same DZVP basis set and GTH pseudopotentials were used for Ag and Agg ghost atoms. We tested the ghost-augmented basis set on a smaller system, an H2 molecule on a silver chain Ag6. We obtained the same number of emitted electrons from the wire and from H2 for one and two layers of ghost atoms around the wire. Placing the layer of ghost atoms at different distances from the system (from 3 to 10 Å) did not affect the results in any significant way as long as there was an overlap between the basis-set functions of the system and Agg. Diffuse basis-set functions aug-cc-Q were also tested and led to the same results, again, if the basis-set functions overlapped.
Data analysis and visualization were performed using Bader analysis,86 NumPy,87 Matplotlib,88 VESTA,89 and Gnuplot.90
3 Results and discussion
3.1 Field intensity and frequency dependence of H2 dissociation on AgL155
In this section, we show the results obtained by employing the RT-TDDFT-EMD methodology following the common practice of using strong external field conditions to speed up the simulations. After analyzing these results, it will become evident that the use of such strong fields can mask any possible plasmon-induced effect, hence casting doubts on the adequacy of such simulation conditions to interpret experiments on plasmon-enhanced catalysis.The structure and the RT-TDDFT absorption spectrum of the AgL155 + H2 system are shown in Fig. 1(a) and (b), respectively. The spectrum exhibits two absorption peaks due to the hybridization of plasmon modes on the inner and outer surfaces of the nanoshell, leading to bonding and anti-bonding resonances.91 The external z-polarized field is modeled as a Gaussian pulse centered at t0 = 18 fs and with half-width-at-half-maximum σ = 5 fs (Fig. 1(c)). Three field frequencies ω0 that include the resonant plasmon frequency corresponding to ℏω0 = ℏωp = 3.15 eV and two frequencies in the minima of the absorption spectrum plotted in Fig. 1(b), ℏω0 = 2 eV and ℏω0 = 4.1 eV, are selected to study the ω0-dependence of H2 dissociation on AgL155 and, more specifically, the plasmon role in activating that process. The dependence on the field intensity I is also analyzed by considering the two following values for the maximum intensity of the Gaussian pulse, Imax = 2 × 10¹³ and 1 × 10¹⁴ W cm−2, that agree well with the usual intensities employed in previous studies of this kind.24,40–43,50,51 Note that such high intensities are usually justified by the high computational cost of RT-TDDFT-EMD simulations, which only permit the calculation of the system dynamics for a few tens of fs. In contrast, in experiments, the employed field intensities are usually much lower (below 1 MW cm−2) and it can take seconds to observe any meaningful change in the catalytic reaction rate.33 Furthermore, it is worth remarking that the usual physical quantities measured in experiments are the reaction rates and reaction probabilities. These are also the values calculated when using other computational methods, such as DFT molecular dynamics simulations, by means of a statistically meaningful sampling of the system's initial conditions. However, the purpose of this work is not to calculate the dissociation probability but to clarify the precise dissociation mechanisms and their dependence on the external field conditions, for which it is enough to focus on single dynamical events. To this aim, we rely on the advanced RT-TDDFT-EMD methodology, as has been done in similar studies.
Fig. 2 shows the time evolution of the H–H bond length for the different field conditions under consideration. At low Imax (panel (a)), the H–H distance oscillates and even deviates gradually from its equilibrium bond length as ω0 increases, but without dissociating. At high Imax (panel (b)), the bond-length oscillations are more pronounced and at ℏω0 = 4.1 eV, the molecule dissociates and even desorbs, as shown in Fig. S1.† The I-dependence observed here is consistent with the threshold intensity for dissociation observed previously in similar studies.40–43,50,51 The behavior at different frequencies, however, is rather puzzling. The fact that H2 does not dissociate at ωp but at a higher frequency regardless of lying in a minimum of the absorption spectra casts doubts on the influence of the plasmon excitation on activating the dissociation in this system at the considered field intensities. Interestingly, the obtained ω0-dependence contrasts with the results for H2 on Ag6, showing that dissociation occurs at ω0 = ωp but not at other frequencies.40 Unfortunately, there is no more information on other systems that could clarify the actual role of plasmon excitation in activating reactions under strong-field conditions, since most of the existing studies only explore resonant field frequencies (plasmon resonance and other maxima in the absorption spectrum related to interband transitions, for instance).
 | ||
| Fig. 2 H–H bond length as a function of time for the three chosen field frequencies. Field intensity is (a) Imax = 2 × 10¹³ W cm−2 and (b) Imax = 1 × 10¹⁴ W cm−2. The maximum of the external field arrives at 18 fs. | ||
The analysis of both the Mulliken population and the Bader distribution provides information on the transient electron transfer between the molecule and the nanoparticle that is caused by the external field. Fig. 3 shows the transient change in the Mulliken population on both the nanoshell and the molecule for Imax = 2 × 10¹³ W cm−2 and Imax = 1 × 10¹⁴ W cm−2, respectively. The change is calculated in each case as the difference with respect to the value at t = 0, i.e., ΔNe(t) = Ne(t) − Ne(t = 0). Hence, negative values of ΔNe mean a reduction in the number of electrons. Fig. 3(a) and (b) show that at low Imax and field frequencies ℏω0 = 2.0 and 3.15 eV, the electron distribution oscillates between the nanoshell and the molecule following the external field and it progressively recovers its initial value once the external field has been switched off. The larger amplitude of the oscillations at the plasmon frequency ℏω0 = 3.15 eV compared to 2 eV seems to be consistent with the plasmonic resonance influence. Similar back and forth charge oscillations between the metal nanoparticle and the molecule for the duration of the pulse were obtained in other systems, such as O2 and N2 on Au nanocubes24 and H2 on AuNPs.41 However, the behavior at 4.1 eV is rather odd. First, the maximum of the oscillation amplitude is shifted toward a later time compared to the maximum of the external field (18 fs). Furthermore, after the field has been switched off, the charge on the molecule is positive (the number of electrons in the molecule is reduced), which actually indicates the transfer of electrons from the molecule to the nanoshell.
 | ||
| Fig. 3 Time evolution of the Mulliken (lines) and Bader (symbols) population change [ΔNe = Ne(t) − Ne(t = 0)] on (a and c) AgL155 and (b and d) H2 for the three studied field frequencies. Field intensity is (a and b) Imax = 2 × 10¹³ W cm−2 and (c and d) Imax = 1 × 10¹⁴ W cm−2. | ||
Although not much discussed, a similar reduction of the number of electrons on the molecule upon switching off the external field has also been observed in various systems. Yan et al.40 showed that the number of electrons on H2 adsorbed on Ag6 starts to decrease after passing the maximum of the external pulse and the reduction amounts to 1 electron once the pulse is off at a field strength of 2.5 V Å−1 (Imax = 1.656 × 10¹⁴ W cm−2). Similar observations were made in ref. 24 and 41, where the charge change on the molecule after the pulse was switched off was different from zero and either positive or negative depending on the molecule (reduction of the number of electrons on H2,41 slight reduction of the number of electrons on O2, and a slight increase on N2).24 Kuda-Singappulige et al.45 analyzed the Mulliken population on O2 activated on Ag8, which revealed the transfer of electrons from the oxygen molecule to the silver nanoparticle in all the dissociative cases. From the examples listed above, it is evident that the dissociation mechanism is system-specific. Dissociation can occur due to the transfer of electrons from the NP to the molecule or vice versa. Moreover, Herring et al. suggested that the charge transfer is neither necessary nor sufficient for dissociation to occur.24
At a higher field intensity of 1 × 10¹⁴ W cm−2, the largest charge fluctuations also occur at the largest field frequency of 4.1 eV (Fig. 3(c) and (d)). At t ≃ 20 fs, when the molecule starts to dissociate (see Fig. 2(b)), the transient positive charge on H2 at this frequency corresponds to losing about one electron. A transient loss of about 0.6 electrons on H2 is also observed at the plasmon frequency; however it seems to be insufficient to cause dissociation. For completeness, we also calculated the Bader distribution every 10 fs along the simulation. Similar population changes were obtained by both Mulliken and Bader analysis.
The proposed mechanism of bond stretching (or dissociation) by electron transfer from the metallic nanoparticle to the molecule is often supported by analyzing the time-dependent occupation of the initially unoccupied molecular orbitals (MOs).42,43,51Fig. 4 shows the orbital populations calculated from the projections of the time-dependent occupied MOs of AgL155 + H2 on the initially unoccupied MOs. For each initially unoccupied orbital ψLUMO+n, where n runs from 0 to 50, the population PLUMO+n at time t is calculated as  where ψi(t) are the time-dependent occupied orbitals. Note that the projections are calculated from the propagation of the electronic states only (i.e., fixing the nuclei at their equilibrium positions). Thus, the information they provide will be meaningful as long as the system geometry is not strongly perturbed.
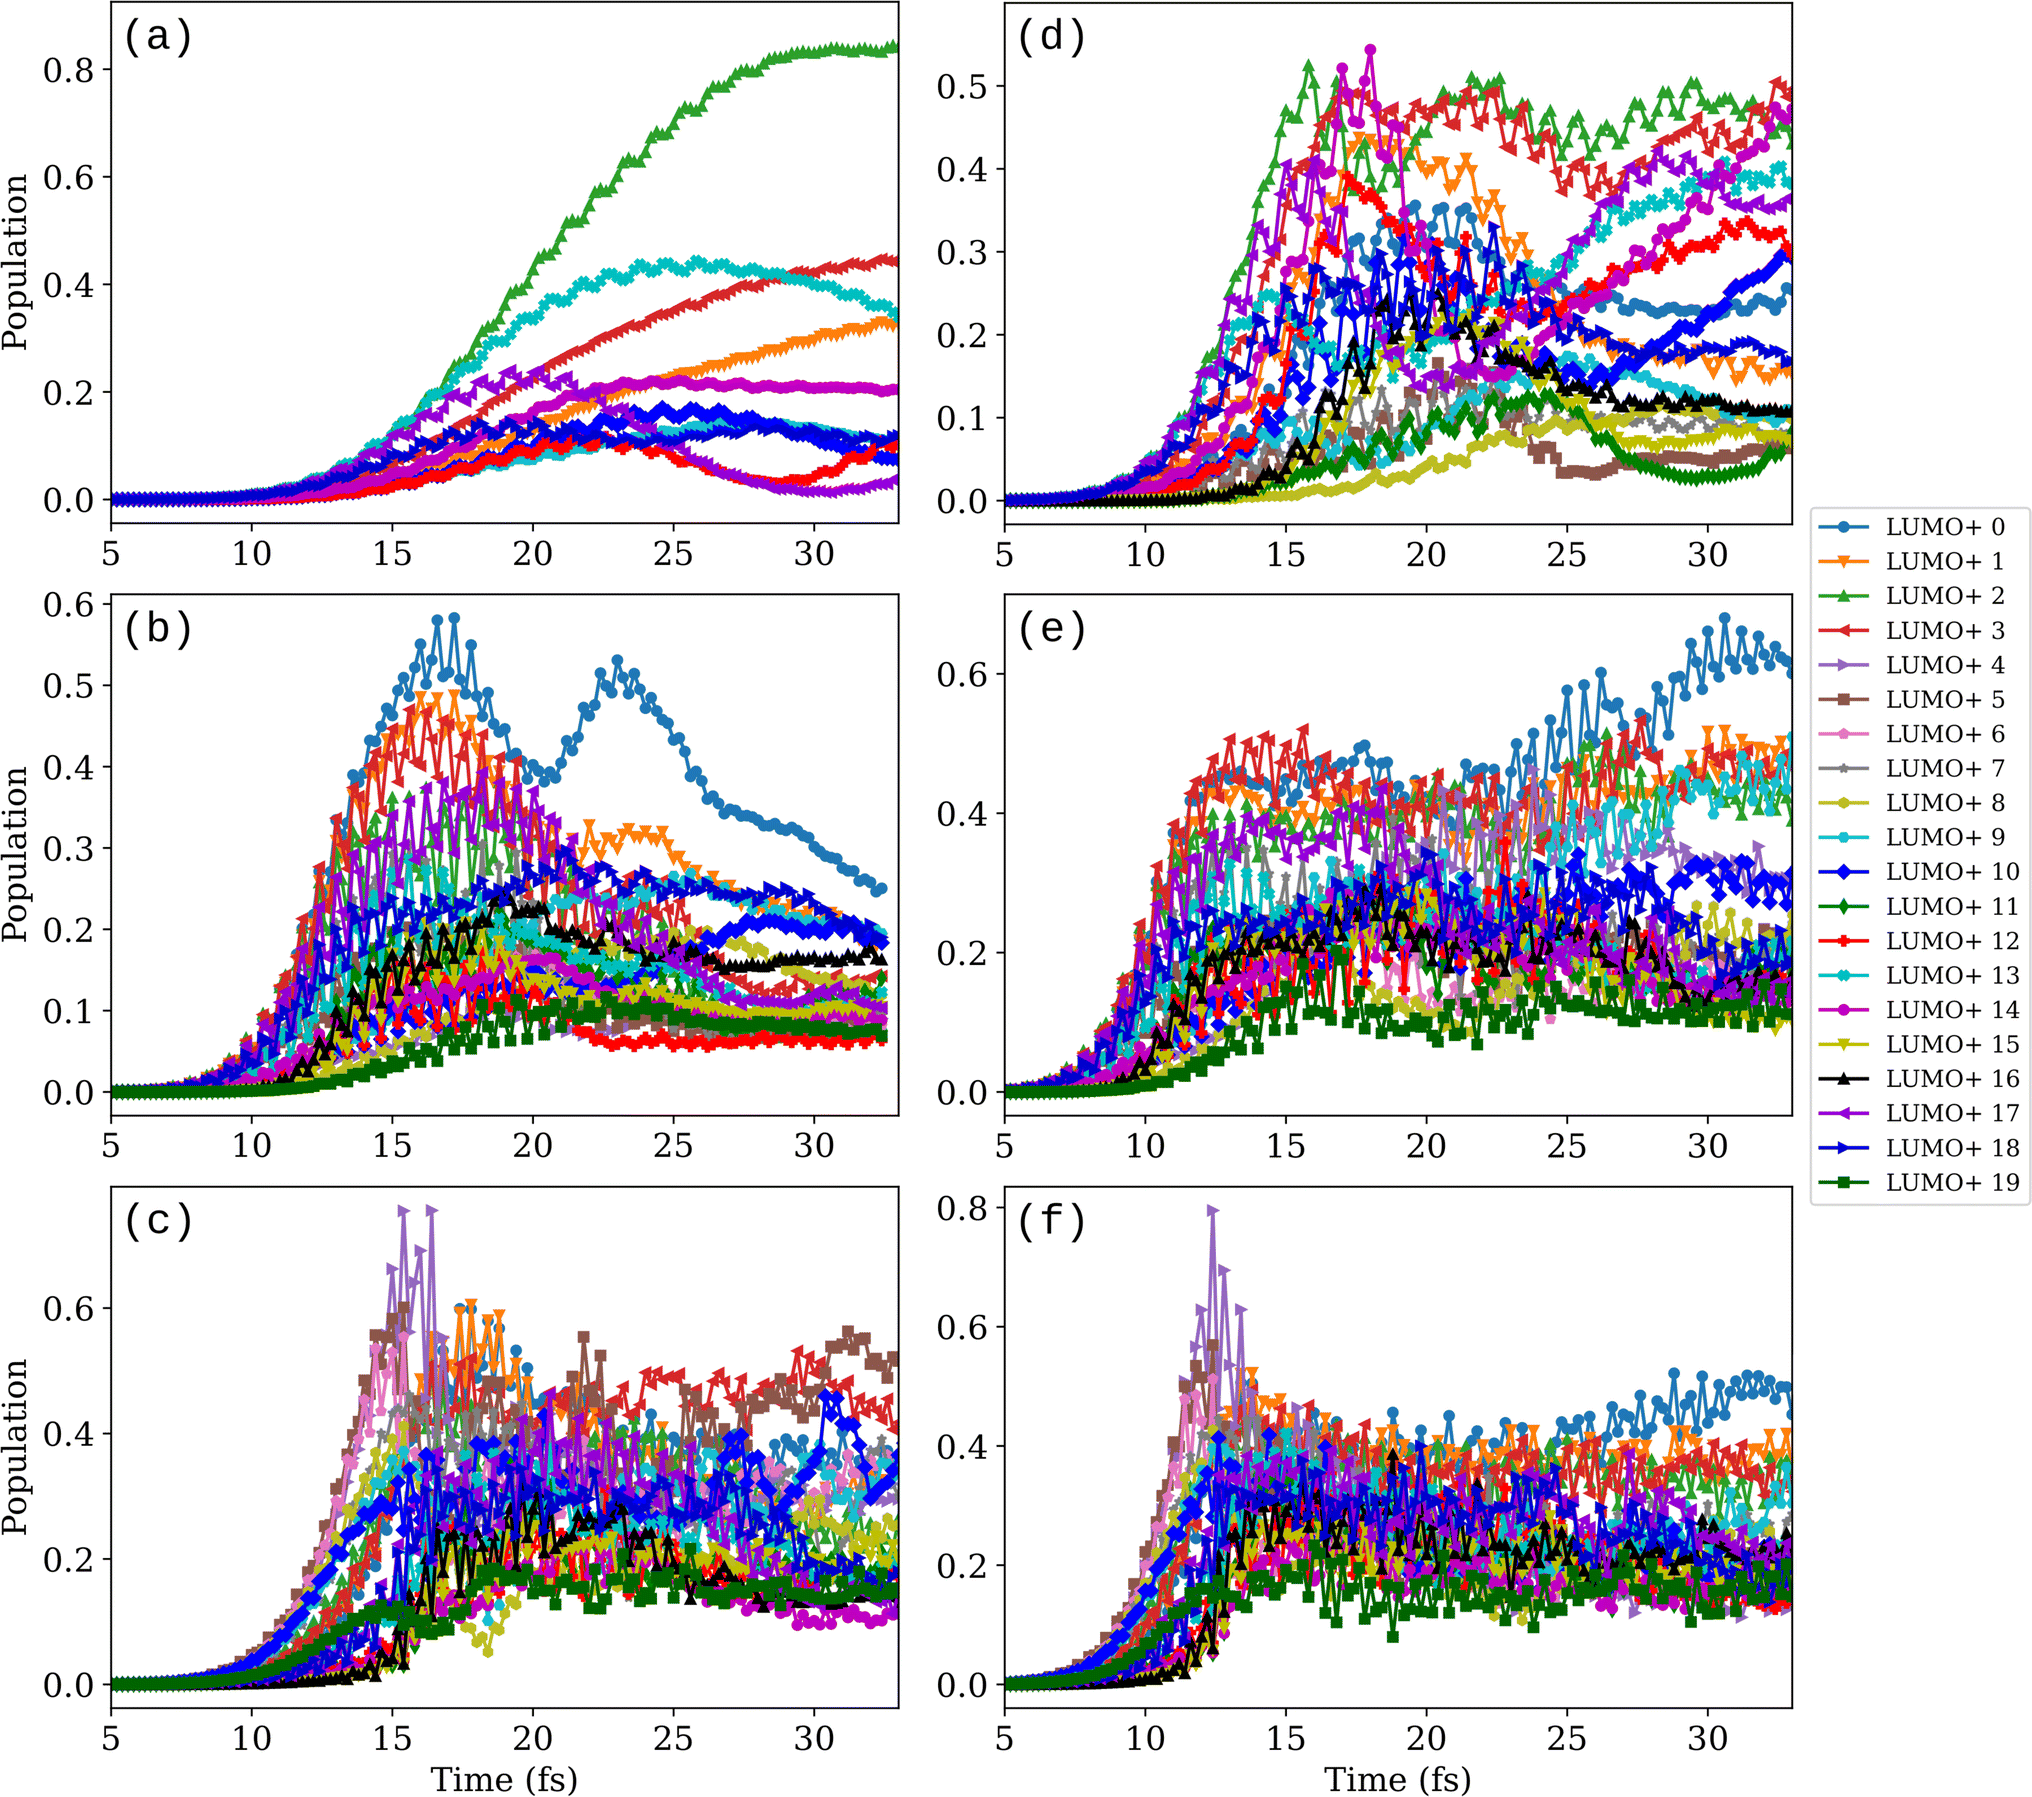 | ||
| Fig. 4 Time evolution of the AgL155 + H2 orbital populations induced by an external field with intensity (left panels, (a–c)) Imax = 2 × 10¹³ W cm−2 and (right panels, (d–f)) Imax = 1 × 10¹⁴ W cm−2. For each Imax, the field frequency is (a and d) ℏω0 = 2 eV, (b and e) ℏω0 = 3.15 eV, and (c and f) ℏω0 = 4.1 eV. Orbital populations are calculated every 0.2 fs as sums of the squares of the projections of the time-dependent occupied MOs on the initially unoccupied orbitals. Only populations with maximum values >0.1 are plotted. | ||
Finite populations of initially unoccupied MOs of very high energies are observed at all frequencies and both intensities. The number of high-energy MOs with a sizable population increases with both the field intensity and frequency, making it more and more difficult to distinguish among the different projection curves. Analysis of the spatial distribution of each unoccupied MO shows that out of 19 excited states, only 8 have features on the H2 molecule (see Fig. S2†). Orbitals LUMO+3, +4, +10, +13, and +18 have a bonding character, while LUMO+6, +16, and +19 have an antibonding character on H2. Notably, the populations on LUMO+6, +16, and +19 are relatively high at a frequency of 4.1 eV at both intensities, which can explain the large internuclear oscillations and dissociation of H2 observed at this frequency in Fig. 2(a) and (b). None of the three antibonding orbitals are populated at 2 eV and Imax = 2 × 10¹³ W cm−2, which is reflected in the H–H bond evolution in this case showing no activation of the molecular bond (Fig. 2(a)). At 2 eV and Imax = 1 × 10¹⁴ W cm−2, orbital LUMO+16 is populated, giving rise to a slight bond activation (reaching 0.93 Å at 23 fs). At the LSPR frequency of 3.15 eV, all three MOs with the antibonding features on H2 have finite populations, which are however not enough to dissociate the molecule. Sizable populations on high-energy unoccupied MOs were also observed by other authors, for instance, for CO2 on Ag6 (ref. 43) (LUMO+10) and on Ag20 (ref. 46) (up to LUMO+12), for NH3 on Ag6 (ref. 51) (up to LUMO+13) and for N2 on Ag8 (ref. 42) (up to LUMO+9). Overall, the finite populations of MOs up to LUMO+19 indicate that electrons are in a highly excited state and that there is no apparent feature that would distinguish the resonant frequency of 3.15 eV at the strong fields considered.
The occupation of high-energy MOs and the fact that ℏω0 = 4.1 eV (minimum in the absorption spectrum) gives us a larger bond separation than the plasmon frequency (3.15 eV) suggest the nonlinearity of the observed processes. The comparative analysis of the field-induced dipole moment and its dependence on the external field properties (Imax and ω0) allows us to further confirm the existence of nonlinear effects at these strong fields. Indeed, as shown in Fig. 5 for both intensities, the dipole moment oscillations are larger at 4.1 eV than at the resonant plasmon frequency of 3.15 eV at which the induced dipole is expected to be the largest. Fourier transform of the induced dipole shows that the amplitude is larger at 4.1 eV than at 3.15 eV (see Fig. S4†). It also shows that high harmonics are excited at the three frequencies considered in this work (see Fig. S5†). A strong external field may lead to electron emission and ionization, which, however, are not discussed in the RT-TDDFT-EMD studies cited in this section. Below, we show that such nonlinear effects, induced by the strong external field, have to be taken into account for a correct interpretation of the RT-TDDFT-EMD results. In particular, it is important to realize that processes such as ionization are not correctly described in RT-TDDFT-EMD simulations that, as done in this section and by other authors,42,45,50 use atom-centered basis sets, which cannot describe the continuum. Thus, in order to incorporate these missing excitations in our simulations, we have repeated all the calculations adding the so-called floating centers (or “ghost” atoms)92,93 around our system. The new results and the consequences of such an improvement are discussed in the next section.
 | ||
| Fig. 5 Time-dependent electric dipole moment for (a) Imax = 2 × 10¹³ W cm−2 and (b) Imax = 1 × 10¹⁴ W cm−2. | ||
3.2 Strong-field effects with the augmented basis set
To account for possible electron emission processes, we improve the basis set by adding an additional layer of 92 silver ghost atoms (Agg) around the nanoshell (Fig. S6†). The ghost layer corresponds to the shell number 4 of the icosahedral cluster. The ghost atoms have no physical characteristics (no nuclear charge and no electrons) and only serve for placing basis functions in the empty space outside the cluster to model electronic unbound states. The convergence of the results with the number of ghost atoms and their distance to the system was tested on a smaller system (see details in the Methodology section “Ehrenfest molecular dynamics simulations”).The time evolution of the H–H bond length obtained in the calculations with and without the additional basis-set functions is compared in Fig. 6 for each field frequency and intensity. At low Imax, Fig. 6(a) shows that H2 dissociation is not observed with the ghost-augmented basis set either. For the lower frequencies (2.0 and 3.15 eV), the results are rather independent of the basis set. However, at the highest frequency considered (ℏω0 = 4.1 eV), the difference is substantial. With the ghost-augmented basis set, the H–H bond stretches to approximately 1.1 Å, as compared to 0.85 Å without it. At high Imax (Fig. 6(b)), the molecule dissociates at 3.15 eV and 4.1 eV when using the ghost-augmented basis set, while there was no dissociation at 3.15 eV when no ghost atoms were included.
 | ||
| Fig. 6 Comparison of the H–H bond length with (solid lines) and without (dashed lines) augmented basis. Field intensity is (a) Imax = 2 × 10¹³ W cm−2 and (b) Imax = 1 × 10¹⁴ W cm−2. | ||
To understand the difference in dissociation observed in Fig. 6, we analyzed the induced charge on the Ag nanoshell, the H2 molecule, and the ghost shell, separately. Fig. 7(a)–(c) show the Mulliken population change over time for Imax = 2 × 10¹³ W cm−2. In contrast to the results without additional basis, both the nanoshell and the molecule lose electrons, which is manifested as the transfer of electrons to the ghost atoms. This is also evident from the populations of the initially unoccupied orbitals as shown in Fig. S3† for 3.15 eV and both intensities for the cases without and with the ghost atoms. In the case with the ghost atoms, additional orbitals up to LUMO+48 have populations higher than 0.1. The transfer of electrons to the ghost atoms increases with increasing frequency of the external field (Fig. 7(b) and (e)). The obtained ω0-dependence of ΔNe(t) suggests that the electron loss (and subsequently the H–H bond length) is not much related to any plasmon effect. Bader analysis overall shows smaller ionization, but nevertheless leads to the same conclusion, i.e., that the molecular bond is activated more at 4.1 eV because H2 becomes positively charged.
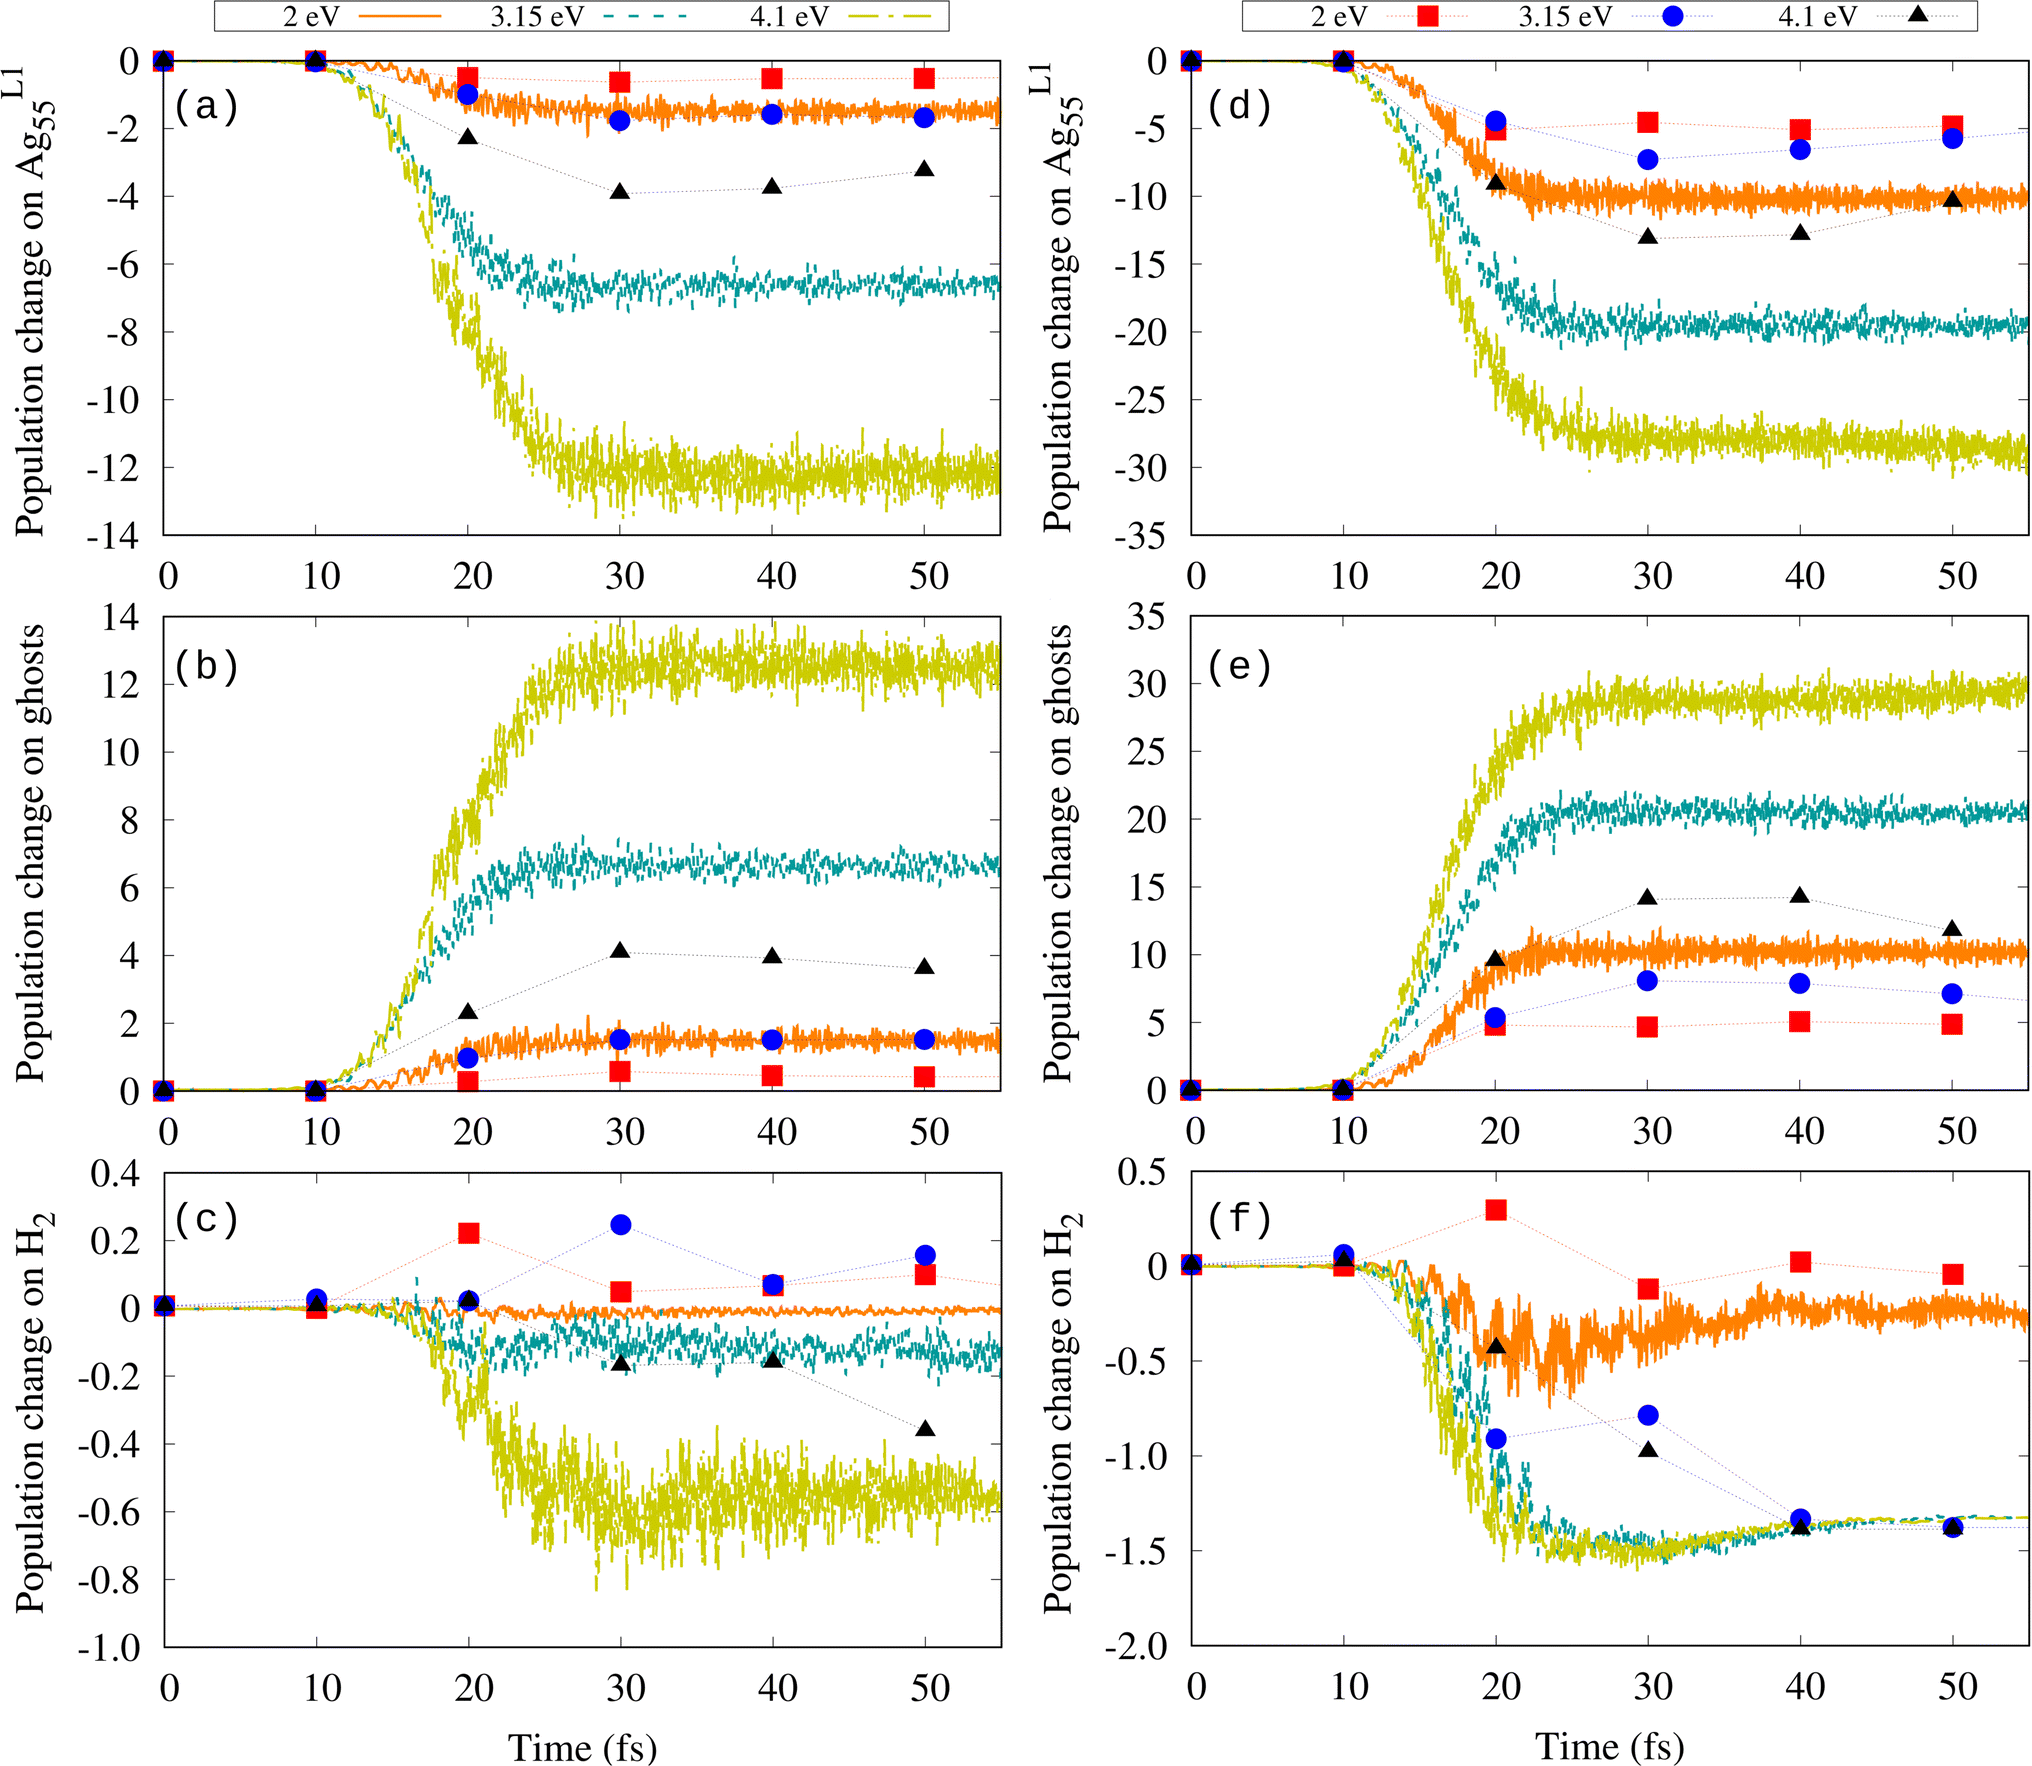 | ||
| Fig. 7 Time evolution of the Mulliken (lines) and Bader (symbols) population change [ΔNe = Ne(t) − Ne(t = 0)] on (a) AgL155, (b) ghost atoms, and (c) H2 for Imax = 2 × 10¹³ W cm−2, and on (d) AgL155, (e) ghost atoms, and (f) H2 for Imax = 1 × 10¹⁴ W cm−2. | ||
At high Imax (Fig. 7(d)–(f)), both the Mulliken and Bader population changes show that at ℏω0 = 3.15 and 4.1 eV, the H2 molecule loses approximately 1–1.5 electrons in the time interval at which dissociation takes place. Thus, it is the ionization of the molecule that promotes the bond weakening and its subsequent dissociation for both plasmonic and out-of-resonance frequencies. This observation has important implications for the established way of modeling plasmonic catalysis from first principles using strong external fields.
A single-photon absorption may not be responsible for the ionization of our system. The ionization potential of the AgL155 + H2 system obtained from the difference of the DFT total energies ε for the charged and neutral system, Ip = ε(AgL155 + H2)+ − ε(AgL155 + H2) is 3.64 eV. A possible explanation for the electron loss is thus multiphoton absorption and subsequent ionization or electron tunneling due to suppression of the potential barrier by the strong external field (above-threshold ionization).53 To assess which of these processes prevails, we estimate the Keldysh parameter γ for our field conditions.94,95 The Keldysh parameter is defined as  where Ip is the ionization potential, Up = E02/(4ω02) is the ponderomotive potential, E0 is the field strength, and ω0 is the field frequency (all expressions are in atomic units, a.u.). Tunneling ionization dominates when γ < 1, while multiphoton ionization is the dominating mechanism when γ > 1. Using the value Ip = 3.64 eV, at Imax = 1 × 10¹⁴ W cm−2, we obtain γ = 1.58 for ℏω0 = 3.15 eV and γ = 2.07 for ℏω0 = 4.1 eV, meaning that multiphoton ionization dominates. Note also that these estimations are made for the emission of a single electron, whereas, as shown in Fig. 7, several electrons are emitted. The energy threshold for multiple electron emission is larger than Ip, which implies larger values of the corresponding Keldysh parameter, supporting the multiphoton character of the process.
Our results regarding the ionization of H2 and AgL155 are in line with experimental findings. Dissociative ionization of gas-phase H2 has been observed experimentally at a similar external field frequency and intensity.96 The ionization of the H2 molecule on the AgL155 nanoshell surface is facilitated because the ionization potential of this system is much lower than that of the H2 molecule in a vacuum due to level hybridization between Ag and H (see projected density of states (PDOS) in Fig. S7 and S8†). The calculated DFT ionization potential of the isolated H2 is 14.1 eV, while it is 3.64 eV for AgL155 + H2. Experimentally, a dissociative above-threshold double ionization of H2 after absorbing more than 10 photons has been observed at a near-infrared pulse intensity of the order of 1014 W cm−2.97 Ionization probability for single Ag atoms (Ip = 7.5 eV)98 has been estimated to reach 100% at an intensity of 2 × 10¹³ W cm−2 (neutral Ag atom irradiated at 800 nm (1.55 eV) 35 fs pulse).56
The fact that the nanoshell loses up to 10 electrons (according to Bader decomposition) may affect its properties. Indeed, our calculations of the absorption spectrum for a charged system [AgL155]+10 show that the plasmon peak shifts to lower energy (see Fig. S9†). As a result, all three frequencies studied here are non-resonant when the nanoshell is ionized. It is important to emphasize that the nonlinear effects induced by a strong external field (such as the generation of higher harmonics and multiphoton processes) dominate over plasmonic effects, which is why using high-intensity field pulses when modeling plasmonic catalysis requires careful consideration.
4 Conclusions
In this work, we apply RT-TDDFT combined with Ehrenfest dynamics to investigate the effects of external field intensity and frequency on the dissociation of H2 on the surface of the AgL155 nanoshell. First, by resorting to the methodology and external field conditions used in several similar studies, we observe no molecular dissociation at the lower intensity considered (Imax = 2 × 10¹³ W cm−2) and only a slight bond stretching at ω0 ≥ ωp. At the higher intensity (Imax = 1 × 10¹⁴ W cm−2), the molecule dissociates at ω0 > ωp. However, no dissociation is observed at the plasmon frequency ωp at either the low or high intensities. Such a behavior, together with the highly excited state of the system evident from the population analysis of initially unoccupied MOs, indicates nonlinearities of the studied processes. Indeed, upon analyzing the dipole moments at all frequencies of the external field, we observe a clear manifestation of the nonlinear behavior, namely, the absence of dipolar resonance at ωp.Next, by taking the nonlinearity into account (as opposed to the linear regime in which multiphoton processes do not occur) and by improving the basis-set to represent the continuum, we observe that both H2 and the nanoshell lose electrons. As a result, H2 dissociates at the highest intensity considered and frequencies ω0 ≥ ωp. By assessing the external field conditions, the Keldysh parameter, and the ionization potential of our system, we suggest that the dissociation is caused by the multiphoton absorption and subsequent ionization. No dissociation is observed in non-ionizing cases.
Our study emphasizes that modeling molecular dissociation on plasmonic nanoparticles in a strong external field without taking into account the effects such a field can cause can be misleading. Nonlinear effects induced by a strong external field dominate over plasmonic effects, changing the optical and electronic properties of the system. Thus, it is crucial to consider the implication of applying strong external fields in simulations intended to study plasmonic catalysis. Moreover, the existence of a high-intensity threshold for dissociation in computational studies makes it difficult to extrapolate the results to experiments aimed at investigating plasmon-induced catalysis. Experimental setups typically employ much lower intensities, below 1 MW cm−2. As a result, the strong-field phenomena we observe would not occur under actual experimental conditions.
Data availability
The data generated during the current study are presented in the article and in the ESI.†Author contributions
Conceptualization: MA, NEK, JIJ; methodology: NEK; calculations: NK, MA; data analysis and validation: NEK, MA, JIJ; visualization: NEK; writing – original draft preparation: NEK; writing – review and editing: NEK, MA, JIJ; funding acquisition: MA, JIJ. All authors have accepted responsibility for the entire content of this manuscript and approved its submission.Conflicts of interest
There are no conflicts to declare.Acknowledgements
We are grateful to Prof. Andrei G. Borisov from Université Paris-Sud for helpful discussions. Financial support was provided by the Spanish MCIN/AEI/10.13039/501100011033/, FEDER Una manera de hacer Europa (Grant No. PID2022-140163NB-I00), Gobierno Vasco-UPV/EHU (Project No. IT1569-22), and the Basque Government Education Departments' IKUR program, co-funded by the European NextGenerationEU action through the Spanish Plan de Recuperación, Transformación y Resiliencia (PRTR). The authors thankfully acknowledge the computer resources at MareNostrum and the technical support provided by Barcelona Supercomputing Center (Project No. RES-FI-2024-2-0022). We also acknowledge the HPC resources provided by the Donostia International Physics Center (DIPC) Supercomputing Center.Notes and references
- S. Linic, P. Christopher and D. B. Ingram, Nat. Mater., 2011, 10, 911–921 CrossRef CAS PubMed.
- S. Linic, U. Aslam, C. Boerigter and M. Morabito, Nat. Mater., 2015, 14, 567–576 CrossRef CAS.
- W. Hou and S. B. Cronin, Adv. Funct. Mater., 2013, 23, 1612–1619 CrossRef CAS.
- X. Zhang, Y. L. Chen, R.-S. Liu and D. P. Tsai, Rep. Prog. Phys., 2013, 76, 046401 CrossRef PubMed.
- Q. Wei, S. Wu and Y. Sun, Adv. Mater., 2018, 30, 1802082 CrossRef.
- Z. Zhang, C. Zhang, H. Zheng and H. Xu, Acc. Chem. Res., 2019, 52, 2506–2515 CrossRef CAS PubMed.
- E. Cortés, L. V. Besteiro, A. Alabastri, A. Baldi, G. Tagliabue, A. Demetriadou and P. Narang, ACS Nano, 2020, 14, 16202–16219 CrossRef.
- Y. Sivan and Y. Dubi, Appl. Phys. Lett., 2020, 117, 130501 CrossRef CAS.
- A. Kumar, P. Choudhary, A. Kumar, P. H. C. Camargo and V. Krishnan, Small, 2021, 18, 2101638 CrossRef.
- E.-R. Newmeyer, J. D. North and D. F. Swearer, J. Appl. Phys., 2022, 132, 230901 CrossRef CAS.
- V. Jain, R. K. Kashyap and P. P. Pillai, Adv. Opt. Mater., 2022, 10, 2200463 CrossRef CAS.
- M. J. Kale, T. Avanesian and P. Christopher, ACS Catal., 2014, 4, 116–128 CrossRef CAS.
- Y. Dong, C. Hu, H. Xiong, R. Long and Y. Xiong, ACS Catal., 2023, 13, 6730–6743 CrossRef CAS.
- A. Amirjani, N. B. Amlashi and Z. S. Ahmadiani, ACS Appl. Nano Mater., 2023, 6, 9085–9123 CrossRef CAS.
- W. Li, T. Xue, C. Mora-Perez and O. V. Prezhdo, Trends Chem., 2023, 5(8), 634–645 CrossRef CAS.
- J. L. Brooks, C. L. Warkentin, D. Saha, E. L. Keller and R. R. Frontiera, Nanophotonics, 2018, 7, 1697–1724 CrossRef CAS.
- L. V. Besteiro, X.-T. Kong, Z. Wang, G. Hartland and A. O. Govorov, ACS Photonics, 2017, 4, 2759–2781 CrossRef CAS.
- Y. D. Constantinos Moularas, A. Gemenetzi and M. Louloudi, Nanoenergy Adv., 2024, 4, 25–44 CrossRef.
- L. T. M. Huynh, S. Kim and S. Yoon, ACS Photonics, 2022, 9, 3260–3267 CrossRef CAS.
- H. Jin, J. M. Kahk, D. A. Papaconstantopoulos, A. Ferreira and J. Lischner, PRX Energy, 2022, 1, 013006 CrossRef.
- R. Sinha-Roy, P. García-González, H.-C. Weissker, F. Rabilloud and A. I. Fernández-Domínguez, ACS Photonics, 2017, 4, 1484–1493 CrossRef CAS.
- S. Atta, F. E. Celik and L. Fabris, Faraday Discuss., 2019, 214, 341–351 RSC.
- M. Thangamuthu, C. Santschi and O. J. F. Martin, Faraday Discuss., 2019, 214, 399–415 RSC.
- C. J. Herring and M. M. Montemore, Chem. Mater., 2023, 35, 1586–1593 CrossRef CAS.
- A. M. Brito-Silva, R. G. Sobral-Filho, R. Barbosa-Silva, C. B. de Araújo, A. Galembeck and A. G. Brolo, Langmuir, 2013, 29, 4366–4372 CrossRef CAS.
- J.-K. Yang, et al. , ACS Appl. Mater. Interfaces, 2014, 6, 12541–12549 CrossRef CAS.
- N. Halas, MRS Bull., 2005, 30, 362–367 CrossRef CAS.
- H. Kang, et al. , J. Mater. Chem. B, 2014, 2, 4415–4421 RSC.
- F. Huang, G. Ma, J. Liu, J. Lin, X. Wang and L. Guo, Small, 2016, 12, 5442–5448 CrossRef CAS PubMed.
- P. Srinoi, M. Marquez, T.-C. Lee and T. Lee, Materials, 2020, 13, 4967 CrossRef CAS PubMed.
- L. Lermusiaux, et al. , Nanomaterials, 2023, 13, 614 CrossRef CAS.
- P. Christopher, H. Xin and S. Linic, Nat. Chem., 2011, 3, 467–472 CrossRef CAS.
- S. Mukherjee, et al. , Nano Lett., 2012, 13, 240–247 CrossRef.
- M. L. Brongersma, N. J. Halas and P. Nordlander, Nat. Nanotechnol., 2015, 10, 25–34 CrossRef CAS.
- C. Boerigter, R. Campana, M. Morabito and S. Linic, Nat. Commun., 2016, 7, 10545 CrossRef CAS PubMed.
- E. Runge and E. K. U. Gross, Phys. Rev. Lett., 1984, 52, 997–1000 CrossRef CAS.
- M. A. L. Marques, Time-Dependent Density Functional Theory, Springer Berlin Heidelberg, 2006 Search PubMed.
- C. A. Ullrich, Time-dependent density-functional theory: concepts and applications, OUP Oxford, 2011 Search PubMed.
- C. J. Herring and M. M. Montemore, ACS Nanosci. Au, 2023, 3, 269–279 CrossRef CAS PubMed.
- L. Yan, Z. Ding, P. Song, F. Wang and S. Meng, Appl. Phys. Lett., 2015, 107, 083102 CrossRef.
- Y. Zhang, T. Nelson, S. Tretiak, H. Guo and G. C. Schatz, ACS Nano, 2018, 12, 8415–8422 CrossRef CAS PubMed.
- O. A. Hull, D. B. Lingerfelt, X. Li and C. M. Aikens, J. Phys. Chem. C, 2020, 124, 20834–20845 CrossRef CAS.
- Y. Zhang, D. Chen, W. Meng, Z. Xu, H. Guo, S. Li and S. Meng, J. Phys. Chem. C, 2021, 125, 26348–26353 CrossRef CAS.
- J. Huang, PCCP, 2021, 23, 25629–25636 RSC.
- G. U. Kuda-Singappulige and C. M. Aikens, J. Phys. Chem. A, 2021, 125, 9450–9458 CrossRef CAS.
- Y. Zhang, et al. , Adv. Sci., 2021, 9, 2102978 CrossRef PubMed.
- T. E. Li and S. Hammes-Schiffer, J. Am. Chem. Soc., 2023, 145, 18210–18214 CrossRef CAS.
- Y. Wang and C. M. Aikens, J. Phys. Chem. A, 2023, 127, 5609–5619 CrossRef CAS.
- Q. Feng, Y. Zhang, H. Feng, D. Liu and Q. Li, Phys. Fluids, 2022, 34, 113323 CrossRef CAS.
- O. A. Hull and C. M. Aikens, J. Phys. Chem. A, 2023, 127, 2228–2241 CrossRef CAS.
- Y. Zhang, W. Meng, D. Chen, L. Zhang, S. Li and S. Meng, Nano Res., 2022, 15, 3894–3900 CrossRef CAS.
- A. V. Andreev, R. A. Ganeev, H. Kuroda, S. Y. Stremoukhov and O. A. Shoutova, Eur. Phys. J. D, 2013, 67, 1434–6079 Search PubMed.
- M. Protopapas, C. H. Keitel and P. L. Knight, Rep. Prog. Phys., 1997, 60, 389 CrossRef.
- F. Calvayrac, P.-G. Reinhard, E. Suraud and C. Ullrich, Phys. Rep., 2000, 337, 493–578 CrossRef CAS.
- V. E. Gruzdev, V. L. Komolov and S. G. Przhibel’ski, J. Opt. Technol., 2014, 81, 256 CrossRef.
- S. R. Konda, S. K. Maurya, R. A. Ganeev, Y. H. Lai, C. Guo and W. Li, Optik, 2021, 245, 167680 CrossRef CAS.
- A. N. Koya, et al. , Appl. Phys. Rev., 2023, 10, 021318 CAS.
- M. Reutzel, A. Li and H. Petek, Phys. Rev. B, 2020, 101, 075409 CrossRef CAS.
- M. R. Bionta, S. J. Weber, I. Blum, J. Mauchain, B. Chatel and B. Chalopin, New J. Phys., 2016, 18, 103010 CrossRef.
- E. Saydanzad, J. Li and U. Thumm, Phys. Rev. A, 2022, 106, 033103 CrossRef CAS.
- E. Saydanzad, et al. , Nanophotonics, 2023, 12, 1931–1942 CrossRef CAS.
- C. Liang, et al. , ACS Appl. Mater. Interfaces, 2020, 12, 54266–54284 CrossRef CAS PubMed.
- C. Yu, R. Schira, H. Brune, B. Von Isserdoff, F. Rabilloud and W. Harbich, Nanoscale, 2018, 10, 20821–20827 RSC.
- R. Schira and F. Rabilloud, J. Phys. Chem. C, 2019, 123, 6205–6212 CrossRef CAS.
- P. Koval, F. Marchesin, D. Foerster and D. Sánchez-Portal, J. Phys.: Condens. Matter, 2016, 28, 214001 CrossRef PubMed.
- A. V. Akimov, A. J. Neukirch and O. V. Prezhdo, Chem. Rev., 2013, 113, 4496–4565 CrossRef CAS PubMed.
- I. Loaiza and A. F. Izmaylov, J. Chem. Phys., 2018, 149, 214101 CrossRef.
- J. C. Tully, J. Chem. Phys., 1990, 93, 1061–1071 CrossRef CAS.
- X. Wu, B. Liu, T. Frauenheim, S. Tretiak, C. Yam and Y. Zhang, J. Chem. Phys., 2022, 157, 214201 CrossRef CAS.
- X. Wu, T. van der Heide, S. Wen, T. Frauenheim, S. Tretiak, C. Yam and Y. Zhang, Chem. Sci., 2023, 14, 4714–4723 RSC.
- Q. Wu, L. Zhou, G. C. Schatz, Y. Zhang and H. Guo, J. Am. Chem. Soc., 2020, 142, 13090–13101 CrossRef CAS.
- L. Wang, R. Long and O. V. Prezhdo, Annu. Rev. Phys. Chem., 2015, 66, 549–579 CrossRef CAS PubMed.
- J. P. Perdew, K. Burke and M. Ernzerhof, Phys. Rev. Lett., 1996, 77, 3865–3868 CrossRef CAS.
- J. Hutter, M. Iannuzzi, F. Schiffmann and J. VandeVondele, Wiley Interdiscip. Rev.: Comput. Mol. Sci., 2013, 4, 15–25 Search PubMed.
- T. D. Kühne, et al. , J. Chem. Phys., 2020, 152, 194103 CrossRef PubMed.
- CP2K, Version 9.1, 2020, https://www.cp2k.org/ Search PubMed.
- G. Lippert, J. Hutter and M. Parinello, Mol. Phys., 1997, 92, 477–487 CrossRef CAS.
- J. VandeVondele, M. Krack, F. Mohamed, M. Parrinello, T. Chassaing and J. Hutter, Comput. Phys. Commun., 2005, 167, 103–128 CrossRef CAS.
- S. Goedecker, M. Teter and J. Hutter, Phys. Rev. B, 1996, 54, 1703–1710 CrossRef CAS PubMed.
- A. Hjorth Larsen, et al. , J. Phys.: Condens. Matter, 2017, 29, 273002 CrossRef.
- T. Kunert and R. Schmidt, EPJD, 2003, 25, 15–24 CrossRef CAS.
- S. Andermatt, J. Cha, F. Schiffmann and J. VandeVondele, J. Chem. Theory Comput., 2016, 12, 3214–3227 CrossRef CAS PubMed.
- H.-C. Weissker and C. Mottet, Phys. Rev. B, 2011, 84, 165443 CrossRef.
- T. P. Rossi, S. Lehtola, A. Sakko, M. J. Puska and R. M. Nieminen, J. Chem. Phys., 2015, 142, 094114 CrossRef.
- O. Baseggio, et al. , J. Phys. Chem. C, 2016, 120, 12773–12782 CrossRef CAS.
- W. Tang, E. Sanville and G. Henkelman, J. Phys.: Condens.Matter, 2009, 21, 084204 CrossRef CAS PubMed.
- C. R. Harris, et al. , Nature, 2020, 585, 357–362 CrossRef CAS PubMed.
- J. D. Hunter, Comput. Sci. Eng., 2007, 9, 90–95 Search PubMed.
- K. Momma and F. Izumi, J. Appl. Crystallogr., 2011, 44, 1272–1276 CrossRef CAS.
- T. Williams, C. Kelley, et al, Gnuplot 5.4: an interactive plotting program, 2024, http://gnuplot.sourceforge.net/ Search PubMed.
- E. Prodan and P. Nordlander, J. Chem. Phys., 2004, 120, 5444–5454 CrossRef CAS.
- D. Soriano, D. Jacob and J. J. Palacios, J. Chem. Phys., 2008, 128, 074108 CrossRef CAS PubMed.
- A. F. White, C. J. Heide, P. Saalfrank, M. Head-Gordon and E. Luppi, Mol. Phys., 2015, 114, 947–956 CrossRef.
- T. Fennel, K.-H. Meiwes-Broer, J. Tiggesbäumker, P.-G. Reinhard, P. M. Dinh and E. Suraud, Rev. Mod. Phys., 2010, 82, 1793–1842 CrossRef.
- M. Li, et al. , Phys. Rev. Lett., 2014, 112, 113002 CrossRef PubMed.
- G. V. Lopez, M. Fournier, J. Jankunas, A. K. Spiliotis, T. P. Rakitzis and D. W. Chandler, J. Chem. Phys., 2017, 147, 013948 CrossRef PubMed.
- S. Pan, et al. , Phys. Rev. Lett., 2021, 126, 063201 CrossRef CAS PubMed.
- A. A. Radzig and B. M. Smirnov, Reference Data on Atoms, Molecules, and Ions, Springer, Berlin Heidelberg, 1985 Search PubMed.
Footnote |
| † Electronic supplementary information (ESI) available. See DOI: https://doi.org/10.1039/d4sc04110k |
| This journal is © The Royal Society of Chemistry 2024 |