 Open Access Article
A nitrile solvent structure induced stable solid electrolyte interphase for wide-temperature lithium-ion batteries†
Zhongming
Wang
a,
Zhiyuan
He
a,
Zhongsheng
Wang
a,
Jixu
Yang
a,
Kecheng
Long
 a,
Zhibin
Wu
 a,
Gang
Zhou
c,
Lin
Mei
 *a and
Libao
Chen
 *ab
*ab
aState Key Laboratory of Powder Metallurgy, Central South University, Changsha, 410083, P. R. China. E-mail: meilin@csu.edu.cn; lbchen@csu.edu.cn
bNational Energy Metal Resources and New Materials Key Laboratory, Central South University, Changsha, 410083, P. R. China
cSchool of Materials Science and Engineering, Dongguan University of Technology, Dongguan, 523000, P. R. China
First published on 29th July 2024
Abstract
Lithium-ion batteries (LIBs) are extensively employed in various fields. Nonetheless, LIBs utilizing ethylene carbonate (EC)-based electrolytes incur capacity degradation in a wide-temperature range, which is attributable to the slow Li+ transfer kinetics at low temperatures and solvent decomposition during high-rate cycling at high temperatures. Here, we designed a novel electrolyte by substituting nitrile solvents for EC, characterized by low de-solvation energy and high ionic conductivity. The correlation between the carbon chain length of nitrile solvents with reduction stability and the Li+-solvated coordination was investigated. The results revealed that the valeronitrile (VN) solvent displayed an enhanced lowest unoccupied molecular orbital energy level and low de-solvation energy, which helped construct robust SEI interfacial layers and improved kinetics of interfacial ion transfer in wide-temperature LIBs. The VN-based electrolyte employed in graphite‖NCM523 pouch cells achieved a discharge capacity of 89.84% at a 20C rate at room temperature. Meanwhile, the cell exhibited 3C rate cycling stability even at a high temperature of 55 °C. Notably, the VN-based electrolyte exhibited a high ionic conductivity of 1.585 mS cm−1 at −50 °C. The discharge capacity of pouch cells retained 75.52% and 65.12% of their room temperature capacity at −40 °C and −50 °C, respectively. Wide-temperature-range batteries with VN-based electrolytes have the potential to be applied in various extreme environments.
Introduction
Efficient and environmentally friendly lithium-ion batteries (LIBs) have gained widespread applications in numerous fields owing to their exceptional energy density, superior cycle stability, and reliable safety performance.1 However, the performance deterioration of LIBs in a wide-temperature range, such as lithium precipitation, discharge capacity degradation, and poor rate performance, obstructs their applicability in diverse scenarios.2–5 Specifically, LIBs encounter challenges such as interfacial charge transfer difficulties at low temperatures, transition metal dissolution at high temperatures,6 hydrogen fluoride (HF) generation during cycling,7 excessive polarization during rapid charging, and insufficient conductivity, among others.8,9 Electrolyte optimization represents one of the effective means of broadening the operating temperature range of LIBs.10,11 Various approaches have been proposed, including the modification of solvent systems, the regulation of organic lithium salts, and the exploration of additives.12–14 However, these studies have predominantly focused on enhancing low-temperature performance of LIBs;15 the improvement of high-temperature performance has received relatively less attention.16An outstanding electrolyte for LIBs in the wide temperature range requires a high ionic conductivity, a low freezing point, low de-solvation energy, and enhanced thermal stability.2,10,17 However, the conventional ethyl carbonate (EC) solvent poses limitations due to its high melting point, strong affinity for Li+, and susceptibility to thermal decomposition.18 Numerous efforts have been made to explore alternative solvents for LIB electrolytes to overcome the above limitations, including methyl acetate (MA),19,20 1,3,5-trifluorobenzene,21 fluoroethylene carbonate (FEC),22 succinonitrile (SCL),23 and so on. Nitrile solvents have shown remarkable promise owing to their distinctively low melting points, high boiling points, and reduced viscosities.24–29 Huang30et al. made a notable contribution by blending acetonitrile with fluoroethylene carbonate, creating an electrolyte solvent that endows LIBs with an impressive 20C ultra-fast charging capability. Luo31et al. successfully employed isobutyronitrile (iBN) to extend the ultra-low-temperature operational limit of LIBs down to −70 °C while maintaining stable performance at 60 °C. The solid electrolyte interphase (SEI) film plays a key role in the advancement of high-performance LIBs.32 However, due to their distinct chemical structures and high reduction potentials, they encounter difficulties in forming a stable passivation layer on the anode surface. Therefore, the incompatibility of nitrile solvents with the anode remains a pressing issue that warrants immediate attention and resolution.33–35
Herein, we designed a novel electrolyte with nitrile solvents and improved the interface stability through regulating the carbon chain length of the nitrile. We prepared the following electrolyte formulations: the nitrile-based electrolyte (nitrile group) consists of 1.2 mol per L LiPF6 in nitrile/ethyl propionate (EP)/FEC with a volume ratio of 3![[thin space (1/6-em)]](https://www.rsc.org/images/entities/char_2009.gif) :
:![[thin space (1/6-em)]](https://www.rsc.org/images/entities/char_2009.gif) 6
6![[thin space (1/6-em)]](https://www.rsc.org/images/entities/char_2009.gif) :
:![[thin space (1/6-em)]](https://www.rsc.org/images/entities/char_2009.gif) 1, supplemented with 1.5% of the weight ratio of vinylene carbonate (VC), and the EC-based electrolyte (EC group) consists of 1.2 mol per L LiPF6 in EC/EP/FEC with a volume ratio of 3
1, supplemented with 1.5% of the weight ratio of vinylene carbonate (VC), and the EC-based electrolyte (EC group) consists of 1.2 mol per L LiPF6 in EC/EP/FEC with a volume ratio of 3![[thin space (1/6-em)]](https://www.rsc.org/images/entities/char_2009.gif) :
:![[thin space (1/6-em)]](https://www.rsc.org/images/entities/char_2009.gif) 6
6![[thin space (1/6-em)]](https://www.rsc.org/images/entities/char_2009.gif) :
:![[thin space (1/6-em)]](https://www.rsc.org/images/entities/char_2009.gif) 1, with 1.5% of the weight ratio of VC for the control. Compared with the EC group, the nitrile group had high ionic conductivity and low de-solvation energy, which were conducive to the excellent electrochemical performance of LIBs in a wide temperature range. In addition, the increase in the carbon chain length of nitriles improved the stability of nitrile functional groups and the concentration of contact ion pairs in the electrolyte. Impressively, the VN group exhibited a high ionic conductivity of 1.585 mS cm−1 at −50 °C. The graphite‖NCM523 pouch cell with the VN group achieved a superior capacity retention of more than 89.84% at a 20C rate at room temperature, and obtained an excellent capacity retention of more than 65.12% of the room-temperature capacity at −50 °C, along with decent cycling stability at room temperature and 55 °C. This work lays the foundation for the development of nitrile-based electrolytes in wide-temperature LIBs.
1, with 1.5% of the weight ratio of VC for the control. Compared with the EC group, the nitrile group had high ionic conductivity and low de-solvation energy, which were conducive to the excellent electrochemical performance of LIBs in a wide temperature range. In addition, the increase in the carbon chain length of nitriles improved the stability of nitrile functional groups and the concentration of contact ion pairs in the electrolyte. Impressively, the VN group exhibited a high ionic conductivity of 1.585 mS cm−1 at −50 °C. The graphite‖NCM523 pouch cell with the VN group achieved a superior capacity retention of more than 89.84% at a 20C rate at room temperature, and obtained an excellent capacity retention of more than 65.12% of the room-temperature capacity at −50 °C, along with decent cycling stability at room temperature and 55 °C. This work lays the foundation for the development of nitrile-based electrolytes in wide-temperature LIBs.
Results and discussion
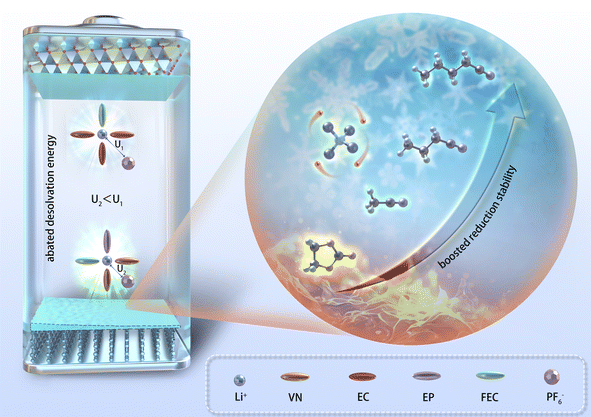
The physical and chemical properties of the solvent played a pivotal role in influencing the ionic conductivity, viscosity, co-melting point of the electrolyte, thereby affecting the low-temperature performance of LIBs. Nitrile solvents exhibit low melting points (≤−40 °C) and viscosity (<1 mPa s) compared to EC solvents (Table S1†), which may endow them with superior wide-temperature performance in LIBs compared to the EC solvent. Simultaneously, the moderately low dielectric constant of nitrile solvents had the capability to modify the solvation structure of the electrolyte, potentially leading to a solvation structure characterized by reduced de-solvation energy. Furthermore, the structure of nitrile solvents can optimize the composition and enhance the robustness of the SEI/CEI, significantly improving the cycling stability of nitrile-based batteries in extreme environments (Fig. 1).Density functional theory (DFT) calculations were employed to determine the lowest unoccupied molecular orbital (LUMO) and the highest occupied molecular orbital (HOMO) values of various solvents (Fig. 2a). Except for acetonitrile (AN), nitrile solvents generally showed higher LUMO values than EC solvents, indicating that nitrile solvents have better reduction stability than EC solvents. In addition, the LUMO value of nitrile solvents increased with increasing carbon chain length, which indicated that the reduction stability of nitrile solvents was improved by the carbon chain length. The above analysis provided a foundation for the application of nitrile solvents in LIB electrolytes. It was expected that through optimizing the solvent system of LIB electrolytes, the application of nitrile solvents in LIB electrolytes can be realized.
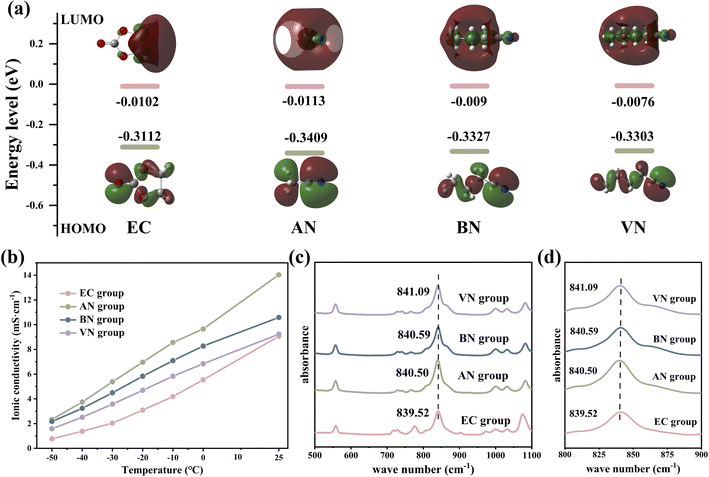 | ||
| Fig. 2 (a) LUMO and HOMO values of different solvent molecules. (b) The conductivity of different electrolytes at different temperatures. (c and d) Infrared spectra of different electrolytes. | ||
Fig. S1† presents the viscosity of various electrolytes at room temperature; it was obvious that the viscosity of the nitrile group was lower than that of the EC group, and the viscosity of the nitrile group increased with the increase in the carbon chain length (EC group 4.4316 mPa s, AN group 1.6193 mPa s, butyronitrile group 2.2835 mPa s, and VN group 2.4879 mPa s, respectively). This was mainly because the viscosity of AN, butyronitrile (BN) and VN is 0.325, 0.515 and 0.799 mPa s, respectively, which were much lower than the viscosity values of EC (1.9 mPa s). The lower viscosity of the electrolyte indicated that the resistance encountered by Li+ during the diffusion process will be reduced.36 With a low viscosity electrolyte, Li+ encounters less resistance in the solution, thereby facilitating their migration and exhibiting higher Li+ diffusion coefficients. The Li+ diffusion coefficients of different electrolytes at room temperature supported the above view, and the results are shown in Fig. S2.† It was obvious that nitrile groups exhibited higher Li+ ionic diffusion coefficients compared to the EC group (EC group 2.445 × 10⁻¹¹ m2 s−1, AN group 5.73 × 10⁻¹¹ m2 s−1, BN group 4.298 × 10⁻¹¹ m2 s−1, and VN group 3.896 × 10⁻¹¹ m2 s−1).
Fig. 2b shows the ionic conductivity of different electrolytes. Notably, the nitrile group demonstrated superior ionic conductivity compared to the EC group across various temperatures. Specifically, at −50 °C, the ionic conductivity of the nitrile group was severalfold higher than that of the EC group (2.33, 2.17, 1.585, and 0.769 mS cm−1 for AN, BN, VN, and EC groups, respectively). Lower viscosity, higher Li+ diffusion coefficient, and higher ionic conductivity could facilitate faster ion transmission, enabling the electrolyte to possess excellent kinetic performance and the improvement of the LIB's rate performance and low-temperature performance.37 Moreover, after being stored at −50 °C for over 10 hours (Fig. S3†), the EC group exhibited significant solidification and precipitation, while BN and VN groups showed no observable precipitation. In contrast, the AN group exhibited minor and inconspicuous precipitation due to the melting point of the AN solvent being −45 °C (greater than −50 °C). The aforementioned tests on viscosity, conductivity, and other relevant parameters had highlighted the advantages of the nitrile group over the EC group. These advantages significantly enhanced the kinetic ability of Li+ transportation, thereby improving the low-temperature and rate performance of the LIBs.
Infrared spectroscopy was employed to investigate the coordination environment involving lithium ions, solvent molecules, and anions. As shown in Fig. 2c and d, the absorption peak observed in the range of 838 to 842 cm−1 corresponded to the absorption peak arising from the interaction between Li+ and PF6−. Compared with the EC group, the nitrile group exhibited a blue shift phenomenon, and the degree of blue shift escalated with increasing carbon chain length (839.52, 840.50, 840.59 and 841.09 cm−1 for EC, AN, BN, and VN groups, respectively). This observation suggested a stronger interaction between Li+ and PF6− in nitrile groups, implying a higher concentration of contact ion pairs.38 As the carbon chain length increases, there was a rise in the proportion of contact ion pairs and a simultaneous decrease in the proportion of free PF6−. These findings confirmed a significant number of PF6− anions in coordination with Li+ in nitrile groups. As a result, the graphite electrode interface of nitrile groups could form SEI films enriched with anion decomposition products, which was crucial for enhancing the performance and stability of LIBs.39,40
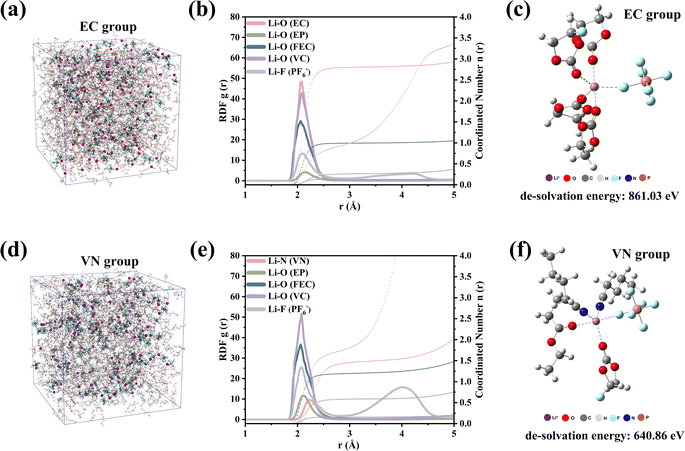
Molecular dynamics (MD) simulations further revealed the significant difference in the solvation structure between the EC group and VN group. Through the radial distribution function (RDF, Fig. 3b), we could clearly observe the coordination environment around Li+. The initial RDF peaks of Li+–O (EC) and Li+–O (FEC) in the EC group appear at ≈2.06 Å, which was shorter than Li+–O (VC) ≈ 2.08 Å, Li+–F (PF6−) ≈ 2.10 Å and Li+–O (EP) ≈ 2.14 Å in the first layer of the solvation structure. In the VN group (Fig. 3e), the order of interaction between each component and Li+ changed significantly. The peaks of the RDF in the VN group appeared at ≈ 2.24 Å, which was the farthest from Li+. The peaks of Li+–F (PF6−) (2.08 Å) and Li+–O (EP) (2.12 Å) moved inward by 0.02 Å. This indicated that the order of interaction between each component and Li+ in different electrolytes changed from EC ≈ FEC > VC > PF6− > EP (EC group) to FEC > PF6− ≈ VC > EP > VN (VN group). In addition, the coordination number of different solvents at a distance of 3 Å from Li+ in different electrolytes had changed. The results are shown in Fig. S4.† The coordination number of each component in the EC group was 2.8, 0.26, 0.99, 0.13, and 0.99 for EC, EP, FEC, VC, and PF6−, respectively. The coordination number of each component in the VN group changed to 1.46, 0.58, 1.19, 0.16, and 1.81 for VN, EP, FEC, VC, and PF6−, respectively. This finding was consistent with the results of infrared characterization, indicating that more PF6− anions were involved in the coordination process of Li+ in the VN group, which was conducive to the formation of a SEI film rich in anion decomposition products.38
The solvation structures of the EC-group and VN-group were different, resulting in significant differences in their de-solvation energies. The de-solvation energy (Fig. 3c and f) of a typical solvation structure showed that the de-solvation energy of the VN group was only 640.86 eV, whereas the de-solvation energy of the EC group was as high as 861.03 eV. The results of de-solvation energy indicated that Li+ in the VN group system was more likely to complete the de-solvation process compared to the EC group.41
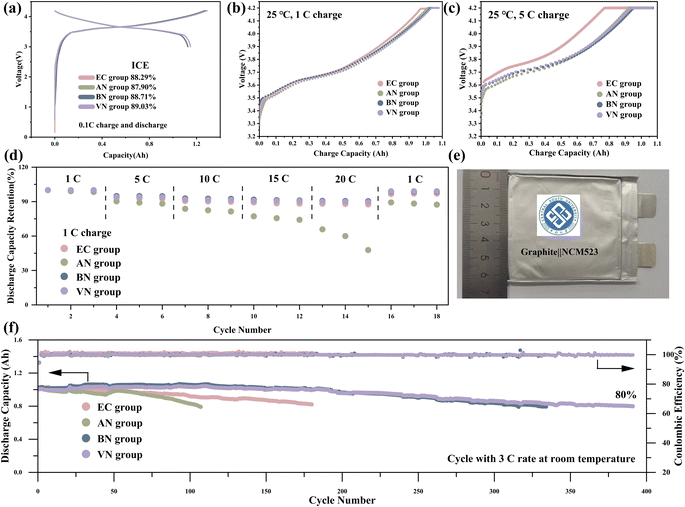
The performance of batteries with different electrolytes were tested in graphite‖NCM523 pouch cells. Fig. 4a presents the initial charge–discharge curves and the first-cycle coulombic efficiencies of various electrolytes. The VN group exhibited the highest first-cycle coulombic efficiency of 89.03%. The charge–discharge curves of the first three cycles for various electrolyte groups are presented in Fig. S5.† The discharge curves of the EC, BN, and VN groups exhibited excellent overlap, indicating minimal capacity decay. However, the AN group demonstrated poor overlap in its discharge curves, which proved the poor cycle stability of the AN group. The dQ/dV curves of various electrolytes are presented in Fig. S6.† The dQ/dV curves of the four electrolytes showed significant differences in the first two cycles, which reflected the formation of the SEI film and the consumption of a large amount of active lithium. It was worth noting that the reduction peak near 3.6 V is different in the second and third cycles. Specifically, for the AN group, the reduction peak exhibited a marked decrease in the third cycle compared to the second cycle, indicating that the AN group is not compatible with the graphite electrode.
The electrochemical impedance spectroscopy (EIS) results are shown in Fig. S8.† The ohmic internal resistance of different electrolytes was measured as follows: 19.41 mΩ for the AN group, 19.78 mΩ for the BN group, 23.25 mΩ for the VN group, and 24.53 mΩ for the EC group. The nitrile groups exhibited lower ohmic internal resistance than the EC group. This reduced internal resistance is beneficial to improve the C-rate and low-temperature performance of the LIBs.
The rate performance of graphite‖NCM523 pouch cells at room temperature is illustrated in Fig. 4b–d. The charge performance of the pouch cell at 1C and 5C rates is shown in Fig. 4b and c; nitrile groups exhibited a higher constant current charging ratio, indicating their superior charging ability compared to the EC group. For instance, under 5C charging conditions, the VN group achieved a constant current charging ratio as high as 87.87%, whereas the EC group only reached 77.17%. Additional charging results at 3C, presented in Fig. S7,† exhibited a similar trend. Upon comparing the rate capabilities of these electrolytes, it became evident that long-chain nitriles, particularly BN and VN, exhibited superior lithium removal capacity as the discharge rate increases. Notably, at a high discharge rate of 20C (Fig. 4d), the graphite‖NCM523 pouch cells utilizing BN and VN groups achieved capacity retention rates of 90.54% (BN) and 89.84% (VN), respectively. This performance surpassed that of the cell using the EC group. It was worth noting that the pouch cell using the AN group demonstrated a notably lower capacity retention rate compared to the other electrolytes. This can be attributed to AN having the lowest LUMO value, rendering it more prone to reacting with the intercalated lithium in the graphite. The cycle performance result of graphite‖NCM523 pouch cells at room temperature is shown in Fig. 3f. The results revealed that the cycle stability of the nitrile groups was enhanced with increasing carbon chain length. Specifically, as the number of carbon atoms in the nitrile solvent was ≥4, the cycle stability of the nitrile groups surpassed that of the EC group. During cycling at a rate of 3C at room temperature, corresponding to the cell capacity retention rate of 80%, the cycle counts for AN, BN, VN, and EC groups were 104, 305, 388, and 180, respectively. This indicated that long-chain nitrile groups, such as BN and VN, exhibited superior cycle stability at room temperature.
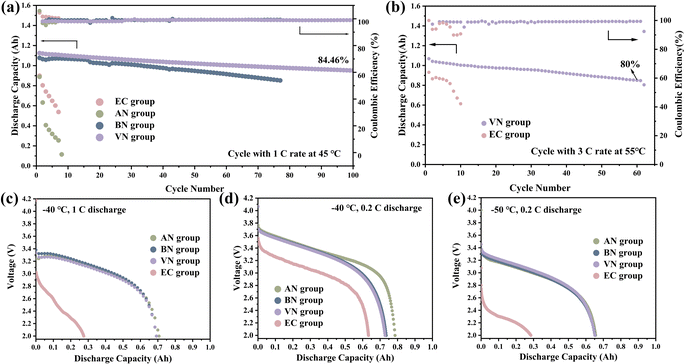
The high temperature cycling performance further proved the advantages of the nitrile group over the EC group. Additionally, the VN group-based pouch cell exhibited the best cycling stability. Specifically, at 1C rate and 45 °C (Fig. 5a), the pouch cell with the VN group showed a capacity retention of 84.46% after 100 cycles. In contrast, the cycle performances of the EC group and AN group were significantly inferior, exhibiting substantial capacity decay within just 20 cycles. The above results further confirmed that the cycling stability of the nitrile group was improved with the increase in carbon chain length. Furthermore, the VN group maintained 80% of its initial capacity after 60 cycles at a 3C rate and 55 °C (Fig. 5b). The VN solvent effectively enhanced the cycling stability of the cells at a high-rate and high temperatures. Fig. 5c, d and e display the discharge capacities of various electrolytes at −40 °C and 1C, −40 °C and 0.2C, and −50 °C and 0.2C, respectively. It was clearly demonstrated that the low-temperature discharge capacity retention rates of nitrile groups were considerably higher than those of the EC group. Specifically, at −50 °C and 0.2C, the discharge capacity retention rates for AN, BN, VN, and EC groups were 65.56%, 65.20%, 65.12%, and 28.48%, respectively (Fig. 5e). Higher discharge capacity at low temperatures indicated that nitrile groups possessed superior transport kinetics.42 As shown in Fig. S8,† the AN group exhibited the smallest ohmic internal resistance and charge transfer impedance, and the result was consistent with the conclusion drawn from the low-temperature discharge performance, revealing that the AN group exhibited the lowest ohmic internal resistance, corresponding to its highest discharge capacity. Additionally, the ohmic internal resistance increases with the lengthening of the carbon chain, and the low-temperature discharge capacity also exhibited a decreasing trend with the increase in carbon chain length.
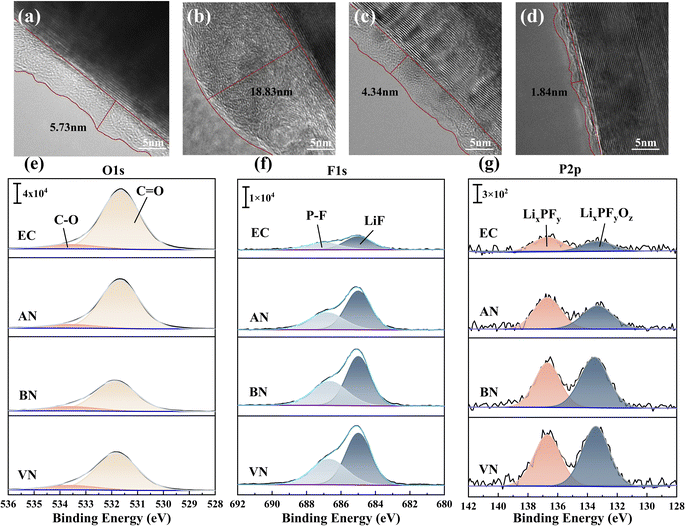
Scanning electron microscopy (SEM) was used to elucidate the evolution of the graphite electrode morphology in various electrolytes. Fig. S9† shows that the particles on the surface of the graphite electrodes after capacity grading were clearly visible and there was no coating layer. After 10 cycles at 1C, a thick coating layer covered the particles on the original surface of the anode using the AN group. The graphite electrodes using EC, BN and VN groups did not show significant changes in surface morphology. This disparate behavior was attributed to the low LUMO potential and compromised reduction stability of AN, which resulted in its continuous decomposition and the concomitant thickening of the SEI film during cycling. Transmission electron microscopy (TEM) was employed to further elucidate the thickness of the graphite SEI film formed by different electrolytes after 10 cycles at 1C, and the results are presented in Fig. 6a–d. The results indicated that the VN group exhibited the thinnest SEI film, measuring 1.84 nm, followed by the BN group with a thickness of 4.34 nm. In contrast, the SEI film formed by the EC group ranged between 5 nm and 6 nm. Notably, the SEI film generated by the AN group was found to be the thickest, exceeding 18 nm in thickness. Additionally, it was observed that the SEI film thickness for the AN group after capacity grading was only 5.01 nm (Fig. S10†). The notable increase in SEI film thickness after 10 cycles with the AN group was attributed to its continuous side reactions with the anode electrode interface, corresponding to the low LUMO value of AN and predisposition towards reduction reactions.
X-ray Photoelectron Spectroscopy (XPS) was utilized to investigate the influence of graphite electrodes on the interface chemistry. After 10 cycles, the composition of the graphite electrode interface was represented by the O1s, F1s, P2p, and N1s spectra shown in Fig. 6e–g and S11.† Fig. S11† reveals the presence of the –CN triple bond43 in the nitrile groups. However, after 10 cycles, due to the limited reduction stability of the AN group, Li3N31,44 was newly formed at the graphite electrode interface. The appearance of Li3N indicated that AN would decompose during the cycling process, resulting in the thickening of the SEI film, which in turn led to the deterioration of electrical properties including cycle stability and rate performance. The O1s spectrum of graphite electrodes (Fig. 6e) further suggested that the AN group exhibited a higher concentration of C![[double bond, length as m-dash]](https://www.rsc.org/images/entities/char_e001.gif) O double bonds compared to other nitrile groups, likely due to increased side reactions involving AN. This result was supported by evidence of a thicker SEI film and SEM images that exhibited morphological changes after both capacity grading and cycling in the AN group. The F1s spectrum of graphite electrodes (Fig. 6f) predominantly showed LiF and P–F components.45 LiF arose from the decomposition of FEC and PF6−. A comparative analysis of peak intensities and areas revealed that the SEI film in the nitrile group contained higher amounts of LiF compared to the EC group. Consequently, nitrile solvents induced the formation of an electrolyte film at the electrode interface, which was rich in PF6− decomposition products and the inorganic component LiF. This film effectively suppressed continuous interfacial side reactions during cycling, enhancing the stability of electrode interfaces. Additionally, it facilitated rapid lithium-ion diffusion through the SEI, leading to improved rate performance and low-temperature performance of LIBs.32,41,46,47 The P2p spectrum of the graphite SEI film (Fig. 6g) indicated that the SEI formed in nitrile groups was enriched with PF6− decomposition products, specifically LixPFy and LixPFyOz.48 This enrichment was attributed to the increased participation of PF6− in coordination within the nitrile group, promoting its involvement in the formation of the SEI film.
O double bonds compared to other nitrile groups, likely due to increased side reactions involving AN. This result was supported by evidence of a thicker SEI film and SEM images that exhibited morphological changes after both capacity grading and cycling in the AN group. The F1s spectrum of graphite electrodes (Fig. 6f) predominantly showed LiF and P–F components.45 LiF arose from the decomposition of FEC and PF6−. A comparative analysis of peak intensities and areas revealed that the SEI film in the nitrile group contained higher amounts of LiF compared to the EC group. Consequently, nitrile solvents induced the formation of an electrolyte film at the electrode interface, which was rich in PF6− decomposition products and the inorganic component LiF. This film effectively suppressed continuous interfacial side reactions during cycling, enhancing the stability of electrode interfaces. Additionally, it facilitated rapid lithium-ion diffusion through the SEI, leading to improved rate performance and low-temperature performance of LIBs.32,41,46,47 The P2p spectrum of the graphite SEI film (Fig. 6g) indicated that the SEI formed in nitrile groups was enriched with PF6− decomposition products, specifically LixPFy and LixPFyOz.48 This enrichment was attributed to the increased participation of PF6− in coordination within the nitrile group, promoting its involvement in the formation of the SEI film.
The NCM523 electrode morphology (Fig. S12† and 7a–d) remained largely unaffected by the electrolyte type, showing no significant changes after 1 cycle or after 10 cycles. This observation suggested that the electrolyte exerted minimal influence on the NCM523 electrode morphology. The composition of the NCM523 electrode interface was also subjected to analysis (Fig. 7e–g). In comparison to the EC group, the NCM523 electrodes formed in the presence of a nitrile group contained higher amounts of inorganic lithium salts, specifically LiF, and phosphates containing phosphorus. Such components had been demonstrated to enhance battery performance aspects such as rate capability, low-temperature operation, and cycle life.49,50 Examination of the O1s spectrum revealed that nitrile groups exhibited a lower concentration of M–O bonds49,51,52 when compared to the EC group. This difference could be attributed to the adsorption effect of nitrile solvents on transition metals, which effectively mitigated their leaching. In addition, the NCM523 electrodes of nitrile groups after 10 cycles revealed a notable trend. Specifically, the decomposition products of PF6− (LixPFy and LixPFyOz) showed a decreasing trend with an increase in the carbon chain length of the electrolytes. This observation contrasted with the results obtained for the graphite electrode. This difference could be explained by the distinct decomposition mechanisms of PF6− at the NCM523 electrodes and graphite electrodes. At the NCM523 electrodes, PF6− underwent an oxidation reaction, and an increase in free PF6− ions facilitated this reaction. Infrared analysis further supported this finding, indicating a gradual increase in coordinated PF6− and a corresponding decrease in free PF6− with increasing carbon chain length. Consistent with this trend, the content of LiF in the F1s spectrum also decreased with increasing carbon chain length. This behavior could be attributed to the fact that LiF formation at the NCM523 electrode primarily results from the oxidation reaction between FEC and PF6−. FEC, however, possessed a low HOMO value, making it less susceptible to oxidation. As a result, PF6− became the primary source of LiF formation. Consequently, the content of LiF exhibited a similar trend to that observed in the P2p spectrum.
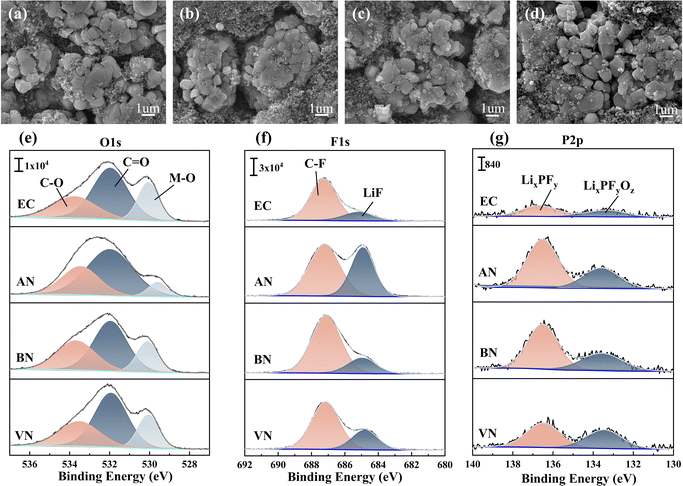 | ||
| Fig. 7 NCM523 electrode morphology of different electrolytes: (a–d) EC, AN, BN, and VN groups, after 10 cycles; XPS of NCM523 electrodes: (e–g) O1s, F1s, and P2p spectra after 10 cycles. | ||
Conclusion
This study designed novel LIB electrolytes utilizing nitrile solvents with diverse carbon chain lengths, aiming to establish the feasibility of substituting EC solvents with nitrile solvents. It was noted that VN not only significantly enhanced the ionic conductivity of the electrolyte but also effectively diminished the de-solvation energy of Li+. The high LUMO potential of VN provided robust support for ensuring high cycle stability in LIBs. Experimental findings revealed that the VN group exhibited notable cycle stability in the graphite‖NCM523 pouch cell, maintaining a capacity retention rate of 80% even after 388 cycles. Remarkably, even under extreme low-temperature conditions (−50 °C), the full cell utilizing the VN group still retained a capacity retention of 65.12% at room temperature. Additionally, it demonstrated excellent high-rate cycle stability even at high temperatures (55 °C). In conclusion, this research not only introduced novel concepts for designing high-performance LIB electrolytes but also provided valuable practical insights and a theoretical foundation for the application of nitrile solvents in the electrolyte field.Experimental section
Sample preparation
The lithium salt LiPF6 and electrolyte solvents EC, EP, FEC, AN, BN, VN, and VC were purchased from Aladdin reagent network. All the solvents were mixed with molecular sieves to remove the trace water. The following electrolytes were prepared in an M. Braun MB-200MOD glovebox filled with Ar gas. The EC group is 1.2 mol per L LiPF6 in EC/EP/FEC with a volume ratio of 3![[thin space (1/6-em)]](https://www.rsc.org/images/entities/char_2009.gif) :
:![[thin space (1/6-em)]](https://www.rsc.org/images/entities/char_2009.gif) 6
6![[thin space (1/6-em)]](https://www.rsc.org/images/entities/char_2009.gif) :
:![[thin space (1/6-em)]](https://www.rsc.org/images/entities/char_2009.gif) 1, with 1.5% of the weight ratio of VC added. The nitrile group is 1.2 mol per L LiPF6 in nitrile/EP/FEC with a volume ratio of 3
1, with 1.5% of the weight ratio of VC added. The nitrile group is 1.2 mol per L LiPF6 in nitrile/EP/FEC with a volume ratio of 3![[thin space (1/6-em)]](https://www.rsc.org/images/entities/char_2009.gif) :
:![[thin space (1/6-em)]](https://www.rsc.org/images/entities/char_2009.gif) 6
6![[thin space (1/6-em)]](https://www.rsc.org/images/entities/char_2009.gif) :
:![[thin space (1/6-em)]](https://www.rsc.org/images/entities/char_2009.gif) 1, with 1.5% of the weight ratio of VC added.
1, with 1.5% of the weight ratio of VC added.
Electrochemical measurements
The charge–discharge tests of LIBs were conducted by using a Neware CT-ZWJ-4'S-T-1U. The low-temperature and high-temperature electrochemical performances of full cells were measured in a constant temperature test box by using a high and low temperature alternating cycle test chamber. The graphite‖NCM523 pouch cells (no electrolyte) were provided by Hunan Boltpower New Energy Co., Ltd. Graphite and NCM523 were provided by Jilin Juneng Advanced Carbon Materials Co., Ltd and Green Beauty (Wuxi) Energy Materials Co., Ltd, respectively. The anode is composed of 94.5% graphite, 2% SP, 3% LA133, and 0.5% CMC, and the cathode is composed of 94.2% NCM523, 3% SP, 0.6% ECP-600JD, and 2.2% PVDF. The mass loading of the anode was 8.6 ± 0.1 mg cm2, while that of the cathode was 17.6 ± 0.2 mg cm2. The electrolyte injection content of each full cell is 4.5 g. After electrolyte injection, the pouch cell (Fig. 4e) was left to stand for 24 hours for formation. The formation process was as follows: charge at a constant current of 0.1C to 4.2 V, followed by discharging to 3.0 V.Material characterization
The viscosity of the electrolyte was measured using a falling ball viscometer (Anton Paart Lovis 2000 M). Nuclear magnetic resonance (NMR) spectroscopy was performed on the electrolyte using a Bruker 600 MHz spectrometer in Germany. The ion diffusion coefficient of the electrolyte was obtained through the final processing of the NMR data. The ionic conductivity of the electrolyte was measured by using a conductivity meter (LeiCi DDS-307A) at temperatures from 25 °C to −50 °C. FT-IR spectra were collected by using a Thermo Scientific Nicolet iS50 FT-IR. XPS was conducted by using Kratos's AXIS SUPRA+ (use an Al target material, voltage 15 kV, full spectrum current 5 mA, power 75 W, fine spectrum current 10 mA, power 150 W). SEM tests were conducted by using a Jeol JSM-IT700HR. TEM images were collected by using a JEM-F200 from JEOL (shooting voltage: 200 kV, high resolution magnification: 1.5 million times).Computational details
DFT calculations were performed to optimize geometries of solvent molecules using the Gaussian 16 package at the B3LYP/6-311+G(d,p) level of theory. Atomic partial charges were calculated using the ChelpG method. Atomistic force field parameters are taken from ref. 53, and the cross-interactions between different atom types are obtained from the Lorentz–Berthelot combination rule.Two modeling systems are constructed. Atomistic simulations were performed using the GROMACS package with periodic boundary conditions. The atom motions were integrated using the Verlet integration algorithm with a time step of 1.0 fs. A cutoff radius of 1.6 nm was set for short-range vdW interactions and electrostatic interactions. The PME method was used to handle long range electrostatic interactions in reciprocal space. Simulation systems were energetically minimized and thereafter annealed from 600 to 300 K within 10 ns. These systems were equilibrated in the NPT ensemble for 20 ns using the Nosé–Hoover thermostat and a Parrinello–Rahman barostat with time coupling constants of 0.4 and 0.2 ps, respectively. Atomistic simulations were further performed in a NVT ensemble for 50 ns for further structural and dynamical analyses.
Representative structures extracted from atomistic simulations were adopted to perform DFT calculations using Gaussian 16 software at the same level of theory with Grimme's-D3 dispersion correction to obtain LUMO–HOMO energies and de-solvation energies.
Data availability
The data of this article, including the original Excel file, Origin drawing data, theoretical calculation results, etc., can be found in the [Science Data Bank] of [URL-format https://doi.org/10.57760/sciencedb.10909].Author contributions
Zhongming Wang: experimental design, data analysis, data processing, thesis writing, review comment reply. Zhiyuan He: data analysis, data processing. Zhongsheng Wang: data analysis, data processing. Jixu Yang: data analysis. Kecheng Long: data analysis. Zhibin Wu: data analysis. Gang Zhou: data analysis. Lin Mei and Libao Chen: data analysis, financial support, review comment reply.Conflicts of interest
The authors declare that they have no known competing financial interests or personal relationships that could have appeared to influence the work reported in this paper.Acknowledgements
We are thankful for the support from the National Natural Science Foundation of China (92372117), Innovation-Driven Project of Central South University (Grant No. 2023CXQD024), and the Natural Science Foundation of Hunan Province (Grant No. 2022JJ20068).References
- D. Larcher and J. M. Tarascon, Nat. Chem., 2015, 7, 19–29 CrossRef CAS PubMed.
- K. Xu, Nat. Energy, 2021, 6, 763 CrossRef CAS.
- X. Wang, L. Yang, N. Ahmad, L. Ran, R. Shao and W. Yang, Adv. Mater., 2023, 35, 2209140 CrossRef CAS PubMed.
- K. Long, S. Huang, H. Wang, A. Wang, Y. Chen, Z. Liu, Y. Zhang, Z. Wu, W. Wang and L. Chen, Energy Environ. Sci., 2024, 17, 260–273 RSC.
- H. Chen, K. Chen, J. Yang, B. Liu, L. Luo, H. Li, L. Chen, A. Zhao, X. Liang, J. Feng, Y. Fang and Y. Cao, J. Am. Chem. Soc., 2024, 146, 15751–15760 CrossRef CAS PubMed.
- R. Jung, F. Linsenmann, R. Thomas, J. Wandt, S. Solchenbach, F. Maglia, C. Stinner, M. Tromp and H. A. Gasteiger, J. Electrochem. Soc., 2019, 166, A378–A389 CrossRef CAS.
- S. Jiang, X. Xu, J. Yin, H. Wu, X. Zhu, H. Guan, L. Wei, K. Xi, Y. Lan, L. Zhang, Y. Qiu and Y. Gao, Chem. Eng. J., 2023, 451, 138359 CrossRef CAS.
- Q. Li, G. Liu, H. Cheng, Q. Sun, J. Zhang and J. Ming, Chem.–Eur. J., 2021, 27, 15842–15865 CrossRef CAS PubMed.
- X. Liu, T. Zhang, X. Shi, Y. Ma, D. Song, H. Zhang, X. Liu, Y. Wang and L. Zhang, Advanced Science, 2022, 9, 2104531 CrossRef CAS PubMed.
- D. Hubble, D. E. Brown, Y. Zhao, C. Fang, J. Lau, B. D. McCloskey and G. Liu, Energy Environ. Sci., 2022, 15, 550–578 RSC.
- M. Zhang, X. Lei, Y. Lv, X. Liu and Y. Ding, Chin. J. Chem., 2021, 39, 2801–2807 CrossRef CAS.
- M.-T. F. Rodrigues, G. Babu, H. Gullapalli, K. Kalaga, F. N. Sayed, K. Kato, J. Joyner and P. M. Ajayan, Nat. Energy, 2017, 2, 1–14 Search PubMed.
- Y. Wang, Z. Cao, Z. Ma, G. Liu, H. Cheng, Y. Zou, L. Cavallo, Q. Li and J. Ming, ACS Energy Lett., 2023, 8, 1477–1484 CrossRef CAS.
- L. Yu, S. Chen, H. Lee, L. Zhang, M. H. Engelhard, Q. Li, S. Jiao, J. Liu, W. Xu and J.-G. Zhang, ACS Energy Lett., 2018, 3, 2059–2067 CrossRef CAS.
- J. Xu, X. Wang, N. Yuan, J. Ding, S. Qin, J. M. Razal, X. Wang, S. Ge and Y. Gogotsi, Energy Storage Mater., 2019, 23, 383–389 CrossRef.
- Y. Wang, X. Chang, Z. Li, Y. Mei, Y. Zhang, L. Liu, K. Wang, H. Gu and L. Li, Adv. Funct. Mater., 2023, 33, 2208329 CrossRef CAS.
- R. Hou, S. Guo and H. Zhou, Adv. Energy Mater., 2023, 13, 2300053 CrossRef CAS.
- N. Ohba, S. Ogata and R. Asahi, J. Phys. Chem. C, 2019, 123, 9673–9679 CrossRef CAS.
- S. Lei, Z. Zeng, H. Yan, M. Qin, M. Liu, Y. Wu, H. Zhang, S. Cheng and J. Xie, Adv. Funct. Mater., 2023, 33, 2301028 CrossRef CAS.
- M. C. Smart, B. V. Ratnakumar and S. Surampudi, J. Electrochem. Soc., 2002, 149, A361–A370 CrossRef CAS.
- M. Qin, Z. Zeng, Q. Wu, X. Liu, Q. Liu, S. Cheng and J. Xie, J. Energy Chem., 2023, 85, 49–57 CrossRef CAS.
- G. Song, Z. Yi, F. Su, L. Xie, Z. Wang, X.-X. Wei, G. Xu and C.-M. Chen, ACS Energy Lett., 2023, 8, 1336–1343 CrossRef CAS.
- Q. Hou, P. Li, Y. Qi, Y. Wang, M. Huang, C. Shen, H. Xiang, N. Li and K. Xie, ACS Energy Lett., 2023, 8, 3649–3657 CrossRef CAS.
- X. Zhou, D. Peng, K. Deng, H. Chen, H. Zhou and J. Wang, J. Power Sources, 2023, 557, 232557 CrossRef CAS.
- S. Lei, Z. Zeng, M. Liu, H. Zhang, S. Cheng and J. Xie, Nano Energy, 2022, 98, 107265 CrossRef CAS.
- Y. Yamada, K. Furukawa, K. Sodeyama, K. Kikuchi, M. Yaegashi, Y. Tateyama and A. Yamada, J. Am. Chem. Soc., 2014, 136, 5039–5046 CrossRef CAS PubMed.
- N. Matsuoka, H. Kamine, Y. Natsume and A. Yoshino, Chemelectrochem, 2021, 8, 3095–3104 CrossRef CAS.
- K. Chen, X. Shen, L. Luo, H. Chen, R. Cao, X. Feng, W. Chen, Y. Fang and Y. Cao, Angew. Chem., Int. Ed., 2023, 62(47), e202312373 CrossRef CAS PubMed.
- H. Chen, K. Chen, L. Luo, X. Liu, Z. Wang, A. Zhao, H. Li, X. Ai, Y. Fang and Y. Cao, Angew. Chem., Int. Ed., 2024, 63, e202316966 CrossRef CAS PubMed.
- X. Huang, R. Li, C. Sun, H. Zhang, S. Zhang, L. Lv, Y. Huang, L. Fan, L. Chen, M. Noked and X. Fan, ACS Energy Lett., 2022, 7, 3947–3957 CrossRef CAS.
- L. Luo, K. Chen, H. Chen, H. Li, R. Cao, X. Feng, W. Chen, Y. Fang and Y. Cao, Adv. Mater., 2023, 2308881, DOI:10.1002/adma.202308881.
- P. Bai, X. Ji, J. Zhang, W. Zhang, S. Hou, H. Su, M. Li, T. Deng, L. Cao, S. Liu, X. He, Y. Xu and C. Wang, Angew. Chem., Int. Ed., 2022, 61, e202202731 CrossRef CAS PubMed.
- J. Zhang, M. Zhou, J. Shi, Y. Zhao, X. Wen, C.-C. Su, J. Wu and J. Guo, Nano Energy, 2021, 88, 106298 CrossRef CAS.
- R. Rohan, T.-C. Kuo, J.-H. Lin, Y.-C. Hsu, C.-C. Li and J.-T. Lee, J. Phys. Chem. C, 2016, 120, 6450–6458 CrossRef CAS.
- C. Fu, Y. Ma, S. Lou, C. Cui, L. Xiang, W. Zhao, P. Zuo, J. Wang, Y. Gao and G. Yin, J. Mater. Chem. A, 2020, 8, 2066–2073 RSC.
- Q. Li, G. Liu, H. Cheng, Q. Sun, J. Zhang and J. Ming, Chem.–Eur. J., 2021, 27, 15842–15865 CrossRef CAS PubMed.
- Q. Pang, A. Shyamsunder, B. Narayanan, C. Y. Kwok, L. A. Curtiss and L. F. Nazar, Nat. Energy, 2018, 3, 783–791 CrossRef CAS.
- Y. Zou, G. Liu, Y. Wang, Q. Li, Z. Ma, D. Yin, Y. Liang, Z. Cao, L. Cavallo, H. Kim, L. Wang, H. N. N. Alshareef, Y.-K. Sun and J. Ming, Adv. Energy Mater., 2023, 2300443, DOI:10.1002/aenm.202300443.
- Y. Kang, J. Wang, M. Wang, X. Tang, Z. Cao, C. Wang, Q. Shi, Y. Qian and Y. Deng, ACS Appl. Energy Mater., 2020, 3, 9989–10000 CrossRef CAS.
- D.-J. Yoo, Q. Liu, O. Cohen, M. Kim, K. A. A. Persson and Z. Zhang, Adv. Energy Mater., 2023, 13, 2204182 CrossRef CAS.
- Y. Zou, Z. Ma, G. Liu, Q. Li, D. Yin, X. Shi, Z. Cao, Z. Tian, H. Kim, Y. Guo, C. Sun, L. Cavallo, L. Wang, H. N. Alshareef, Y.-K. Sun and J. Ming, Angew. Chem., Int. Ed., 2023, 62, e202216189 CrossRef CAS PubMed.
- J. Yang, K. Long, Z. Guo, Y. Cui, C. Ling, Z. Wu, F. Wu, W. Wei, Y. Chen, X. Ji, L. Mei and L. Chen, Chem. Eng. J., 2023, 473, 145455 CrossRef CAS.
- D. Marton, K. J. Boyd, A. H. Al-Bayati, S. S. Todorov and J. W. Rabalais, Phys. Rev. Lett., 1994, 73, 118–121 CrossRef CAS PubMed.
- D. Lu, R. Li, M. M. Rahman, P. Yu, L. Lv, S. Yang, Y. Huang, C. Sun, S. Zhang, H. Zhang, J. Zhang, X. Xiao, T. Deng, L. Fan, L. Chen, J. Wang, E. Hu, C. Wang and X. Fan, Nature, 2024, 627, 101–107 CrossRef CAS PubMed.
- G. Liu, M. Xia, J. Gao, Y. Cheng, M. Wang, W. Hong, Y. Yang and J. Zheng, ACS Appl. Mater. Interfaces, 2023, 15, 3586–3598 CrossRef CAS PubMed.
- Y. Mo, G. Liu, Y. Yin, M. Tao, J. Chen, Y. Peng, Y. Wang, Y. Yang, C. Wang, X. Dong and Y. Xia, Adv. Energy Mater., 2023, 2301285, DOI:10.1002/aenm.202301285.
- L. Luo, K. Chen, R. Cao, H. Chen, M. Xia, A. Zhao, X. Chen, W. Chen, Z. Chen, Y. Fang and Y. Cao, Energy Storage Mater., 2024, 70, 103438 CrossRef.
- A. M. Andersson, D. P. Abraham, R. Haasch, S. MacLaren, J. Liu and K. Amine, J. Electrochem. Soc., 2002, 149, A1358–A1369 CrossRef CAS.
- W. Lv, C. Zhu, J. Chen, C. Ou, Q. Zhang and S. Zhong, Chem. Eng. J., 2021, 418, 129400 CrossRef CAS.
- F. Meng, X. Xiong, L. Tan, B. Yuan and R. Hu, Energy Storage Mater., 2022, 44, 390–407 CrossRef.
- N. Nitta, F. Wu, J. T. Lee and G. Yushin, Mater. Today, 2015, 18, 252–264 CrossRef CAS.
- Y. Qian, Y. Chu, Z. Zheng, Z. Shadike, B. Han, S. Xiang, Y. Kang, S. Hu, C. Cao, L. Zhong, Q. Shi, M. Lin, H. Zeng, J. Wang, E. Hu, C. Weiland, X.-Q. Yang and Y. Deng, Energy Storage Mater., 2022, 45, 14–23 CrossRef.
- Y.-L. Wang, F. U. Shah, S. Glavatskih, O. N. Antzutkin and A. Laaksonen, J. Phys. Chem. B, 2014, 118, 8711–8723 CrossRef CAS PubMed.
Footnote |
| † Electronic supplementary information (ESI) available. See DOI: https://doi.org/10.1039/d4sc03890h |
| This journal is © The Royal Society of Chemistry 2024 |

