 Open Access Article
A novel NIR fluorescent probe for copper(II) imaging in Parkinson's disease mouse brain†
Jianmei
Chen
a,
Rongqing
Luo
a,
Shuang
Li
a,
Jinping
Shao
a,
Ting
Wang
a,
Shumei
Xie
a,
Li
Xu
*ac,
Qiuyun
You
*acd,
Shumin
Feng
 *ac and
Guoqiang
Feng
 *b
*b
aSchool of Pharmacy, Hubei University of Chinese Medicine, Wuhan 430065, China. E-mail: 2997@hbucm.edu.cn; 1471@hbucm.edu.cn; fsm3318@hbucm.edu.cn
bKey Laboratory of Pesticide and Chemical Biology of Ministry of Education, College of Chemistry, Central China Normal University, 152 Luoyu Road, Wuhan 430079, PR China. E-mail: gf256@mail.ccnu.edu.cn
cHubei Shizhen Laboratory, Hubei University of Chinese Medicine, Wuhan 430065, China
dEngineering Research Center of TCM Protection Technology and New Product Development for the Elderly Brain Health, Ministry of Education, Wuhan 430065, China
First published on 22nd July 2024
Abstract
Abnormal copper ion (Cu2+) levels are considered to be one of the pathological factors of Parkinson's disease (PD), but the internal relationship between Cu2+ and PD progression remains elusive. Visualizing Cu2+ in the brain will be pivotal for comprehending the underlying pathophysiological processes of PD. In this work, a near-infrared (NIR) fluorescent probe, DDAO-Cu, capable of detecting Cu2+ with exceptional sensitivity (about 1.8 nM of detection limit) and selectivity, rapid response (<3 min), and deep tissue penetration, was designed for quantification and visualization of the Cu2+ level. It could detect not only Cu2+ in cells but also the changes in the Cu2+ level in the rotenone-induced cell and zebrafish PD models. Moreover, DDAO-Cu can cross the blood–brain barrier to image Cu2+ in the brain of PD model mice. The imaging result showed a significant increase in Cu2+ levels in brain regions of PD model mice, including the cerebral cortex, hippocampus, and striatum. Meanwhile, Cu2+ levels in the substantia nigra region were significantly reduced in PD model mice. It revealed the nuanced relationship of Cu2+ levels in different brain regions in the disease and indicated the pathological complexity of PD. Overall, DDAO-Cu represents a novel and practical tool for investigating Cu2+-related physiological and pathological processes underlying Parkinson's disease.
Introduction
Parkinson's disease (PD) ranks as the second most prevalent neurodegenerative disorder, characterized by the specific loss of dopaminergic neurons in the substantia nigra (SN) and striatum (STR).1 Predominantly affecting the motor system, particularly among the elderly population, PD presents with symptoms such as bradykinesia, muscle rigidity, resting tremor, and postural instability.2,3 Despite notable progress in understanding PD, its precise pathogenesis remains elusive, posing challenges for accurate diagnosis and treatment. However, emerging evidence underscores a correlation between copper homeostasis and neuroinflammation in PD.4 Copper ions (Cu2+) can exacerbate α-synuclein aggregation in the substantia nigra, trigger mitochondrial dysfunction, and precipitate the degeneration of dopaminergic neurons, thereby hastening the progression of Parkinson's disease to a certain extent.5,6 Although the level of Cu2+ in the cerebral cortex and cerebrospinal fluid (CSF) is significantly increased with the progression of PD,7 due to the complexity of the brain system, the relationship between PD and Cu2+ still needs to be further explored. Therefore, developing a dependable and effective method for visualizing Cu2+ levels in PD models and clarifying the level of Cu2+ in PD is of great importance for understanding the pathogenesis of Parkinson's disease.Several methods for detecting Cu2+in vivo have been reported, including synchrotron radiation X-ray fluorescence,8 photoacoustic imaging,9 MRI10 and fluorescence analysis.11 Among these methods, fluorescence analysis stands out for its high sensitivity, and capability for high spatial and temporal resolution imaging,12 especially near-infrared (NIR) fluorescence, which can minimize autofluorescence interference, enabling deep tissue penetration13 and rendering it ideal for the in situ and real-time detection of various biomolecules in PD mice. Numerous NIR probes have been developed to detect reactive oxygen species (ROS), biothiols, hydrogen sulfide (H2S), nitric oxide (NO), and α-synuclein aggregation,14–18 contributing to the understanding of PD pathogenesis. However, due to NIR fluorescence characteristics, most NIR fluorescent probes have a large conjugated structure and high molecular weight, which makes it difficult to penetrate the blood–brain barrier (BBB) for in situ brain imaging in vivo.19 In addition, due to the low Cu2+ level in the brain,20 the design of turn-on NIR fluorescent probes capable of traversing the BBB for non-invasive detection of Cu2+ in the brain remains an immense challenge.
1,3-Dichloro-7-hydroxy-9,9-dimethylacridin-2(9H)-one (DDAO) serves as a NIR fluorophore with low molecular weight, high quantum yield (Φ = 0.39 in PBS buffer),21 and extensive utility in fluorescent probe design for in vivo imaging. In this study, we present a novel colorimetric and NIR fluorescent probe, termed DDAO-Cu (Scheme 1).
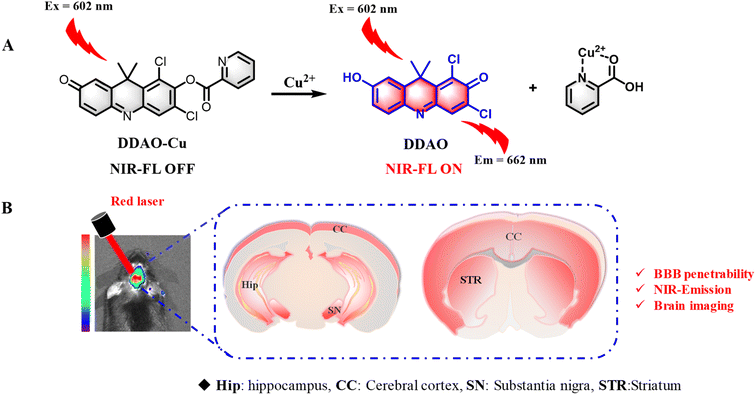 | ||
| Scheme 1 (A) Fluorescent probe DDAO-Cu for the detection of Cu2+. (B) Schematic illustration of imaging of Cu2+ in the PD mouse brain using DDAO-Cu. | ||
This probe utilizes DDAO as the NIR fluorophore and incorporates a picolinate moiety as the reaction site for Cu2+. Notably, DDAO-Cu exhibited remarkable selectivity and sensitivity (LOD = 1.8 nM) for the detection of Cu2+ in an aqueous solution (pH 7.4, HEPES buffer, 0.5% DMSO). Furthermore, DDAO-Cu demonstrated its utility for the first time in illustrating the overproduction of endogenous Cu2+ in cellular and zebrafish PD models. And finally, DDAO-Cu exhibited good blood–brain barrier permeability and tremendous ability for in situ real-time detection of Cu2+ in PD cells and animal models. To our knowledge, DDAO-Cu is the first reported turn-on NIR fluorescent probe capable of detecting Cu2+ in PD models, providing further insights into the elevated Cu2+ levels observed in PD.
Experimental
Instruments and materials can be found in the ESI.†Synthesis of DDAO-Cu
DDAO (184 mg, 0.6 mmol) and Et3N (204 mg, 1.2 mmol) were dissolved in dry DCM (30 mL), and then 2-pyridinecarbonyl chloride (170 mg, 1.2 mmol) was added. After stirring for about 2 h, the solvent was removed, and the crude powder was washed with mixed solvent (PE/THF 6![[thin space (1/6-em)]](https://www.rsc.org/images/entities/char_2009.gif) :
:![[thin space (1/6-em)]](https://www.rsc.org/images/entities/char_2009.gif) 1, v/v) twice to afford DDAO-Cu as a yellow solid (102 mg, yield 41%). Mp: 178–179 °C. 1H NMR (400 MHz, CDCl3) δ 8.88 (d, J = 4.6 Hz, 1H), 8.31 (d, J = 7.7 Hz, 1H), 8.01–7.94 (m, 1H), 7.74 (d, J = 8.6 Hz, 1H), 7.67 (s, 1H), 7.62 (dd, J = 7.6, 4.8 Hz, 1H), 7.43 (d, J = 2.3 Hz, 1H), 7.34 (dd, J = 8.6, 2.2 Hz, 1H), 1.91 (s, 6H). 13C NMR (101 MHz, CDCl3) δ 173.19, 163.43, 153.45, 150.25, 149.96, 146.86, 140.29, 139.53, 139.45, 138.80, 137.41, 135.60, 133.14, 127.85, 126.10, 121.67, 120.08, 39.12, 26.60. ESI-MS: m/z found 413.2 (M + H+). HR-MS (ESI): calcd for C21H15Cl2N2O3+ (M + H+): 413.0454; found 413.0461.
1, v/v) twice to afford DDAO-Cu as a yellow solid (102 mg, yield 41%). Mp: 178–179 °C. 1H NMR (400 MHz, CDCl3) δ 8.88 (d, J = 4.6 Hz, 1H), 8.31 (d, J = 7.7 Hz, 1H), 8.01–7.94 (m, 1H), 7.74 (d, J = 8.6 Hz, 1H), 7.67 (s, 1H), 7.62 (dd, J = 7.6, 4.8 Hz, 1H), 7.43 (d, J = 2.3 Hz, 1H), 7.34 (dd, J = 8.6, 2.2 Hz, 1H), 1.91 (s, 6H). 13C NMR (101 MHz, CDCl3) δ 173.19, 163.43, 153.45, 150.25, 149.96, 146.86, 140.29, 139.53, 139.45, 138.80, 137.41, 135.60, 133.14, 127.85, 126.10, 121.67, 120.08, 39.12, 26.60. ESI-MS: m/z found 413.2 (M + H+). HR-MS (ESI): calcd for C21H15Cl2N2O3+ (M + H+): 413.0454; found 413.0461.
Optical studies of DDAO-Cu for Cu2+
Unless otherwise stated, all UV-vis and fluorescence spectra studies were performed at 37 °C in a 10 mM HEPES buffer (pH 7.4, with 0.5% DMSO) solution. The stock solution of DDAO-Cu (1 mM) was prepared in DMSO, and the concentration used for optical studies was maintained at 5 μM. Spectra were recorded 3 minutes after the addition of Cu2+ and other analytes. In the fluorescence collection, the excitation wavelength was set at 602 nm (slit width: dex = 2.5 nm, dem = 5 nm).Cytotoxicity evaluation
Rat pheochromocytoma (PC12) cell lines were purchased from Procell Life Science & Technology Co., Ltd and cultured in RPMI-1640 medium supplemented with 10% fetal bovine serum at 37 °C in a 5% CO2/95% air incubator. The cytotoxicity of DDAO-Cu was evaluated by incubating in PC12 cells with 0–25 μM DDAO-Cu for 24 h using the MTT assays.22Cu2+ imaging in living cells
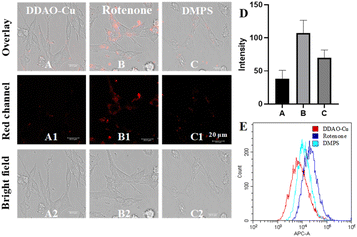
To image exogenous Cu2+, PC12 cells were treated with Cu2+ (5, 10, and 20 μM) at 37 °C for 0.5 hours, followed by incubation with DDAO-Cu for 20 minutes without washing. To image endogenous Cu2+ in cells, the PD cells were incubated with 2,3-dimercaptopropane-1-sulfonic acid sodium salt (DMPS, a metal chelating agent, 300 μM) for 30 minutes, followed by the addition of 5 μM DDAO-Cu for 20 minutes, which served as the inhibition group. PC12 cells directly treated with DDAO-Cu (5 μM, 20 minutes) served as the experimental group. PC12 cells served as the blank group. For imaging Cu2+ in the cellular PD model, PC12 cells were treated with rotenone (1 μM) for 1 hour to establish the cellular PD model.23 The PD cells directly treated with DDAO-Cu (5 μM, 20 minutes) served as the model group. Additionally, the PD cells were incubated with DMPS for 30 minutes, followed by the addition of 5 μM DDAO-Cu for 20 minutes, which served as the control group. PC12 cells directly treated with DDAO-Cu (5 μM, 20 minutes) served as the blank group. All cells were imaged without washing in the red channel (λex/λem = 561/620–680 nm). Subsequently, the cells were detached using trypsin digestion, collected, washed with PBS three times, resuspended in 400 μL PBS, and subjected to flow cytometry.Imaging the zebrafish PD model with DDAO-Cu
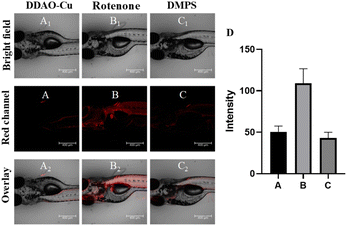
The zebrafish PD model was also established by rotenone stimulation.24 The zebrafish were treated with rotenone (1 μM) for 1 hour to induce the zebrafish PD model. The experiment comprised three groups: (1) PD zebrafish incubated with 5 μM DDAO-Cu for 10 minutes; (2) PD zebrafish incubated with DMPS for 30 minutes, washed with PBS, followed by incubation with 5 μM DDAO-Cu for 10 minutes; (3) normal zebrafish incubated with 5 μM DDAO-Cu for 10 minutes. Subsequently, all zebrafish were fixed with 1% agarose and imaged in the red channel (λex/λem = 561/620–680 nm).Establishing the PD mouse model using MPTP
l-Methyl-4-phenyl-l,2,3,6-tetrahydropyridine (MPTP) selectively induces dopaminergic neuronal damage in the substantia nigra and striatum, leading to a parkinsonian syndrome; the MPTP-induced PD model was the gold standard in PD research.25 In our study, we utilized MPTP to establish the Parkinson's mouse model, and details of the timeline of the established experimental procedure and behavioural validation methods can be found in the ESI.†In vivo imaging of the PD mouse model with DDAO-Cu
Before imaging, the fur was removed from the mouse's skull, followed by anaesthesia with 1% pentobarbital sodium (150 μL).Tail-vein injection: PD mice and age-matched wild-type mice were then subjected to tail-vein injection of DDAO-Cu (50 μM, 100 μL) for different times (10–40 min) and imaged, respectively. For tetrathiomolybdate (TTM) group mouse, the PD mice were injected with TTM (100 μM, 100 μL) for 10 min, and then subjected to tail-vein injection of DDAO-Cu (50 μM, 100 μL) for different times (10–40 min) and imaged.
Brain injection: after mice were anesthetized, the mice were fixed on a brain stereotaxic apparatus. The scalp was cut and a hole was drilled at a certain position on the skull. DDAO-Cu (2.5 μM, 2 μL) was injected into the brain using a microinjector, and then the animal imaging was conducted at 10 min following injection of DDAO-Cu.
All the mice were imaged with a small animal fluorescence imager (λex/λem: 600/660 nm).
Ex vivo fluorescence staining of DDAO-Cu to Cu2+ in mouse brain
PD mice and age-matched wild-type mice were intraperitoneally injected with 1% pentobarbital sodium and sacrificed at 30 min after injection. The brains were excised and soaked in formalin. The technical support of section production was from Hubei Biosci Biotech Co., Ltd. The sections of brain were stained with DDAO-Cu for 5 min. Subsequently, all sections were washed with PBS and the fluorescence observation was performed using a TCS SP8 (Leica, Germany) in the red channel (λex/λem = 561/620–680 nm).Results and discussion
Probe preparation
DDAO-Cu was designed based on the Cu2+-catalysed hydrolysis reaction of picolinate,26 using DDAO as the NIR fluorophore and 2-pyridine carbonyl as both a recognition unit and a fluorescence quenching moiety. The route for the synthesis of probe DDAO-Cu is outlined in Scheme S1,† wherein DDAO underwent a reaction with 2-pyridinecarbonyl chloride to afford DDAO-Cu in 41% yield. The structure of DDAO-Cu was proved by NMR and mass spectroscopy (Fig. S1–S4, ESI†).Detection of Cu2+ with DDAO-Cu
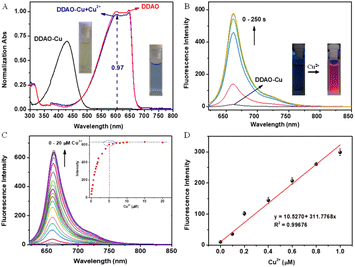
UV-vis and fluorescence spectra were employed to characterize the optical properties of DDAO-Cu for the detection of Cu2+. Fig. 1 illustrates the absorption and fluorescence responses of DDAO-Cu to Cu2+ in HEPES buffer (pH 7.4) at 37 °C, Initially, DDAO-Cu exhibited an absorption maximum at 430 nm and very weak fluorescence at 662 nm (Φ = 0.011, using cresyl violet as the standard). Upon the addition of Cu2+, the maximum absorption red-shifted to 602 nm (Fig. 1A), aligning well with the absorption maxima of DDAO, suggesting a conversion of DDAO-Cu to DDAO after the Cu2+ addition, with the conversion rate reaching 97%. Concurrently, Fig. 1B demonstrates a rapid increase in the fluorescence of DDAO-Cu at 662 nm, reaching saturation within 3 min after adding Cu2+. Fluorescence kinetics demonstrated that the NIR fluorescence saturation occurred at approximately 100 s when the Cu2+ concentration was 10 μM (Fig. S5†), and the reaction displayed a pseudo-first-order with rate constant kobs determined to be about 0.031 s−1. This result indicates that DDAO-Cu can be used for rapid detection of Cu2+. Notably, the remarkable colour changes of the DDAO-Cu solution from yellow to blue, accompanied by bright red fluorescence (inset in Fig. 1A and B), indicate the feasibility of “naked-eye” detection of Cu2+. These findings unequivocally establish DDAO-Cu as a promising turn-on NIR fluorescent probe for the rapid detection of Cu2+ in aqueous solution under mild conditions.Under the optimal conditions, we investigated the sensitivity of DDAO-Cu in detecting Cu2+. As depicted in Fig. 1C, the NIR fluorescence intensity at 662 nm exhibited a significant increase with the increasing concentration of Cu2+, reaching saturation at 5 μM. Remarkably, even at low concentrations of Cu2+, such as 0.1 μM (Fig. S6†), a substantial enhancement in the fluorescence signal was observed. Furthermore, DDAO-Cu exhibited good linear relationships in the range of 0–1.0 μM Cu2+ with R2 = 0.99676 (Fig. 1D), and the limit of detection (LOD) was calculated to be 1.8 nM (3σ/k, S/N = 3), which is far below the clinically relevant range,20 underscoring the remarkable sensitivity of DDAO-Cu to Cu2+. In addition, the NIR fluorescence emission performance of DDAO-Cu enables deep tissue penetration, facilitating imaging of Cu2+in vivo.
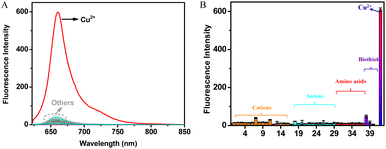
The selectivity of DDAO-Cu for Cu2+ was systematically evaluated. As shown in Fig. 2, despite the presence of various other analytes including cations (Mn2+, Li+, Sr2+, Al3+, Sn2+, Cd2+, Ni2+, Zn2+, Fe2+, Fe3+, Hg2+, Na+, K+, Ca2+, Ba2+, and NH4+), anions (SO42−, NO3−, HSO3−, CO32−, HCO3−, F−, Cl−, Br−, I−, S2O32−, C2O42−, C3H5O3−, and AcO−), amino acids (Leu, Thr, Gly, Try, Ser, Tyr, Phe, and Met), and biothiols (Hcy, Cys, GSH, and HS−) at concentrations 10 times or even 500 times higher than that of Cu2+ (10 μM), negligible changes in fluorescence were observed. In stark contrast, a significant fluorescence response was elicited exclusively in the presence of Cu2+, highlighting the exceptional selectivity of DDAO-Cu towards Cu2+. Competition experiments further demonstrated that these potentially interfering analytes showed almost no interference with Cu2+ detection (Fig. S7a†). Additionally, the influence of pH was investigated (Fig. S7b†), revealing minimal fluctuations in the fluorescence intensity of DDAO-Cu across varying pH levels. However, upon the addition of Cu2+, DDAO-Cu exhibited a notable fluorescence enhancement over a broad pH range. Remarkably, the optimal pH of DDAO-Cu in response to Cu2+ was around 7.4, indicating its aptness for detecting Cu2+ under physiological conditions and facilitating bioimaging of Cu2+.
The design rationale behind DDAO-Cu entails the incorporation of 2-pyridine carbonyl which serves to disrupt the Intramolecular Charge Transfer (ICT) process of DDAO, resulting in the quenching of its fluorescence. Upon the addition of Cu2+, a specific hydrolysis reaction with 2-pyridine carbonyl ensues, liberating a hydroxyl group and instigating a “turn-on” fluorescence response targeted at Cu2+. The validity of this mechanism was confirmed through Job's plot analyses (Fig. S8a†), which revealed a 1![[thin space (1/6-em)]](https://www.rsc.org/images/entities/char_2009.gif) :
:![[thin space (1/6-em)]](https://www.rsc.org/images/entities/char_2009.gif) 1 stoichiometry indicative of Cu2+-promoted hydrolysis as a stoichiometric rather than catalyzed reaction by Cu2+. Notably, the picolinic acid produced during the hydrolysis reaction strongly binds to Cu2+, thus impeding its reactivity and providing further evidence in support of this mechanism. As shown in Fig. S8b,† the addition of Cu2+ to the DDAO-Cu solution in the presence of picolinic acid effectively hampers the hydrolysis of DDAO-Cu, underscoring the pivotal role of Cu2+ coordination to picolinic ester in facilitating the Cu2+-promoted hydrolytic cleavage of DDAO-Cu to DDAO. These findings collectively elucidate a detailed recognition mechanism of DDAO-Cu for Cu2+. Based on the above results, a detailed recognition mechanism of probe DDAO-Cu for Cu2+ was proposed as shown in Scheme S2.† The 2-pyridinecarbonyl group, endowed with strong electron-withdrawing ability, efficiently suppresses the fluorescence of DDAO-Cu. After the specific cleavage by Cu2+, the ICT process of DDAO-Cu is reinstated, thereby enabling the “turn-on” NIR fluorescence analysis of Cu2+. The confirmation of DDAO formation by LC-MS analyses (Fig. S9†) of the reaction mixture of DDAO-Cu and Cu2+ further corroborates the proposed reaction mechanism.
1 stoichiometry indicative of Cu2+-promoted hydrolysis as a stoichiometric rather than catalyzed reaction by Cu2+. Notably, the picolinic acid produced during the hydrolysis reaction strongly binds to Cu2+, thus impeding its reactivity and providing further evidence in support of this mechanism. As shown in Fig. S8b,† the addition of Cu2+ to the DDAO-Cu solution in the presence of picolinic acid effectively hampers the hydrolysis of DDAO-Cu, underscoring the pivotal role of Cu2+ coordination to picolinic ester in facilitating the Cu2+-promoted hydrolytic cleavage of DDAO-Cu to DDAO. These findings collectively elucidate a detailed recognition mechanism of DDAO-Cu for Cu2+. Based on the above results, a detailed recognition mechanism of probe DDAO-Cu for Cu2+ was proposed as shown in Scheme S2.† The 2-pyridinecarbonyl group, endowed with strong electron-withdrawing ability, efficiently suppresses the fluorescence of DDAO-Cu. After the specific cleavage by Cu2+, the ICT process of DDAO-Cu is reinstated, thereby enabling the “turn-on” NIR fluorescence analysis of Cu2+. The confirmation of DDAO formation by LC-MS analyses (Fig. S9†) of the reaction mixture of DDAO-Cu and Cu2+ further corroborates the proposed reaction mechanism.
Imaging of Cu2+ in cellular and zebrafish PD models
Initially, the MTT method was employed to evaluate the cytotoxicity of DDAO-Cu, Notably, PC12 cells, a commonly utilized neural cell line for the study of PD,27,28 exhibited robust cell viability (87%) even after 24 hour incubation with 25 μM DDAO-Cu, indicating its low cytotoxicity (Fig. S10†). Subsequently, the capability of DDAO-Cu for imaging Cu2+ in PC12 cells was investigated, with an increase in the concentration of Cu2+, a gradual augmentation in red fluorescence was observed in the cells (Fig. S11†), suggesting the efficacy of DDAO-Cu in detecting exogenous Cu2+ in cellular environments. As shown in Fig. S12,†DDAO-Cu exhibits a weak fluorescent signal in PC12 cells, which is further diminished when the cells are pre-incubated with DMAP. This indicates the capability of DDAO-Cu to detect low levels of endogenous Cu2+, highlighting its high sensitivity. Rotenone, known to induce oxidative stress and subsequent loss of dopaminergic neurons, is frequently employed to establish a highly reproducible model of PD.29 Hence, rotenone was employed to stimulate PC12 cells; as depicted in Fig. 3, compared to the cell control (Fig. 3A), the PD model (Fig. 3B) exhibited notably heightened fluorescence. Moreover, preincubation of the PD model with DMPS resulted in a reduction in fluorescence intensity (Fig. 3C). These observations were further validated by flow cytometry experiments (Fig. 3E), confirming the intracellular accumulation of Cu2+ in the cellular PD model. Motivated by these findings, the fluorescence imaging performance was evaluated in the PD zebrafish model, which was also established using rotenone.29 As illustrated in Fig. 4, rotenone-induced PD zebrafish displayed significantly elevated fluorescence compared to normal zebrafish. Moreover, fluorescence in the DMPS group was diminished, indicating a substantial increase in Cu2+ concentration in the zebrafish PD model. Collectively, these encouraging outcomes affirm the suitability of DDAO-Cu for monitoring Cu2+ levels in both cellular and zebrafish PD models and reveal Cu2+ levels overexpressed in the PD model. Thus, DDAO-Cu can serve as an effective tool for the imaging and quantification of Cu2+, which would be of great value for revealing the role of Cu2+ in PD.Imaging of Cu2+ in the PD mouse model
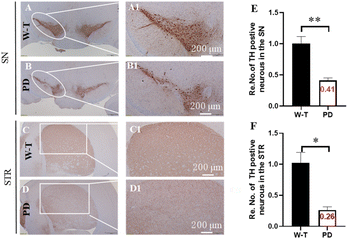
Research indicates that MPTP treatment can induce PD mouse models, and the key characteristics of PD include motor dysfunction and the loss of dopaminergic neurons projecting to the STR and SN.30–33 As illustrated in Fig. S13,† MPTP treatment prolonged the time for mice to descend in the pole test and suspension test compared to the W-T group. Additionally, in the novel object recognition test, the MPTP-treated group exhibited a significantly decreased latency to fall. The open field test was utilized to assess locomotor performance, revealing that mice injected with MPTP displayed significantly reduced total distance moved and increased resting time. These findings collectively demonstrate motor incoordination and dysfunction in MPTP-induced PD mice. Immunohistochemical analysis using Nissl staining was performed in the STR and SN,34 as shown in Fig. 5, with more than 55% loss of nigral DA-ergic neurons in the SN, and 74% loss of DA-depletion in the STR in PD mice. Combined with the motor incoordination and dysfunction performance, these indicated that the PD mice were in the advanced presymptomatic stage.To assess the BBB permeability of small molecules, a suitable oil–water partition coefficient (log![[thin space (1/6-em)]](https://www.rsc.org/images/entities/char_2009.gif) P) in the range of 1–5 is considered one of the most important indicators.35–37 First, the log
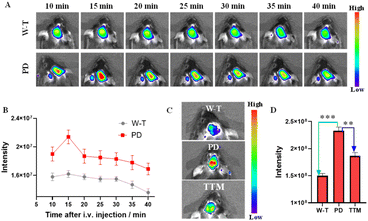
P) in the range of 1–5 is considered one of the most important indicators.35–37 First, the log![[thin space (1/6-em)]](https://www.rsc.org/images/entities/char_2009.gif) P of DDAO-Cu was measured to be ∼1.34 in the octanol–water system.38 In addition, DDAO-Cu exhibits low molecular weight (MW: 412), and weak hydrogen bonding ability (no hydroxyl, carboxyl, and other groups); these properties would facilitate DDAO-Cu to cross the blood–brain barrier (BBB) and enrich in the brain. Then, we explored the feasibility of probe DDAO-Cu to image the brain via tail vein injection, and fluorescence imaging in the brains of mice was performed for 40 min (Fig. 6A). As we can see, the fluorescence signal was enhanced in 10 min in the brain of PD mice, and with prolonging the time (>15 min), the signal faded away gradually (Fig. 6B), while the W-T mouse displayed a relatively weakly fluorescence, which faded away at 30 min. This indicates that DDAO-Cu can penetrate the blood–brain barrier and will be rapidly metabolized in the brain, possibly due to the good water solubility of DDAO and the active efflux mechanism of the BBB. After imaging, the mice were sacrificed, and the major organs, including the brain, kidney, lung, spleen, liver, and heart, were excised and imaged; as shown in Fig. S14,† the probe primarily accumulated in the liver and brain, and a small amount was found in the kidney, which may be because the brain has a high blood flow rate,39 and DDAO-Cu was cleared from the body through hepatic and renal routes. This suggests that DDAO-Cu is suitable for low-residue and non-invasive detection of Cu2+ in the brain. Then, we conducted brain FL imaging in live mice with intact skulls. As shown in Fig. 6C, compared to the W-T mice, PD mice displayed brighter fluorescence (fluorescence increased by 1.5 times), however, when TTM (a copper ion chelating agent, which can cross the BBB)40,41 was injected into the PD mice for 10 min, the fluorescence intensity was decreased, indicating that the Cu2+ level in PD mice was higher than that in W-T mice. To further indicate the elevated copper ions in the brain of PD mice, we had studied the Cu2+ content in mouse serum, and as shown in Fig. S15A,† few changes in fluorescence were observed between PD mice and W-T mice. And DDAO-Cu was injected into brain regions by intracranial injection; as shown in Fig. S15B,† the same result was found in the intracranial area compared to the control groups, which further suggests that the Cu2+ is overexpressed in the PD mouse brain.
P of DDAO-Cu was measured to be ∼1.34 in the octanol–water system.38 In addition, DDAO-Cu exhibits low molecular weight (MW: 412), and weak hydrogen bonding ability (no hydroxyl, carboxyl, and other groups); these properties would facilitate DDAO-Cu to cross the blood–brain barrier (BBB) and enrich in the brain. Then, we explored the feasibility of probe DDAO-Cu to image the brain via tail vein injection, and fluorescence imaging in the brains of mice was performed for 40 min (Fig. 6A). As we can see, the fluorescence signal was enhanced in 10 min in the brain of PD mice, and with prolonging the time (>15 min), the signal faded away gradually (Fig. 6B), while the W-T mouse displayed a relatively weakly fluorescence, which faded away at 30 min. This indicates that DDAO-Cu can penetrate the blood–brain barrier and will be rapidly metabolized in the brain, possibly due to the good water solubility of DDAO and the active efflux mechanism of the BBB. After imaging, the mice were sacrificed, and the major organs, including the brain, kidney, lung, spleen, liver, and heart, were excised and imaged; as shown in Fig. S14,† the probe primarily accumulated in the liver and brain, and a small amount was found in the kidney, which may be because the brain has a high blood flow rate,39 and DDAO-Cu was cleared from the body through hepatic and renal routes. This suggests that DDAO-Cu is suitable for low-residue and non-invasive detection of Cu2+ in the brain. Then, we conducted brain FL imaging in live mice with intact skulls. As shown in Fig. 6C, compared to the W-T mice, PD mice displayed brighter fluorescence (fluorescence increased by 1.5 times), however, when TTM (a copper ion chelating agent, which can cross the BBB)40,41 was injected into the PD mice for 10 min, the fluorescence intensity was decreased, indicating that the Cu2+ level in PD mice was higher than that in W-T mice. To further indicate the elevated copper ions in the brain of PD mice, we had studied the Cu2+ content in mouse serum, and as shown in Fig. S15A,† few changes in fluorescence were observed between PD mice and W-T mice. And DDAO-Cu was injected into brain regions by intracranial injection; as shown in Fig. S15B,† the same result was found in the intracranial area compared to the control groups, which further suggests that the Cu2+ is overexpressed in the PD mouse brain.
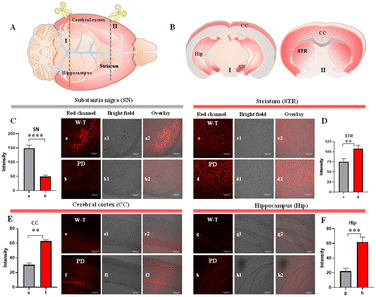
Due to the complexity of the brain centers, the concentration of Cu2+ is different in different brain areas.42 The highest concentration of Cu2+ was measured in the SN, and high levels of Cu2+ have also been detected in the hippocampus (Hip) and cerebral cortex (CC).43 To further accurately assess the level of Cu2+ in the brain, the quantitative detection ability of DDAO-Cu in different brain tissues was investigated. At first, considering that the loss of dopaminergic neurons in the SN and STR is a key characteristic of PD, Cu2+ can precipitate the degeneration of dopaminergic neurons.44,45 As illustrated in Fig. 7, compared with the PD group, stronger fluorescence in SN was observed in the W-T group, indicating low levels of Cu2+ in the SN of PD mice, which is consistent with the previously reported results.46 This further confirms the imaging capability of DDAO-Cu. However, the higher fluorescence intensity was observed in the cortex, hippocampus, and striatum of PD mice (Fig. 7); this is attributed to the elevated copper ions in the cortex, hippocampus, and striatum during the advanced stages of PD.47 In summary, the Cu2+ level in the SN of the PD mouse brain is reduced, accompanied by an increase in Cu2+ in the striatum, cerebral cortex, and hippocampus, which may provide a potential marker for the diagnosis of PD.
Conclusions
In summary, we have developed a NIR fluorescent probe (DDAO-Cu) specifically designed for imaging Cu2+ in the mouse brain. The probe can be facilely synthesized and exhibits excellent turn-on NIR fluorescence, remarkable sensitivity, and high selectivity towards Cu2+. Furthermore, we successfully applied DDAO-Cu for the visual semi-quantitative detection of Cu2+ in living cells and zebrafish, revealing elevated Cu2+ levels in both cellular and zebrafish PD models. Notably, owing to its appropriate log![[thin space (1/6-em)]](https://www.rsc.org/images/entities/char_2009.gif) P and low molecular weight, DDAO-Cu possesses the ability to cross the BBB, which can effectively image Cu2+ in MPTP-induced PD mouse models, revealing significant overall increases in Cu2+ levels. The ex-imaging data showed that Cu2+ was enriched in the cortex, hippocampus, and striatum during the advanced stages of Parkinson's disease, but suppressed in the SN region. Therefore, there is reason to believe that the Cu2+ level in PD is overall elevated. Altogether, this work represents a valuable tool for imaging and quantifying Cu2+ levels, which might help reveal the intricate role of Cu2+ in PD pathology.
P and low molecular weight, DDAO-Cu possesses the ability to cross the BBB, which can effectively image Cu2+ in MPTP-induced PD mouse models, revealing significant overall increases in Cu2+ levels. The ex-imaging data showed that Cu2+ was enriched in the cortex, hippocampus, and striatum during the advanced stages of Parkinson's disease, but suppressed in the SN region. Therefore, there is reason to believe that the Cu2+ level in PD is overall elevated. Altogether, this work represents a valuable tool for imaging and quantifying Cu2+ levels, which might help reveal the intricate role of Cu2+ in PD pathology.
Data availability
The authors confirm that the data supporting the findings of this study are available within the article [and/or its ESI†].Author contributions
J. C. carried out the experiments, analyzed the data, and wrote the original manuscript. R. L., S. L., J. S., T. W. and S. X. analyzed the data and participated in the discussion. L. X. and Q. Y. performed review & editing and project administration. S. F. and G. F. supervised the whole project & guided writing, reviewed, and edited the manuscript. All authors discussed the results and co-wrote the manuscript.Conflicts of interest
There are no conflicts to declare.Acknowledgements
This work was supported the Natural Science Foundation of Hubei Province (2023AFB376) and the National Natural Science Foundation of China (22077044).References
- B. R. Bloem, M. S. Okun and C. Klein, Lancet, 2021, 397, 2284–2303 CrossRef CAS.
- Z. Zeng, Y. Cen, L. Xiong, G. Hong, Y. Luo and X. Luo, Biol. Trace Elem. Res., 2024, 202, 955–964 CrossRef CAS PubMed.
- E. O. Olufunmilayo, M. B. Gerke-Duncan and R. M. D. Holsinger, Antioxidants, 2023, 12, 517 CrossRef CAS PubMed.
- Y. Li, C. Yang, S. Wang, D. Yang, Y. Zhang, L. Xu, L. Ma, J. Zheng, R. B. Petersen, L. Zheng, H. Chen and K. Huang, Int. J. Biol. Macromol., 2020, 163, 562–573 CrossRef CAS PubMed.
- R. Rasia, C. Bertoncini, D. Marsh, W. Hoyer, D. Cherny, M. Zweckstetter, C. Griesinger, T. Jovin and C. Fernández, Proc. Natl. Acad. Sci. U. S. A., 2005, 102, 4294–4299 CrossRef CAS.
- P. Dusek, P. M. Roos, T. Litwin, S. A. Schneider, T. P. Flaten and J. Aaseth, J. Trace Elem. Med. Biol., 2015, 31, 193–203 CrossRef CAS.
- H. Pall, A. Williams, D. Blake, J. Lunec, J. Gutteridge, M. Hall and A. Taylor, Lancet, 1987, 1, 238–241 CrossRef PubMed.
- A. D. Surowka, P. Wrobel, D. Adamek, E. Radwanska and M. Szczerbowska-Boruchowska, Metallomics, 2015, 7, 1522–1531 CrossRef CAS.
- R. V. Timoshenko, P. V. Gorelkin, A. N. Vaneev, O. O. Krasnovskaya, R. A. Akasov, A. S. Garanina, D. A. Khochenkov, T. M. Iakimova, N. L. Klyachko, T. O. Abakumova, V. S. Shashkovskaya, K. D. Chaprov, A. A. Makarov, V. A. Mitkevich, Y. Takahashi, C. R. W. Edwards, Y. E. Korchev and A. S. Erofeev, Anal. Chem., 2024, 96, 127–136 CrossRef PubMed.
- E. Falcone, M. Okafor, N. Vitale, L. Raibaut, A. Sour and P. Faller, Chem. Rev., 2021, 433, 213727 CAS.
- S. Wang, G. Yu, Y. Ma, Z. Yang, Y. Liu, J. Wang and X. Chen, ACS Appl. Mater. Interfaces, 2019, 11, 1917–1923 CrossRef CAS PubMed.
- M. Tian, Y. Ma and W. Lin, Acc. Chem. Res., 2019, 52, 2147–2157 CrossRef CAS.
- H. Li, H. Kim, F. Xu, J. Han, Q. Yao, J. Wang, K. Pu, X. Peng and J. Yoon, Chem. Soc. Rev., 2022, 51, 1795–1835 RSC.
- M. Yan, H. Fang, X. Wang, J. Xu, C. Zhang, L. Xu and L. Li, Sens. Actuators, B, 2021, 328, 129003 CrossRef CAS.
- L. Gao, W. Wang, X. Wang, F. Yang, L. Xie, J. Shen, M. A. Brimble, Q. Xiao and S. Q. Yao, Chem. Soc. Rev., 2021, 50, 1219–1250 RSC.
- L. Zhang, S. Peng, J. Sun, J. Yao, J. Kang, Y. Hu and J. Fang, Chem. Sci., 2017, 8, 2966–2972 RSC.
- Q. Sun, J. Xu, C. Ji, M. Shaibani, Z. Li, K. Lim, C. Zhang, L. Li and Z. Liu, Anal. Chem., 2020, 92, 4038–4045 CrossRef CAS PubMed.
- Z. Zheng, S. Gong, J. Zhang, Y. Liu and G. Feng, Sens. Actuators, B, 2023, 397, 134654 CrossRef CAS.
- Y. Liu, L. Teng, B. Yin, H. Meng, X. Yin, S. Huan, G. Song and X. B. Zhang, Chem. Rev., 2022, 122, 6850–6918 CrossRef CAS.
- D. R. Brown, K. F. Qin, J. W. Herms, A. Madlung, J. Manson, R. Strome, P. Fraser, T. Kruck, A. Bohlen, W. Schulz-Schaeffer, A. Giese, D. Westaway and H. Kretzschmar, Nature, 1997, 290, 684–687 CrossRef.
- Q. Xia, S. Feng, D. Liu and G. Feng, Sens. Actuators, B, 2018, 258, 98–104 CrossRef CAS.
- L. V. Rubinstein, R. H. Shoemaker, K. D. Paull, R. M. Simon, S. Tosini, P. Skehan, D. A. Scudiero, A. Monks and M. R. Boyd, J. Natl. Cancer Inst., 1990, 82, 1113–1117 CrossRef CAS PubMed.
- P. Caboni, T. B. Sherer, N. Zhang, G. Taylor, H. M. Na and J. Greenamyre, Chem. Res. Toxicol., 2004, 17, 1540–1548 Search PubMed.
- Z. Fang, Z. Su, W. Qin, H. Li, B. Fang, W. Du, Q. Wu, B. Peng, P. Li, H. Yu, L. Li and W. Huang, Chin. Chem. Lett., 2020, 31, 2903–2908 CrossRef CAS.
- B. Do Van, F. Gouel, A. Jonneaux, K. Timmerman, M. Gelé, P. Pétrault, M. Bastide, C. Laloux, C. Moreau, R. Bordet, D. Devos and J. Devedjian, Neurobiol. Dis., 2016, 94, 169–178 CrossRef CAS.
- Z. Zhou, S. Chen, Y. Huang, B. Gu, J. Li, C. Wu, P. Yin, Y. Zhang and H. Li, Biosens. Bioelectron., 2022, 198, 113858 CrossRef CAS PubMed.
- Y. Liu, X. Yang, Z. Li, Z. Liu, D. Cheng, Y. Wang, X. Wen, J. Hu, J. Liu, L. Wang and H. Wang, CNS Neurosci. Ther., 2014, 20, 76–85 CrossRef CAS PubMed.
- N. Jha, O. Jurma, G. Lalli, Y. Liu, E. Pettus, J. Greenamyre, R. Liu, H. Forman and J. Andersen, J. Biol. Chem., 2000, 275, 26096–26101 CrossRef CAS.
- P. Kabiraj, C. Valenzuela, J. Marin, D. Ramirez, L. Mendez, M. Hwang, A. Varela-Ramirez, K. Fenelon, M. Narayan and P. Skouta, Protein J., 2015, 34, 349–358 CrossRef CAS.
- K. Ito, Y. Eguchi, Y. Imagawa, S. Akai, H. Mochizuki and Y. Tsujimoto, Cell Death Discovery, 2017, 3, 17013 CrossRef PubMed.
- R. D'Amato, Z. Lipman and S. Snyder, Science, 1986, 231, 987–989 CrossRef PubMed.
- A. Mandir, S. Przedborski, V. Jackson-Lewis, Z. Wang, C. Simbulan-Rosenthal, M. Smulson, B. Hoffman, D. Guastella, V. Dawson and T. Dawson, Proc. Natl. Acad. Sci. U. S. A., 1999, 96, 5774–5779 CrossRef CAS.
- M. Ugrumov, V. Khaindrava, E. Kozina, V. Kucheryanu, E. Bocharov, G. Kryzhanovsky, V. Kudrin, V. Narkevich, P. Klodt, K. Rayevsky and T. Pronina, Neuroscience, 2011, 181, 175–188 CrossRef CAS PubMed.
- K. Wu, X. Wang, L. Gong, X. Zhai, K. Wang, X. Qiu, H. Zhang, Z. Tang, H. Jiang and X. Wang, Biosens. Bioelectron., 2023, 237, 115521 CrossRef CAS PubMed.
- H. Fu, M. Cui, L. Zhao, P. Tu, K. Zhou, J. Dai and B. Liu, J. Med. Chem., 2015, 58, 6972–6983 CrossRef CAS PubMed.
- Y. Cui, X. Wang, Z. Jiang, C. Zhang, Z. Liang, Y. Chen, Z. Liu and Z. Guo, Angew. Chem., Int. Ed., 2023, 62, 202214505 CrossRef.
- B. Xiong, Y. Wang, Y. Chen, S. Xing, Q. Liao, Y. Chen, Q. Li, W. Li and H. Sun, J. Med. Chem., 2021, 64, 13152–13173 CrossRef CAS PubMed.
- Z. Jiang, Z. Liang, Y. Cui, C. Zhang, J. Wang, H. Wang, T. Wang, Y. Chen, W. He, Z. Liu and Z. Guo, J. Am. Chem. Soc., 2023, 145, 7952–7961 CrossRef CAS PubMed.
- N. Hada, W. J. Netzer, F. Belhassan, L. P. Wennogle and S. Gizurarson, Eur. J. Pharm. Sci., 2017, 102, 46 CrossRef CAS PubMed.
- C. Xiong, H. Ling, Q. Hao and X. Zhou, Cell Death Differ., 2023, 30, 876–884 CrossRef CAS PubMed.
- L. Chen, J. Min and F. Wang, Signal Transduction Targeted Ther., 2022, 7, 378 CrossRef CAS.
- A. Bush, Curr. Opin. Chem. Biol., 2000, 4, 184–191 CrossRef CAS PubMed.
- J. Kardos, L. Héja, Á. Simon, I. Jablonkai, R. Kovács and K. Jemnitz, Cell Commun. Signaling, 2018, 16, 71 CrossRef CAS.
- Z. L. Wang, L. Yuan, W. Li and J. Y. Li, Trends Mol. Med., 2022, 28, 258–269 CrossRef CAS.
- H. S. Kwon and S. H. Koh, Transl. Neurodegener., 2020, 9, 42 CrossRef.
- D. Dexter, A. Carayon, F. Javoy-Agid, Y. Agid, F. Wells, S. Daniel, A. Lees, P. Jenner and C. Marsden, Brain, 1991, 114, 1953–1975 CrossRef PubMed.
- Z. Jiang, C. Zhang, X. Wang, Z. Ling, Y. Chen, Z. Guo and Z. Liu, Angew. Chem., Int. Ed., 2024, 202318340 Search PubMed.
Footnote |
| † Electronic supplementary information (ESI) available. See DOI: https://doi.org/10.1039/d4sc03445g |
| This journal is © The Royal Society of Chemistry 2024 |

