
 Open Access Article
 This Open Access Article is licensed under a Creative Commons Attribution-Non Commercial 3.0 Unported Licence
Real-time structural dynamics of the ultrafast solvation process around photo-excited aqueous halides†
Verena
Markmann
 *a,
Jaysree
Pan
a,
Bianca L.
Hansen
a,
Morten L.
Haubro
a,
Amke
Nimmrich‡
ab,
Philipp
Lenzen§
a,
Matteo
Levantino
c,
Tetsuo
Katayama
de,
Shin-ichi
Adachi
fg,
Simone
Gorski-Bilke
h,
Friedrich
Temps
h,
Asmus O.
Dohn
ai,
Klaus B.
Møller
a,
Martin M.
Nielsen
a and
Kristoffer
Haldrup
a
*a,
Jaysree
Pan
a,
Bianca L.
Hansen
a,
Morten L.
Haubro
a,
Amke
Nimmrich‡
ab,
Philipp
Lenzen§
a,
Matteo
Levantino
c,
Tetsuo
Katayama
de,
Shin-ichi
Adachi
fg,
Simone
Gorski-Bilke
h,
Friedrich
Temps
h,
Asmus O.
Dohn
ai,
Klaus B.
Møller
a,
Martin M.
Nielsen
a and
Kristoffer
Haldrup
a
aTechnical University of Denmark, Anker Engelunds Vej 1, 2800 Lyngby, Denmark. E-mail: vmark@dtu.dk
bDepartment of Chemistry and Molecular Biology, University of Gothenburg, Gothenburg, Sweden
cEuropean Synchrotron Radiation Facility, CS40220, Grenoble 38043 Cedex 9, France
dJapan Synchrotron Radiation Research Institute, Kouto 1-1-1, Sayo, Hyogo 679-5198, Japan
eRIKEN SPring-8 Center, 1-1-1 Kouto, Sayo, Hyogo 679-5148, Japan
fInstitute of Materials Structure Science, High Energy Accelerator Research Organization (KEK), 1-1 Oho, Tsukuba, Ibaraki 305-0801, Japan
gDepartment of Materials Structure Science, School of High Energy Accelerator Science, 1-1 Oho, Tsukuba, Ibaraki 305-0801, Japan
hChristian-Albrechts-University Kiel, Olshausenstr. 40, 24098 Kiel, Germany
iScience Institute, University of Iceland, 107 Reykjavík, Iceland
First published on 12th June 2024
Abstract
This work investigates and describes the structural dynamics taking place following charge-transfer-to-solvent photo-abstraction of electrons from I− and Br− ions in aqueous solution following single- and 2-photon excitation at 202 nm and 400 nm, respectively. A Time-Resolved X-ray Solution Scattering (TR-XSS) approach with direct sensitivity to the structure of the surrounding solvent as the water molecules adopt a new equilibrium configuration following the electron-abstraction process is utilized to investigate the structural dynamics of solvent shell expansion and restructuring in real-time. The structural sensitivity of the scattering data enables a quantitative evaluation of competing models for the interaction between the nascent neutral species and surrounding water molecules. Taking the I0–O distance as the reaction coordinate, we find that the structural reorganization is delayed by 0.1 ps with respect to the photoexcitation and completes on a time scale of 0.5–1 ps. On longer time scales we determine from the evolution of the TR-XSS difference signal that I0: e− recombination takes place on two distinct time scales of ∼20 ps and 100 s of picoseconds. These dynamics are well captured by a simple model of diffusive evolution of the initial photo-abstracted electron population where the charge-transfer-to-solvent process gives rise to a broad distribution of electron ejection distances, a significant fraction of which are in the close vicinity of the nascent halogen atoms and recombine on short time scales.
1 Introduction
Charge transfer reactions in solution are of high interest for energy transformation, transmission, and storage and understanding the solvation mechanisms involved in such processes enables potential tuneabilities of the solute–solvent bond network and thereby transient state lifetimes. It has been shown that atomic–scale interactions between solute and solvent can directly influence the outcome of chemical reactions1–4 and biochemical processes.5–8 In dissociative processes, the surrounding solvent molecules can serve as a cage to confine (photo-) dissociated geminate fragments,9–11 and through their influence on the position and shape of the potential energy surface solute–solvent interactions have been shown to lead to changes in the lifetime and geometry of photo-excited solute molecules in a range of systems.12–16 Much progress has been made in studying the interplay between charge state dynamics and the structural dynamics of the solvent via time-resolved spectroscopic methods and simulations,17–20 however, a dearth of experimental probes with both the requisite time- and spatial resolution continues to provide a challenge. Consequently, a comprehensive mechanistic picture with predictive capabilities regarding solvation dynamics and their influence on chemical reactions has yet to emerge.Aqueous halides, e.g. iodide and bromide, have served as an important set of systems to study the fundamental mechanisms of Charge-Transfer-To-Solvent (CTTS) dynamics. They are highly relevant for solvation studies due to their natural abundance and role in cell biology21–23 and cloud formation.24 A prevailing perspective has long been that upon excitation with a photon, the electron abstracted from an aqueous halide first exists in close proximity to its original atom (a so-called contact pair), before it becomes hydrated and dissolves into the solvent as a free electron. This concept was introduced in simulation studies in the 1990s25–29 and was taken up later in classical Molecular Dynamic (MD) simulations30,31 and the analysis of experimental results.32–35
For example, optical Transient Absorption (TA) studies in the visible spectrum29,36–38 record the signature of an electron as a spectral feature growing within the first picosecond after excitation and developing to a broad band centered at ∼700 nm. Subsequently, this spectral signature decays with two time constants – one assigned to the dissociation of a contact pair into a free electron and a halogen atom (tens of picoseconds) and the other one assigned to the geminate recombination of a free electron with a halogen atom (100–200 ps). Similar to the TA results, two time scales of several tens of picoseconds and ≥100 ps have been reported from the decay of spectra observed in Time-Resolved Photo-Electron Spectroscopy (TRPES) experiments.39–42 Using TRPES, the electron binding energies were investigated and the exponentially decaying components of the photoelectron intensity profile were associated with the formation of a contact pair and its subsequent dissociation. Further insights into the potential presence and nature of transient species such as I0(OH2) have also been suggested by time-resolved X-ray absorption spectroscopy in combination with QM/MM simulations.35 Very recently the above-mentioned simulation-based studies were further extended by an ab initio molecular dynamics simulation study of an iodide surrounded by 256 water molecules.43 Similar to the simulation results in the earlier works by Pham et al. and others, this study also identified the ∼0.5 Å expansion of the solvent cage. It was further found that this solvent cage expansion coexists with transiently formed I–OH2 pairs and they utilized a classification approach to shed light on the nature and dynamics of the electron from its formation in a Rydberg state, through contact-pair formation and until it localizes in the bulk solvent.
In the recent experimental work with ultrafast X-ray methods by Vester et al.,44 the existence of the contact pair as a distinct species was brought into question by analysis suggesting an average ejection distance of the photo-abstracted electron of 7.4 ± 1.5 Å, which lies well outside the first solvation shell around an iodine atom. A model with diffusion-driven dynamics of the free electron was shown to be sufficient for fitting the kinetic traces of the iodine 2s–5p transition intensity of X-ray Absorption Near Edge Structure (XANES) data. Thus, the electron could be characterized as free electron directly after photo excitation. From a structural point of view, Vester et al. applied Time-resolved X-ray Solution Scattering combined with classical Molecular Dynamics simulations to qualitatively confirm the ∼0.5 Å increase in the nearest-neighbour I–O distances and also observed that the onset of this structural change was delayed by ∼0.1 ps with respect to the photo excitation event.
Building on the work of Vester et al., our present study utilizes Time-Resolved X-ray Solution Scattering (TR-XSS)45,46 to investigate the configuration of solvent molecules around the solute after CTTS reactions.47–49 We employ a model based on classical MD simulations to fit the TR-XSS data, with the interactions between solute and solvent molecules described by using the sum of a Coulomb and a Lennard-Jones (LJ) potential. We investigate the validity of previously proposed LJ potentials by comparing difference signals calculated from the MD simulations to experiments for aqueous halides both before and after photoionisation. Finally, the structural changes around halides are observed for 100 ps to study recombination dynamics as well as to estimate the ejection distance of the electron from the halide. An investigation of different halides (iodide and bromide) enables the construction of a more generalized picture for the structural dynamics involved in solvation processes.
2 Optical transient absorption
Preceding the investigation of CTTS excitation in aqueous halides with the structurally sensitive TR-XSS method, the dependencies of the electronic dynamics following on 1-photon or 2-photon excitation of iodide with different amounts of excess excitation energy were also studied. The absorption spectrum of aqueous NaI in the deep UV exhibits well defined absorption bands centered at 195 nm and 225 nm. These bands shown in Fig. 1a) have been established50,51 to arise from excitation to spin–orbit split 6s Rydberg-like states, 2P3/2 and 2P1/2, as schematically drawn in Fig. 1b).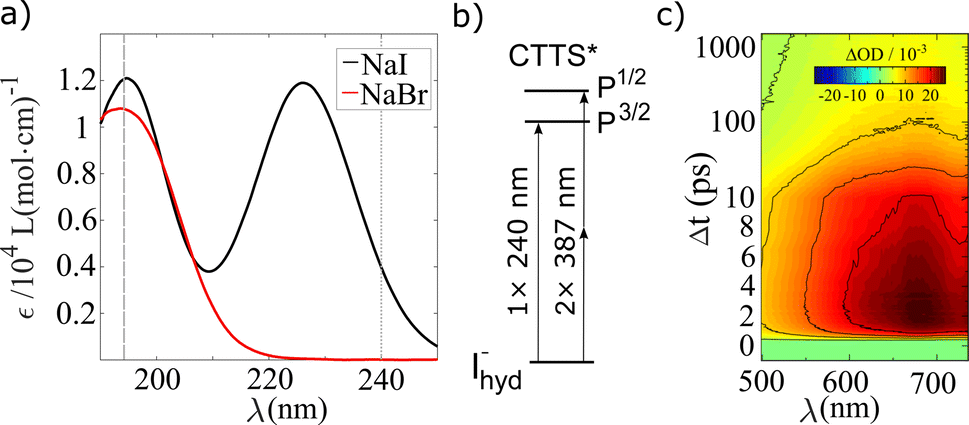 | ||
| Fig. 1 (a) Static absorption spectra for NaI and NaBr solvated in water. The dashed and dotted grey lines indicate the excitation wavelengths that were used for TA spectroscopy. (b) Scheme of the iodide excitation with 1-photon (240 nm) and 2-photons (387 nm). (c) Transient optical absorption spectrum of aqueous iodide after 240 nm excitation. | ||
In the present study, optical transient absorption measurements were performed with 1-photon, 240 nm (0.5 μJ per pulse), and 2-photon, 387 nm (20 μJ per pulse), pump pulses on iodide solutions (25 mM) prepared from the sodium salt. A full description of the experimental details is given in the ESI Section A.† By performing TA experiments at 240 nm, the 1-photon process at the red tail of the spectrum produces an abstracted electron with a minimal amount of excess energy, while the 2-photon pump excites the system more resonantly into its CTTS state. Thus, the electrons produced with a 2-photon pump have more excess energy. Fig. 1c) shows transient absorption spectra ΔA(λ, Δt) of aqueous NaI after 1-photon excitation. Similar to previous spectroscopic studies of solvated electron systems,37,52,53 the data exhibits the absorption peak centered at ∼680 nm54,55 with a FWHM of 300 nm. The signal increases on a sub-ps time scale and maximum peak height is observed at a time delay Δt = 2.5 ps and decays on a time scale of tens of picoseconds.
The transient absorption signal was fitted in a global analysis framework including three components, with one describing the grow-in of the signal and two describing the decay yielding as output three time constants τ1, τ2, and τ3. For the 1-photon excitation of NaI, this analysis yields a characteristic grow-in time of τ1 ≈ 400 fs, followed by a fast decay of about 60% of the signal on a time scale of τ2 ∼ 19 ps with the remaining signal decaying on a time scale of a few hundred ps. Similar time constants are observed for 2-photon excitation, although only 30% of the signal decays with the fast time component in the 2-photon case. The best-fit parameters and results are summarized in Table 1 and Fig. S1–S2 in the ESI.†
3 Time-resolved X-ray solution scattering
TR-XSS data were collected at both the ID09 beamline56 at the European Synchrotron Radiation Facility (ESRF) at pump – probe time delays of Δt = 200 ps to several nanoseconds and at the SACLA X-ray free electron laser for pump-probe time delays Δt = −20 ps to 100 ps. Aqueous iodide and bromide were studied at two different concentrations, 20 mM and 100 mM, respectively.At ESRF, a 300 μm flat liquid jet with a NaI sample was 2-photon excited with 50 fs laser pulses at 400 nm wavelength on a spot size of 160 × 140 μm and a pulse intensity of 73 μJ per pulse at the sample position. The 18 keV X-ray probe pulses (100 ps pulse width) were generated in a 1 kHz mode using a high speed chopper system.57 Scattering signals S(Q) were recorded with a Rayonix detector as a function of the wave vector transfer  , where 2θ is the scattering angle and λ the X-ray wavelength.
At SACLA, the aqueous iodide and bromide samples were delivered to the beam interaction point as a 50 μm round jet and two sets of experiments were performed; in one, the samples were excited with ∼50 fs laser pulses at 202 nm wavelength produced with the fourth harmonic of the Ti:sapphire laser for 1-photon excitation. The spot size was 150 × 170 μm with a laser flux of 8 μJ per pulse at the sample position. In a second set of experiments at SACLA, pump pulses of 400 nm wavelength were used for 2-photon excitation with a spot size of 250 × 260 μm and with an intensity of 70 μJ per pulse. 15 keV X-ray probe pulses were delivered with 30 Hz repetition rate and a pulse length below 10 fs. The time delay between the laser-pump and the X-ray probe pulses was determined with better than 50 fs accuracy on a pulse-to-pulse basis utilizing the arrival time monitor instrument installed immediately before the sample chamber.
In both the synchrotron and the X-ray free-electron laser experiment, the 2-dimensional detector data was reduced by azimuthal integration around the center of the detector (θ = 0). Subsequently, difference scattering curves were obtained through the subtraction of laser-off from the laser-on scattering curves, as indicated in eqn (1). Further information on data reduction and the signal scaling to the smallest stoichiometrically representative unit of the solution (Liquid Unit Cell, LUC) can be found in the ESI.†
| ΔS(Q, Δt) = Son(Q, Δt) − Soff(Q) | (1) |
The high temporal resolution available at SACLA enables studies of sub-picosecond structural dynamics following photo-abstraction excitation of I− and Br− in aqueous solution. Fig. 2a–c shows 2-dimensional representations of the recorded ΔS(Q, Δt) difference signals for aqueous NaI, aqueous NaBr and pure water excited with 202 nm pump pulses at a similar incident laser fluence. In all three measurements, the strongest difference signal is a positive feature surrounded by two negative signal features and is observed between Q = 1.5–4 Å−1. This pattern is consistent with the TR-XSS signature arising from the structural changes due to a temperature increase of the aqueous solvent.
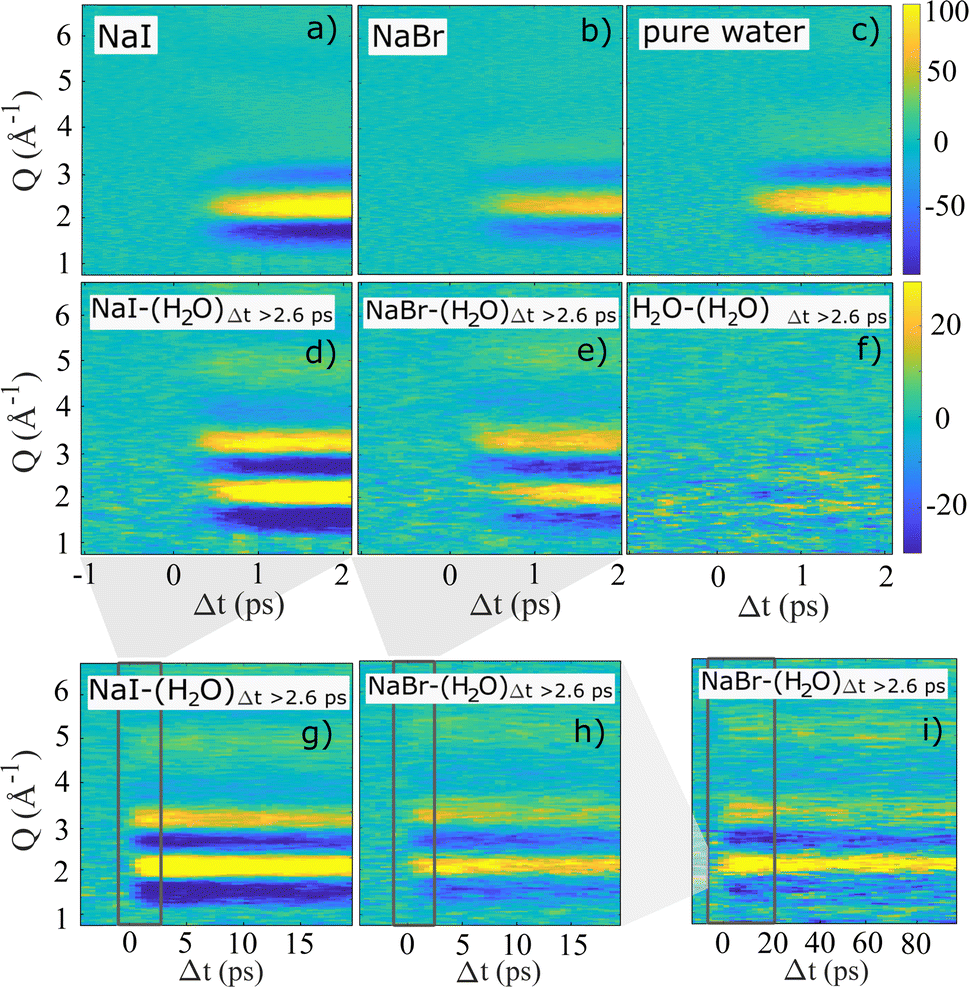 | ||
| Fig. 2 2-dimensional representations of ΔS(Q, Δt) after excitation with 8 μJ 202 nm pump pulses. In (a)–(c) the full signal is shown for aqueous NaI, aqueous NaBr (both 100 mM) and pure water for time delays up to 2 ps. In (d)–(i) an averaged pure water signal for Δt ≥ 2.6 ps was fitted to and subtracted from the full signal. The three bottom panels show data at longer time delays up to (g), (h) Δt = 20 ps and (i) Δt = 100 ps. The area of the zoom-in of the preceding panels is marked by a grey box. | ||
Fig. 2d–i demonstrates how a time-dependent subtraction of the neat water heating difference signal obtained at Δt > 2.6 ps reveals the presence of a significantly weaker (note the change in color scale) but persistent difference signal in the data sets acquired for NaI and NaBr, but not for neat water. Thus, panels d–i show solely the difference scattering arising from electron-abstraction from the halides and the subsequent structural dynamics, with panels d and e focusing on the fastest time scales (Δt < 2 ps), g and h the intermediate time scale up to 20 ps and panel i shows the heat-subtracted difference signal for NaBr up to Δt = 100 ps. For panels g–i the dark rectangles indicate the time range shown in the previous panels. For both NaI and NaBr the heat-subtrated difference signal is observed to appear on a sub-picosecond time scale and are quite similar in shape for the two halides. For both systems the difference signal is observed to decrease in intensity on a time scale of tens of picoseconds with no change in difference signal shape but with significant difference signal intensity also remaining out to the longest time delays studied at SACLA. The difference scattering ΔS(Q, Δt) obtained from aqueous NaI after 2-photon excitation with 400 nm pump pulses does not display any distinctive changes in difference signal shape or time evolution compared to the 1-photon process and is shown in the ESI.†
3.1 Modeling the difference scattering
The scattering from each of the subsystems (solute, cage and bulk solvent) can be calculated from the pairwise radial distribution functions glm(r) between atoms of ‘type’ (i.e. atomic form factor58) l and m via the generalized form of the Debye equation | (2) |
To interpret the acquired TR-XSS data and assign physical meaning to the shape and evolution of difference scattering signals, we utilize a model based on a linear combination of difference scattering components arising primarily from the solute, solvation cage and bulk solvent regions of the molecular system, an approach also utilized in previous works.14,44,61 As in the recent work on iodide solvation dynamics by Vester et al.,44 classical MD simulations are taken as the starting point for calculating the contributions to the (difference) scattering signal arising from structural changes in the solute, the bulk solvent and the solvation cage surrounding the solute species.
MD simulations were performed for charged halides and neutral halogens solvated in water, representing the state of the molecular system before and some time after laser excitation and electron abstraction when structural equilibrium around the halogen solute has been established. Specifically for the cage contribution Sc(Q), the radial distribution function glm between the halide and oxygen (here I–O) as well as iodide and hydrogen (I–H) atoms is calculated for all such atom pairs. For the solvent the scattering is calculated from the radial distribution function of O–O, O–H and H–H, and is here denoted Sv(Q). In a second calculation step, the difference signal ΔS(Q) for each of the three contributions is calculated from direct subtraction ΔS(Q) = SExcited(Q) − SGround(Q) to yield ΔSu, ΔSc and ΔSv, where the latter may include changes in scattering arising from changes in excluded volume while spurious contributions to the simulated difference signal from changes in the density due to the simulation methods have been removed as described in the ESI in Fig. S10 and eqn (7).†
Additionally to the changes in scattering arising from changes in the solute, solvent and shell structures as a consequence of the change in electronic state of the solute, the "heat response" difference signal component ΔSΔT(Q) arising from the structural changes due to energy deposition into the solvent is included. This contribution was measured in a separate experiment.62 Thus, our full model becomes a linear combination with the following terms:
| ΔS(Q, Δt) = α(Δt)·ΔSu+c(Q) + γ(Δt)·ΔSv(Q) + ΔT(Δt)·ΔSΔT(Q). | (3) |
In this expression, α can be readily interpreted as an excitation fraction, whereas γ represents both local (near the solute) and bulk changes to the structure of the solvent. As the volume of the solute and solvation shell is inaccessible to the bulk solvent, it has in the past been described as ‘excluded volume’. Upon extraction of an electron from the solute the solvation shell first grows and then later, following recombination, shrinks due to reordering around the solvated ion. With the scaling to a LUC, ΔT describes the magnitude of a structural change directly arising from a temperature increase in degrees K when thermodynamic equilibrium has been established as discussed in the ESI† and following the considerations presented in ref. 14.
In the first step of the data analysis presented here, the sensitivity of ΔSu+c(Q) towards details of the molecular–level interactions is benchmarked for the case of aqueous iodide on picosecond-resolved scattering data measured at the ESRF as follows. In the MD simulations we assume63–65 that the potential of the solute atoms with respect to the solvent molecules at a particular distance rij can be described by a Lennard-Jones potential for a pair of atoms i and j
 | (4) |
 | ||
| Fig. 3 (a) Iodide/dine-water dimer potential curves based on the dimer geometry determined in Fig. S3 in the ESI,† calculated using iodide and the excited state iodine with (Iopt0) and without (I0) optimized parameters. (b) RDFs calculated by classical MD simulation for the halide-oxygen distance of aqueous NaI. | ||
Fig. 3b shows the structural consequences of these three different interaction potentials in terms of the I–O radial distribution functions calculated from MD simulations. The strong interaction between solute and solvent in the I− case (black curve) leads to a very well-defined first solvation shell with an I–O distance of about 3.6 Å as well as clear signatures of also well-defined 2nd shell at 5 Å. For the case of I0, the first solvation shell is less well defined and is found at longer I–O distances, 4–4.5 Å, and also here a 2nd solvation shell can be discerned at a distance of 7 Å. While the resulting solvation structures are generally quite similar for the two sets of LJ parameters used for I0, the assumption of the same LJ interaction parameters for I− and I0 (grey curve) leads to a slightly longer 1st shell distances than the simulation based on LJ parameters optimized from alkyl halide simulations. As discussed in further detail below, it is interesting to note how even rather different solute–solvent interaction potentials lead to essentially the same solvation shell structures in the case of I0, indicating that solvent–solvent interactions may dominate over solute–solvent interactions for this species.
To demonstrate how the TR-XSS methods employed in the present study have the needed sensitivity to discern between different models for the solute–solvent interactions for I0, Fig. 4a) shows the ΔSu+c term calculated from the two I0 MD simulations. Even though the two ΔSu+c curves are quite similar, employing the LJ parameters optimized for I0 leads to a significantly (χ2 = 2.2 vs. χ2 = 3.1) better fit to the X-ray difference scattering signal ΔS(Q) acquired at Δt = 200 ps, compared to using the same LJ parameters for I0 as for I−. Fig. 4b shows the full fit as well as the individual contributions to the model for the I− → I0 photo-abstraction difference scattering signal.
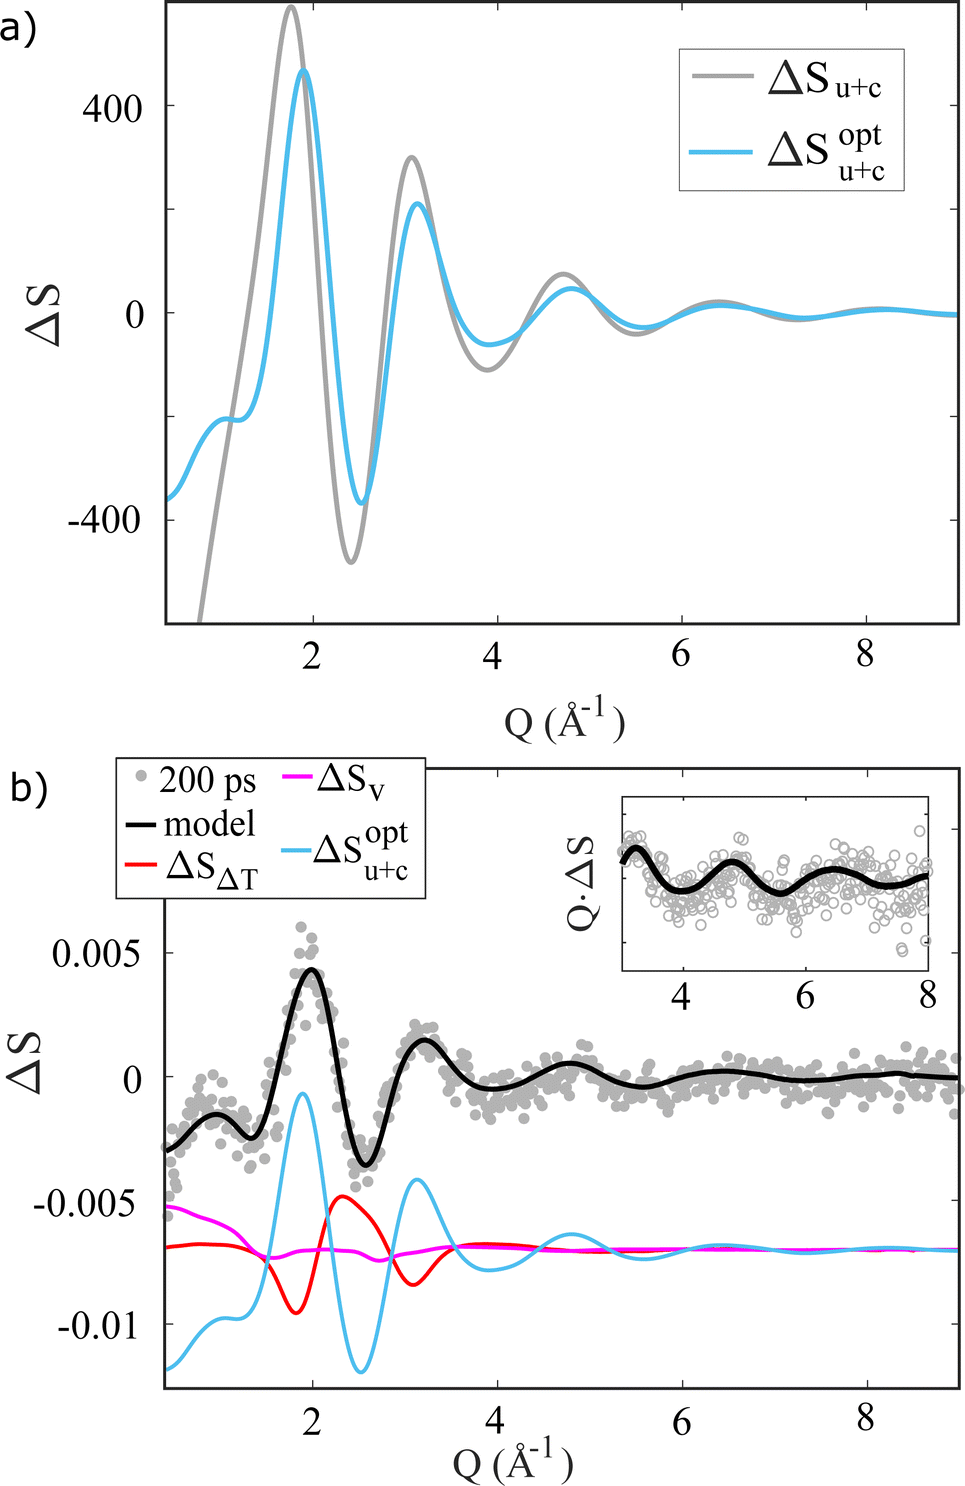 | ||
| Fig. 4 (a) Difference scattering signals calculated from the RDFs in Fig. 3 via the Debye equation. (b) ΔS(Q, Δt = 200 ps) (water-subtracted, di-/triiodide-subtracted see ESI†) fitted with the scattering contributions, which are shown with an offset for clarity. The inset shows QΔS(Q, Δt) in the high Q range. | ||
In the following Section, ΔSu+c is calculated with the optimized LJ parameters and the same linear-combination analysis approach is applied to follow the dynamics of solvation immediately following photo-abstraction of the electron from I−. We note, that for clarity in Fig. 4b the signal contributions from direct water excitation and photoproduct formation have been removed from the difference signal ΔS, which leaves ΔSu+c as the strongest signal contribution.
3.2 Time-dependence of the scattering signal contributions
To investigate the time evolution of the acquired difference signals in more detail, we next apply the model presented in eqn (3) to fit the data shown in Fig. 2a and b. Fig. 5 shows the (heat-subtracted) ΔS(Q, Δt) data for the NaI sample as well as the model fit and the residual. Corresponding fit results for longer time delays, lower concentration and for NaBr are shown in the ESI Fig. S6–S9.† In general a very good fit is observed at all time delays with all the major features of ΔSmeas.(Q, Δt) being captured by ΔSmodel(Q, Δt), albeit with a tendency for the measured data to show slightly sharper features than what is predicted by the model. | ||
| Fig. 5 (a) 2-dimensional representations ΔS(Q, Δt) of the 100 mM NaI measurement (heat-subtracted), (b) the model after eqn (3) and (c) the residual after subtraction the model from the measurement. The lines through Δt = 2 ps indicate the location for the difference scattering in Q shown in (d). | ||
Fig. 6a–c shows the time evolution of the three time-dependent scalers in the model described by eqn (3). α(Δt) and γ(Δt) and ΔT(Δt) all show very similar behavior, with a grow-in completed on the ∼1 ps time scale. To quantify these dynamics further, Fig. 6 also shows the best-fit results for an exponential grow-in (broadened by an Instrument Response Function (IRF) as shown in eqn (E8)–E10†) fitted individually to each of α(Δt) and γ(Δt) and ΔT(Δt) in the time range up to 4 picoseconds. To stabilize the fitting the width of the IRF was constrained to a 120–140 femtoseconds interval, but inspired by the delayed-onset observed in the previous study by Vester et al.,44 the time of the onset (t0) was included as a fully free parameter.
 | ||
| Fig. 6 (a)–(c) Temporal evolution of the three model contributions α(Δt) (magenta), γ(Δt) (cyan) and ΔT(Δt) (red) for 100 mM aqueous NaI after 202 nm excitation. Full lines are fits of IRF-broadened exponential grow-ins with the best-fit time constants indicated in the legends. (d) Long time delay behaviours of α(Δt), γ(Δt) and ΔT(Δt). The solid lines show best-fit exponential decays (for α, γ) and grow-in (for ΔT) with the time constants τ indicated in the legend. | ||
From these fits, we find that for the 100 mM NaI sample α(Δt) and γ(Δt) show a delayed onset of 0.1–0.2 ps with respect to Δt = 0, in agreement with the results presented in Vester et al. For the time scale of the signal grow-ins we find that the ΔSv contribution grows in slightly faster (τγ = 0.4(1) ps) than the ΔSu+c contribution (τα = 0.6(1) ps). Although at the limit of resolvability we find this trend to be reproduced across the four sample types investigated, as shown in Table 1.
| Sample | τ α | τ γ | τ ΔT | τ α2 | τ γ2 | τ ΔT2 |
|---|---|---|---|---|---|---|
| NaI | ||||||
| 20 mM | 0.7(1) | 0.6(2) | 0.8(1) | 21(16) | 15(11) | 29(32) |
| 100 mM | 0.6(1) | 0.4(1) | 0.7(1) | 23(3) | 19(6) | 24(21) |
![[thin space (1/6-em)]](https://www.rsc.org/images/entities/char_2009.gif) |
||||||
| NaBr | ||||||
| 20 mM | 0.7(1) | 0.6(1) | 0.8(1) | 83(120) | 15(13) | 27(10) |
| 100 mM | 0.7(1) | 0.6(1) | 0.8(1) | 18(11) | 13(6) | 32(13) |
ΔSΔT is observed to grow in on a time scale of τΔT = 0.7(1) ps which is slightly slower than in previously publications,14,44 which we ascribe to how the model is applied to fit the data here without including the second, slower, grow-in for the ΔSΔT contribution, seen in Fig. 6d) and which is discussed in more detail below. We further note that we do not see the early onset of the ΔSΔT contribution which was observed in the work by Vester et al., and tentatively assign this observation to the much lower laser fluence used in the experiments for which results are presented here.
Generalizing the fit results for 100 mM NaI to the other sample types studied, the first three columns of Table 1 show the time constants τα, τγ and τΔT determined from the same analysis applied to similar data sets acquired for 20 mM and 100 mM samples of NaI and NaBr. For all samples, the response of ΔSv is the fastest (τγ = 0.4–0.6 ps) followed by ΔSu+c (τα = 0.6–0.7 ps) and ΔSΔT (τΔT = 0.7–0.8 ps).
Fig. 6d shows the time evolution of α(Δt), γ(Δt) and ΔT(Δt) on the 20 ps time scale, with Fig. S14 and S15 of the ESI† showing the corresponding data sets acquired for NaBr. For the 100 mM NaI and NaBr samples we find that the ΔSu+c and ΔSv contributions to the difference signal show a ∼20% decrease on the 20 ps time scale and applying a simple mono-exponential fit to these observed dynamics we find characteristic time constants of around ≈20 ps. For the corresponding 20 mM data the measured difference signals are much weaker and these time constants have a high uncertainty as seen in Table 1. We also note, that the decays do not complete on the 100 ps time scale (see also Fig. S15†), therefore the complete return to an unexcited system has a time scale τlong > 100 ps larger then the probed time range. For the evolution of ΔTFig. 6d shows how the initial fast grow-in is followed by a second, slower and much smaller, increase in the solvent temperature. From the decay of α(Δt) an estimation of an average electron ejection radii of rej = 5.3 ± 3 Å for iodide and rej = 7.5 ± 4 Å for bromide is calculated based on the diffusion-limited recombination model discussed by Vester et al.44 The distributions of rej are shown in the Fig. S17.†
To investigate the signal dependence on single- or multi-photon excitation on short time scales, Fig. 7 shows ΔS(Q, Δt = 2 ps)NaI − ΔT·ΔSH2O after 1-photon excitation at 202 nm and 2-photon excitation at 400 nm. Both wavelengths excite aqueous iodide into the CTTS band centered at 195 nm. For 2-photon excitation, the lower signal to noise ratio is a consequence of the smaller excitation fraction for the multi-photon process. The shape of the depicted signal as well as the similar grow-in show no excitation-dependent changes within the measurement uncertainties.
 | ||
| Fig. 7 Comparison between 1-photon and 2-photon excitation of 100 mM NaI. Panel (a) depicts ΔS(Q, Δt = 2 ps) after subtracting contributions from pure water scattering and in (b) the sum of the absolute signal is shown as a function of Δt up to 4 ps. | ||
4 Discussion
4.1 Transient optical absorption data
In the TA measurement results shown in Fig. 1c the signature of a solvated electron is to be observed with a grow-in time τ1 ∼ 400 fs for CTTS excited iodide in water. Based on the time-independent position of the absorption peak, a low probability for the formation of cation–electron pairs53,72–74 in the solution can be assumed. The signal decay is bi-exponential (τ2, τ3), where the signal dies out after a characteristic time τ3 in accordance with earlier studies,37,40 matching a diffusion driven recombination of free electrons with the halogen atoms. As the observed lifetimes τ2 are too short for free diffusion through the solvent, we cautiously ascribe them to the geminate recombination of electrons in close proximity of their original halogen atom. Such electrons match the description of short-lived contact-pairs by Staib and Borgis.25 The number of electrons staying in close proximity gets smaller when the (average) ejection distances grow larger. With the amplitudes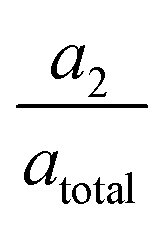 we tentatively approximate the number of contact-pair-like electrons to 60% at 240 nm excitation and 30% at 387 nm excitation.
4.2 Solvation structure of I0
Turning next to the analysis and interpretation of the TR-XSS data, Fig. 4b demonstrates how the comparatively simple model presented in eqn (3) is able to fully capture all features of the background-subtracted difference scattering signal acquired at Δt = 200 ps after 2 × 400 nm photoexcitation. As indicated by the light blue curve in this figure, after water-subtraction ΔS(Q) is dominated by the difference signal contribution ΔSu+c arising from changes in the solute–solvent pair-correlation function due to photo-abstraction of an electron from I−, but with some contribution from the changes in the solvent–solvent radial distribution function which give rise to ΔSv. This latter contribution can tentatively be related to the change in the size of the “hole” in the solvent occupied by the solute (excluded volume) as well as potentially to the changes in inter-molecular structure arising from the several millimolar of solvated electrons eaq.52,75–77The dominating ΔSu+c contribution arises from the structural changes seen from the “point of view” of the solute and as such is directly related to the structural changes in the first solvation shell(s) which are illustrated by the g(r)'s in Fig. 3b). As discussed in the Introduction, these structural changes have been robustly demonstrated to consist of a ∼0.5 Å expansion and broardening of the well-defined solvation shell determined for I−.43,44,67–71 The well-defined solvation structure of aqueous I− arises primarily due to the strong electrostatic interactions between the charged halide species and the polar water molecules and has been characterized experimentally in many studies.32–42,44 This has allowed a good description of the I−–H2O interaction potential(s) from theory, but much fewer studies exist for I0 (ref. 63) and there is thus currently no consensus about the shape of the I0–H2O interaction potential. As demonstrated in Fig. 3b and 4a, MD studies show how changes to this interaction (parameterized via the LJ parameters) lead to subtle yet distinctive changes in g(r) as well as in the ΔSu+c calculated therefrom. This allows a benchmark of two sets of putative LJ-parameters against the acquired TR-XSS data, and we find that an I0–H2O interaction potential described by Iopt0 LJ parameters of σ = 3.75 Å−1 and ε = 2.51 kJ mol−1 derived from optimization against alkyl halides and halobenzenes by Jorgensen et al.71 give a significantly better fit to the data compared to using the same I− LJ-parameters for also I0. A more detailed investigation of the halogen–water interaction for the neutral atomic species I0 and Br0 using TR-XSS will be reported elsewhere.
4.3 Structural dynamics
Having established the applicability of the model represented in eqn (3) on the well studied system iodide, we next move to the interpretation and discussion of the femtosecond-resolved results presented in Fig. 2 and 5–7. The results shown for iodide and the smaller bromide species are similar, which has hitherto not been investigated with time-resolved X-ray methods. As evident from Fig. 2a–c, 202 nm photo-excitation of 100 mM aqueous NaI, NaBr as well as neat H2O leads to the appearance of clear difference scattering signal. The difference signal obtained for neat H2O very closely resembles the well-known difference scattering signal arising from isobaric heating of water as shown in Fig. S20.† As discussed in the original work by Quickenden & Irvin78 the absorption coefficient of even ultrapure water at 202 nm while very low, is not zero and the presence of impurities or dissolved O2 may increase the absorption by an order of magnitude or more. Given the linear, no-threshold behaviour of the magnitude of the difference signal measured for neat water as a function of incident laser fluence we ascribe the presence of this “background” contribution of ΔS(Q, Δt) primarily to a consequence of 1-photon absorption by the water molecules or impurities such as dissolved O2 which we did not take any precautions to remove beyond using milliQ water. However, as Fig. 2d–f shows, this contribution to ΔS(Q, Δt) from direct heating of water can be subtracted as ΔSMeas(Q, Δt) = ΔSFull(Q, Δt) − ΔSH2O,Δt>2.6ps(Q, Δt) revealing distinct difference scattering signals in the NaI and NaBr data sets and essentially no residual for neat water.Fig. 5 illustrates how the heat-subtracted difference signal from NaI is very well captured on the single-picosecond time scale by the comparatively simple model presented in eqn (3) and benchmarked against the Δt = 200 ps data. From inspection of the residual between data and model in Fig. 5, the measured difference signal shows slightly sharper features than the one modelled, indicating that (changes in) the actual structural motifs giving rise the ΔSu+c may be more well-defined compared to the model results shown in Fig. 4. Furthermore, the absence of any significant time evolution in the shape of the residual (see ESI Fig. S9†) supports the use of difference signals calculated from equilibrium simulations for I− and I0 to model the dynamics following photo-abstraction. This in turn indicates that this model component changes only in magnitude and not in signal shape as a function of time.
Fitting eqn (3) to the difference signal ΔS(Q, Δt) for NaI allows us to determine the evolution of the three individual components of the difference signal as Fig. 6 shows. For all three components we observe that there is a short offset (t0 = 0.1–0.2 ps) between the arrival time of the 202 nm excitation pulse and the onset of the structural dynamics. As X-ray scattering is much more sensitive to the more electron-rich oxygen atoms relative to the hydrogen atoms, this short “wait time” can be related to the time scale of break-up of the hydrogen-bond network which in turn allows the oxygen atoms to move.44
Following the short wait time (t0) the ΔSv as well as the ΔSu+c contributions increase in magnitude with time constants τα = 0.6–0.7 ps and τγ = 0.4–0.6 ps, reaching their full magnitudes after about a picosecond. Returning to eqn (3) and how ΔSu+c and ΔSv are defined and simulated, we therefore conclude that the structural changes described in Fig. 3 (expansion of the first shell) are completed on this time scale. How this concept also applies to multiple photon excitation is shown in Fig. 7, where we conclude that electron-abstraction from a single halide ion in water is a similar process after 1- or 2-photon excitation with the same total energy. As seen in Fig. 3a, the driving force for this structural re-arrangement can be directly understood as a consequence of a vertical excitation from the I−–O potential surface (black line) to one of the I0–O potential surfaces (green and grey). The driving force  ensues the potential and is dependent on where and on which potential energy surface the system finds itself after photoabstraction. As such not only the shape of the difference signal (Fig. 4a) but also the dynamics may be a sensitive probe of the I0–O interaction potential. Further future structural studies could also be targeted towards the (possibly transient) existence of the I–OH2 pairs not seen in our classical MD simulations but observed in previous ab initio MD simulation studies.35,43
4.4 Recombination dynamics
As described in the section on TR-XSS, the α(Δt) parameter on time scales where the structural dynamics have been completed has a direct interpretation as an excitation fraction, i.e. how large a fraction of the initial I− population is in the charge-neutral I0 state at time Δt. Fig. 6d shows the evolution of α(Δt) as well as γ(Δt) and ΔT(Δt) on the 20 ps time scale, and a clear decrease in the excitation fraction is observed. This is shown for longer time scales in the ESI Fig. S13† from which it is evident that the excitation fraction does not follow a mono-exponential decrease towards 0 but reaches a plateau at αlong. Further, on the same time scale as we observe the fraction of I0 decrease, we find an increase in solvent temperature, ΔT, which we associate with the energy released upon eaq + I0 → I− recombination.The primary observable in the present X-ray scattering study is the change in distance between the iodide and the oxygen atoms of the surrounding water molecules, therefore, the details of the electron localization process in the bulk solvent are at present very hard to track or quantify, as no X-ray scattering signatures of the neither delocalized nor localized electron have yet been published. High resolution TR-XAS might shed further light on the orbital character as well as the delocalization and localization dynamics of the electron in the future. For now, we concentrate on interpreting the observation of a two-step decay in the fraction of the I0 species as arising from the photo-abstracted electrons being ejected at Δt = 0 to form a population of photo-ejected electrons with a mean distance rej0 from the parent halide, in line with the analysis presented in previous work.44 This population subsequently evolves in time with some fraction diffusing in the general direction of the parent halide and some towards the bulk solvent. This leads to two time scales for eaq + I0 → I− recombination, with the faster one (τ2 = 19 ps in the TA experiment, τα2 ≈ 20 ps in the TR-XSS experiment) representing the so-called primary geminate recombination for the fraction of the photo-ejected electron population diffusing initially towards the parent halide. The second time scale (>100 ps) characterizes the secondary geminate recombination where the electron initially diffuses towards the bulk before eventually recombining with the parent halide, with potentially a third time scale (which depends on excitation fraction and initial halide concentration) representing non-geminate recombination with other neutral halogens having undergone photoabstraction. The fraction and time scale of primary geminate recombination depends on the details of the eaq + I0 interaction potential in the presence of water but in line with the conclusions of the recent work presented in Vester et al.44 , we here limit our analysis to a minimal assumption of pure diffusion, i.e. with a flat eaq + I0 interaction potential, and immediate recombination at a specified distance rrec.. Applying this framework (see Fig. S17†) we find that for NaI the reconstructed distribution is centered at rej0 = 5 Å, and extends beyond 10 Å. For NaBr, which from Table 1 exhibits a similar time scale for the primary geminate recombination, the distribution is even broader, and has a maximum at rej0 = 8 Å. These values are broadly in agreement with the previous results presented by H. Iglev et al.79 (optical data) and by Vester et al.44 (XANES data), but we note that (in line with the analysis presented in the ESI† of ref. 44) a preliminary sensitivity analysis indicates that rej0 and the distribution width depends strongly on the parameter choice for the (temperature-dependent) mutual diffusion coefficient D′ and the recombination distance rrec.. The temperature dependence of D′ in particular complicates the picture, as excess energy from the photo-excitation is released to the solvent following electron abstraction and localization, leading to locally “hot” solvent. A full analysis of the presently used model as well as similar approaches and with the halide/halogen species as the key observable would be highly interesting, but is not feasible with the S/N level of the data sets and analysis results presented here.
Summarizing these observations and time scales in relation to previous studies with optical36,38,79 and photo-electron39,40 methodologies, then we find that despite the difference in main observable (halogen vs. electron) there is good agreement that the jointly established time scale of ∼20 ps can be associated with primary geminate recombination. There is, however, significant differences in the underlying modelling, as the optical approaches introduce several intermediate species to account for complicated changes in the measured spectra, whereas we here find that a simpler diffusion-driven model with no structurally well-defined intermediates is able to fully account for the observed dynamics as seen from the solute “point of view”.
5 Conclusions
In this work, we have presented results of optical TAS and TR-XSS experiments on aqueous iodide and bromide excited with 202 nm laser pulses which induce photoabstraction, I− + hν → I0 + eaq. The optical experiments observe the photoreaction from the point of view of the photoabstracted electrons whereas the X-ray experiments primarily track the structural dynamics as observed from the point of view of the halogen species. We observe good agreement between the time scales observed with the two methods. Structural analysis of the TR-XSS data demonstrated how the method has a level of sensitivity to the details of the structural re-arrangement of the solvation structure that allows benchmarking of parameters describing the solute–solvent interactions. From quantitative analysis of the acquired TR-XSS data we conclude that for both halide species the structural dynamics involve a delay in the signal onset on a 0.1 ps time scale, a delay which we ascribe tot he time scale for an initial breaking of the H-bond network. Following this, we observe an X-ray difference scattering signal which can be assigned to a structural re-arrangement of the nearest solvent molecules taking place on a time scale of about 0.5–1 ps. On longer time scales we observe primary and secondary geminate recombination eaq + I0 → I− with dynamics that are well captured by simple diffusion of electrons ejected to the solvent as broad distribtuons with mean distances of about 5 Å (NaI) and 8 Å (NaBr). The quality of the TR-XSS data and structural sensitivity analysis indicates significant opportunities for investigating the details and dynamics of the halide/halogen-water interaction potentials in further detail in future works.Data availability
ESRF data is available at https://data.esrf.fr/doi/10.15151/ESRF-DC-1554640385. More data will be available upon reasonable request.Author contributions
VM: formal analysis, investigation, project administration, visualization, writing; JP: formal analysis, software; BLH: investigation; MLH: investigation; AN: investigation; PL: investigation; ML: resources, software; TK: resources, software; SIA: resources; SGB: investigation; FT: funding acquisition, resources; AOD: investigation, data curation, methodology, software; KBM: conceptualization, methodology; MMN: methodology; KH: conceptualization, funding acquisition, methodology, project administration, writing. All authors contributed with comments to the final version of the manuscript.Conflicts of interest
There are no conflicts to declare.Acknowledgements
VM, JP, BLH, MLH and KH gratefully acknowledge support from the Novo Nordisk Foundation NERD program under Grant No. NNF20OC0061740. KBM. and MMN. thank the Independent Research Fund Denmark for support under Grant No. 802100347B. AOD thanks the Icelandic Research Fund, grant 196279-051. The DTU-affiliated authors gratefully acknowledge DANSCATT for supporting the beamtime efforts. TK acknowledges support from JSPS KAKENHI (grant nos. JP19H05782, JP21H04974 and JP21K18944). TR-XSS measurements were performed at BL3 of SACLA with the approval of the Japan Synchrotron Radiation Research Institute (JASRI, proposal no. 2022A8038). The European Synchrotron Radiation Facility (ESRF) is kindly acknowledged for provision of beamtime at the ID09 beamline. The authors would like to thank Pierre Lloria from the Partnership for Soft Condensed Matter (PSCM) at the ESRF. We thank the Kiel University for generous allocation of time at the Transient Absorption Spectroscopy laboratory. We thank Katharina Kubicek (Hamburg University) for sharing her matlab scripts for electron ejection distance calculations.Notes and references
- Y. Marcus, Chem. Rev., 2009, 109, 1346–1370 CrossRef CAS PubMed.
- M. Maroncelli, J. Mol. Liq., 1993, 57, 1–37 CrossRef CAS.
- K. H. Kim, J. H. Lee, J. Kim, S. Nozawa, T. Sato, A. Tomita, K. Ichiyanagi, H. Ki, J. Kim and S.-i. Adachi, et al. , Phys. Rev. Lett., 2013, 110, 165505 CrossRef PubMed.
- K. A. Dill, T. M. Truskett, V. Vlachy and B. Hribar-Lee, Annu. Rev. Biophys. Biomol. Struct., 2005, 34, 173–199 CrossRef CAS PubMed.
- A. Kumar, D. Becker, A. Adhikary and M. D. Sevilla, Int. J. Mol. Sci., 2019, 20, 3998 CrossRef CAS PubMed.
- N. Nandi, K. Bhattacharyya and B. Bagchi, Chem. Rev., 2000, 100, 2013–2046 CrossRef CAS PubMed.
- G. R. Fleming and M. Cho, Annu. Rev. Phys. Chem., 1996, 47, 109–134 CrossRef CAS.
- C.-R. Wang, J. Nguyen and Q.-B. Lu, J. Am. Chem. Soc., 2009, 131, 11320–11322 CrossRef CAS PubMed.
- A. Nimmrich, M. R. Panman, O. Berntsson, E. Biasin, S. Niebling, J. Petersson, M. Hoernke, A. Bjorling, E. Gustavsson and T. B. van Driel, et al. , J. Am. Chem. Soc., 2023, 145, 15754–15765 CrossRef CAS PubMed.
- E. H. Choi, Y. Lee, J. Heo and H. Ihee, Chem. Sci., 2022, 13, 8457–8490 RSC.
- K. H. Kim, J. G. Kim, S. Nozawa, T. Sato, K. Y. Oang, T. W. Kim, H. Ki, J. Jo, S. Park and C. Song, et al. , Nature, 2015, 518, 385–389 CrossRef CAS PubMed.
- A. Rondi, Y. Rodriguez, T. Feurer and A. Cannizzo, Acc. Chem. Res., 2015, 48, 1432–1440 CrossRef CAS PubMed.
- T. Katayama, T.-K. Choi, D. Khakhulin, A. O. Dohn, C. J. Milne, G. Vankó, Z. Németh, F. Lima, J. Szlachetko and T. Sato, et al. , Chem. Sci., 2023, 14, 2572–2584 RSC.
- K. Haldrup, W. Gawelda, R. Abela, R. Alonso-Mori, U. Bergmann, A. Bordage, M. Cammarata, S. E. Canton, A. O. Dohn and T. B. Van Driel, et al. , J. Phys. Chem. B, 2016, 120, 1158–1168 CrossRef CAS PubMed.
- E. Biasin, Z. W. Fox, A. Andersen, K. Ledbetter, K. S. Kjær, R. Alonso-Mori, J. M. Carlstad, M. Chollet, J. D. Gaynor and J. M. Glownia, et al. , Nat. Chem., 2021, 13, 343–349 CrossRef CAS PubMed.
- D. Laage and J. T. Hynes, Proc. Natl. Acad. Sci. U. S. A., 2007, 104, 11167–11172 CrossRef CAS PubMed.
- M. Reidelbach, M. Bai, M. Schneeberger, M. S. Zollner, K. Kubicek, H. Kirchberg, C. Bressler, M. Thorwart and C. Herrmann, J. Phys. Chem. B, 2023, 127, 1399–1413 CrossRef CAS PubMed.
- H. J. Wörner, C. A. Arrell, N. Banerji, A. Cannizzo, M. Chergui, A. K. Das, P. Hamm, U. Keller, P. M. Kraus and E. Liberatore, et al. , Struct. Dyn., 2017, 4, 061508 CrossRef PubMed.
- M. Chergui, Struct. Dyn., 2016, 3, 031001 CrossRef PubMed.
- W. Zhang, R. Alonso-Mori, U. Bergmann, C. Bressler, M. Chollet, A. Galler, W. Gawelda, R. G. Hadt, R. W. Hartsock and T. Kroll, et al. , Nature, 2014, 509, 345–348 CrossRef CAS PubMed.
- D. Laage, T. Elsaesser and J. T. Hynes, Chem. Rev., 2017, 117, 10694–10725 CrossRef CAS PubMed.
- T. Nickerson, E. Antonio, D. P. McNally, M. F. Toney, C. Ban and A. Straub, Chem. Sci., 2022, 14, 751–770 RSC.
- S. Funkner, G. Niehues, D. A. Schmidt, M. Heyden, G. Schwaab, K. M. Callahan, D. J. Tobias and M. Havenith, J. Am. Chem. Soc., 2012, 134, 1030–1035 CrossRef CAS PubMed.
- P. Jungwirth and D. J. Tobias, Chem. Rev., 2006, 106, 1259–1281 CrossRef CAS PubMed.
- A. Staib and D. Borgis, J. Chem. Phys., 1996, 104, 9027–9039 CrossRef CAS.
- D. Borgis and A. Staib, J. Chem. Phys., 1996, 104, 4776–4783 CrossRef CAS.
- W.-S. Sheu and P. J. Rossky, J. Phys. Chem., 1996, 100, 1295–1302 CrossRef CAS.
- X. Chen and S. E. Bradforth, Annu. Rev. Phys. Chem., 2008, 59, 203–231 CrossRef CAS PubMed.
- J. A. Kloepfer, V. H. Vilchiz, V. A. Lenchenkov, X. Chen and S. E. Bradforth, J. Chem. Phys., 2002, 117, 766–778 CrossRef CAS.
- S. Raugei and M. L. Klein, J. Chem. Phys., 2002, 116, 196–202 CrossRef CAS.
- J. Heuft and E. Meijer, J. Chem. Phys., 2005, 123, 094506 CrossRef CAS PubMed.
- M. Antalek, E. Pace, B. Hedman, K. O. Hodgson, G. Chillemi, M. Benfatto, R. Sarangi and P. Frank, J. Chem. Phys., 2016, 145, 044318 CrossRef PubMed.
- F. Messina, O. Bräm, A. Cannizzo and M. Chergui, Nat. Commun., 2013, 4, 2119 CrossRef PubMed.
- C. G. Elles, I. A. Shkrob, R. A. Crowell, D. A. Arms and E. C. Landahl, J. Chem. Phys., 2008, 128, 061102 CrossRef PubMed.
- V.-T. Pham, T. J. Penfold, R. M. Van Der Veen, F. Lima, A. El Nahhas, S. L. Johnson, P. Beaud, R. Abela, C. Bressler and I. Tavernelli, et al. , J. Am. Chem. Soc., 2011, 133, 12740–12748 CrossRef CAS PubMed.
- H. Iglev, R. Laenen and A. Laubereau, Chem. Phys. Lett., 2004, 389, 427–432 CrossRef CAS.
- H. Iglev and A. Laubereau, Laser Applications in Life Sciences, 2010, pp. 201–209 Search PubMed.
- M. K. Fischer, A. Laubereau and H. Iglev, Phys. Chem. Chem. Phys., 2009, 11, 10939–10944 RSC.
- Y.-I. Yamamoto, Y.-I. Suzuki and T. Suzuki, J. Phys. Chem. Lett., 2023, 14, 1052–1058 CrossRef CAS PubMed.
- H. Okuyama, Y.-I. Suzuki, S. Karashima and T. Suzuki, J. Chem. Phys., 2016, 145, 074502 CrossRef PubMed.
- Y.-I. Suzuki, H. Shen, Y. Tang, N. Kurahashi, K. Sekiguchi, T. Mizuno and T. Suzuki, Chem. Sci., 2011, 2, 1094–1102 RSC.
- A. Lübcke, F. Buchner, N. Heine, I. V. Hertel and T. Schultz, Phys. Chem. Chem. Phys., 2010, 12, 14629–14634 RSC.
- J. Lan, M. Chergui and A. Pasquarello, Nat. Commun., 2024, 15, 2544 CrossRef CAS PubMed.
- P. Vester, K. Kubicek, R. Alonso-Mori, T. Assefa, E. Biasin, M. Christensen, A. O. Dohn, T. B. Van Driel, A. Galler and W. Gawelda, et al. , J. Chem. Phys., 2022, 157, 224201 CrossRef CAS PubMed.
- S. E. Canton, K. S. Kjær, G. Vankó, T. B. Van Driel, S.-i. Adachi, A. Bordage, C. Bressler, P. Chabera, M. Christensen and A. O. Dohn, et al. , Nat. Commun., 2015, 6, 6359 CrossRef CAS PubMed.
- K. Hwan Kim, J. Kim, J. Hyuk Lee and H. Ihee, Struct. Dyn., 2014, 1, 011301 CrossRef PubMed.
- M. Chergui, J. Chem. Phys., 2019, 150, 070901 CrossRef PubMed.
- J. Jortner and A. Treinin, Trans. Faraday Soc., 1962, 58, 1503–1510 RSC.
- M. J. Blandamer and M. F. Fox, Chem. Rev., 1970, 70, 59–93 CrossRef CAS.
- A. M. Rizzuto, S. Irgen-Gioro, A. Eftekhari-Bafrooei and R. J. Saykally, J. Phys. Chem. Lett., 2016, 7, 3882–3885 CrossRef CAS PubMed.
- D. Bhattacharyya, H. Mizuno, A. M. Rizzuto, Y. Zhang, R. J. Saykally and S. E. Bradforth, J. Phys. Chem. Lett., 2020, 11, 1656–1661 CrossRef CAS PubMed.
- S. J. Park, W. A. Narvaez and B. J. Schwartz, J. Phys. Chem. Lett., 2023, 14, 559–566 CrossRef CAS PubMed.
- W. A. Narvaez, S. J. Park and B. J. Schwartz, J. Phys. Chem. B, 2022, 126, 3748–3757 CrossRef CAS PubMed.
- D. M. Bartels, K. Takahashi, J. A. Cline, T. W. Marin and C. D. Jonah, J. Phys. Chem. A, 2005, 109, 1299–1307 CrossRef CAS PubMed.
- F.-Y. Jou and G. R. Freeman, J. Phys. Chem., 1977, 81, 909–915 CrossRef CAS.
- M. Jankowski, V. Belova, Y. Chushkin, F. Zontone, M. Levantino, T. Narayanan, O. Konovalov and A. Pastore, Nucl. Instrum. Methods Phys. Res. B: Beam Interact. Mater. At., 2023, 538, 164–172 CrossRef CAS.
- M. Cammarata, L. Eybert, F. Ewald, W. Reichenbach, M. Wulff, P. Anfinrud, F. Schotte, A. Plech, Q. Kong and M. Lorenc, et al. , Rev. Sci. Instrum., 2009, 80, 015101 CrossRef PubMed.
- A. J. C. Wilson and V. Geist, International Tables for Crystallography. Volume C: Mathematical, Physical and Chemical Tables, Kluwer Academic Publishers, Dordrecht/Boston/London, (published for the International Union of Crystallography), 1993 Search PubMed.
- A. O. Dohn, E. Biasin, K. Haldrup, M. M. Nielsen, N. E. Henriksen and K. B. Møller, J. Phys. B: At., Mol. Opt. Phys., 2015, 48, 244010 CrossRef.
- A. Dohn, V. Markmann, A. Nimmrich, K. Haldrup, K. Møller and M. Nielsen, J. Chem. Phys., 2023, 159, 124115 CrossRef CAS PubMed.
- K. Haldrup, G. Vankó, W. Gawelda, A. Galler, G. Doumy, A. March, E. Kanter, A. Bordage, A. Dohn and T. B. van Driel, et al. , J. Phys. Chem. A, 2012, 116, 9878–9887 CrossRef CAS PubMed.
- K. S. Kjær, T. B. Van Driel, J. Kehres, K. Haldrup, D. Khakhulin, K. Bechgaard, M. Cammarata, M. Wulff, T. J. Sørensen and M. M. Nielsen, Phys. Chem. Chem. Phys., 2013, 15, 15003–15016 RSC.
- V. Pham, I. Tavernelli, C. Milne, R. van der Veen, P. D'Angelo, C. Bressler and M. Chergui, Chem. Phys., 2010, 371, 24–29 CrossRef CAS.
- A. Karmakar and A. Chandra, J. Phys. Chem. B, 2015, 119, 8561–8572 CrossRef CAS PubMed.
- C. D. Wick and S. S. Xantheas, J. Phys. Chem. B, 2009, 113, 4141–4146 CrossRef CAS PubMed.
- P. Li, L. F. Song and K. M. Merz Jr, J. Chem. Theory Comput., 2015, 11, 1645–1657 CrossRef CAS PubMed.
- I. S. Joung and T. E. Cheatham III, J. Phys. Chem. B, 2008, 112, 9020–9041 CrossRef CAS PubMed.
- G. H. Peslherbe, B. M. Ladanyi and J. T. Hynes, Chem. Phys., 2000, 258, 201–224 CrossRef CAS.
- K. P. Jensen and W. L. Jorgensen, J. Chem. Theory Comput., 2006, 2, 1499–1509 CrossRef CAS PubMed.
- B. A. Bauer and S. Patel, J. Chem. Phys., 2010, 132, 024713 CrossRef PubMed.
- W. L. Jorgensen, J. P. Ulmschneider and J. Tirado-Rives, J. Phys. Chem. B, 2004, 108, 16264–16270 CrossRef CAS.
- B. Bockrath and L. M. Dorfman, J. Phys. Chem., 1973, 77, 1002–1006 CrossRef CAS.
- S. Koneshan, J. C. Rasaiah, R. Lynden-Bell and S. Lee, J. Phys. Chem. B, 1998, 102, 4193–4204 CrossRef CAS.
- K. B. Møller, R. Rey, M. Masia and J. T. Hynes, J. Chem. Phys., 2005, 122, 114508 CrossRef PubMed.
- R. E. Larsen, W. J. Glover and B. J. Schwartz, Science, 2010, 329, 65–69 CrossRef CAS PubMed.
- F. Uhlig, O. Marsalek and P. Jungwirth, J. Phys. Chem. Lett., 2012, 3, 3071–3075 CrossRef CAS PubMed.
- K. Carter-Fenk, B. A. Johnson, J. M. Herbert, G. K. Schenter and C. J. Mundy, J. Phys. Chem. Lett., 2023, 14, 870–878 CrossRef CAS PubMed.
- T. Quickenden and J. Irvin, J. Chem. Phys., 1980, 72, 4416–4428 CrossRef CAS.
- H. Iglev, A. Trifonov, A. Thaller, I. Buchvarov, T. Fiebig and A. Laubereau, Chem. Phys. Lett., 2005, 403, 198–204 CrossRef CAS.
Footnotes |
| † Electronic supplementary information (ESI) available. See DOI: https://doi.org/10.1039/d4sc01912a |
| ‡ Present address: University of Washington, Department of Chemistry, Seattle, WA 98105, USA. |
| § Present address: SLAC National Accelerator Laboratory, Menlo Park, California 94025, USA. |
| This journal is © The Royal Society of Chemistry 2024 |