
 Open Access Article
 This Open Access Article is licensed under a Creative Commons Attribution-Non Commercial 3.0 Unported Licence
Multicolor photoluminescence of Cu14 clusters modulated using surface ligands†‡
Arijit
Jana
a,
Subrata
Duary
a,
Amitabha
Das
 b,
Amoghavarsha Ramachandra
Kini
a,
Swetashree
Acharya
a,
Jan
Machacek
c,
Biswarup
Pathak
*b,
Tomas
Base
*c and
Thalappil
Pradeep
*a
b,
Amoghavarsha Ramachandra
Kini
a,
Swetashree
Acharya
a,
Jan
Machacek
c,
Biswarup
Pathak
*b,
Tomas
Base
*c and
Thalappil
Pradeep
*a
aDST Unit of Nanoscience (DST UNS), Thematic Unit of Excellence (TUE), Department of Chemistry, Indian Institute of Technology, Madras, Chennai 600036, India. E-mail: pradeep@iitm.ac.in
bDepartment of Chemistry, Indian Institute of Technology Indore, Indore 453552, India. E-mail: biswarup@iiti.ac.in
cDepartment of Syntheses, Institute of Inorganic Chemistry, The Czech Academy of Sciences, 1001 Husinec – Rez, 25068, Czech Republic. E-mail: tbase@iic.cas.cz
First published on 30th July 2024
Abstract
Copper nanoclusters exhibit unique structural features and their molecular assembly results in diverse photoluminescence properties. In this study, we present ligand-dependent multicolor luminescence observed in a Cu14 cluster, primarily protected by ortho-carborane-9,12-dithiol (o-CBDT), featuring an octahedral Cu6 inner kernel enveloped by eight isolated copper atoms. The outer layer of the metal kernel consists of six bidentate o-CBDT ligands, in which carborane backbones are connected through μ3-sulphide linkages. The initially prepared Cu14 cluster, solely protected by six o-CBDT ligands, did not crystallize in its native form. However, in the presence of N,N-dimethylformamide (DMF), the cluster crystallized along with six DMF molecules. Single-crystal X-ray diffraction (SCXRD) revealed that the DMF molecules were directly coordinated to six of the eight capping Cu atoms, while oxygen atoms were bound to the two remaining Cu apices in antipodal positions. Efficient tailoring of the cluster surface with DMF shifted its luminescence from yellow to bright red. Luminescence decay profiles showed fluorescence emission for these clusters, originating from the singlet states. Additionally, we synthesized microcrystalline fibers with a one-dimensional assembly of DMF-appended Cu14 clusters and bidentate DPPE linkers. These fibers exhibited bright greenish-yellow phosphorescence emission, originating from the triplet state, indicating the drastic surface tailoring effect of secondary ligands. Theoretical calculations provided insights into the electronic energy levels and associated electronic transitions for these clusters. This work demonstrated dynamic tuning of the emissive excited states of copper nanoclusters through the efficient engineering of ligands.
Introduction
Atomically precise nanoclusters of transition metals, especially copper, are an emerging class of quantum materials with multicolor luminescence characteristics.1–3 Based on their structure-specific optical emission characteristics, these ultra-small copper clusters have great potential in the areas of bioimaging,4,5 X-ray scintillation devices,6,7 molecular recognition,8,9 optoelectronic devices10,11 and photo-assisted catalytic transformation reactions.12 Small copper clusters (nuclearity below 15) usually show strong visible luminescence, whereas medium and large clusters (nuclearity greater than 15) exhibit weak emission in the near-infrared (NIR) region and some of them are non-emissive.13–15 Such variability in emission properties can be assigned to the size confinement effect, surface defects, and structural isomerization, as well as to the contribution of Cu d orbitals. For example, various notable reports of ultrasmall copper clusters, i.e., Cu4,16 Cu6,17 Cu8,18 Cu12,19 Cu13![[thin space (1/6-em)]](https://www.rsc.org/images/entities/char_2009.gif) 20 and Cu14,21 emit light with high quantum yields. There is a report of Cu15 NCs with weak NIR emission characteristics in the crystalline state.22 On the other hand, large copper clusters, i.e., Cu20,23 Cu25,24 Cu36,25 Cu50,26 Cu53,27 Cu6128 and Cu81,29 protected by various phosphine and thiol ligands are reported to exhibit no emission at all. The structural investigation of such clusters is essential to understand their excited state electronic relaxation behavior. We note that the family of copper clusters is less explored in comparison to gold and silver analogues due to a number of factors including slow-reducing nature, lower half-cell potential (0.52 V) of CuI/Cu0, and higher reactivity under ambient conditions.30 Sometimes, spontaneous self-aggregation of clusters results in amorphous, insoluble aggregates with a lower tendency for crystallization. As a result, the synthesis and crystallization of new copper clusters with tunable optical properties represents an unexplored research area of atomically precise nanomaterials.
20 and Cu14,21 emit light with high quantum yields. There is a report of Cu15 NCs with weak NIR emission characteristics in the crystalline state.22 On the other hand, large copper clusters, i.e., Cu20,23 Cu25,24 Cu36,25 Cu50,26 Cu53,27 Cu6128 and Cu81,29 protected by various phosphine and thiol ligands are reported to exhibit no emission at all. The structural investigation of such clusters is essential to understand their excited state electronic relaxation behavior. We note that the family of copper clusters is less explored in comparison to gold and silver analogues due to a number of factors including slow-reducing nature, lower half-cell potential (0.52 V) of CuI/Cu0, and higher reactivity under ambient conditions.30 Sometimes, spontaneous self-aggregation of clusters results in amorphous, insoluble aggregates with a lower tendency for crystallization. As a result, the synthesis and crystallization of new copper clusters with tunable optical properties represents an unexplored research area of atomically precise nanomaterials.
Surface ligands are essential not only for the structural stability of the clusters but also for tuning their electronic properties. Various ligands such as phosphines,31 selenols,32 thiols,33 carbenes,34 amidinates,35 alkynyls36 and mixed ligands37,38 have been used for stabilizing different metal clusters. Solvent molecules and secondary ligand-assisted modulation of the optical absorption and emission features have also been observed in various metal NCs.39,40 For example, the Ag29 nanocluster shows multifold emission enhancement by the surface modification of diphosphine ligands and external solvent conjugated counter ions.41,42 Theoretical studies verified the surface-sensitive electronic nature of metal clusters. In this regard, using bulky carborane-thiol ligands with 3D aromaticity within their nearly icosahedral molecular framework reduces the reactivity associated with the metal core of the cluster and modulates its optical properties. A handful of copper clusters, such as Cu4,43 Cu14,44 Cu1621 and Cu17,45 stabilized with carborane thiols, have been synthesized and their structure-specific luminescence properties have been reported. However, secondary ligand-assisted luminescence tuning is less known for carborane-thiol protected nanoclusters. As a result, ligand-specific luminescence tailoring of carborane-thiol protected copper clusters is a growing area of research with exciting opportunities.
Cluster-assembled framework solids (CAFSs) are a new class of materials in which, clusters act as nodes for the framework. These materials are similar to well-known metal–organic frameworks (MOFs).46 Although there are several reports of gold, silver, copper and their alloy clusters, only a few CAFS materials have been synthesized to date.47–49 Most of them are composed of silver clusters as nodes with multidentate pyridines, such as pyrazine,50 4,4′-bipyridine,51 4,4′-azopyridine,52 benzene-1,3,5-tricarboxylic acid tris-pyridin-4-ylamide,53 5,10,15,20-tetra(4-pyridyl)porphyrin,54 1,1,2,2-tetrakis(4-(pyridin-4-yl)phenyl)-ethene,55etc., as linkers. The strongly coordinating nitrogen atoms of the aromatic pyridine rings promote coordination with open metal centers. Such framework solids retain the functional properties of the metal clusters and exhibit enhanced thermal, catalytic and optical stabilities compared to the parent clusters. In the present work, we have introduced a bidentate diphosphine molecule, which can be used as an alternative linker for synthesizing framework solids of copper clusters.
In this work, we have synthesized an ortho-carborane-9,12-dithiol (o-CBDT)-protected Cu14 cluster using the ligand exchange reaction. This cluster (abbreviated as Cu14) was crystallized with six DMF molecules (abbreviated as Cu14–DMF). High-resolution mass spectrometric analyses confirmed the formation of clusters, bare as well as solvated with DMF. A comparison of the Cu14 cluster with the respective DMF-solvated cluster showed a significant change in optical emission properties. In the presence of DPPE as a linker, the red emissive Cu14–DMF clusters grow into microcrystalline fibers (abbreviated as Cu14-fiber) upon a one-dimensional framework assembly of the cluster and linkers with bright yellowish-green emission. The binding of the secondary ligands to the core–shell type Cu14 cluster results either in clusters separated (zero-dimensional) or linked into a fiber (one-dimensional framework) with characteristic tunable emission properties. This study showcases multiple optical emissive states of clusters that are precisely altered by tuning the surface ligands.
Results and discussion
Synthesis of the Cu14 cluster and its surface tailoring using DMFs
The Cu14 cluster was synthesized using the ligand exchange reaction of the o-CBDT ligand with the [Cu18(DPPE)6H16] cluster, protected by DPPE and hydride ligands [DPPE = 1,2-bis(diphenylphosphino)ethane]. The details of the synthesis are shown in the Experimental section. At the end of an overnight reaction, the Cu14 cluster was formed, resulting in a yellow-colored solution. The UV-vis absorption spectrum of the Cu14 cluster (measured in dichloromethane (DCM) solution) showed no characteristic absorption peak. Instead, a broad absorption band, slightly below 450 nm was observed (shown in Fig. 1b). After dissolving the Cu14 cluster in a DCM:DMF (1:1 v/v) mixture of solvents, two weak UV-vis absorption bands at 366 and 418 nm appeared. Similar absorption features were also observed by dissolving the Cu14 cluster in DMF. Such variation of the absorption features suggests DMF-assisted transformation of these clusters at the molecular level. The molecular composition of clusters before and after DMF addition was analyzed using high-resolution electrospray ionization mass spectrometry (HR-ESIMS). A Waters Synapt G2Si HDMS instrument with a nano-ESI source coupled with a time-of-flight mass analyzer was used for the measurement. The details of the MS instrumentation and sample preparation are shown in the ESI.‡ The positive ion mode ESI-MS spectrum of the Cu14 cluster shows one major peak at m/z 2127.74 in the positive (1+) charge state (Fig. 1c), which was assigned to the molecular composition, [Cu14(S2C2B10H10)6]+. The isotopic distribution of the experimental spectrum matches well with the theoretical one (shown as an inset of Fig. 1c). To gain additional insight, tandem MS-MS fragmentation studies by varying the collision energy (CE) of the selected molecular ion (at m/z 2127.74) were performed (data are shown in Fig. S1‡). Up to a CE of 70 eV, no fragmentation of the selected molecular ion peak was observed. Increasing the CE from 75 to 150 eV resulted in the appearance of new fragmented peaks at m/z 2064.06, 1461.39, 1397.49, 1286.26, 1223.30, 1112.78 and 1048.98. These peaks were assigned to [Cu13(S2C2B10H10)6]+, [Cu10(S2C2B10H10)4]+, [Cu9(S2C2B10H10)4]+, [Cu10S(S2C2B10H10)3]+, [Cu9S(S2C2B10H10)3]+, [Cu10S2(S2C2B10H10)2]+ and [Cu9S2(S2C2B10H10)2]+, respectively. Systematic losses of fragments consisting of Cu accompanied by mono- and dithiolate-carborane fragments further confirmed the molecular composition of the Cu14 cluster. Systematic fragmentation of surface ligands and metal-thiolate motifs by applying CE was in agreement with our earlier studies of carborane thiol-protected silver and copper clusters.43,56,57
 | ||
| Fig. 1 (a) Schematic representation shows the attachment of DMF molecules to the outer shell of the as-synthesized Cu14 cluster. Color code: orange, copper; yellow, sulfur; green, boron; grey, carbon; red, oxygen; blue, nitrogen; white, hydrogen. (b) Comparative UV-vis absorption spectra of both clusters. Positive ion-mode ESI-MS spectrum of (c) as-synthesized Cu14 without any DMFs (cluster dissolved in DCM or acetonitrile for MS studies) and (d) with five DMFs and three oxygens (after the addition of DMF to the solution). Inset shows exact matching of the isotopic distribution of the experimental peak with the simulated pattern. | ||
Additionally, we have investigated the mass spectrum of the Cu14 cluster after adding a small amount (0.5–0.75 ml) of DMF. The positive ion mode ESI-MS spectrum shows two prominent peaks at m/z 2127.66 and 2540.9 in the positive (1+) charge state (Fig. 1d). Along with the original [Cu14(S2C2B10H10)6]+ (m/z 2127.66) peak, the appearance of the new peak at m/z 2540.9 indicates the binding of five DMFs and three oxygen with the parent Cu14 cluster. The isotopic distribution of the experimental spectrum matches well with the theoretically simulated one (shown as an inset of Fig. 1d).
The collision energy dependent MS-MS fragmentation (at a CE of 15 eV) of the selected peak at m/z 2540.9 (Fig. S2‡) shows the appearance of a new peak at m/z 2127.32 and this mass loss of 413.24 units corresponds to the loss of all five molecules of DMFs and three oxygen atoms from the cluster. Along with this primary peak, another secondary overlapped peak (at m/z 2143.26) appeared at a CE of 60 eV, manifesting the formation of [Cu14(S2C2B10H10)6O]+ species. Three minor peaks (appeared at the increased CE of 100 eV) at m/z 1921.16, 1857.36 and 1461.43 match well with the species of [Cu14(S2C2B10H10)5]+, [Cu13(S2C2B10H10)5]+ and [Cu10(S2C2B10H10)4]+, respectively. These three peaks indicate the fragmentation of kernel metal atoms and surface bound o-CBDT ligands. Altogether, mass spectrometric studies verified the formation of DMF and oxygen bound clusters from the parent Cu14 cluster.
Structure of the Cu14–DMF cluster
The as-prepared Cu14 cluster did not crystallize from its DCM solution. However, it formed yellow cube-like crystals at room temperature (25 °C) from a DCM:DMF (1:1, v/v) mixture. The optical microscopy images of these cuboidal crystals are shown in Fig. S3.‡ The surface topography of the same crystals under different magnifications (by FESEM studies) is shown in Fig. S4.‡ Single crystal X-ray diffraction of a suitable crystal revealed that the nanocluster crystallized in a trigonal crystal system with the space group of R![[3 with combining macron]](https://www.rsc.org/images/entities/char_0033_0304.gif) :H. Crystallographic data are summarized in more detail in Tables S1–S4.‡ The total molecular structure of the cluster, including six o-CBDT, two oxygen and six DMF, is shown in Fig. 2b and d. Although the as-prepared cluster did not have any DMFs, the addition of this solvent enhanced the crystallization tendency of the clusters by facilitating short contact interactions. The EDS elemental spectrum showed 6.34 atomic% of nitrogen and also proved the presence of nitrogen in the crystal (shown in Fig. S5‡). It is noteworthy that no counter ions were detected in the unit cell of this cationic cluster. This absence is attributed to the lack of intense diffraction peaks at higher angles for these crystals. However, the negative ion mode ESI-MS spectrum of dissolved single crystals revealed an intense peak at m/z 126.9, indicating that iodide serves as a counter ion for the cluster (see Fig. S6‡). The powder X-ray diffraction (PXRD) spectrum of Cu14–DMF showed good agreement with the simulated spectrum obtained from SCXRD data, indicating the phase purity of the sample (see Fig. S7‡). The primary diffraction peaks are centered at 2θ values of 6.02°, 7.99°, 9.05°, 10.88°, and 12.85°, corresponding to (101), (2–10), (003), (20–1), and (2–13) lattice planes, respectively.
:H. Crystallographic data are summarized in more detail in Tables S1–S4.‡ The total molecular structure of the cluster, including six o-CBDT, two oxygen and six DMF, is shown in Fig. 2b and d. Although the as-prepared cluster did not have any DMFs, the addition of this solvent enhanced the crystallization tendency of the clusters by facilitating short contact interactions. The EDS elemental spectrum showed 6.34 atomic% of nitrogen and also proved the presence of nitrogen in the crystal (shown in Fig. S5‡). It is noteworthy that no counter ions were detected in the unit cell of this cationic cluster. This absence is attributed to the lack of intense diffraction peaks at higher angles for these crystals. However, the negative ion mode ESI-MS spectrum of dissolved single crystals revealed an intense peak at m/z 126.9, indicating that iodide serves as a counter ion for the cluster (see Fig. S6‡). The powder X-ray diffraction (PXRD) spectrum of Cu14–DMF showed good agreement with the simulated spectrum obtained from SCXRD data, indicating the phase purity of the sample (see Fig. S7‡). The primary diffraction peaks are centered at 2θ values of 6.02°, 7.99°, 9.05°, 10.88°, and 12.85°, corresponding to (101), (2–10), (003), (20–1), and (2–13) lattice planes, respectively.
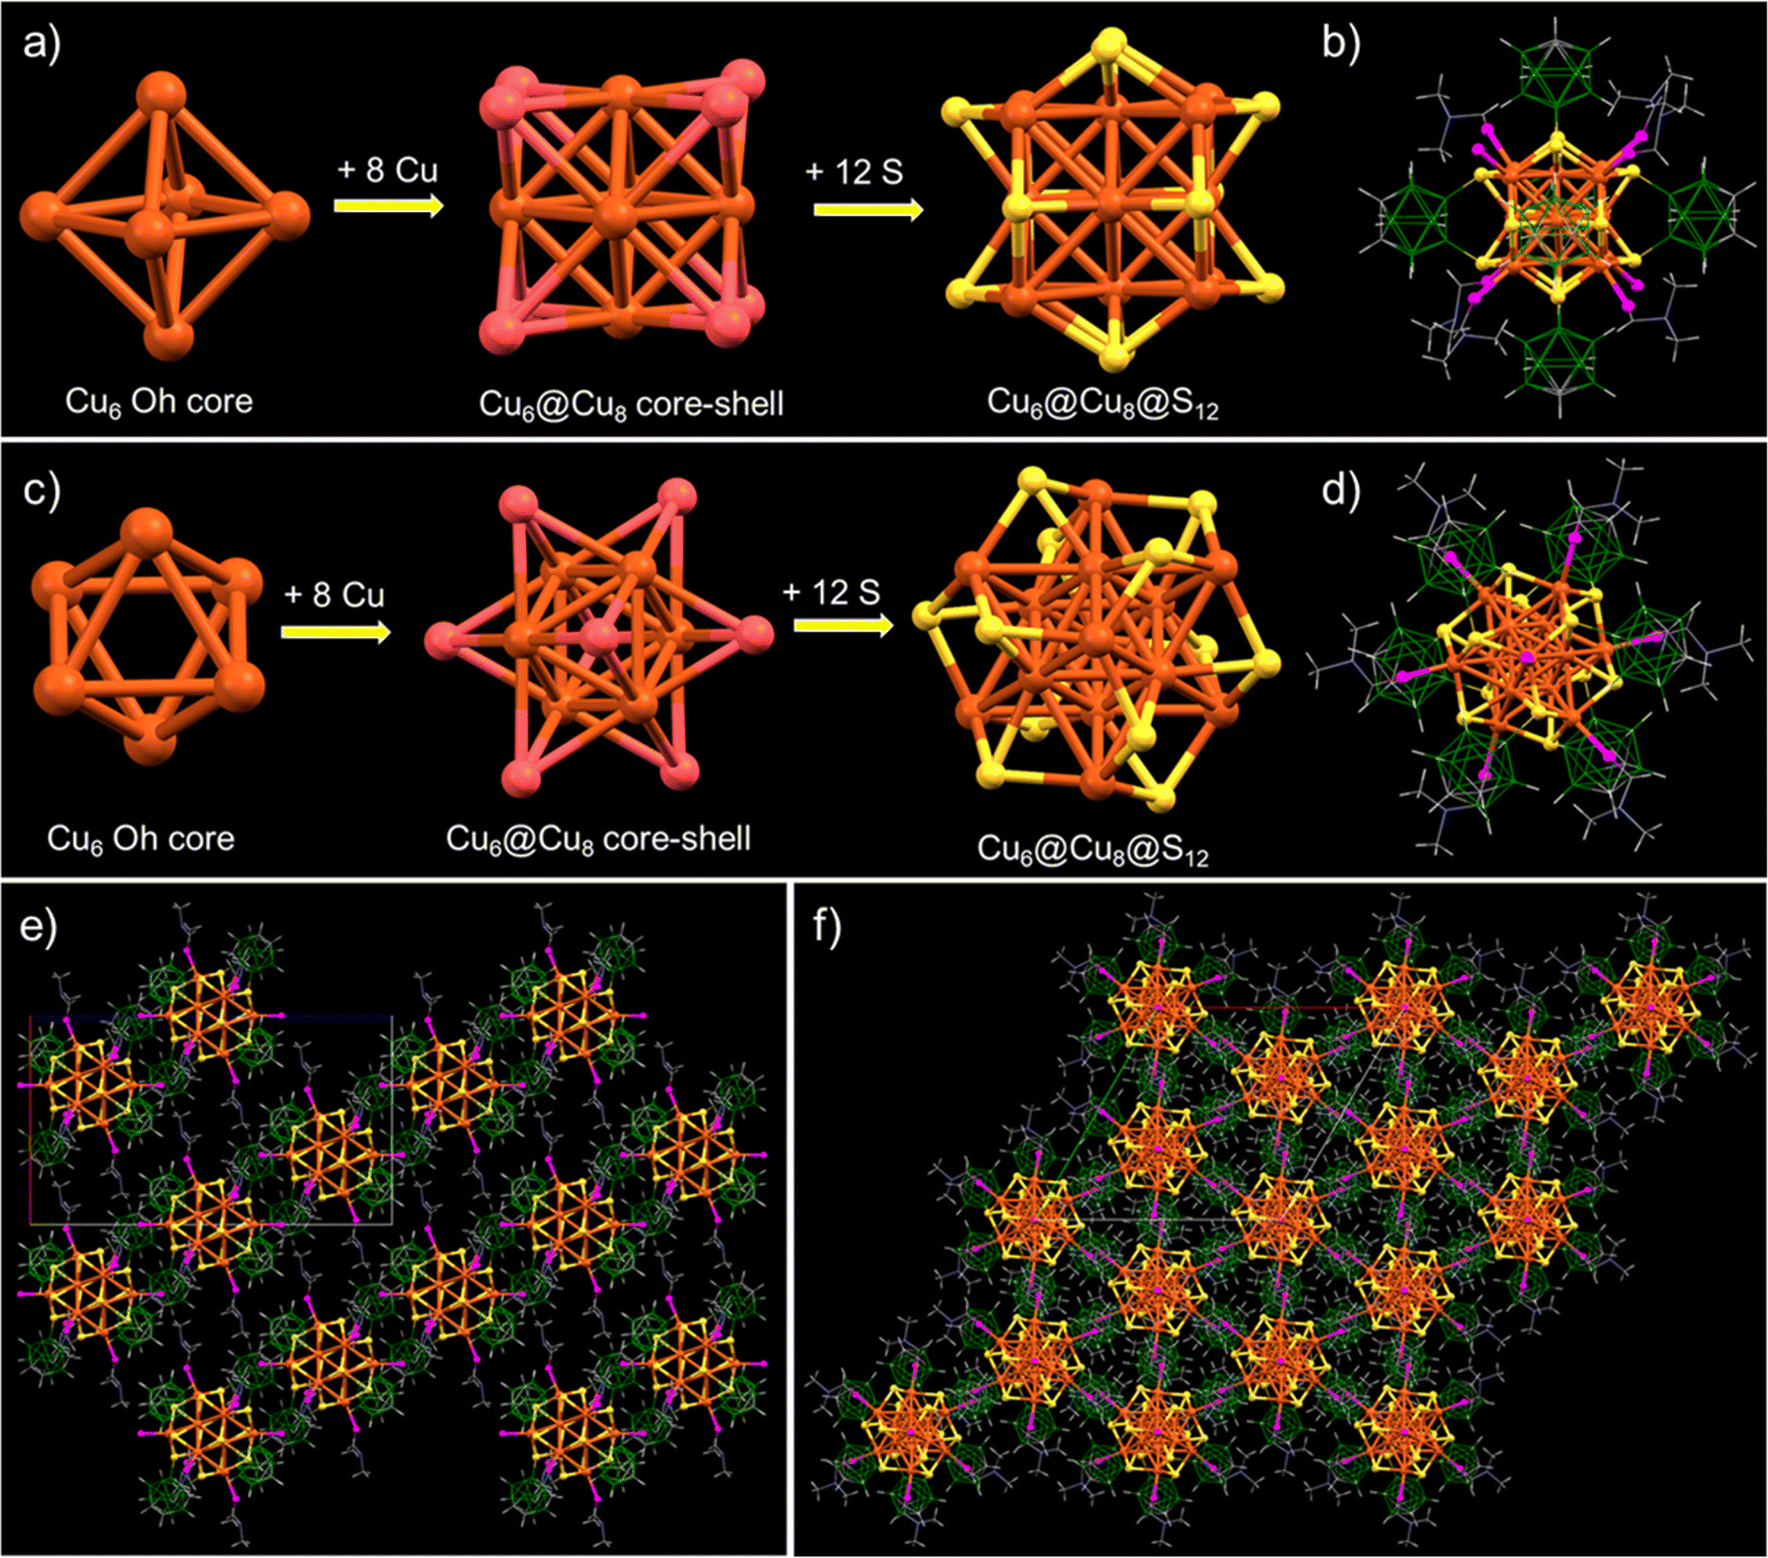 | ||
| Fig. 2 (a and c) Structural anatomy of the Cu14–DMF cluster with an octahedral Cu6 inner kernel encapsulated by eight Cu atoms resulting in a Cu6@Cu8 octacapped-octahedral core–shell geometry. Copper sulphide (Cu14S12) framework structure, viewed from two different orientations. (b and d) The full molecular structure of the Cu14 nanocluster with six primary ortho-carborane-9,12-dithiol ligands and secondary DMF molecules. Supramolecular packing of the same nanocluster viewed along (e). (b and f) c crystallographic orientations. Color code: orange and crimson red = copper, yellow = sulfur, magenta = oxygen, green = boron, grey = carbon, blue = nitrogen, and white = hydrogen. | ||
To gain deeper insights into the atomic structure, the framework of the cluster was analyzed in detail. The cluster has an octahedral Cu6 inner kernel with an average Cu–Cu distance of 2.65 Å (shown in Fig. 2a and c). The inner kernel is further surrounded by eight copper atoms, positioned above the trigonal faces of the inner Cu6 octahedron. The interatomic Cu–Cu distances of these capping Cu atoms from the octahedral inner kernel Cu atoms range from 2.65 to 2.75 Å and the distance from the centroid of the Cu3 face of the inner octahedron to the capped Cu atoms connected to the oxygen of DMF is 2.19 Å, while that to the Cu atoms bound to a free oxygen is 2.29 Å (shown in Fig. S8‡). This observation indicates that the two Cu atoms connected to free oxygens are further away than the other six Cu atoms capping the triangular faces of the kernel. Six bidentate o-CBDT ligands are connected to the outer portion of the core–shell region, where each S is μ3 bridging three Cu atoms, one from the Cu6 inner kernel and two from the Cu8 outer shell. The Cu–S distance is 2.31–2.36 Å. A similar type of core–shell structural geometry was earlier reported for Ag14 clusters.58,59
The complete molecular structure of the cluster (shown in Fig. 2b and d) demonstrated that six carborane ligands are situated above the faces of the cube formed by the eight outer Cu atoms of the cluster, where the distances between the centroids of the carboranes are 12.49–12.78 Å (shown in Fig. S9‡). Along with these carboranes, six DMF molecules and two oxygen atoms are connected to the eight outer copper atoms, with the DMF at the apices of a trigonal antiprism and the oxygen substituted copper atoms capping its bases (shown in Fig. 2d). The interatomic distance between the two bare oxygens is 11.37 Å (shown in Fig. S10‡).
We have analyzed the solid-state packing of the Cu14–DMF cluster and examined various intercluster interactions responsible for their solid-state packing. This trigonal crystal system is packed as slanted layers of clusters (along the b crystallographic axis), with an average interlayer spacing of 14.9 Å (shown in Fig. 2e). Alternatively, it resembles hexagonal packing along the c crystallographic axis, with each cluster tightly packed alongside six neighboring cluster units, as illustrated in Fig. 2f. Careful observations of the intermolecular non-van der Waals interactions reveal that all three types of major interactions, namely CH⋯O, CH⋯B and CH⋯HB, are centered on the methyl C–H end of the DMF molecules (Fig. 3a and b). The average bond lengths of CH⋯O, CH⋯B and CH···HB interactions are 2.81, 3.04 and 2.19 Å, respectively (Fig. 3c). Our failure to obtain crystals of Cu14 without the additional DMF may be linked to the lack of opportunities for such intermolecular interactions.
 | ||
| Fig. 3 (a) Different types of intermolecular non-van der Waals interactions of a unit cell of the Cu14–DMF cluster. (b) Expanded view of the same interactions of a single cluster. The methyl groups of the secondary DMFs heavily interact with neighboring clusters through these interactions. (c) The CH⋯O, CH⋯B and CH···HB interactions of DMF with marked distances. | ||
Additional characterization of Cu14 and Cu14–DMF clusters
Infrared (IR) spectroscopy further verified the binding of the ligands present in these clusters. The IR vibrational bands at 2595 and 2612 cm−1 (for Cu14) and 2594 and 2616 cm−1 (for Cu14–DMF) were assigned to the B–H stretching vibrations and those at 3056 cm−1 (both for Cu14 and Cu14–DMF) were assigned to the C–H vibrations of the carborane ligands (shown in Fig. S11‡). The broad appearance of the vibrational bands for these clusters in comparison to the free o-CBDT ligand is probably due to the prominent ligand-centered intercluster interactions, as similar broadening of vibrational bands has been reported for alcoholic species dominated by strong hydrogen bonding interactions.60 The vibrational bands at 1190, 1102, 980 and 871 cm−1 (for Cu14 and Cu14–DMF) are assigned to various B–B–B and B–B–C bending modes, while the band at 731 cm−1 (for both Cu14 and Cu14–DMF) is related to the carborane cage breathing mode of the ligand.X-ray photoelectron spectroscopy (XPS) analysis was performed to understand the chemical environments of the constituent elements present in the cluster. The XPS survey spectrum shows the presence of the expected elements Cu, S, B and C in both clusters (Fig. S12‡). The selected spectral regions of Cu 2p3/2 and 2p1/2 at 932.5 and 952.4 eV, respectively, pointed out the presence of mixed Cu0 and CuI oxidation states, which were observed in previous studies of copper clusters too.61,62 The spectral analysis of the Cu LMM region revealed a single peak at ∼570 eV for both Cu14 and Cu14–DMF clusters, indicating a similar oxidation state for copper in both clusters (see Fig. S13‡).63,64 Spectral fittings of the C 1s region showed one major peak at 284.8 for both clusters, and a minor peak at 286.7 was observed for the Cu14–DMF cluster, due to the presence of DMF ligands. Thermogravimetric analysis (TGA) was conducted to investigate the thermal stability of these clusters. The results (shown in Fig. S14 and S15‡) revealed a weight loss of 13.47% at 113.2 °C for Cu14 and 16.10% at 119.3 °C for Cu14–DMF. The mass reduction in both cases can be attributed to the detachment of o-CBDT ligands or their fragments from the Cu14 cluster, whereas Cu14–DMF exhibited additional loss of DMF molecules too. Therefore, the overall mass loss upon heating up to 400 °C for Cu14–DMF (∼46%) exceeds that of the Cu14 cluster (∼31%) for ∼15%, which corresponds to approximately 6 molecules of DMF.
Luminescence modulation of Cu14 by surface tailoring of DMF
We examined the photoluminescence properties of both Cu14 and Cu14–DMF clusters. The as-prepared Cu14 cluster has yellow luminescence both in solid and solution states. However, the Cu14 cluster tailored with DMF shows bright red luminescence in solution in both states (shown in the inset of Fig. 4a). Photoluminescence emission measurements show that the Cu14 cluster (in DCM solution) has an emission maximum at 599 nm upon photoexcitation at 400 nm (Fig. 4a). Excitation spectra are shown in Fig. S16.‡ We have observed significant emission enhancement (∼10 times) of the cluster upon its solidification by keeping the emission maxima at the same wavelength, i.e., at 599 nm.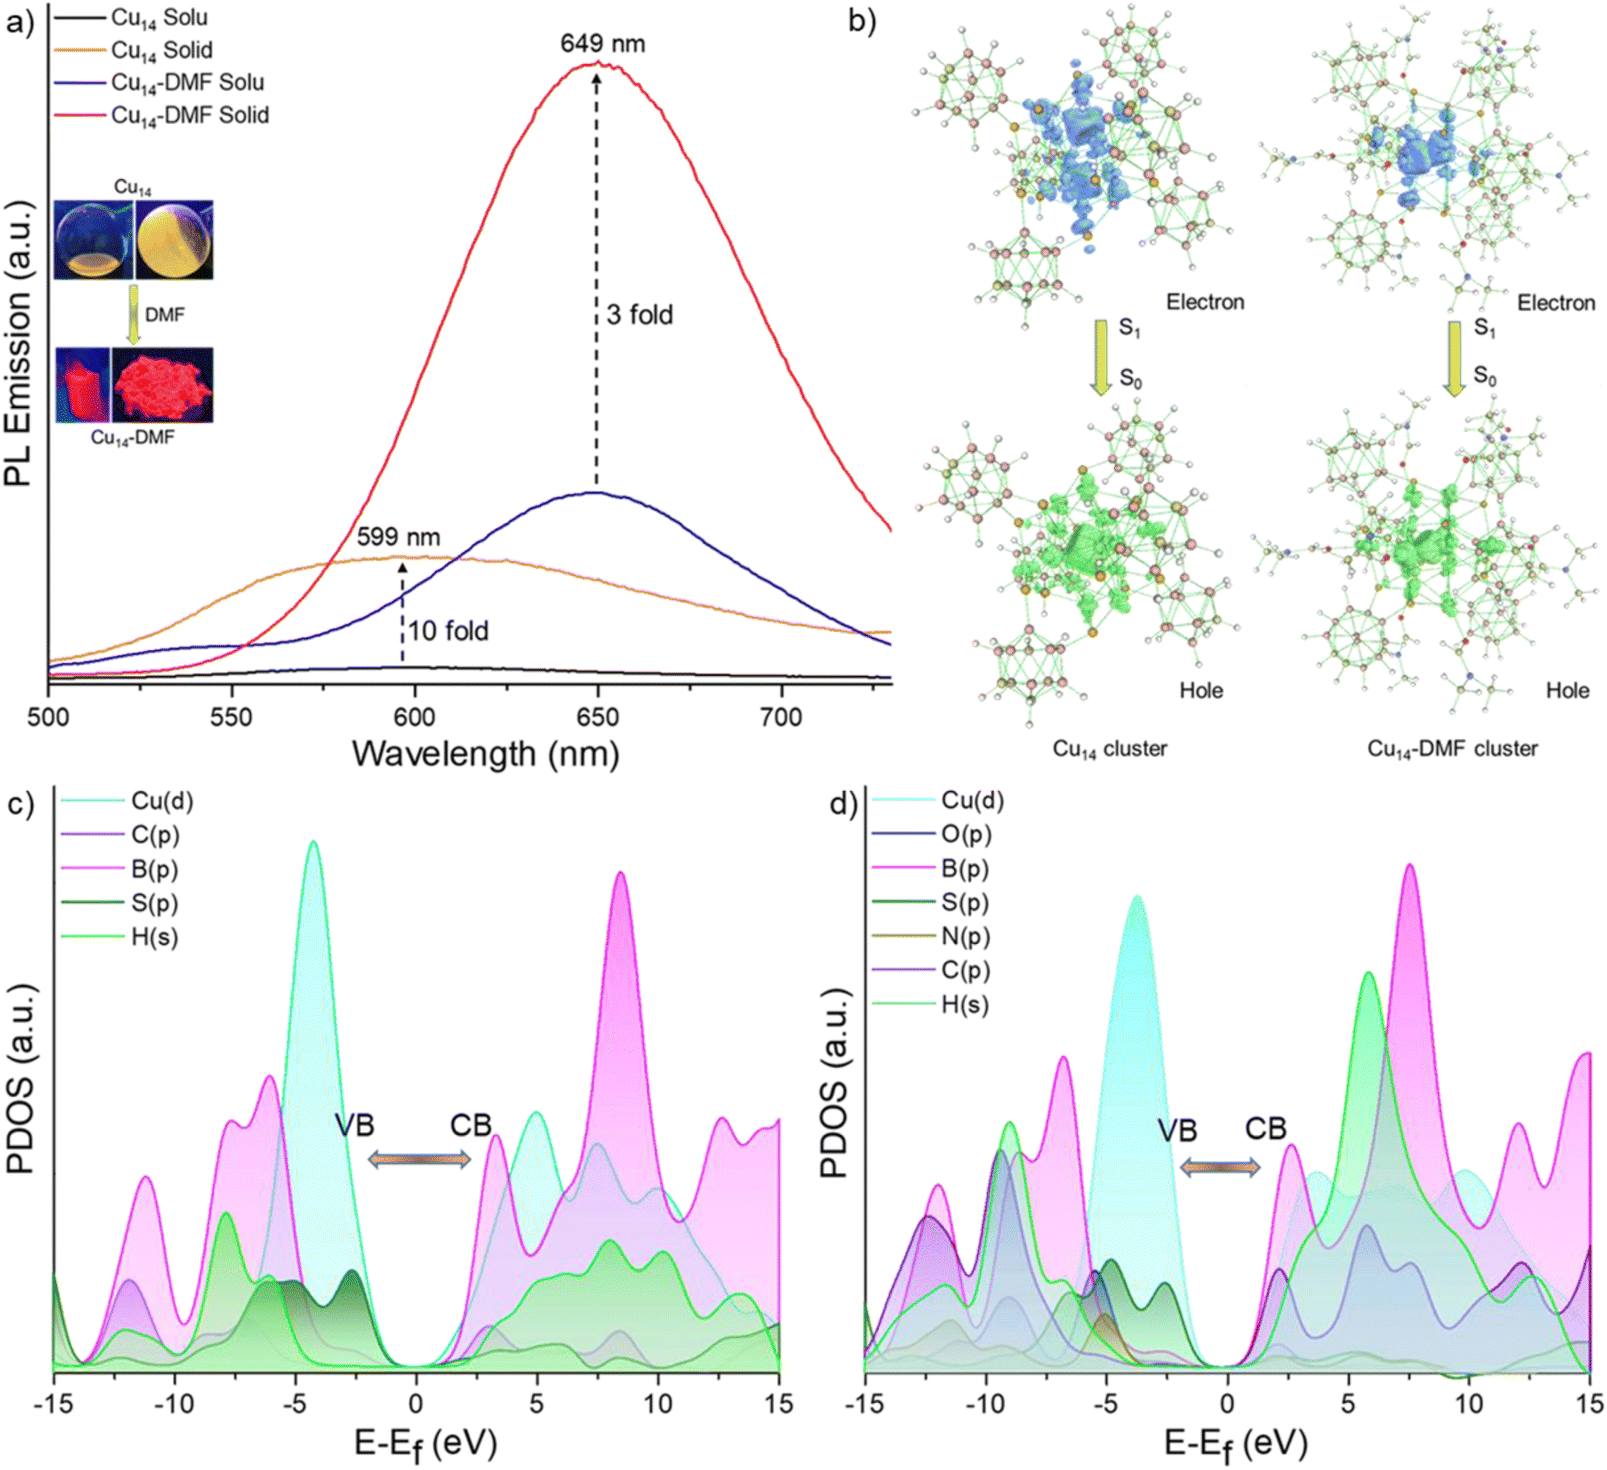 | ||
| Fig. 4 (a) Photoluminescence emission spectra of Cu14 and Cu14–DMF clusters in solution and solid states. Surface functionalization of the Cu14 nanocluster with DMF results in enhanced emission with the emission maximum red shifted from yellow to red. Inset shows the photograph of the respective clusters under 365 nm UV light. Distribution of holes and electrons in the natural transition orbitals (NTOs) for the emissive relaxation, i.e., S1 → S0 of (b) Cu14 and Cu14–DMF clusters. PDOS plot of the (c) Cu14 and (d) Cu14–DMF clusters, where VB = valence band and CB = conduction band. | ||
The addition of DMF showed ∼15-fold emission enhancement with a 50 nm red shift of the emission band from 599 to 649 nm. The Cu14–DMF cluster shows 3-fold enhanced emission upon solidification, keeping the emission band at the same position. We estimated the relative quantum yield (RQY) of these clusters and found it to be approximately ∼10% and ∼23% for Cu14 and Cu14–DMF clusters, respectively, in the solid state and ∼4.6% and ∼15.05% in their respective solutions. The variation of luminescence upon self-aggregation, the chemical binding of secondary ligands and the effect of external stimuli such as temperature and pressure have been observed for other copper clusters before.65–67 Luminescence decay measurements show a fast decay lifetime of 0.33 ns for the Cu14 cluster in solution, which increases to 5.54 ns upon solidification (Fig. S17a and b‡). The Cu14–DMF cluster exhibits an emissive lifetime of 0.3 ns in DMF solution and 3.7 ns in the solid state (Fig. S17c and d‡). These rapid excited state decay profiles suggest that the fluorescence emission for both clusters originates from their singlet excited states. Oxygen sensitivity experiments (shown in Fig. S18‡) showed no significant emission quenching after oxygen bubbling, which further verified the presence of a singlet excited state for both clusters.
Theoretical understanding of electronic energy levels
Density functional theory (DFT) and time-dependent DFT calculations were conducted using the Gaussian 09 package to understand the electronic structures and associated optical absorption and emission spectra for these clusters.68 The calculated UV-vis absorption spectrum of the Cu14–DMF cluster shows two absorption bands at 320 and 417 nm, which are in good agreement with the weakly resolved experimental absorption bands (Fig. S19a‡). These absorption peaks at 320 and 417 nm are attributed to the electronic transitions from HOMO−15 to LUMO+9 and HOMO to LUMO+17 levels, respectively (where the HOMO is the highest occupied molecular orbital and the LUMO is the lowest unoccupied molecular orbital). The electron density maps of these molecular orbitals show that HOMO−15 and HOMO are kernel centered and LUMO+9 and LUMO+17 are delocalized towards the peripheral ligand shell (Fig. S19b‡). Therefore, electronic absorption occurred from the core to the ligand states. These excitations of electrons are from the d and p-core orbitals of Cu and S, respectively, to the p-orbitals of C and B in the ligand part. These observations are further supported by the quantitative Kohn–Sham orbital analysis (Fig. S20‡). For the Cu14–DMF cluster, the LUMO state exhibits a greater contribution from DMF, indicating the significant role of DMF in influencing the electronic properties of the cluster (Fig. S20‡). The electron density maps of the frontier molecular orbitals, i.e., the HOMO and LUMO of these clusters, are shown in Fig. S21.‡To understand the origin of the fluorescence of Cu14 and Cu14–DMF clusters, we have systematically studied the low-lying singlet excited states of the clusters. Initially, the excited state S1 geometry of both clusters was optimized. On the basis of the optimized geometry of the S1 states, the vertical emission bands for the S1 → S0 transition have been calculated to be at 615 nm and 647 nm with an oscillator strength of 1.1 × 10⁻³ and 1.3 × 10⁻³ for Cu14 and Cu14–DMF clusters, respectively. These values closely align with the experimental results. Natural transition orbital (NTO) analysis (Fig. 4b) revealed that the distribution of holes is localized in the Cu6 inner kernel and Cu6@Cu8 core–shell regions and electrons are diffused towards the outer Cu8–S12 motifs and metal–ligand interfacial region of the cluster, primarily involving Cu-d orbitals for the hole and S-p orbitals for the electron. So, the electronic population of the inner copper-sulphide region of these clusters is predominantly responsible for their emissive states. Additionally, the projected density of states (PDOS) analysis (Fig. 4c and d) indicated that the valence band edges of both clusters are dominated by Cu-d and S-p orbitals. On the other hand, the conduction band edge experiences a minor contribution from the C-p orbitals of DMF in the Cu14–DMF cluster. Such a contribution leads to the stabilization of the conduction band in the Cu14–DMF cluster compared to the Cu14 cluster. This results in a reduced overall emissive band gap for the Cu14–DMF cluster.
DPPE-assisted 1D framework assembly of the Cu14–DMF cluster
Interestingly, we have observed a drastic luminescence shift from red (for Cu14–DMF) to greenish-yellow by adding DPPE to the Cu14–DMF cluster. The photographic images of the resulting fibers under UV light are shown in Fig. 5a. The details of the synthesis of the fibers are given in the Experimental section. These microfibers emit bright green light (maximum at 561 nm) in a solution of DCM and DMF (shown in Fig. 5b). The luminescence decay profile (Fig. S22‡) shows an average lifetime of 26.2 μs for the green emitting Cu14 fibers, which suggests phosphorescence emission, originating from the triplet excited state. The quenching of the emission intensity upon oxygen exposure and subsequent emission enhancement by nitrogen exposure further corroborated the presence of a triplet excited state for this framework solid (shown in Fig. S23‡). Similar type PL studies by oxygen exposition were performed to confirm the existence of triplet excited states for gold and silver clusters.69,70 Upon evaporation of the solvents (both DCM and DMF), these green emitting microfibers turned into bright yellow emitters (emission maximum of 580 nm), with an average lifetime of 55.6 μs (Fig. 5c and S22‡). So, the emissive excited state of these Cu14 fibers depends on surface-adsorbed solvent molecules and this luminescence regenerates upon exposure to DCM vapors. This interconversion is reversible for several cycles of DCM exposure. Both the green and yellow emitting fibers exhibit a higher RQY (∼40%) compared to the Cu14 and Cu14–DMF clusters. The enhanced phosphorescence emission of Cu14 fibers could result from enhanced charge transfer between the linker and the cluster. The optical microscopy images (shown in Fig. 5d) of the dried fibers showed various needle-shaped fibers with a length of 65 ± 20 μm. FESEM imaging provides additional insights into the surface morphology of these microfibers with a width of 150 ± 50 nm (Fig. 5e). The powder X-ray diffraction study (shown in Fig. 5f) showed the appearance of sharp diffraction peaks, which reveal the microcrystalline nature of these fibers. A similar type of microcrystalline nature was reported for other cluster-assembled framework solids.47,50 | ||
| Fig. 5 (a) Photographs of the reaction bottle under a 365 nm UV lamp showing DPPE-assisted formation of Cu14 microfibers. (b) Comparative photoluminescence spectra before and after the formation of microfibers. (c) PL spectra of microfibers upon their interactions with DCM. (d) Optical and (e) FESEM micrographs of the as-prepared microfibers. (f) The powder X-ray diffraction pattern demonstrating the crystallinity of these fibers. (g) FESEM micrograph and (h–k) respective elemental mapping of a single fiber. (l and m) DFT optimized one-dimensional assembly of Cu14–DMF clusters with DPPE linkers. P⋯Cu coordination distances are marked here. Hydrogens are removed for clarity. | ||
The EDS elemental mapping (shown in Fig. 5h–k) shows the presence of Cu, S, B and P in the microcrystalline solids. The IR spectrum of the Cu14 fibers showed (Fig. S24‡) the presence of characteristic vibrational peaks for carborane ligands and DPPE linkers. In addition to the cage breathing modes at 692 and 729 cm−1 and the B–B–B and B–B–C bending modes at 1178, 1099, and 980 cm−1, we have detected B–H and C–H vibrational peaks at 2588 and 3056 cm−1, respectively, which confirm the presence of carboranes in the Cu14 fibers. The presence of DPPE linkers in the CAFS is indicated by the appearance of a moderate vibrational peak at 484 cm−1 (out-of-plane ring deformation of the Cu–DPPE framework) and an intense peak at 513 cm−1 (in-plane ring deformation of the Cu–DPPE framework).71 These vibrational features are also observed in the IR spectrum of free DPPE (see Fig. S25‡). Along with these peaks, the deformation of the P–CH2 mode at 1402 cm−1 and the stretching modes of P–(C6H5) at 1102 cm−1 in the Cu14–DMF fibers confirm the binding of DPPE.71 We also noted slight variations at 1434 and 1485 cm−1 in the vibrational features associated with the C–H deformation and stretching modes of DPPE, attributable to its binding in the Cu14 fibers. XPS studies further verified the presence of DPPE linkers in these microfibers, without disturbing the electronic environments of Cu, S and B (shown in Fig. S26‡). TGA measurements show enhanced thermal stability (up to ∼370 °C) for the Cu14 fibers in comparison to the Cu14–DMF cluster (∼120 °C) (shown in Fig. S27‡). A similar type of enhanced stability was observed for CAFSs of structurally related Ag clusters.72 To verify the stability of the cluster, we have dissolved the microfibers in DMF by heating them at 60 °C for 3 h. Green emitting fibers formed a red emitting solution after heat treatment in DMF (shown in Fig. S28‡). The extracted solution shows a similar bright red emission (maximum at 650 nm) with a characteristic emission of the Cu14–DMF cluster.
Mass spectrometric studies further verified the presence of Cu14 clusters in the fibers. The ESI-MS spectrum in the positive ion mode shows three major peaks at m/z 891.32, 859.65 and 398.51 in the lower mass region (shown in Fig. S29a‡). These peaks are assigned to [Cu4S(S2C2B10H10)(DPPE)]+, [Cu4(S2C2B10H10)(DPPE)]+ and [DPPE]+, respectively. Along with these peaks, there are some minor peaks at m/z 3043.74, 2589.15 and 2127.83, corresponding to [Cu14(S2C2B10H10)6(DMF)6O(DPPE)Cu]+, [Cu14(S2C2B10H10)6(DPPE)Cu]+ and [Cu14(S2C2B10H10)6]+, respectively (Fig. S29b‡). The ESI-MS spectrum in negative ion mode shows different monoanionic peaks at m/z 1313.87, 1052.07, 933.56, 791.11 and 653.62, corresponding to [Cu3S(S2C2B10H10)3(DPPE)(DMF)]−, [Cu2S4(DPPE)2]−, [Cu2S4(S2C2B10H10)(DPPE)(DMF)]−, [Cu3S4(DPPE)(DMF)]− and [Cu2S4(DPPE)]−, respectively (Fig. S30‡). The appearance of these fragmented peaks suggested DPPE-assisted polymerization of the cluster.
Theoretical calculations were performed to understand the favorable binding of DPPE linkers for this framework solid. We investigate two possible configurations, each entailing the substitution of either one DMF molecule or one bare oxygen atom with a DPPE molecule. Moreover, we examine four distinct arrangements involving the replacement of substituents (DMF and oxygen) with DPPE, namely: (a) two DMF molecules positioned opposite each other, (b) two DMF molecules situated nearby, (c) one DMF molecule and one bare oxygen atom and (d) two bare oxygen atoms positioned opposite each other. The structural representation of these configurations is presented in Fig. S31.‡ The comparative relative reaction energy changes (ΔE) (Fig. S32‡) show that bare oxygen substitution (ΔE: −1.56 eV) is more favorable than DMF substitution (ΔE: −0.22 eV), in place of the mono-DPPE linker. In a similar fashion, the substitution of two opposite bare oxygens is found to be most feasible (ΔE: −3.16 eV) among other replacement configurations considered for two DPPE linkers. So, the assembly of the Cu14–DMF cluster with DPPE linkers through the bare oxygen sites resulted in a one dimensional framework solid. Two copper atoms bonded with the bare oxygen are connected to the bidentate DPPE ligand through Cu–P linkages with an average distance of 3.2 Å, resulting in this 1D CAFS. The structural representation of the 1D framework solid is shown in Fig. 5l and m.
Conclusions
In summary, we have successfully synthesized a yellow-emitting Cu14 cluster protected by ortho-carborane-9,12-dithiol ligands through the LEIST reaction of a Cu18 cluster. Mass spectrometric studies confirmed the presence of six carborane-thiol ligands in the shell of the synthesized Cu14 cluster. X-ray-suitable single crystals were grown using DMF-assisted crystallization. The structure has a Cu6@Cu8 core–shell geometry with six carborane-thiol ligands positioned over the cubical faces of the Cu8 outer shell of the cluster. The crystallization was facilitated by intermolecular interactions involving six DMF molecules connected to the outer Cu8 shell. The surface modification played a crucial role in tuning the luminescence properties of the cluster, transforming its emission from yellow to red. Furthermore, we extended our study to the synthesis of one-dimensional microcrystalline fibers, utilizing the cluster as a node and DPPE as a convenient linker. These assembled superstructures exhibited luminescence tuning from red to greenish-yellow. Notably, the emission characteristics of these fibers were further modulated upon DCM adsorption. This investigation highlights the fascinating impact of surface tailoring on the luminescence features of copper clusters through the introduction of secondary ligands. In conclusion, our work showcases the site-specific modification of primary and secondary ligands on the outer shell of the cluster, leading to the development of a novel class of atomically precise materials with tunable luminescence. We envision that multidentate phosphine ligands can increase the possibility of the formation of higher order cluster assembled framework solids.Experimental section
Chemicals
Copper iodide (CuI) and 1,2-bis(diphenylphosphine)ethane (DPPE) were purchased from Sigma-Aldrich and Spectrochem Chemicals, respectively. Ortho-carborane-9,12-dithiol (o-CBDT) was synthesized by following the previous literature,73 starting from ortho-carborane, which was purchased from Katchem s.r.o. (Czech Republic). HPLC-grade solvents such as, dichloromethane (DCM), chloroform (CHCl3), n-hexane, N,N-dimethyl formamide (DMF), acetone, acetonitrile and methanol (99.5%) were purchased from Rankem Chemicals and Finar, India. Milli-Q water was used for cluster synthesis and purification. All the chemicals were commercially available and used as such without additional purification.Synthesis of the [Cu18(DPPE)6H16] nanocluster
The Cu18 cluster was synthesized using a modified synthetic protocol from the literature.74 In brief, 95 mg (0.49 mM) of CuI was mixed with 120 mg (0.03 mM) of DPPE under argon and then 15 ml of acetonitrile (as received) was added to it. After 30 min of additional stirring, the as-formed white complexes were reduced by directly adding 180–185 mg of dry NaBH4 powder. After another hour of stirring at room temperature, an orange-colored precipitate was formed, which indicated the formation of the crude product. The final product was collected as an orange solid by centrifugation and further washed three times using 5 ml of acetonitrile and methanol each in succession, to remove excess starting reagents. Finally, the solid product, Cu18, was dissolved in DCM and used for further reactions. The UV-vis and ESI-MS spectra (shown in Fig. S33‡) confirmed the formation of the cluster. The yield was calculated to be 70–75% relative to the copper precursor.Synthesis of Cu14 and Cu14–DMF nanoclusters
The Cu14 nanocluster was synthesized through a ligand exchange reaction starting from the polyhydrido Cu18 cluster. In brief, the Cu18 cluster (∼35 mg) was dissolved in 7 ml of DCM at room temperature and reacted with 25 mg of o-CBDT ligand. After 3 hours of stirring, the resulting yellowish solution with characteristic yellow emission indicated the formation of the Cu14 cluster. The solvent was evaporated to dryness under reduced pressure and the solid crude product was purified by washing and decanting with methanol (3 × 4 ml). Finally, the product dissolved in DCM was used for further studies. The yield of the Cu14 cluster is 45–50% relative to that of Cu18. After overnight size stabilization at 4 °C, the Cu14 cluster was converted to the Cu14–DMF cluster by adding DMF (3 ml) to the DCM (3 ml) solution of the cluster. A highly concentrated solution (∼30 mg ml−1) in a DCM:DMF mixture (1:1 v/v) was used for crystallization. After 15 days, yellowish cuboid crystals were formed.
Synthesis of Cu14–DMF fibers
The Cu14–DMF fibers originate from the Cu14–DMF cluster. Initially, 30 mg of Cu14–DMF cluster was dissolved in a solution of DMF and DCM (1:1, v/v). After stirring for 30 minutes, 8.5 mg of DPPE was added to the solution. Subsequently, with an additional 2–3 hours of stirring, Cu14 fibers began to form within the reaction vessel. Following a further 0.5–1 hour of stirring, yellowish fibers were collected via centrifugation (1000 rpm for 3 minutes) and washed with DCM (2–3 times). The microcrystalline fibers were dried at 30 °C by casting them onto filter paper. The addition of excess DPPE to the as-synthesized Cu14 cluster (in DCM solution) did not result in the formation of fibers. The yield of the fibers is approximately 65%.
Data availability
All data needed to evaluate the conclusions in the paper are present in the paper and/or the ESI.‡Author contributions
A. J. conceived and planned the project, with input from T. P. He conducted the synthesis of the cluster and conducted the majority of the experimental studies. S. D. assisted A. J. during the synthesis and scale-up of the clusters. A. D. conducted theoretical calculations under the guidance of B. P. A. R. K. conducted XPS and SEM studies. S. A. conducted mass spectrometric studies. J. M. and T. B. synthesized and characterized the carborane-thiol utilized in the research. The initial draft of the manuscript was written by A. J., with all authors contributing to its finalization. T. P., T. B. and B. P. supervised the project and finalized the manuscript.Conflicts of interest
There are no conflicts to declare.Acknowledgements
The authors acknowledge the support of the Department of Science and Technology (DST), Govt. of India and the Ministry of Education, Youth and Sports (MEYS) of Czech Republic for their financial support to the bilateral research projects, DST/INT/Czech/P-16/2020 and LTAIN19152, respectively. The authors would like to thank Dr Sudhadevi Antharjanam and Sophisticated Analytical Instrumental Facility, Indian Institute of Technology Madras (SAIF-IITM) for single crystal XRD, lifetime and thermogravimetric measurements. A. J. acknowledges financial support from IIT Madras. T. P. acknowledges funding from the Centre of Excellence on Molecular Materials and Functions under the Institute of Eminence Scheme of IIT Madras.References
- R. Jin, C. Zeng, M. Zhou and Y. Chen, Chem. Rev., 2016, 116, 10346–10413 CrossRef CAS PubMed.
- I. Chakraborty and T. Pradeep, Chem. Rev., 2017, 117, 8208–8271 CrossRef CAS PubMed.
- X. Liu and D. Astruc, Coord. Chem. Rev., 2018, 359, 112–126 CrossRef CAS.
- Y. An, Y. Ren, M. Bick, A. Dudek, E. Hong-Wang Waworuntu, J. Tang, J. Chen and B. Chang, Biosens. Bioelectron., 2020, 154, 112078 CrossRef CAS PubMed.
- H. Ao, H. Feng, S. Pan, Z. Bao, Z. Li, J. Chen and Z. Qian, ACS Appl. Nano Mater., 2018, 1, 5673–5681 CrossRef CAS.
- J. Qiu and X. Liu, Light: Sci. Appl., 2023, 12, 12–14 CrossRef PubMed.
- K. Kirakci, K. Fejfarová, J. Martinčík, M. Nikl and K. Lang, Inorg. Chem., 2017, 56, 4609–4614 CrossRef PubMed.
- S. Shahsavari, S. Hadian-Ghazvini, F. H. Saboor, I. M. Oskouie, M. Hasany, A. Simchi and A. L. Rogach, Mater. Chem. Front., 2019, 3, 2326–2356 RSC.
- A. Jana, B. K. Spoorthi, A. S. Nair, A. Nagar, B. Pathak, T. Base and T. Pradeep, Nanoscale, 2023, 15, 8141–8147 RSC.
- L. Ai, W. Jiang, Z. Liu, J. Liu, Y. Gao, H. Zou, Z. Wu, Z. Wang, Y. Liu, H. Zhang and B. Yang, Nanoscale, 2017, 9, 12618–12627 RSC.
- G. Smolentsev, C. J. Milne, A. Guda, K. Haldrup, J. Szlachetko, N. Azzaroli, C. Cirelli, G. Knopp, R. Bohinc, S. Menzi, G. Pamfilidis, D. Gashi, M. Beck, A. Mozzanica, D. James, C. Bacellar, G. F. Mancini, A. Tereshchenko, V. Shapovalov, W. M. Kwiatek, J. Czapla-Masztafiak, A. Cannizzo, M. Gazzetto, M. Sander, M. Levantino, V. Kabanova, E. Rychagova, S. Ketkov, M. Olaru, J. Beckmann and M. Vogt, Nat. Commun., 2020, 11, 1–9 CrossRef PubMed.
- A. Sagadevan, A. Ghosh, P. Maity, O. F. Mohammed, O. M. Bakr and M. Rueping, J. Am. Chem. Soc., 2022, 144, 12052–12061 CrossRef CAS PubMed.
- B. Huitorel, H. El Moll, R. Utrera-Melero, M. Cordier, A. Fargues, A. Garcia, F. Massuyeau, C. Martineau-Corcos, F. Fayon, A. Rakhmatullin, S. Kahlal, J. Y. Saillard, T. Gacoin and S. Perruchas, Inorg. Chem., 2018, 57, 4328–4339 CrossRef CAS PubMed.
- K. K. Chakrahari, J.-H. Liao, S. Kahlal, Y.-C. Liu, M.-H. Chiang, J.-Y. Saillard and C. W. Liu, Angew. Chem., Int. Ed., 2016, 55, 14704–14708 CrossRef CAS PubMed.
- P. C. Ford, E. Cariati and J. Bourassa, Chem. Rev., 1999, 99, 3625–3647 CrossRef CAS PubMed.
- B. Huitorel, H. El Moll, M. Cordier, A. Fargues, A. Garcia, F. Massuyeau, C. Martineau-Corcos, T. Gacoin and S. Perruchas, Inorg. Chem., 2017, 56, 12379–12388 CrossRef CAS PubMed.
- H. Wu, R. Anumula, G. N. Andrew and Z. Luo, Nanoscale, 2023, 15, 4137–4142 RSC.
- P. P. Sun, B. L. Han, H. G. Li, C. K. Zhang, X. Xin, J. M. Dou, Z. Y. Gao and D. Sun, Angew. Chem., Int. Ed., 2022, 61, 1–7 Search PubMed.
- X. Liu and K. L. Huang, Inorg. Chem., 2009, 48, 8653–8655 CrossRef CAS PubMed.
- X. Lin, J. Tang, C. Zhu, L. Wang, Y. Yang, R. Wu, H. Fan, C. Liu and J. Huang, Chem. Sci., 2023, 14, 994–1002 RSC.
- J. H. Huang, L. Y. Liu, Z. Y. Wang, S. Q. Zang and T. C. W. Mak, ACS Nano, 2022, 16, 18789–18794 CrossRef CAS PubMed.
- S. Nematulloev, R. W. Huang, J. Yin, A. Shkurenko, C. Dong, A. Ghosh, B. Alamer, R. Naphade, M. N. Hedhili, P. Maity, M. Eddaoudi, O. F. Mohammed and O. M. Bakr, Small, 2021, 17, 1–6 CrossRef PubMed.
- A. W. Cook, Z. R. Jones, G. Wu, S. L. Scott and T. W. Hayton, J. Am. Chem. Soc., 2018, 140, 394–400 CrossRef CAS PubMed.
- T.-A. D. Nguyen, Z. R. Jones, B. R. Goldsmith, W. R. Buratto, G. Wu, S. L. Scott and T. W. Hayton, J. Am. Chem. Soc., 2015, 137, 13319–13324 CrossRef CAS PubMed.
- C. Dong, R. W. Huang, C. Chen, J. Chen, S. Nematulloev, X. Guo, A. Ghosh, B. Alamer, M. N. Hedhili, T. T. Isimjan, Y. Han, O. F. Mohammed and O. M. Bakr, J. Am. Chem. Soc., 2021, 143, 11026–11035 CrossRef CAS PubMed.
- C. Xu, Y. Jin, H. Fang, H. Zheng, J. C. Carozza, Y. Pan, P.-J. Wei, Z. Zhang, Z. Wei, Z. Zhou and H. Han, J. Am. Chem. Soc., 2023, 145, 25673–25685 CrossRef CAS PubMed.
- P. Yuan, R. Chen, X. Zhang, F. Chen, J. Yan, C. Sun, D. Ou, J. Peng, S. Lin, Z. Tang, B. K. Teo, L. S. Zheng and N. Zheng, Angew. Chem., Int. Ed., 2019, 58, 835–839 CrossRef CAS PubMed.
- A. Ghosh, R. W. Huang, B. Alamer, E. Abou-Hamad, M. N. Hedhili, O. F. Mohammed and O. M. Bakr, ACS Mater. Lett., 2019, 1, 297–302 CrossRef CAS.
- R. W. Huang, J. Yin, C. Dong, A. Ghosh, M. J. Alhilaly, X. Dong, M. N. Hedhili, E. Abou-Hamad, B. Alamer, S. Nematulloev, Y. Han, O. F. Mohammed and O. M. Bakr, J. Am. Chem. Soc., 2020, 142, 8696–8705 CrossRef PubMed.
- Z. Luo, A. W. Castleman and S. N. Khanna, Chem. Rev., 2016, 116, 14456–14492 CrossRef CAS PubMed.
- S. F. Yuan, H. W. Luyang, Z. Lei, X. K. Wan, J. J. Li and Q. M. Wang, Chem. Commun., 2021, 57, 4315–4318 RSC.
- F. Ke, Y. Song, H. Li, C. Zhou, Y. Du and M. Zhu, Dalton Trans., 2019, 48, 13921–13924 RSC.
- Z. Wu, J. Liu, Y. Gao, H. Liu, T. Li, H. Zou, Z. Wang, K. Zhang, Y. Wang, H. Zhang and B. Yang, J. Am. Chem. Soc., 2015, 137, 12906–12913 CrossRef CAS PubMed.
- X. H. Ma, J. Li, P. Luo, J. H. Hu, Z. Han, X. Y. Dong, G. Xie and S. Q. Zang, Nat. Commun., 2023, 14, 1–11 Search PubMed.
- C. Y. Liu, S. F. Yuan, S. Wang, Z. J. Guan, D. en Jiang and Q. M. Wang, Nat. Commun., 2022, 13, 1–8 Search PubMed.
- L. M. Zhang and T. C. W. Mak, J. Am. Chem. Soc., 2016, 138, 2909–2912 CrossRef CAS PubMed.
- C. Xu, X. Y. Yi, T. K. Duan, Q. Chen and Q. F. Zhang, Polyhedron, 2011, 30, 2637–2643 CrossRef CAS.
- O. Fuhr, S. Dehnen and D. Fenske, Chem. Soc. Rev., 2013, 42, 1871–1906 RSC.
- W. Ishii, Y. Okayasu, Y. Kobayashi, R. Tanaka, S. Katao, Y. Nishikawa, T. Kawai and T. Nakashima, J. Am. Chem. Soc., 2023, 145, 11236–11244 CrossRef CAS PubMed.
- Y. Zeng, S. Havenridge, M. Gharib, A. Baksi, K. L. D. M. Weerawardene, A. R. Ziefuß, C. Strelow, C. Rehbock, A. Mews, S. Barcikowski, M. M. Kappes, W. J. Parak, C. M. Aikens and I. Chakraborty, J. Am. Chem. Soc., 2021, 143, 9405–9414 CrossRef CAS PubMed.
- E. Khatun, A. Ghosh, P. Chakraborty, P. Singh, M. Bodiuzzaman, G. Paramasivam, G. Nataranjan, J. Ghosh, S. K. Pal and T. Pradeep, Nanoscale, 2018, 10, 20033–20042 RSC.
- X. Kang, X. Wei, P. Xiang, X. Tian, Z. Zuo, F. Song, S. Wang and M. Zhu, Chem. Sci., 2020, 11, 4808–4816 RSC.
- A. Jana, M. Jash, W. A. Dar, J. Roy, P. Chakraborty, G. Paramasivam, S. Lebedkin, K. Kirakci, S. Manna, S. Antharjanam, J. Machacek, M. Kucerakova, S. Ghosh, K. Lang, M. M. Kappes, T. Base and T. Pradeep, Chem. Sci., 2023, 14, 1613–1626 RSC.
- Y. L. Li, J. Wang, P. Luo, X. H. Ma, X. Y. Dong, Z. Y. Wang, C. X. Du, S. Q. Zang and T. C. W. Mak, Adv. Sci., 2019, 6, 6–11 Search PubMed.
- Y. Li, Z. Wang, X. Ma, P. Luo, C. Du and S. Zang, Nanoscale, 2019, 11, 5151–5157 RSC.
- A. Ebina, S. Hossain, H. Horihata, S. Ozaki, S. Kato, T. Kawawaki and Y. Negishi, Nanomaterials, 2020, 10, 1–48 CrossRef PubMed.
- R. W. Huang, Y. S. Wei, X. Y. Dong, X. H. Wu, C. X. Du, S. Q. Zang and T. C. W. Mak, Nat. Chem., 2017, 9, 689–697 CrossRef CAS PubMed.
- M. J. Alhilaly, R. W. Huang, R. Naphade, B. Alamer, M. N. Hedhili, A. H. Emwas, P. Maity, J. Yin, A. Shkurenko, O. F. Mohammed, M. Eddaoudi and O. M. Bakr, J. Am. Chem. Soc., 2019, 141, 9585–9592 CrossRef CAS PubMed.
- X. Y. Dong, H. L. Huang, J. Y. Wang, H. Y. Li and S. Q. Zang, Chem. Mater., 2018, 30, 2160–2167 CrossRef CAS.
- W. A. Dar, A. Jana, K. S. Sugi, G. Paramasivam, M. Bodiuzzaman, E. Khatun, A. Som, A. Mahendranath, A. Chakraborty and T. Pradeep, Chem. Mater., 2022, 34, 4703–4711 CrossRef CAS.
- X. Y. Dong, Y. Si, J. Sen Yang, C. Zhang, Z. Han, P. Luo, Z. Y. Wang, S. Q. Zang and T. C. W. Mak, Nat. Commun., 2020, 11, 1–9 CrossRef PubMed.
- A. K. Das, S. Biswas, A. Kayal, A. C. Reber, S. Bhandary, D. Chopra, J. Mitra, S. N. Khanna and S. Mandal, Nano Lett., 2023, 23, 8923–8931 CrossRef CAS PubMed.
- R. Nakatani, S. Biswas, T. Irie, J. Sakai, D. Hirayama, T. Kawawaki, Y. Niihori, S. Das and Y. Negishi, Nanoscale, 2023, 15, 16299–16306 RSC.
- M. Zhao, S. Huang, Q. Fu, W. Li, R. Guo, Q. Yao, F. Wang, P. Cui, C.-H. Tung and D. Sun, Angew. Chem., Int. Ed., 2020, 59, 20031–20036 CrossRef CAS PubMed.
- X. H. Wu, P. Luo, Z. Wei, Y. Y. Li, R. W. Huang, X. Y. Dong, K. Li, S. Q. Zang and B. Z. Tang, Adv. Sci., 2018, 6, 1–7 Search PubMed.
- A. Jana, M. Jash, A. K. Poonia, G. Paramasivam, M. R. Islam, P. Chakraborty, S. Antharjanam, J. Machacek, S. Ghosh, K. N. V. D. Adarsh, T. Base and T. Pradeep, ACS Nano, 2021, 15, 15781–15793 CrossRef CAS PubMed.
- A. Jana, P. M. Unnikrishnan, A. K. Poonia, J. Roy, M. Jash, G. Paramasivam, J. Machacek, K. N. V. D. Adarsh, T. Base and T. Pradeep, Inorg. Chem., 2022, 61, 8593–8603 CrossRef CAS PubMed.
- G. Deng, B. K. Teo and N. Zheng, J. Am. Chem. Soc., 2021, 143, 10214–10220 CrossRef CAS PubMed.
- X. Q. Liang, Y. Z. Li, Z. Wang, S. S. Zhang, Y. C. Liu, Z. Z. Cao, L. Feng, Z. Y. Gao, Q. W. Xue, C. H. Tung and D. Sun, Nat. Commun., 2021, 12, 1–10 CrossRef PubMed.
- E. Drougkas, M. Bache, X. Liang, N. von Solms and G. M. Kontogeorgis, J. Mol. Liq., 2023, 391, 123279 CrossRef CAS.
- A. K. Das, S. Biswas, V. S. Wani, A. S. Nair, B. Pathak and S. Mandal, Chem. Sci., 2022, 13, 7616–7625 RSC.
- W. Wei, Y. Lu, W. Chen and S. Chen, J. Am. Chem. Soc., 2011, 133, 2060–2063 CrossRef CAS PubMed.
- M. Shima, K. Tsutsumi, A. Tanaka, H. Onodera and M. Tanemura, Surf. Interface Anal., 2018, 50, 1187–1190 CrossRef CAS.
- W. F. Banholzer and M. C. Burrell, Surf. Sci., 1986, 176, 125–133 CrossRef CAS.
- Y. Shi, J. Ma, A. Feng, Z. Wang and A. R. Rogach, Aggregate, 2021, 2, 1–15 CrossRef.
- S. Kolay, S. Maity, D. Bain, S. Chakraborty and A. Patra, Nanoscale Adv., 2021, 3, 5570–5575 RSC.
- Q. Benito, X. F. Le Goff, S. Maron, A. Fargues, A. Garcia, C. Martineau, F. Taulelle, S. Kahlal, T. Gacoin, J. P. Boilot and S. Perruchas, J. Am. Chem. Soc., 2014, 136, 11311–11320 CrossRef CAS PubMed.
- M. J. Frisch, G. W. Trucks, H. B. Schlegel, G. E. Scuseria, M. A. Robb, J. R. Cheeseman, G. Scalmani, V. Barone, B. Mennucci, G. A. Petersson, et al., Gaussian 09, Revision B.01, Gaussian Inc., Wallingford, CT, 2009 Search PubMed.
- M. Agrachev, W. Fei, S. Antonello, S. Bonacchi, T. Dainese, A. Zoleo, M. Ruzzi and F. Maran, Chem. Sci., 2020, 11, 3427–3440 RSC.
- C. Zhu, J. Xin, J. Li, H. Li, X. Kang, Y. Pei and M. Zhu, Angew. Chem., Int. Ed., 2022, 61, 1–6 Search PubMed.
- A. M. F. Benial, V. Ramakrishnan and R. Murugesan, Spectrochim. Acta, Part A, 2002, 58, 1703–1712 CrossRef PubMed.
- Z. Wang, M. Wang, Y. Li, P. Luo, T. Jia, R. Huang, S. Zang and T. C. W. Mak, J. Am. Chem. Soc., 2018, 140, 1069–1076 CrossRef CAS PubMed.
- (a) J. Plešek and S. Hermanek, Collect. Czech. Chem. Commun., 1981, 46, 687–692 CrossRef; (b) J. Plešek, Z. Janoušek and S. Hermanek, Collect. Czech. Chem. Commun., 1978, 43, 1332–1338 CrossRef.
- J. Li, H. Z. Ma, G. E. Reid, A. J. Edwards, Y. Hong, J. M. White, R. J. Mulder and R. A. J. O'Hair, Chem.–Eur. J., 2018, 24, 2070–2074 CrossRef CAS PubMed.
Footnotes |
| † This article is dedicated to Professor Ashok Kumar Mishra, a valued friend and colleague, to celebrate his 65th birthday. |
| ‡ Electronic supplementary information (ESI) available: Instrumentation and additional experimental and theoretical results. CCDC 2337402. For ESI and crystallographic data in CIF or other electronic format see DOI: https://doi.org/10.1039/d4sc01566e |
| This journal is © The Royal Society of Chemistry 2024 |