
 Open Access Article
 This Open Access Article is licensed under a Creative Commons Attribution-Non Commercial 3.0 Unported Licence
The effect of host size on binding in host–guest complexes of cyclodextrins and polyoxometalates†
Pei
Su
 *ab,
Xiao
Zhu
ac,
Solita M.
Wilson
a,
Yuanning
Feng
bd,
Hugo Y.
Samayoa-Oviedo
a,
Christian
Sonnendecker
e,
Andrew J.
Smith
a,
Wolfgang
Zimmermann
e and
Julia
Laskin
*a
*ab,
Xiao
Zhu
ac,
Solita M.
Wilson
a,
Yuanning
Feng
bd,
Hugo Y.
Samayoa-Oviedo
a,
Christian
Sonnendecker
e,
Andrew J.
Smith
a,
Wolfgang
Zimmermann
e and
Julia
Laskin
*a
aDepartment of Chemistry, Purdue University, 560 Oval Drive, West Lafayette, Indiana 47907, USA. E-mail: jlaskin@purdue.edu; wils1006@purdue.edu; hsamayoa@purdue.edu; ajsmith3005@gmail.com
bDepartment of Chemistry, Northwestern University, 2145 Sheridan Road, Evanston, Illinois 60208, USA. E-mail: pei.su@northwestern.edu
cRosen Center for Advanced Computing, Purdue University, West Lafayette, Indiana 47907, USA. E-mail: zhu472@purdue.edu
dDepartment of Chemistry and Biochemistry, The University of Oklahoma, 101 Stephenson Parkway, Norman, Oklahoma 73019, USA. E-mail: yf@ou.edu
eInstitute of Analytical Chemistry, Universität Leipzig, Johannisallee 29, Leipzig 04103, Germany. E-mail: christian.sonnendecker@uni-leipzig.de; wolfgang.zimmermann@uni-leipzig.de
First published on 19th June 2024
Abstract
Harnessing flexible host cavities opens opportunities for the design of novel supramolecular architectures that accommodate nanosized guests. This research examines unprecedented gas-phase structures of Keggin-type polyoxometalate PW12O403− (WPOM) and cyclodextrins (X-CD, X = α, β, γ, δ, ε, ζ) including previously unexplored large, flexible CDs. Using ion mobility spectrometry coupled to mass spectrometry (IM-MS) in conjunction with molecular dynamics (MD) simulations, we provide first insights into the binding modes between WPOM and larger CD hosts as isolated structures. Notably, γ-CD forms two distinct structures with WPOM through binding to its primary and secondary faces. We also demonstrate that ε-CD forms a deep inclusion complex, which encapsulates WPOM within its annular inner cavity. In contrast, ζ-CD adopts a saddle-like conformation in its complex with WPOM, which resembles its free form in solution. More intriguingly, the gas-phase CD–WPOM structures are highly correlated with their counterparts in solution as characterized by nuclear magnetic resonance (NMR) spectroscopy. The strong correlation between the gas- and solution phase structures of CD–WPOM complexes highlight the power of gas-phase IM-MS for the structural characterization of supramolecular complexes with nanosized guests, which may be difficult to examine using conventional approaches.
Introduction
Supramolecular chemistry relies on noncovalent interactions to drive self-assembly of molecular architectures. This approach has been widely used for designing novel materials for applications in energy harvesting, catalysis, and sensing.1 Host–guest chemistry is a major branch of supramolecular chemistry that focuses on understanding how a macrocyclic host can encapsulate one or more guest molecules or ions in its cavity.2 The strength of noncovalent interactions that stabilize the complex is determined by both entropic factors and the size match between the host cavity and the guest. Both natural and synthetic macrocycles (e.g., cucurbit[n]urils,3 calix[n]arenes,4 and pillar[n]arene5) have been designed to accommodate guest molecules with diverse sizes and physical and chemical properties.6 Cyclodextrins (CDs), a family of macrocyclic hosts consisting of oligosaccharides,7 are popular hosts due to their biocompatibility, well-characterized structures, tunable cavity sizes, and reversible complex formation.8 CD-based host–guest chemistry is widely used in analytical chiral separations,9 molecular recognition,10 and drug delivery.11The most common forms of CDs are α-CD, β-CD, and γ-CD comprising six, seven, and eight α-D-glucopyranosyl units (referred to as “sugar units” hereafter), respectively.12 The structures and host–guest binding affinities of these CDs with a variety of guests13 including metal cations,14 antibiotic compounds,15 cholesterols,16 lipids17 and peptides have been extensively investigated.18 It has been demonstrated that α-, β-, and γ-CDs adopt well-defined annular geometries, which are well-suited for forming host–guest complexes (Fig. 1).12 In recent years, there has been progress in synthesizing large-ring CDs (LRCDs) with more than eight sugar units.19 LRCDs possess larger cavities capable of encapsulating nanosized guest ions and molecules. The potential of LRCDs as host molecules, however, has not been systematically explored. Furthermore, their conformational flexibility makes it challenging to predict their cavity size and host–guest binding properties.20 For example, an investigation employing molecular dynamics (MD) simulations explored the conformations of LRCDs containing up to 100 sugar units.21 That study revealed that, in aqueous solutions, LRCDs preferentially adopt twisted conformations, which prevents the incorporation of large guest molecules into their cavities. Moreover, these twisted conformations create multiple interaction pockets resulting in a complex array of binding modes with guest molecules.22
 | ||
Fig. 1 Left: chemical structures of γ-CD and WPOM. The structure in the middle demonstrates a typical conformation of γ-CD in its annular shape, which presents its primary and secondary faces occupied by primary and secondary hydroxyl groups, respectively; right: ESI-MS spectra of 1![[thin space (1/6-em)]](https://www.rsc.org/images/entities/char_2009.gif) :1 CD–WPOM complexes examined in this study. Calculated isotopic distributions of the complexes are overlayed as red dots on top of the spectra (black trace). :1 CD–WPOM complexes examined in this study. Calculated isotopic distributions of the complexes are overlayed as red dots on top of the spectra (black trace). | ||
It is well established that the hydrophobic effect determines the thermochemistry of host encapsulation of a hydrophobic guest in aqueous solution. In this process, a substantial entropy gain is achieved through binding of nonpolar surfaces of the host and guest.23 In contrast, the strong affinity of non-hydrophobic nanoscale guests to CD hosts stems from a substantial negative enthalpic change accompanied by a minor entropic penalty known as the chaotropic effect.24 Complex formation driven by the chaotropic effect is particularly pronounced for “superchaotropic ions”, such as dodecaborate anions (B12X122−, X = Cl, Br, I) that exhibit a strong binding affinity to CD hosts.25
Polyoxometalates (POMs) are a class of early transition metal oxyanions that display superchaotropic properties.23,26,27 Their structural diversity, exceptional multi-electron transfer reactivity, and tunable optical and magnetic properties make them attractive building blocks for functional materials in energy conversion and storage, molecular electronics, spintronics, and catalysis.28 Host–guest complexes of CD and POMs are commonly used as structural units in supramolecular assemblies, in which one POM is sandwiched between two CD molecules.29,30 Deep inclusion complexes are formed only between the smallest Lindqvist POM anions (i.e., M6O192−, M = Mo, W) and γ-CD.31 Meanwhile, larger POMs (diameters ≥ 10 Å) have the size that is too big to fit into the 7.5–8.3 Å diameter cavity of γ-CD to form inclusion complexes.12 Despite the potential of LRCDs to accommodate larger POMs, their host–guest chemistry remains largely unexplored.
In this study, we investigated structures of host–guest complexes formed between Keggin-type PW12O403− (WPOM) and a series of CDs (X-CD, X = α, β, γ, δ, ε, ζ) in the gas phase using ion mobility spectrometry combined with mass spectrometry (IM-MS) in conjunction with MD simulations. IM-MS is a gas-phase separation technique with sufficient resolving power to characterize the structural landscape of CD–WPOM complexes. This technique has been previously used to study the conformers of CD-metal complexes.32 Using IM-MS, we observed two distinct structures of γ-CD–WPOM complex formed by binding of the guest to both the primary and secondary face of γ-CD. These binding modes are similar to those observed for γ-CD–WPOM complexes in solution.27 The two binding modes were also observed using MD simulations. Moreover, we concluded that a deep inclusion complex is formed between WPOM and ε-CD, but not between WPOM and the larger ζ-CD. More strikingly, these gas-phase structures strongly correlate with solution-phase complexation modes between CDs and WPOM as evidenced by nuclear magnetic resonance (NMR) spectroscopic measurements. Our findings provide new insights into the highly specific host–guest chemistry between structurally-flexible macrocycles and nanometer-sized polyanions. Furthermore, our discoveries underscore the power of gas-phase IM-MS for studying different binding modes in host–guest complexes. The speed of analysis and remarkable molecular and structural specificity of gas-phase IM-MS measurements make it a promising tool for identifying important supramolecular structural units.
Result and discussion
Gas-phase studies
Host–guest complexes of Keggin phosphotungstate (PW12O403−, WPOM) and cyclodextrins (X-CD, X = α, β, γ, δ, ε, ζ) formed in aqueous solutions were analyzed using electrospray ionization mass spectrometry (ESI-MS) in negative ionization mode (Fig. 1). Mass spectra acquired across the m/z 100–3000 range are shown in Fig. S1.† In addition to abundant peaks of the triply charged WPOM anion, PW12O403− at m/z = 958, and doubly charged WPOM anions at m/z = 1438 and 1450 corresponding to proton and sodium adducts, respectively, mass spectra contain [CD–WPOM]3− ions corresponding to 1:1 CD–WPOM complexes. Fig. 1 shows the experimental and calculated isotope distributions of each [CD–WPOM]3− species. We observe only one species in each narrow m/z window of the [CD–WPOM]3− anion in all mass spectra except for that of the δ-CD–WPOM complex. For this system, the [δ-CD–WPOM]3− anion is observed alongside the doubly charged WPOM anions at m/z = 1438 and 1450. Complex formation between WPOM and α, β, and γ-CD has been reported in previous studies.30,31,33 These complexes have been employed as structural motifs to assemble molecular materials in the solid state. In this study, we have examined for the first time 1:1 complexes composed of WPOM and LRCDs: δ-, ε-, and ζ-CD. We note that CD–WPOM complexes with multiple CD molecules (N ≥ 2) and one WPOM were also detected in low abundance in ESI-MS. In this study, we focused on the characterization of 1:1 CD–WPOM complexes.
We examined gas-phase structures of CD–WPOM complexes by measuring their collision cross section (CCS) values using drift tube IM-MS (DTIM-MS). In these experiments, gas-phase complexes were accelerated through the drift tube of the instrument and separated according to their size and shape. Fig. 2a shows the CCS distributions of the CD–WPOM complexes measured using a constant acceleration field in DTIM-MS. Arrival time distributions (ATDs) were converted into CCS distributions using the single-field approach described in the Experimental section.34 CCS values of all the complexes obtained using the stepped-field DTIM-MS approach described in the Experimental section are plotted against m/z in Fig. 2b (CCS values in Table S1†).34 We observe a general trend with a gradual increase in CCS values with an increase in the size of the CDs in both Fig. 2a and b. Aside from α- and ζ-CD, most complexes in this series show a proportional increase in CCS with m/z indicating their structural similarity. In addition to ion-induced dipole interactions and dispersion forces, hydrogen bonding between surface oxygen atoms of WPOM and hydroxyl (–OH) groups of CD plays an important role in stabilizing the complexes both in the gas phase and in solution. It is reasonable to assume the most stable structures correspond to inclusion complexes, where the interactions between WPOM and CD cavity are maximized. An annular-shaped γ-CD features primary and secondary faces containing primary and secondary hydroxyl groups in the sugar units, respectively.12 Previous studies have indicated that WPOM preferentially binds to the secondary face of β-CD, which has a larger cavity size compared to the primary face. This finding is consistent with our MD simulations described in the next section (Fig. S2†).30 Consequently, it is plausible that the linear trend observed in the CCS vs. m/z plot represents more compact structures formed by WPOM binding with secondary face of CDs.
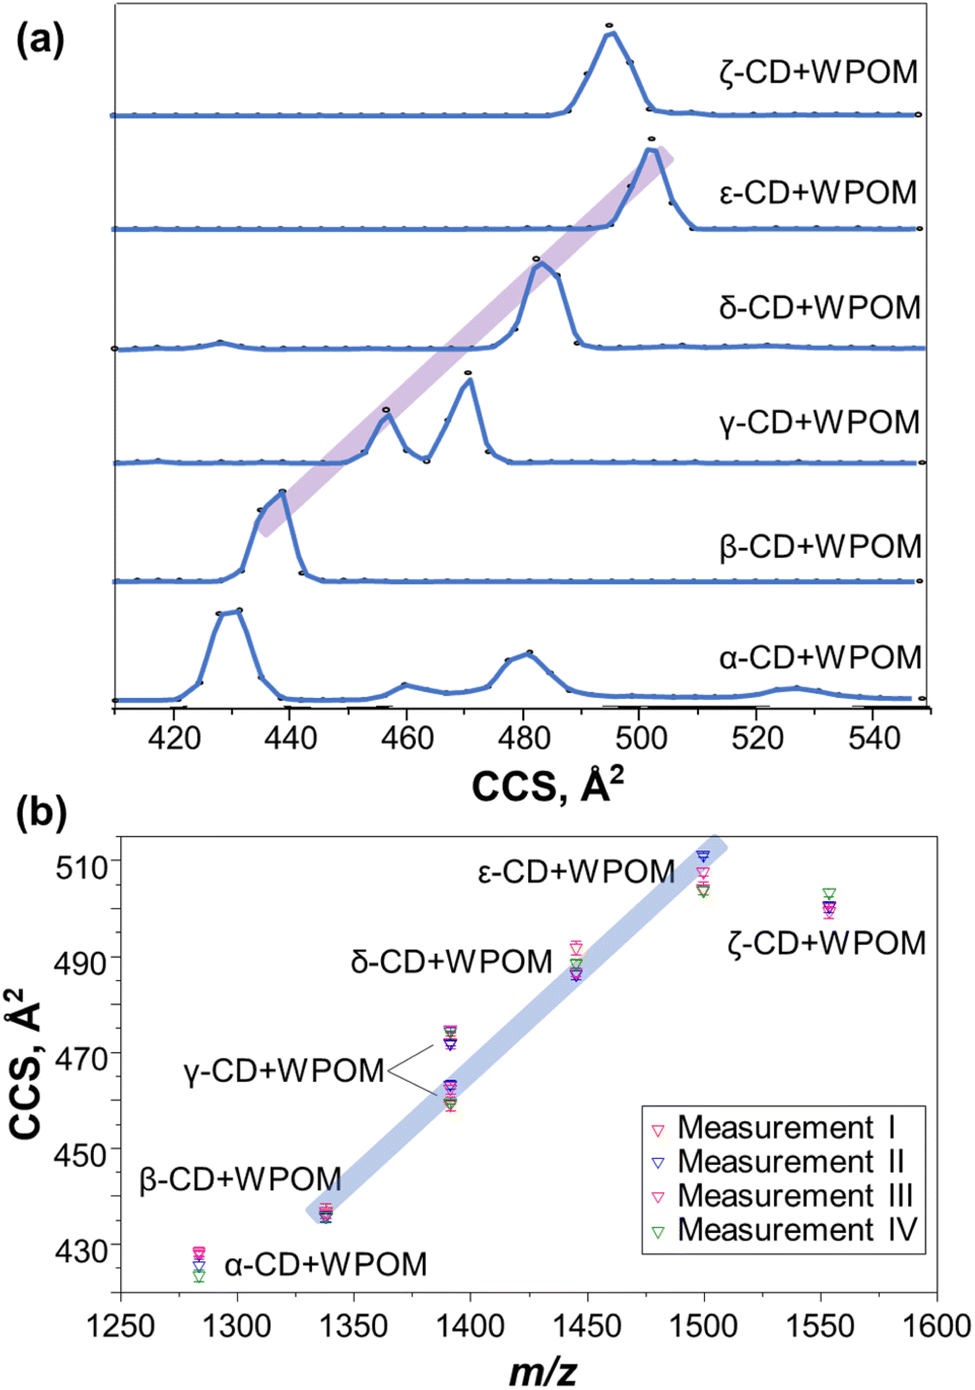 | ||
| Fig. 2 (a) CCS value distributions of mass-selected X-CD–WPOM (X = α, β, γ, δ, ε, ζ) complexes determined using single-field IM-MS measurements; (b) CCS values of mass-selected X-CD–WPOM complexes determined from four separate multi-field IM-MS experiments. The four measurements were conducted on four different days. The purple and blue traces highlight the linear region of the CCS value vs. m/z trend in the series of complexes to guide the eye. | ||
Several deviations from the trendlines can be observed in Fig. 2a and b. For example, the CCS value of the most compact structure of α-CD–WPOM (430 Å2) is above the highlighted trendline. The abnormally large CCS value of 430 Å2 may be explained by the poor size matching between the α-CD cavity (diameter: ∼6 Å) and WPOM (diameter: ∼10 Å). Interestingly, molecular dynamics simulation described later in the text did not find a stable complex between α-CD and WPOM. In addition, for α-CD–WPOM, we observed several peaks at larger CCS values of 460, 482, and 530 Å2 in Fig. 2a. These peaks likely correspond to the weakly bound exclusion complexes or fragments of larger complexes composed of WPOM and multiple α-CDs. Consistent with previous studies in the crystalline and solution phases, WPOM exclusively binds to the secondary face of β-CD (Fig. S2†).30
IM-MS of γ-CD–WPOM
For γ-CD–WPOM, we observe two distinct CCS distributions in Fig. 2a centered at 458 and 472 Å2. The distribution with a higher CCS value, corresponding to a larger structure, lies above the linear trend predicted for the series (Fig. 2b). Meanwhile, the CCS value of a more compact structure is on the linear trendline. Additional insights into the two structures were obtained from in-source collision-induced dissociation (CID) experiments on the IM-MS instrument. Fig. 3a shows m/z-selected arrival time distribution (ATD) plots of γ-CD–WPOM complex at different collision energies acquired as described in the Experimental section. In each trace, the two peaks at ATD around 22 ms correspond to the two CCS values observed for γ-CD–WPOM, with the lower and higher ATD peak corresponding to the smaller and larger structure, respectively. We observed a decrease in the abundance of the larger structure with an increase in collision energy. Meanwhile, the abundance of the smaller structure does not change as a function of collision energy. This observation suggests that the more compact structure is substantially more stable towards fragmentation in the gas phase than the larger structure. We hypothesize that the two structures in the gas phase originate from WPOM complexation with both primary and secondary face of γ-CD. In particular, the smaller structure likely corresponds to WPOM that is deeply embedded into the CD cavity via the complexation with the secondary face of γ-CD presenting a larger cavity size compared to the primary face.12 Meanwhile, the larger structure may be attributed to the less favorable size matching between WPOM and the primary face of γ-CD. | ||
| Fig. 3 (a) Left: extracted ATDs of γ-CD–WPOM complexes in IM-MS measurements with increased collision energies from the front to the back. Each ATD trace is normalized to the peak at lower ATD corresponding to the structure with a lower CCS value. Right: experimental single-field CCS distribution of γ-CD–WPOM complexes (top) and a histogram of calculated CCSs of 52 low-energy structures obtained from MD simulations (bottom). (c) & (d) representative structures (left: front view; middle: bottom view), calculated CCS values, and table of hydrogen bonding analyses of γ-CD–WPOM host–guest complexes demonstrating WPOM complexation with the secondary (b) and primary (c) face of γ-CD from MD simulations. Hydrogen bonds listed in the tables are represented by light blue bonds in the structure and labeled using Roman numerals. | ||
To test this hypothesis, we examined the structures of 1:1 γ-CD–WPOM complexes using MD simulations and calculated their theoretical CCS values using the IMoS program.35 AMBER-compatible GLYCAM-06j force field was used throughout the simulations (MD simulation parameters are provided in ESI†). Each MD simulation used a distinctly different initial structure representing different modes of binding of CD–WPOM complexes. For all the hosts except for α-CD (β-, γ-, ε-, and ζ-CD), host–guest complexes did not dissociate even when subjected to simulated annealing. Meanwhile, no stable complexes of α-CD–WPOM could be generated using the same set of MD simulation parameters. This finding contradicts our experimental observation of the α-CD–WPOM complex generated using ESI. It is reasonable to assume that force fields used in MD simulations underestimate the strength of non-covalent interactions in these host–guest complexes. A simulated annealing approach allowed us to identify low-energy structures for CCS calculation, which were later correlated with experimental IM-MS results (ESI†). Fig. 3b and c show two representative low-energy structures of the γ-CD–WPOM complex formed by binding of WPOM to the secondary and primary face of γ-CD, respectively. The calculated CCS values of the complexes (456 and 470 Å2) agree with the experimental CCS values (458 and 472 Å2) supporting our hypothesis of the presence of two structures that involve binding of WPOM to the secondary (smaller structure) and primary (larger structure) –OH groups of γ-CD.
We obtained a total of 52 low-energy structures of γ-CD–WPOM complexes from four complete MD runs with simulated annealing (Table S2†), which used distinct initial structures of the complexes representing different binding modes (Fig. S3†). Two sets of low-energy structures from two complete MD runs are shown in Fig. S4 and S5.† A histogram of calculated CCS values of the 52 structures shown in Fig. 3a (right). We observed two distinct distributions of structures with CCS values centered at ∼455 and ∼468 Å2, which is consistent with the experimental observations (Fig. 2b). Several representative structures are shown in Fig. 3b, c, and S6A.† A majority of the simulated structures that have CCS values close to the center of the lower and higher CCS distributions show WPOM binding to the secondary and primary face of γ-CD, respectively. Previous 1H NMR investigation demonstrated that WPOM forms host–guest complexes with both the primary and secondary faces of γ-CD in solution.27 Here for the first time, we observe the presence of these two complexation modes of γ-CD–WPOM using CCS measurement in the gas phase.
The number of stable hydrogen bonds between WPOM oxygen atoms and –OH groups in CDs is a major contributing factor to the stability of the complex in the gas phase. Because of the better size matching between the guest and host, the complex between WPOM and secondary face of γ-CD forms is more effectively stabilized by hydrogen bonding interactions than the complex formed through WPOM binding to the primary face. This hypothesis is confirmed by the analysis of hydrogen bonding in the representative structures shown in Fig. 3b and c. In this analysis, we only considered stable interactions through hydrogen bonds with a length of less than 2.5 Å and bond angle greater than 150°. The number of hydrogen bonds will be used as a measure of the stability of the complex. In particular, six strong hydrogen bonds are present in the simulated structure of the complex formed between WPOM and the secondary face of γ-CDs (Fig. 3b). In contrast, only two hydrogen bonds are present in the complex formed with the primary face of γ-CDs (Fig. 3c). Hydrogen bonding analysis of several other structures shown in Fig. S6† further confirms stronger interactions between WPOM and the secondary face of γ-CD. As a result, the more compact structure formed between WPOM and the secondary face of γ-CD with a better size matching and more stable hydrogen bonding interactions is more stable than the larger structure.
IM-MS of LRCD–WPOM
As shown in Fig. 2, the CCS values of the δ- and ε-CD–WPOM complexes follow the trendline in the CCS vs. m/z plots, indicating that they form similar inclusion complexes to that of β-CD and the more compact structure of γ-CD–WPOM. In contrast, the CCS value of the ζ-CD–WPOM complex of 507 Å2 is substantially lower than what is predicted based on the linear trend (∼535 Å2). This observation suggests a substantial difference between gas phase structures ε- and ζ-CD–WPOM complexes.MD simulations summarized in Fig. 4 provides additional insights into structural differences between the LRCD–WPOM complexes. LRCDs are known to adopt folded conformations. Fig. 4a shows two different views of a representative folded conformation of ε-CD, which we will be referring to as a “saddle-like” conformation. It has been demonstrated that host–guest complexes of LRCDs with dodecaborate anions (B12I122−) in solution are formed by accommodating the guest into a folded pocket of the host.25 WPOM and B12I122− are both large anions with similar sizes classified as superchaotropic ions.23 We hypothesize that the observed ζ-CD–WPOM complex in the gas phase with substantially lower CCS may be formed by binding WPOM to the folded pocket of ζ-CD. To test the hypothesis, we used MD simulations with the same parameters as those described earlier to obtain a group of low-energy structures of ε- and ζ-CD–WPOM complexes and subjected them to IMoS CCS calculations. Six distinct initial binding modes between LRCDs and WPOM were sampled due to the larger size of LRCDs (Fig. S7†). A total of 66 low-energy structures were obtained for ε- and ζ-CD–WPOM, respectively (Tables S3 and S4†). In the optimized structures with annular CD conformations, both ε- and ζ-CD have sufficiently large inner cavity sizes to accommodate WPOM through deep encapsulation (Fig. 4b). In addition, we observed a group of low-energy structures with a saddle-like CD conformation that resemble the conformation of the free ζ-CD in an aqueous solution (Fig. 4a). All complexes formed with a saddle-like ζ-CD conformation have substantially lower calculated CCS values than those of deep inclusion complexes (Fig. 4b). Good correspondence between the experimental and calculated CCS values was obtained for the deep inclusion complex of ε- (Fig. 4c) and ζ-CD–WPOM (Fig. 4d) with a saddle-like CD conformation.
 | ||
| Fig. 4 (a) Side-on (top) and 45° angle (bottom) views of the conformation of the free ε-CD that forms a saddle-like geometry. (b) Four sets of the experimentally-determined CCS values of ε- and ζ-CD–WPOM complexes (colored triangles with error bars) and calculated CCS values of representative simulated complex structures (dark crosses) with their proposed geometries. In these structures, CD and WPOM are illustrated by sticks and polygons, respectively. For both ε- and ζ-CD–WPOM complexes, deep inclusion of WPOM (top) gives rise to a much higher CCS value than the complexes formed with the saddle-like CD pocket (bottom). Side and top view of structures of the deep inclusion complex of ε-CD–WPOM (c) and the ζ-CD–WPOM complex with the ζ-CD in a saddle-like conformation (d). The calculated CCS values of these two complexes are in an excellent correspondence with their experimental results. | ||
Because ε-CD is the largest in the series of complexes that follow the linear trend of CCS value vs. molecular size and m/z shown in Fig. 2, it is reasonable to conclude that, similar to smaller CD hosts that adopt annular conformations and for inclusion complexes, ε-CD adopts an annular geometry to accommodate WPOM. Meanwhile, ζ-CD assumes a folded saddle-like conformation that accommodates WPOM. We note that the observed CCS trend vs. molecular size does not indicate WPOM binding modes with primary or secondary face of CDs. In fact, as the cavity becomes larger in the series, WPOM becomes gradually more embedded into the CD cavity and interact with the hydroxyl groups on both faces of CDs (Fig. 4c).
The observed difference in the mode of complexation between ε- and ζ-CD can be explained by considering the stability of these complexes. Fig. 5a and b show several representative simulated structures of ε- and ζ-CD–WPOM, respectively, in which CDs adopt an annular conformation. We observed a larger number of hydrogen bonds in all of the ε-CD–WPOM deep inclusion complexes in comparison with ζ-CD–WPOM. In particular, the complex shown in Fig. 5a (top) exhibits six stable hydrogen bonds between ε-CD and WPOM. MD simulations indicate that ε-CD has a cavity size that matches WPOM more favorably than ζ-CD, thereby making closer contacts and stronger interactions. As a result, the deep inclusion complex between ε-CD and WPOM is preferably formed, which is consistent with the experimentally observed complex that has a larger CCS value than that observed for the saddle-like conformation of ζ-CD.
 | ||
| Fig. 5 Representative simulated structures and calculated CCS values of ε- (a) and ζ-CD–WPOM (b) complexes. For each structure, there are side-on and plan views (top) of the complexes and a table (bottom) of hydrogen bonding analysis. All of the parameters of hydrogen bonds shown in the tables are labeled with Romanic numerals in the related plan view illustration. | ||
Solution-phase NMR analysis
To understand of how gas-phase structures of CD–WPOM are related to their structures in solution, we used NMR-based approaches to probe solution-phase binding modes between CDs and WPOM. Fig. 6 shows 1H NMR spectra obtained in titration experiments, in which WPOM was added to different X-CD (X = γ, ε, ζ) solutions in steps of 0.5 equivalents to generate CD:WPOM = 1:x (x = 0–3) solutions. 1H NMR spectra of complexes of Keggin POM and α/β-CD has been previously reported and will not be further discussed in this study.30 We also note that because the sample of δ-CD contained a substantial amount of γ-CD in about 1:1 ratio, the strong overlap of spectral features between δ-CD and γ-CD prevented us from studying δ-CD–WPOM complexes using 1H NMR. The spectrum shown at the bottom of each panel contains peaks corresponding to the six types of hydrogen atoms in a free CD host, which are consistent with previous reports.25 In particular, H1, H2 and H4 are hydrogen atoms pointing outwards from the CD rim. NMR chemical shifts of these peaks are less affected by complex formation. In contrast, peaks located at ∼3.8 ppm corresponding to H3, H5, and H6 are downshifted significantly upon the addition of WPOM due to the encapsulation of the electron-repelling WPOM into the CD cavity.
 | ||
| Fig. 6 1H NMR spectra in titration experiments of γ- (a), ε- (b) and ζ-CD (c), in which WPOM was added in a portion-wise manner into each of the solution in 0.5 equivalent interval of each CD. NMR peaks corresponding to hydrogen atoms (H1–H6) in CD are labeled accordingly. | ||
In previous reports, the formation of a 1:1 γ-CD–WPOM complex as a major host–guest complex was verified using diffusion ordered spectroscopy (DOSY).27 We have also confirmed the major presence of 1:1 CD–WPOM complexes using DOSY. Fig. S8–S10† show DOSY NMR spectra of γ-, ε- and ζ-CD before and after the addition of one and two equivalents of WPOM, respectively. Only one additional diffusion coefficient distribution was observed for each CD in the presence of WPOM, which confirms that the 1:1 X-CD–WPOM (X = γ, ε, ζ) complex is the dominant species in solution.
NMR titration spectra of γ-CD and WPOM in Fig. 6a are consistent with previous reports.27 For example, a significant simultaneous downshifting of H3, H5, and H6 of γ-CD with the addition of POM has been previously observed. Downshifting of H3 indicates interactions of WPOM with the secondary face of γ-CD, while downshifting of H5 and H6 is attributed to the interactions of WPOM with the primary face of γ-CD. Because of the relatively small cavity of γ-CD (diameter 7.5–8.3 Å)12 relative to WPOM (diameter 10.4 Å),36 simultaneous downshifting of H3, H5, and H6 cannot be induced by the deep encapsulation of WPOM into γ-CD. Instead, WPOM binds to either the primary or secondary face of γ-CD. These observations are in excellent agreement with the presence of two distinct structures of γ-CD–WPOM complexes observed in the gas phase, which were attributed to WPOM binding to either the primary or secondary face of γ-CD. We note that the downshifting peaks of H3, H5, and H6, are poorly resolved, indicating a complicated structural landscape of the 1:1 γ-CD–WPOM complex in solution.
We used a similar NMR-based titration approach to examine solution phase structures of LRCD-WPOM complexes. Fig. 6b and c show 1H NMR spectra obtained by adding different equivalents of WPOM to ε- and ζ-CD, respectively. Similar to γ-CD–WPOM, downshifting of the H3, H5 and H6 peaks is observed for both ε- and ζ-CD–WPOM complexes, indicating that WPOM interacts with both the primary and secondary faces of these LRCDs. NMR peaks do not show any further shift upon the addition of more than two equivalents of WPOM (2.5 and 3 equivalents in Fig. 6b and c, respectively), which indicates that an equilibrium is established at a 1:2 CD–WPOM stoichiometry. Among the downshifting peaks of ε-CD, H3 and H5 peaks partially overlap with each other. In a previous report, changes in chemical shifts, ΔδH5 > ΔδH3, have been identified as a signature of a deep encapsulation of B12I122− into the inner cavity of ε-CD.25 In this structure, WPOM protrudes deep enough into the CD cavity and comes in close proximity to both H3 and H5 atoms. As a result of the narrower opening of the primary CD face, the distances between WPOM to H5 atoms are shorter than the distances between WPOM and H3 atoms. As a result, more significant downshifting is observed for the H5 peaks. Furthermore, despite the substantial overlap between the H5 and H3 peaks, we observe a more significant downshifting of the H5 bands than H3 bands. It is notable that NMR shifts observed for deep inclusion complexes of ε-CD–WPOM are dependent on the size of the guest anion. In particular, we observe a less pronounced H5 downshift for ε-CD–WPOM (∼0.2 ppm) in comparison with the value reported for ε-CD–B12I122− (0.3 ppm),25 indicating that the distance between H5 and WPOM is longer than that for B12I122−. We attribute this observation to the larger size of B12I122− (∼11.7 Å) as compared to WPOM (∼10 Å). For the larger B12I122− guest, the distance between the guest and H5 atoms in ε-CD is shorter, which results in a more significant downshift of H5 peaks in comparison to what we observed for the ε-CD–WPOM complex in this study.
Additional insights into the structure of the deep inclusion complex of ε-CD–WPOM are obtained by examining the downshifting of the H6 peaks in Fig. 6b. The H6 peaks in the 1H NMR spectrum of free ε-CD show a doublet of doublets pattern. This is attributed to the diastereotopic nature of H6,12 in which the two CH2 protons reside in two distinct chemical environments. The H6 peaks are broadened in the spectrum of the ε-CD–WPOM host–guest complex and show an increase in the coupling constants. This may be attributed to an increase in electron density on the H5 atoms upon WPOM encapsulation. Broadening of the H6 peaks indicates the heterogeneous chemical environments that H6 atoms exhibit upon complexation. In particular, the –CH2OH groups that are at different distances from WPOM experience different levels of deshielding from WPOM. The observed changes in both H5 and H6 peaks indicate that ε-CD does not adopt a perfect annular shape when a deep inclusion complex with WPOM is formed. Indeed, MD simulations indicates that deep inclusion ε-CD–WPOM complexes assume partially folded ε-CD conformations in the gas-phase as shown in Fig. 4c and 5a. In these structures, the cavity in ε-CD is folded slightly towards the side of the primary face. This folding brings several –CH2OH groups closer to the WPOM guest than in other structures, which is in agreement with the observed broadening of the H6 peaks. Collectively, these solution-phase NMR spectra confirm the formation of a deep inclusion complex between WPOM and ε-CD, which resembles the corresponding stable gas-phase structure determined based on the experimental CCS measurement and MD simulations.
In contrast with ε-CD, we did not observe evidence of the formation of a deep inclusion complex between ζ-CD and WPOM in solution (Fig. 6c). Indeed, all the H3, H5, and H6 peaks showed a simultaneous downshifting without significant changes in their relative chemical shifts and multiplicities. In particular, the H6 doublet of doublets peak in free ζ-CD spectrum transitioned into a broadened doublet pattern in the presence of WPOM with negligible change in its coupling constant. These changes indicate that complex formation of WPOM and ζ-CD does not distort the conformation of the host to a significant extent. We propose that, similar to the previously reported25 ζ-CD–B12I122−, ζ-CD in the ζ-CD–WPOM complex adopts a saddle-like conformation. This result is in good agreement with the proposed structure of this complex in the gas-phase (Fig. 4b and d). The saddle-like ζ-CD conformation forms hydrogen bonds with WPOM without a significant geometry rearrangement. Meanwhile, the large cavity of the annular conformation of ζ-CD cannot bind WPOM strongly enough to form a stable complex. Although we cannot rule out the existence of deep inclusion complexes of ζ-CD and WPOM, we show that the dominant structure of the ζ-CD–WPOM complex in solution is preserved in the gas phase and can be characterized using IM-MS measurements.
Conclusion
We characterized gas- and solution-phase structures of host–guest complexes of Keggin polyoxometalate PW12O403− (WPOM) and a series of cyclodextrins (X-CD, X = α, β, γ, δ, ε, ζ) using a combination of experimental and theoretical methods. Using IM-MS and MD simulations, we uncovered two distinct binding modes of WPOM to γ-CD. Specifically, a more compact structure is formed when WPOM binds to the secondary face of γ-CD. Meanwhile, binding of WPOM to the primary face of γ-CD generates a less stable complex with a greater CCS value. Additionally, we observe the formation of a deep inclusion complex between WPOM and ε-CD. In contrast, ζ-CD with its larger cavity assumes a folded saddle-like conformation in the complex with WPOM. These observations based on rotationally averaged CCS measurements in the gas phase are strongly correlated with the results of solution-phase NMR characterization indicating that solution-phase structures are largely preserved in the gas phase. Our findings underscore the power of gas-phase IM-MS as an analytical tool for exploring the structural landscape of supramolecular complexes with exceptional molecular and conformational resolution. The formation of deep inclusion complexes with nanoscale guest ions opens up intriguing opportunities for designing new supramolecular materials. Moreover, the ability to preserve solution-phase structures of host–guest complexes in the gas phase opens new directions in employing well-defined gaseous ions of these complexes for preparing layered supramolecular architectures using preparative MS approaches.37Experimental section
Sodium phosphotungstate tribasic hydrate (Na3[PW12O40]·xH2O, CAS: 12026-98-1), α-cyclodextrin (α-CD, C36H60O30), β-cyclodextrin (β-CD, C42H70O35), γ-cyclodextrin (γ-CD, C48H80O40) were purchased from Sigma-Aldrich (St. Louis, MO, USA). δ-Cyclodextrin (δ-CD), ε-cyclodextrin (ε-CD), and ζ-cyclodextrin (ζ-CD) were synthesized and purified according to reported procedures.38 We note that the δ-CD sample was a mixture of δ-CD and γ-CD in a ∼1:1 molar ratio.
Aqueous solutions of CD–POM complexes for gas-phase IM-MS measurements were prepared by dissolving X-CD (X= α, β, γ, δ, ε, ζ) and Na3[PW12O40] (WPOM) at 100 and 500 μM concentrations, respectively. The resulting solution was diluted in methanol to a final concentration of 10 μM of X-CD assuming all CD molecules were in the complex form. Electrospray ionization (ESI) IM-MS measurements were performed using a custom-designed ESI source coupled to an Agilent 6560 ion mobility quadrupole time-of-flight (IM QTOF) mass spectrometer (Agilent Technologies, Santa Clara, CA, USA). Samples were filled into a gas-tight syringe (Hamilton, Reno, NV), propelled using a syringe pump (KD Scientific, Holliston, MA), and introduced into the mass spectrometer inlet by direct infusion through a fused-silica capillary (50 μm ID, 150 μm OD) at a flow rate of ∼500 nL min−1. Typical mass spectrometer conditions of IM QTOF in negative ionization mode were as follows: ESI voltage: −3.5 kV, capillary temperature: 325 °C; drift tube gas pressure: 3.95 torr; drift tube temperature: 25.4 °C; trap fill time: 5 ms, trap release time: 100 μs; m/z range: 100–3200. In-source collision-induced dissociation (CID) experiments were performed by increasing the voltage gradient between the dual exit grids in the ion funnel trap region of the IM QTOF instrument. For MS settings without in-source fragmentation, −88 and −87 V potentials were applied to Exit Grid 1 and 2, respectively. In-source fragmentation was induced by varying the Exit Grid 1 voltage from −89 to −95 V while keeping the Exit Grid 2 at −87 V.
Arrival time distributions (ATDs) and rotationally-averaged CCS values of CD–WPOM complexes were obtained using drift-tube (DT) IM-MS on the IM QTOF instrument. In these experiments, ions generated in the source were first separated by shape and size in the drift tube under the effect of a constant acceleration electric field and low-energy collisions with the drift gas. Mass-to-charge ratios (m/z) of mobility-separated ions were subsequently determined using QTOF MS. CCS values were calculated from an adapted Mason-Schamp equation using either single-field or stepped-field approaches described in detail elsewhere.34 Specifically, for single-field measurements, CCS were converted from ATDs according to a CCS calibration curve obtained from a series of standard calibrants measured under identical IM-MS instrument parameters.34 For stepped-field measurements, the voltage gradient in the drift tube was varied by varying the drift tube entrance voltage from 850 to 1450 V (corresponding to 10.9–18.5 V cm−1) in 100 V steps at which ATDs of the complexes were recorded. To ensure reproducibility, the CCS measurements were repeated four times on different days. In specific cases, m/z-selected ATDs obtained using identical instrument parameters were directly used for a qualitative comparison of CCSs of different CD–WPOM complexes. In this case, the top five peaks from the isotopic distribution were selected to construct the ATD of the complex.
Solution-phase 1H NMR titration experiments were performed in D2O at 25 °C. 1H NMR spectra were acquired using a Bruker AV-III-400-HD spectrometer (Bruker, Billerica, MA, USA) at Larmor frequency of 400 MHz using 5 mm standard NMR tubes. For each CD, an 1H NMR spectrum was first acquired for a 1 mM solution. Titration experiments were performed by successively adding a 1 M WPOM to the solution in 0.5 mole equivalents of CD to prepare CD–WPOM solutions with molar ratios of CD:WPOM = 1:x (x = 0.0, 0.5, 1.0, 1.5, 2.0, 2.5, 3.0). NMR spectra were acquired for each solution.
Diffusion ordered spectroscopy (DOSY) experiments were performed in D2O at 25 °C. DOSY NMR spectra were acquired using a Bruker Neo 600 MHz spectrometer (Bruker, Billerica, MA, USA) with working frequencies of 600 MHz using 5 mm standard NMR tubes. For the spectrum of each X-CD (X= γ, ε, ζ) solution, 500 μL of 10 mM solution was added to the NMR tube. For the NMR spectroscopic characterization of CD–WPOM complexes, 1 and 2 equivalents (5 and 10 μL) of 1 M WPOM solutions were added to the previous X-CD solution, respectively.
Molecular dynamics (MD) simulations
Molecular dynamics (MD) simulations of X-CD–WPOM (X = β, γ, ε, ζ) complexes were performed using the VMD (Visual Molecular Dynamics) software to examine their structures and conformations in the gas phase for comparison with IM-MS experiments. As a result of the complex conformational landscape of LRCDs, we employed simulated annealing (SA) to find minima on the potential energy surface of these complexes and obtain the corresponding structures. For comparison with the experimental CCS values obtained in IM-MS experiments, we calculated CCS values for selected low-energy structures. We used the optimized structure of WPOM reported in literature39 as the initial structure for all the CD–WPOM complexes including the partial charges from this structure. Initial structures of CDs were obtained from Cambridge Crystallographic Data Centre (CCDC): β- (CCDC 1107196), γ- (CCDC 1126610), and ε-CD (CCDC 100656). The crystal structure of ε-CD has not been previously reported. The initial structure for ζ-CD was generated from the structure of ε-CD by adding one more glucopyranosyl unit. MD simulations were performed using the AMBER force field. In particular, the beginning structures for the CD-WPOM complexes used the AMBER-compatible GLYCAM-06j force field.40 MD simulations with SA were performed by first setting WPOM at geometrically inequivalent locations relative to CDs, which allows for sampling of distinct initial locations in the reaction coordinate. For β- and γ-CD, we set (Fig. S3, ESI†) WPOM at four initial positions relative to CDs, while for LRCDs (ε- and ζ-CD), we selected (Fig. S7, ESI†) six positions according to the relatively large size of the host. In all SA simulations, CDs and WPOM were heated from 293 K to a final temperature of 393 and 800 K, respectively. Heating WPOM to 800 K did not result in significant structural rearrangements. Heating WPOM to a higher temperature allowed us to better explore the energy landscape. CDs were heated to 393 K. In each SA simulation, we performed (Fig.ure S11, ESI†) 25 consecutive heating and cooling cycles. Each cycle lasted 100 ps with a structure recorded every 250 fs. In each heating and cooling cycle, the initial structure was heated at a constant rate for a total of 50 ps to reach the final temperature, maintained at the final temperature for 40 ps, and cooled to the initial temperature at a constant rate for a total of 10 ps. The structures at 293 K at the end of each cycle were considered as optimized energy minima structures.Data availability
All experimental and computational data associated with this article have been provided in ESI.†Conflicts of interest
The authors declare no competing financial interest.Author contributions
Conceptualization: PS, JL, methodology: PS, JL, resources: XZ, WZ, JL, software: PS, XZ, SMW, HYSO, investigation: PS, XZ, SMW, YF, CS, AS, HYSO, visualization: PS, XZ, YF, JL, writing – original draft: PS, JL, writing – review & editing: PS, JL, and all.Acknowledgements
This work was partially supported by the grant FA9550-23-1-0137 from the Air Force Office of Scientific Research (AFOSR) and startup funds from Purdue University. The authors also thank Drs J. Fraser Stoddart (University of Hong Kong, Hong Kong SAR) and Jonas Warneke (Universität Leipzig, Germany) for valuable suggestions.References
- (a) F. Huang and E. V. Anslyn, Introduction: Supramolecular Chemistry, Chem. Rev., 2015, 115, 6999–7000 CrossRef CAS PubMed; (b) M. C. T. Fyfe and J. F. Stoddart, Synthetic Supramolecular Chemistry, Acc. Chem. Res., 1997, 30, 393–401 CrossRef CAS; (c) Y. Wang, Y. Zhang, Z. Zhou, R. T. Vanderlinden, B. Li, B. Song, X. Li, L. Cui, J. Li, X. Jia, J. Fang, C. Li and P. J. Stang, A Cyclic Bis[2]catenane Metallacage, Nat. Commun., 2020, 11, 2727 CrossRef CAS PubMed; (d) C. Tian, S. D. P. Fielden, G. F. S. Whitehead, I. J. Vitorica-Yrezabal and D. A. Leigh, Weak Functional Group Interactions Revealed through Metal-Free Active Template Rotaxane Synthesis, Nat. Commun., 2020, 11, 744 CrossRef CAS PubMed.
- H. Zhu, L. Chen, B. Sun, M. Wang, H. Li, J. F. Stoddart and F. Huang, Applications of Macrocycle-Based Solid-State Host–Guest Chemistry, Nat. Rev. Chem, 2023, 7, 768–782 CrossRef CAS PubMed.
- L. Isaacs, Stimuli Responsive Systems Constructed Using Cucurbit[n]uril-Type Molecular Containers, Acc. Chem. Res., 2014, 47, 2052–2062 CrossRef CAS PubMed.
- (a) C. D. Gutsche, Calixarenes: an Introduction, Royal Society of Chemistry, 2008 Search PubMed; (b) J. Vicens and J. McB, Calixarenes in the Nanoworld, Springer, 2007 CrossRef.
- S. Ohtani, K. Kato, S. Fa and T. Ogoshi, Host–Guest Chemistry Based on Solid-State Pillar[n]arenes, Coord. Chem. Rev., 2022, 462, 214503 CrossRef CAS.
- (a) A. A. Ivanov, C. Falaise, P. A. Abramov, M. A. Shestopalov, K. Kirakci, K. Lang, M. A. Moussawi, M. N. Sokolov, N. G. Naumov, S. Floquet, D. Landy, M. Haouas, K. A. Brylev, Y. V. Mironov, Y. Molard, S. Cordier and E. Cadot, Host–Guest Binding Hierarchy within Redox- and Luminescence-Responsive Supramolecular Self-Assembly Based on Chalcogenide Clusters and γ-Cyclodextrin, Chem.–Eur. J., 2018, 24, 13467–13478 CrossRef CAS PubMed; (b) O. Dumele, B. Schreib, U. Warzok, N. Trapp, C. A. Schalley and F. Diederich, Halogen-Bonded Supramolecular Capsules in the Solid State, in Solution, and in the Gas Phase, Angew. Chem., Int. Ed., 2017, 56, 1152–1157 CrossRef CAS PubMed; (c) F. Jia, H. Hupatz, L.-P. Yang, H. V. Schröder, D.-H. Li, S. Xin, D. Lentz, F. Witte, X. Xie, B. Paulus, C. A. Schalley and W. Jiang, Naphthocage: A Flexible yet Extremely Strong Binder for Singly Charged Organic Cations, J. Am. Chem. Soc., 2019, 141, 4468–4473 CrossRef CAS PubMed.
- G. Crini, Review: A History of Cyclodextrins, Chem. Rev., 2014, 114, 10940–10975 CrossRef CAS PubMed.
- (a) B. V. K. J. Schmidt and C. Barner-Kowollik, Dynamic Macromolecular Material Design—The Versatility of Cyclodextrin-Based Host–Guest Chemistry, Angew. Chem., Int. Ed., 2017, 56, 8350–8369 CrossRef CAS; (b) M. Kfoury, D. Landy and S. Fourmentin, Characterization of Cyclodextrin/Volatile Inclusion Complexes: A Review, Molecules, 2018, 23, 1204 CrossRef PubMed; (c) A. Harada, Y. Takashima and M. Nakahata, Supramolecular Polymeric Materials via Cyclodextrin–Guest Interactions, Acc. Chem. Res., 2014, 47, 2128–2140 CrossRef CAS PubMed.
- Q.-D. Hu, G.-P. Tang and P. K. Chu, Cyclodextrin-Based Host–Guest Supramolecular Nanoparticles for Delivery: From Design to Applications, Acc. Chem. Res., 2014, 47, 2017–2025 CrossRef CAS PubMed.
- (a) L. Szente and J. Szemán, Cyclodextrins in Analytical Chemistry: Host–Guest Type Molecular Recognition, Anal. Chem., 2013, 85, 8024–8030 CrossRef CAS PubMed; (b) H. Hanayama, J. Yamada, I. Tomotsuka, K. Harano and E. Nakamura, Rim Binding of Cyclodextrins in Size-Sensitive Guest Recognition, J. Am. Chem. Soc., 2021, 143, 5786–5792 CrossRef CAS PubMed.
- (a) J. Wankar, N. G. Kotla, S. Gera, S. Rasala, A. Pandit and Y. A. Rochev, Recent Advances in Host–Guest Self-Assembled Cyclodextrin Carriers: Implications for Responsive Drug Delivery and Biomedical Engineering, Adv. Funct. Mater., 2020, 30, 1909049 CrossRef CAS; (b) S. B. Carneiro, F. Í. Costa Duarte, L. Heimfarth, J. D. Siqueira Quintans, L. J. Quintans-Júnior, V. F. Veiga Júnior and Á. A. Neves de Lima, Cyclodextrin–Drug Inclusion Complexes: In Vivo and In Vitro Approaches, Int. J. Mol. Sci., 2019, 20, 642 CrossRef CAS PubMed.
- J. Szejtli, Introduction and General Overview of Cyclodextrin Chemistry, Chem. Rev., 1998, 98, 1743–1754 CrossRef CAS.
- X. Ma, Z. Wei, X. Xiong, Y. Jiang, J. He, S. Zhang, X. Fang and X. Zhang, Gas-Phase Fragmentation of Host–Guest Complexes between β-Cyclodextrin and Small Molecules, Talanta, 2012, 93, 252–256 CrossRef CAS PubMed.
- D. Prochowicz, A. Kornowicz and J. Lewiński, Interactions of Native Cyclodextrins with Metal Ions and Inorganic Nanoparticles: Fertile Landscape for Chemistry and Materials Science, Chem. Rev., 2017, 117, 13461–13501 CrossRef CAS PubMed.
- D. Boczar and K. Michalska, Cyclodextrin Inclusion Complexes with Antibiotics and Antibacterial Agents as Drug-Delivery Systems—A Pharmaceutical Perspective, Pharmaceutics, 2022, 14, 1389 CrossRef CAS.
- C. A. López, A. H. de Vries and S. J. Marrink, Molecular Mechanism of Cyclodextrin Mediated Cholesterol Extraction, PLoS Comput. Biol., 2011, 7, e1002020 CrossRef PubMed.
- L. Szente and É. Fenyvesi, Cyclodextrin-Lipid Complexes: Cavity Size Matters, Struct. Chem., 2017, 28, 479–492 CrossRef CAS.
- J. Łagiewka, T. Girek and W. Ciesielski, Cyclodextrins-Peptides/Proteins Conjugates: Synthesis, Properties and Applications, Polymers, 2021, 13, 1759 CrossRef PubMed.
- (a) Q. Qi, X. She, T. Endo and W. Zimmermann, Effect of the Reaction Temperature on the Transglycosylation Reactions Catalyzed by the Cyclodextrin Glucanotransferase from Bacillus Macerans for the Synthesis of Large-Ring Cyclodextrins, Tetrahedron, 2004, 60, 799–806 CrossRef CAS; (b) C. Sonnendecker and W. Zimmermann, Change of the Product Specificity of a Cyclodextrin Glucanotransferase by Semi-Rational Mutagenesis to Synthesize Large-Ring Cyclodextrins, Catalysts, 2019, 9, 242 CrossRef.
- M. G. Gotsev and P. M. Ivanov, Molecular Dynamics of Large-Ring Cyclodextrins: Principal Component Analysis of the Conformational Interconversions, J. Phys. Chem. B, 2009, 113, 5752–5759 CrossRef CAS.
- P. M. Ivanov and C. Jaime, Insights into the Structure of Large-Ring Cyclodextrins through Molecular Dynamics Simulations in Solution, J. Phys. Chem. B, 2004, 108, 6261–6274 CrossRef CAS PubMed.
- A. Kantardjiev and P. Ivanov, On the Multivalency of Large-Ring Cyclodextrins, Carbohydr. Res., 2023, 531, 108876 CrossRef CAS.
- K. I. Assaf and W. M. Nau, The Chaotropic Effect as an Assembly Motif in Chemistry, Angew. Chem., Int. Ed., 2018, 57, 13968–13981 CrossRef CAS.
- K. I. Assaf, M. S. Ural, F. Pan, T. Georgiev, S. Simova, K. Rissanen, D. Gabel and W. M. Nau, Water Structure Recovery in Chaotropic Anion Recognition: High-Affinity Binding of Dodecaborate Clusters to γ-Cyclodextrin, Angew. Chem., Int. Ed., 2015, 54, 6852–6856 CrossRef CAS PubMed.
- K. I. Assaf, D. Gabel, W. Zimmermann and W. M. Nau, High-Affinity Host–Guest Chemistry of Large-Ring Cyclodextrins, Org. Biomol. Chem., 2016, 14, 7702–7706 RSC.
- (a) D. Kobayashi, H. Nakahara, O. Shibata, K. Unoura and H. Nabika, Interplay of Hydrophobic and Electrostatic Interactions between Polyoxometalates and Lipid Molecules, J. Phys. Chem. C, 2017, 121, 12895–12902 CrossRef CAS; (b) B. Naskar, O. Diat, V. Nardello-Rataj and P. Bauduin, Nanometer-Size Polyoxometalate Anions Adsorb Strongly on Neutral Soft Surfaces, J. Phys. Chem. C, 2015, 119, 20985–20992 CrossRef CAS; (c) M. Hohenschutz, I. Grillo, O. Diat and P. Bauduin, How Nano-Ions Act Like Ionic Surfactants, Angew. Chem., Int. Ed., 2020, 59, 8084–8088 CrossRef CAS; (d) T. Buchecker, P. Schmid, I. Grillo, S. Prévost, M. Drechsler, O. Diat, A. Pfitzner and P. Bauduin, Self-Assembly of Short Chain Poly-N-isopropylacrylamid Induced by Superchaotropic Keggin Polyoxometalates: From Globules to Sheets, J. Am. Chem. Soc., 2019, 141, 6890–6899 CrossRef CAS.
- S. Yao, C. Falaise, A. A. Ivanov, N. Leclerc, M. Hohenschutz, M. Haouas, D. Landy, M. A. Shestopalov, P. Bauduin and E. Cadot, Hofmeister Effect in the Keggin-Type Polyoxotungstate Series, Inorg. Chem. Front., 2021, 8, 12–25 RSC.
- (a) N. I. Gumerova and A. Rompel, Synthesis, Structures and Applications of Electron-Rich Polyoxometalates, Nat. Rev. Chem, 2018, 2, 0112 CrossRef CAS; (b) J. M. Clemente-Juan, E. Coronado and A. Gaita-Ariño, Magnetic Polyoxometalates: from Molecular Magnetism to Molecular Spintronics and Quantum Computing, Chem. Soc. Rev., 2012, 41, 7464–7478 RSC.
- (a) S. Khlifi, J. Marrot, M. Haouas, W. E. Shepard, C. Falaise and E. Cadot, Chaotropic Effect as an Assembly Motif to Construct Supramolecular Cyclodextrin–Polyoxometalate-Based Frameworks, J. Am. Chem. Soc., 2022, 144, 4469–4477 CrossRef CAS PubMed; (b) M. A. Moussawi, N. Leclerc-Laronze, S. Floquet, P. A. Abramov, M. N. Sokolov, S. Cordier, A. Ponchel, E. Monflier, H. Bricout, D. Landy, M. Haouas, J. Marrot and E. P. Cadot, Cationic Cluster, and γ-Cyclodextrin: From Primary Interactions to Supramolecular Hybrid Materials, J. Am. Chem. Soc., 2017, 139, 12793–12803 CrossRef CAS PubMed.
- Y. Wu, R. Shi, Y.-L. Wu, J. M. Holcroft, Z. Liu, M. Frasconi, M. R. Wasielewski, H. Li and J. F. Stoddart, Complexation of Polyoxometalates with Cyclodextrins, J. Am. Chem. Soc., 2015, 137, 4111–4118 CrossRef CAS PubMed.
- C. Falaise, M. A. Moussawi, S. Floquet, P. A. Abramov, M. N. Sokolov, M. Haouas and E. Cadot, Probing Dynamic Library of Metal-Oxo Building Blocks with γ-Cyclodextrin, J. Am. Chem. Soc., 2018, 140, 11198–11201 CrossRef CAS PubMed.
- (a) V. Gabelica and E. Marklund, Fundamentals of Ion Mobility Spectrometry, Curr. Opin. Chem. Biol., 2018, 42, 51–59 CrossRef CAS; (b) T.-C. Lee, E. Kalenius, A. I. Lazar, K. I. Assaf, N. Kuhnert, C. H. Grün, J. Jänis, O. A. Scherman and W. M. Nau, Chemistry Inside Molecular Montainers in the Gas Phase, Nat. Chem., 2013, 5, 376–382 CrossRef CAS; (c) L. Polewski, A. Springer, K. Pagel and C. A. Schalley, Gas-Phase Structural Analysis of Supramolecular Assemblies, Acc. Chem. Res., 2021, 54, 2445–2456 CrossRef CAS PubMed; (d) P. Chakraborty, M. Neumaier, P. Weis and M. M. Kappes, Exploring Isomerism in Isolated Cyclodextrin Oligomers through Trapped Ion Mobility Mass Spectrometry, J. Am. Soc. Mass Spectrom., 2023, 34, 676–684 CrossRef CAS PubMed; (e) P. Weis, F. Hennrich, R. Fischer, E. K. Schneider, M. Neumaier and M. M. Kappes, Probing the structure of giant fullerenes by high resolution trapped ion mobility spectrometry, Phys. Chem. Chem. Phys., 2019, 21, 18877–18892 RSC; (f) C. A. Schalley, Molecular recognition and supramolecular chemistry in the gas phase, Mass Spectrom. Rev., 2001, 20, 253–309 CrossRef CAS PubMed; (g) V. Bonnet, G. Clodic, C. Sonnendecker, W. Zimmermann and C. Przybylski, Ion mobility mass spectrometry enables the discrimination of positional isomers and the detection of conformers from cyclic oligosaccharides-metals supramolecular complexes, Carbohydr. Polym., 2023, 320, 121205 CrossRef CAS PubMed.
- P. Su, A. J. Smith, J. Warneke and J. Laskin, Gas-Phase Fragmentation of Host-Guest Complexes of Cyclodextrins and Polyoxometalates, J. Am. Soc. Mass Spectrom., 2019, 30, 1934–1945 CrossRef CAS PubMed.
- S. M. Stow, T. J. Causon, X. Zheng, R. T. Kurulugama, T. Mairinger, J. C. May, E. E. Rennie, E. S. Baker, R. D. Smith, J. A. McLean, S. Hann and J. C. Fjeldsted, An Interlaboratory Evaluation of Drift Tube Ion Mobility–Mass Spectrometry Collision Cross Section Measurements, Anal. Chem., 2017, 89, 9048–9055 CrossRef CAS PubMed.
- (a) C. Larriba and C. J. Hogan, Free Molecular Collision Cross Section Calculation Methods for Nanoparticles and Complex Ions with Energy Accommodation, J. Comput. Phys., 2013, 251, 344–363 CrossRef CAS; (b) V. Shrivastav, M. Nahin, C. J. Hogan and C. Larriba-Andaluz, Benchmark Comparison for a Multi-Processing Ion Mobility Calculator in the Free Molecular Regime, J. Am. Soc. Mass Spectrom., 2017, 28, 1540–1551 CrossRef CAS; (c) C. Larriba-Andaluz and J. S. Prell, Fundamentals of Ion Mobility in the Free Molecular Regime. Interlacing The Past, Present and Future of Ion Mobility Calculations, Int. Rev. Phys. Chem., 2020, 39, 569–623 Search PubMed.
- J. Breibeck, N. I. Gumerova, B. B. Boesen, M. S. Galanski and A. Rompel, Keggin-Type Polyoxotungstates as Mushroom Tyrosinase Inhibitors - A Speciation Study, Sci. Rep., 2019, 9, 5183 Search PubMed.
- (a) P. Su, H. Hu, J. Warneke, M. E. Belov, G. A. Anderson and J. Laskin, Design and Performance of a Dual-Polarity Instrument for Ion Soft Landing, Anal. Chem., 2019, 5904 CrossRef CAS PubMed; (b) F. Yang, M. Moors, D. A. Hoang, S. Schmitz, M. Rohdenburg, H. Knorke, A. Charvat, X.-B. Wang, K. Y. Monakhov and J. Warneke, On-Surface Single-Molecule Identification of Mass-Selected Cyclodextrin-Supported Polyoxovanadates for Multistate Resistive-Switching Memory Applications, ACS Appl. Nano Mater., 2022, 5, 14216–14220 CrossRef CAS.
- C. Sonnendecker, S. Thürmann, C. Przybylski, F. D. Zitzmann, N. Heinke, Y. Krauke, K. Monks, A. A. Robitzki, D. Belder and W. Zimmermann, Large-Ring Cyclodextrins as Chiral Selectors for Enantiomeric Pharmaceuticals, Angew. Chem., Int. Ed., 2019, 58, 6411–6414 CrossRef CAS PubMed.
- (a) V. Prabhakaran, Z. Lang, A. Clotet, J. M. Poblet, G. E. Johnson and J. Laskin, Controlling the Activity and Stability of Electrochemical Interfaces Using Atom-by-Atom Metal Substitution of Redox Species, ACS Nano, 2019, 13, 458–466 CrossRef CAS PubMed; (b) X. López, C. Nieto-Draghi, C. Bo, J. B. Avalos and J. M. Poblet, Polyoxometalates in Solution: Molecular Dynamics Simulations on the α-PW12O403- Keggin Anion in Aqueous Media, J. Phys. Chem. A, 2005, 109, 1216–1222 CrossRef PubMed.
- K. N. Kirschner, A. B. Yongye, S. M. Tschampel, J. González-Outeiriño, C. R. Daniels, B. L. Foley and R. J. Woods, GLYCAM06: A generalizable biomolecular force field. Carbohydrates, J. Comput. Chem., 2008, 29, 622–655 CrossRef CAS PubMed.
Footnote |
| † Electronic supplementary information (ESI) available: Experimental details for Molecular Dynamics simulations, data including Fig. S1–S10 (PDF). Atomic coordinates of the simulated structures shown in the manuscript are attached as xyz files (ZIP). See DOI: https://doi.org/10.1039/d4sc01061b |
| This journal is © The Royal Society of Chemistry 2024 |