
 Open Access Article
 This Open Access Article is licensed under a Creative Commons Attribution-Non Commercial 3.0 Unported Licence
Dynamic sampling in autonomous process optimization†
Melodie
Christensen
 *ab,
Yuting
Xu
b,
Eugene E.
Kwan
b,
Michael J.
Di Maso
b,
Yining
Ji
b,
Mikhail
Reibarkh
b,
Alexandra C.
Sun
b,
Andy
Liaw
b,
Patrick S.
Fier
b,
Shane
Grosser
b and
Jason E.
Hein
*acd
*ab,
Yuting
Xu
b,
Eugene E.
Kwan
b,
Michael J.
Di Maso
b,
Yining
Ji
b,
Mikhail
Reibarkh
b,
Alexandra C.
Sun
b,
Andy
Liaw
b,
Patrick S.
Fier
b,
Shane
Grosser
b and
Jason E.
Hein
*acd
aDepartment of Chemistry, University of British Columbia, Vancouver, British Columbia V6T 1Z1, Canada. E-mail: jhein@chem.ubc.ca
bDepartment of Process Research and Development, Merck & Co., Inc, Rahway, NJ 07065, USA. E-mail: melodie.christensen@merck.com
cAcceleration Consortium, University of Toronto, Toronto, ON, Canada
dDepartment of Chemistry, University of Bergen, Bergen, Norway
First published on 11th April 2024
Abstract
Autonomous process optimization (APO) is a technology that has recently found utility in a multitude of process optimization challenges. In contrast to most APO examples in microflow reactor systems, we recently presented a system capable of optimization in high-throughput batch reactor systems. The drawback of APO in a high-throughput batch reactor system is the reliance on reaction sampling at a predetermined static timepoint rather than a dynamic endpoint. Static timepoint sampling can lead to the inconsistent capture of the process performance under each process parameter permutation. This is important because critical process behaviors such as rate acceleration accompanied by decomposition could be missed entirely. To address this drawback, we implemented a dynamic reaction endpoint determination strategy to capture the product purity once the process stream stabilized. We accomplished this through the incorporation of a real-time plateau detection algorithm into the APO workflow to measure and report the product purity at the dynamically determined reaction endpoint. We then applied this strategy to the autonomous optimization of a photobromination reaction towards the synthesis of a pharmaceutically relevant intermediate. In doing so, we not only uncovered process conditions to access the desired monohalogenation product in 85 UPLC area % purity with minimal decomposition risk, but also measured the effect of each parameter on the process performance. Our results highlight the advantage of incorporating dynamic sampling in APO workflows to drive optimization toward a stable and high-performing process.
Introduction
Artificial intelligence (AI) has multiple definitions, but perhaps the most comprehensive description was invoked by the social scientist Marvin Minsky as “the science of making machines do things that would require intelligence if done by humans.” The field of AI is wide-ranging, encompassing subfields such as machine learning, computer vision, natural language processing, robotics, and autonomous systems.1 Autonomous process optimization (APO) is the human intervention-free self-optimization of input process parameters such as catalyst and temperature in order to minimize or maximize process output parameters such as yield, purity, and selectivity.2–7 APO involves the definition of the search space, in other words, the selection of the input and output process parameters, as well as the “closed-loop” integration of an optimization strategy with an automated experimental execution platform such as a liquid handling robot with an online analytical instrument such as a liquid chromatography instrument with UV detection.Optimization algorithms determine the input parameters that result in the minimum or maximum output parameters for an objective function, f(x). An objective function can be as simple as the quadratic function f(x) = x2, but in reality, objective functions in the chemical sciences are seldom this simple. In fact, mapping out the objective function of a chemical process would require the experimental sampling of each possible input parameter permutation. Due to the impracticality of the large number of experiments required by such an approach, the construction of a surrogate model from a subset of experiments is often preferred. As additional samples are evaluated in each optimization round, the model is refined. This approach to optimization has been coined sequential model-based optimization (SMBO, Fig. 1).8 Common examples in the chemical sciences include Stable Noisy Optimization by Branch and Fit (SNOBFIT),2,9 which relies on linear regression, and Bayesian Optimization (BO),10–15 which commonly relies on Gaussian Process (GP) regression.
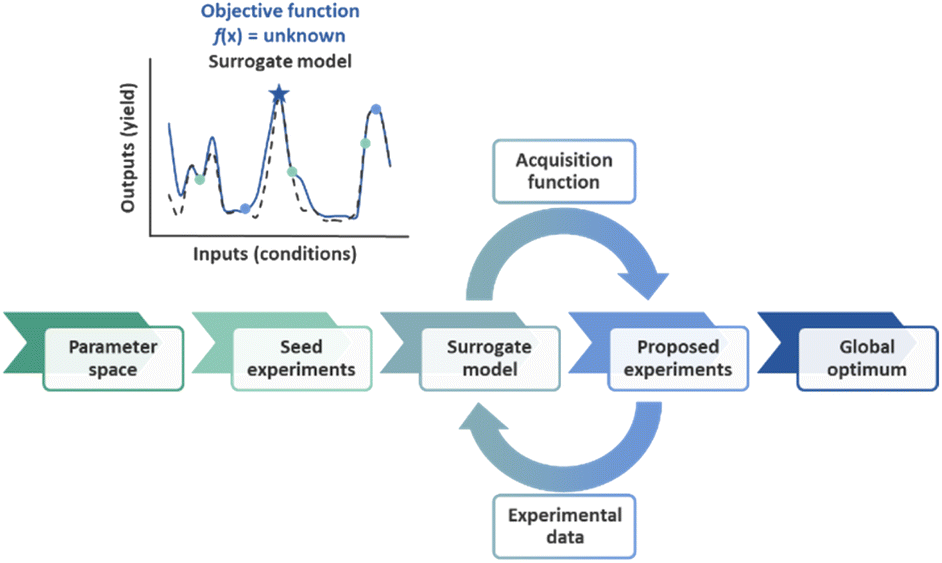 | ||
| Fig. 1 Schematic of sequential model-based optimization (SMBO). | ||
We recently applied an autonomous Bayesian Optimization strategy to the optimization of a Suzuki–Miyaura cross-coupling process in high-throughput batch reactors.16 High-throughput batch reactors offer an advantage over the microflow reactors, which have historically been utilized in the APO field, in that they provide broader versatility with respect to the physical processes they tolerate (for example, solid–liquid heterogeneous processes). Batch reactors also offer higher throughput via parallelization in order to generate data for surrogate models more efficiently, however, experiments are typically sampled at predetermined static timepoints rather than at dynamic endpoints.17–20 We devised a novel dynamic sampling strategy in which each high-throughput batch experiment could be sampled over time and terminated upon reaction endpoint detection via a real-time plateau detection algorithm.
The importance of dynamic sampling cannot be overstated in the context of APO, particularly in the optimization of complex chemical reactions through techniques such as SMBO. This crucial technique not only allows for the automatic adjustment of the number of samples taken during run-time, saving precious experimental resources, but also provides an accurate means of capturing the process output upon reaction completion. This is particularly useful in reactions with a propensity for decomposition, where dynamic sampling allows each reaction to run its course.
Dynamic sampling proved particularly useful in the optimization of a pharmaceutically relevant radical photobromination process with the propensity for decomposition through the generation of side product 3 (Fig. 2).21,22 We sought to understand the impacts of process conditions on the process performance and to identify conditions that would avoid decomposition. In addition, we sought to understand the process performance impacts of parameter permutations close to the optimum in the least number of experiments. Without dynamic sampling through a plateau detection algorithm, sampling could potentially terminate prior to the reaction stream reaching stability to the point of reaction completion or decomposition, resulting in the inaccurate capture of the process performance. Herein we describe the implementation of a dynamic sampling-driven SMBO strategy to optimize this photobromination process.
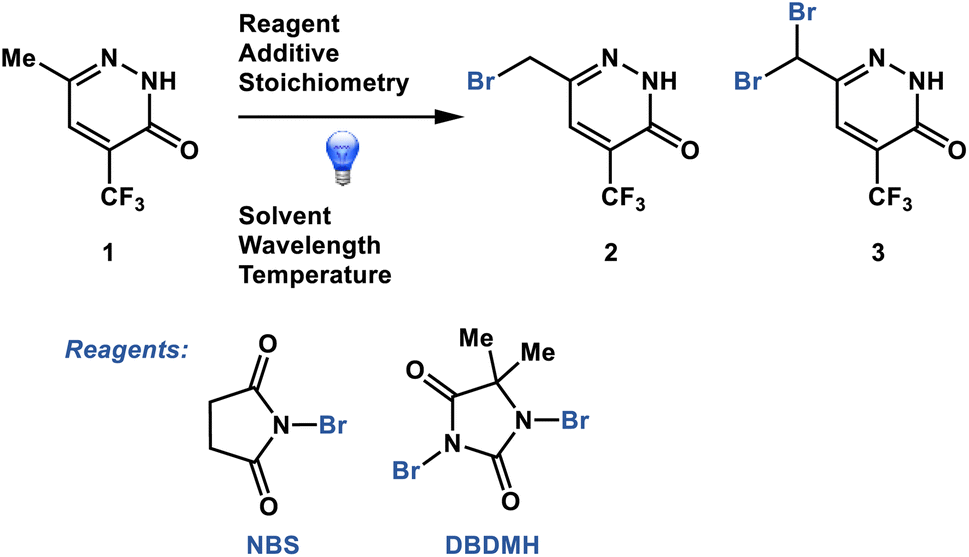 | ||
| Fig. 2 Photobromination process optimized through dynamic sampling-driven autonomous process optimization. | ||
Results and discussion
Pre-autonomous optimization studies
Prior to commencing APO studies, we initiated our work with high-throughput reaction profiling studies to narrow down the process parameters of interest. These studies uncovered a starting point for optimization and identified a variety of acid additives that promoted rate acceleration in the presence of NBS (Fig. 3). For example, the addition of 10 mol% of anhydrous phosphoric acid (H3PO4) generated product 2 in 79 UPLC area % in 1.5 hours. The second best option appeared to be phenyl phosphonic acid (PPA), generating product 2 in 78 LC area % in 1.5 hours. This rate acceleration was accompanied by the generation of 5 LC area % of dibrominated side product 3. The reaction was very slow in the absence of acid additive and plateaued upon generating 50 UPLC area % product after six hours of reaction time. Poor reactivity was observed with DBDMH, even in the presence of acid additive (see ESI† for details).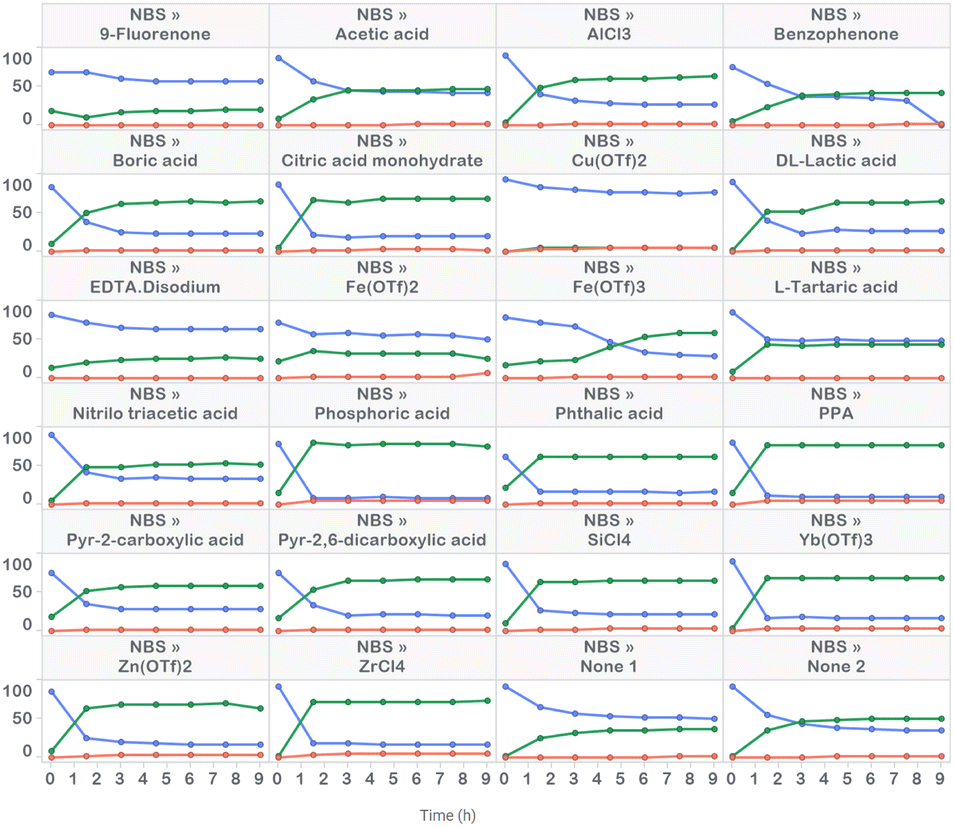 | ||
| Fig. 3 High-throughput reaction profiling evaluating NBS in the presence of 22 acid additives, along with replicate additive-free conditions. | ||
UPLC area % of starting material 1 (blue), product 2 (green) and side product 3 (red) measured over 9 hours in 1.5 hour time intervals. Conditions: 63 μmol 1, 69.3 μmol NBS and 6.3 μmol acid additive in ACN (0.25 M) irradiated with 405 nm LEDs at 60 mW (level 1) intensity for 9 h at 10–30 °C.
Although we had uncovered a suitable starting point for optimization, we were concerned that several experiments reached a conversion plateau prior to full starting material consumption. We suspected that decomposition of the bromination reagent was responsible for conversion plateaus, but did not have a full grasp of the decomposition mechanism. Lack of understanding around a decomposition mechanism posed a significant risk for the optimization. We therefore embarked upon LED-illuminated NMR spectroscopy studies for monitoring photochemical reactions that had been developed in 2019 and implemented in the monitoring of multiple photochemical reactions,23–25 including a recently reported Wohl–Ziegler bromination.21
UPLC analysis proved to be a suitable method for monitoring starting material 1, product 2 and side product 3, but failed to effectively monitor the bromation reagent (NBS) and succinimide levels due to their lack of strong chromophores. NMR proved to be a complementary method for gaining an understanding of the fate of NBS. Two LED NMR experiments were carried out at 15 °C that monitored starting material 1, product 2, dibrominated side product 3, NBS and succinimide concentrations over time. The first experiment was a light–dark study, where the reaction was irradiated for 10 minutes, aged in the dark for 10 minutes, and then irradiation resumed for 100 minutes (Fig. 4a). No changes in reaction species concentrations were observed over the 10 min dark period, indicating the absence of a dark reaction or decomposition pathway. This observation allowed for us to turn off the lights during autonomous optimization sample analyses. Overall mass balance with respect to 1, 2, and 3 remained steady over time and the mass balance with respect to NBS and succinimide also remained steady over time. The second experiment was a reaction monitoring study under constant irradiation. Here, we noted that 20 mol% of the NBS had converted to succinimide prior to initiation and that the reaction plateaued due to full consumption of the NBS prior to starting material consumption (Fig. 4b and c).
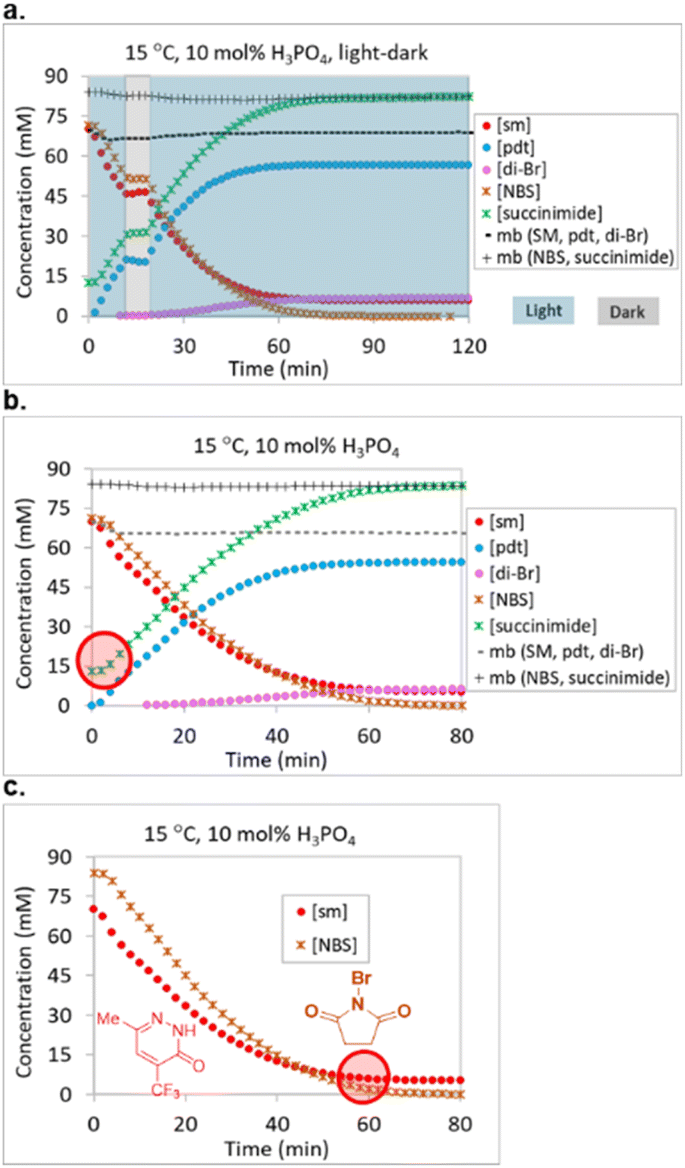 | ||
| Fig. 4 NMR reaction monitoring of (a) all reaction components at 15 °C under light–dark cycling, (b) all reaction components at 15 °C under constant light conditions, and (c) starting material 1 and NBS at 15 °C under constant light conditions. 1 equiv. 1, 1.2 equiv. NBS and 10 mol% H3PO4 in ACN-d3 (0.07 M) irradiated with 445 nm LEDs for 80–120 min at 15 °C. | ||
In order to further understand the early formation of succinimide, we prepared a representative mixture of starting material 1 and NBS in anhydrous ACN and observed that 15.3 mol% of succinimide had already formed prior to our first NMR measurement (the level remained constant over 20 hours in the dark). In order to rule out the possibility that the source of succinimide was the reagent bottle, we prepared a 70 mM solution of NBS from the same reagent bottle and observed only 0.6 mol% succinimide. Similarly, the addition of H3PO4 to NBS resulted in a measurement of 0.5 mol% succinimide in solution. In contrast, the addition of starting material 1 to NBS resulted in the immediate formation of 18.6 mol% succinimide and, unsurprisingly, the addition of starting material 1 and H3PO4 to NBS resulted in the formation of 18.4 mol% succinimide.
We speculated that pyridazinone 1 might have formed an N-brominated complex in equilibrium, and were unsure whether this species could serve as an effective bromination reagent. In order to provide evidence for the formation of an N-bromopyridazinone species, we carried out NMR internal standard assay measurements of the concentrations of pyridazinone 1 and succinimide in two solutions, the first containing pyridazinone 1 alone and the second containing pyridazinone 1 along with one molar equivalent of NBS. The first assay measured the single component mixture to be 76.0 mM in pyridazinone 1 while the second assay measured the mixture to be 58.7 mM in pyridazinone 1 and 23 mM in succinimide based on their corresponding N–H signals. Reaction plateau variability could be based on changes in the equilibrium distribution between NBS and the proposed N-bromopyridazinone species under varied process conditions. Nonetheless, the LED NMR studies allowed us to determine that the preparation of stock mixtures containing pyridazinone 1 and NBS could potentially lead to plateau variability issues, and thus, all future stock solutions for autonomous optimization were prepared individually for each reaction component.
Dynamic-sampling driven autonomous optimizer design
We developed a high-throughput autonomous photochemistry optimizer with dynamic sampling by modifying a Chemspeed SWING XL robot to incorporate a high-throughput photoreactor with automated light and temperature control, online UPLC system for rapid outcome analysis, and installed an ultra-high-pressure sampling valve for dynamic end point determination. We also developed a plateau detection algorithm and selected open-source optimization algorithms for autonomous optimization. Finally, we developed a data integration strategy among components and established a Python interface to configure input parameters, experiment suggestions, and to relay results to the optimizer code for the next experiment (Fig. 5, see ESI† for details).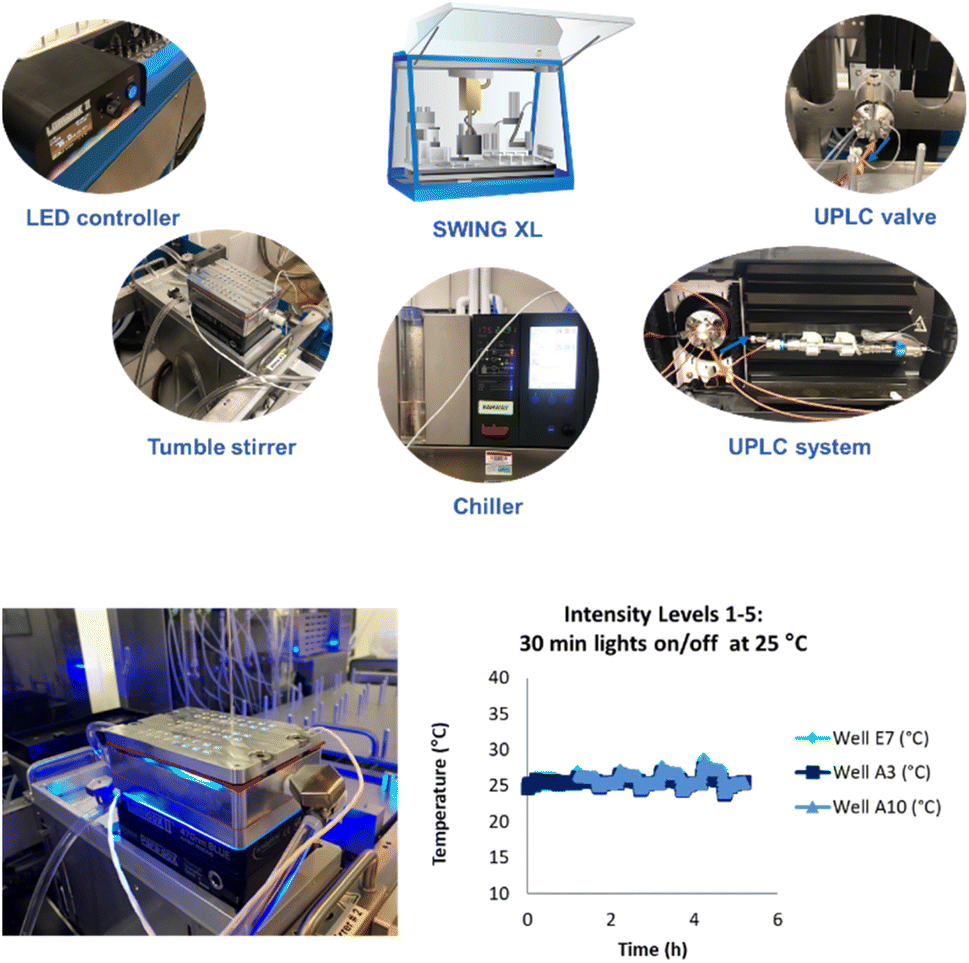 | ||
| Fig. 5 Components of a Chemspeed SWING XL system for high-throughput autonomous photochemistry optimization with dynamic sampling. | ||
A key feature of this system was a novel photoreactor that could maintain a low temperature while accessing all five light intensities (60–385 mW). For this, we worked with an external vendor to develop a novel temperature-controlled reactor (TCR) with cooling channels that decreased the number of wells from 96 to 48. This reactor achieved excellent temperature control at all five light intensity levels (Fig. 5).
Optimization search space
With the hardware and software components in place, and the reaction plateau mechanism better understood, the experimental search space was designed (Table 1). The goal of the optimization was to uncover process conditions that afforded rate acceleration while maintaining process stream stability. A wide variety of categorical input parameters were selected, including bromination reagents (two options), acid additives (eight options) and solvents (two options). The bromination reagents and solvents were represented through one hot encoding, while the acid additives were represented through feature encoding, where the reported first pKa values in water were used.26 Despite our understanding that the reaction would be executed in organic solvents, we reasoned that ranking the acids through their pKa measurements in water would still be an effective representation of relative acidity (Table 2). Three continuous parameters were included in the search space, including reagent equivalents, additive loading and reaction temperature. We hypothesized that reagent equivalents on the high end would lead to higher levels of side product 3, while additive loading and temperature would be positively correlated to rate acceleration. A discrete parameter was also included in the search pace, where five discrete light intensity stages were explored. The five intensity stages corresponded to light intensity measurements of 60, 125, 190, 255 and 385 mW per LED.| Input parameters | Range | Unit |
|---|---|---|
| Reagent | NBS, DBDMH | Reagent |
| Additive | 8 acids | Acid |
| Solvent | ACN, DMC | Solvent |
| Reagent equivalents | 1.0–1.5 | Molar equivalents |
| Additive loading | 1–25 | mol% |
| Rxn temperature | 5–35 | °C |
| Light intensity stage | 1, 2, 3, 4, 5 | Stage |
| Output parameters | Objective | Unit |
|---|---|---|
| LC area % product | Maximize | LCAP |
| Acid | pKa1 (H2O) |
|---|---|
| Hydrochloric acid (HCl) | −8.0 |
| Sulfuric acid (H2SO4) | −3.0 |
| 2-Picolinic acid | 1.0 |
| Phenylphosphonic acid (PPA) | 1.9 |
| Phosphoric acid (H3PO4) | 2.1 |
| DL-lactic acid | 3.9 |
| Acetic acid (HOAc) | 4.8 |
| Water (H2O) | 15.7 |
Finally, the search space was focused on a single optimization output, the UPLC area % of monobrominated product 2, measured at 210 nm wavelength. Our goal was to maximize the amount of desired product 2 while minimizing the amounts of starting material 1 and side product 3. Prior experiments revealed that the UPLC area % of product 2 correlated very well with the solution yield of product 2; thus, the analysis was limited to this output parameter measurement for simplicity (see ESI† for details).
Autonomous optimization experiments
After demonstrating excellent reproducibility under standard reaction conditions (see ESI† for details), three autonomous process optimization (APO) campaigns were commenced. Each campaign began from the same set of eight D-optimal seed experiments, where one acid additive was explored in each experiment under different combinations of the remaining parameter points. Each campaign included between 34 and 48 sequential iterations that were executed and profiled over two minute intervals. Experiments could not be parallelized due to equipment constraints. The optimized output parameter was the final area % of product 2 upon reaching the reaction plateau. In order to maximize diversity, the optimizer code was configured to switch to random sampling mode once the model failed to predict outcomes that exceeded the maximum final UPLC area % of product 2. Once the model generated improved predictions in light of these random evaluations, the optimizer code was configured to switch back to optimization mode.The first optimization campaign explored the implementation of a linear regression (LM) model based sequential optimization strategy with a predicted mean acquisition function and was executed for 46 iterations (Fig. 6). The second optimization campaign explored the implementation of a Gaussian process (GP) model based Bayesian optimization (BO) strategy with an expected improvement (EI) acquisition function and was executed for 34 iterations (Fig. 7). The third optimization campaign explored the implementation of a Gaussian process (GP) model based Bayesian optimization strategy (BO) with three alternating acquisition functions, including expected improvement (EI), probability of improvement (PI) and upper confidence bound (UCB). The final campaign was executed for 48 iterations (Fig. 8).
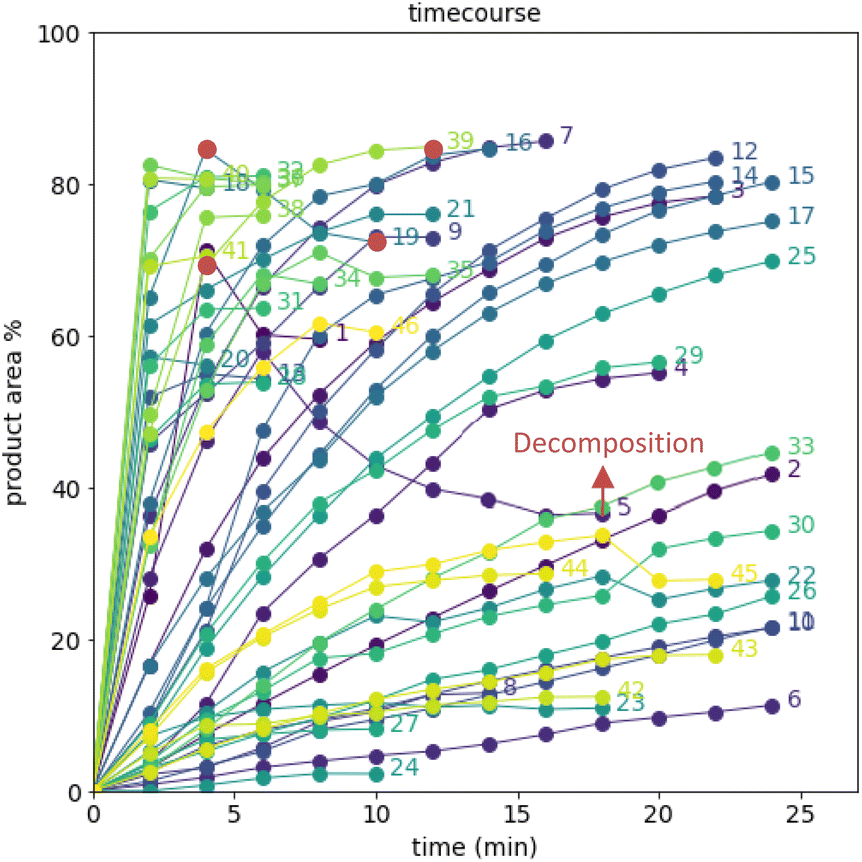 | ||
| Fig. 6 Reaction profiles of the first campaign with a linear regression model (LM) based optimization sampled with the predicted mean acquisition function. D-optimal design seed in rounds 1–8; random sampling in rounds 22–24, 26–27, 30–31, 33, 34, 33–36, 38–39, 42–46. Colored by round. | ||
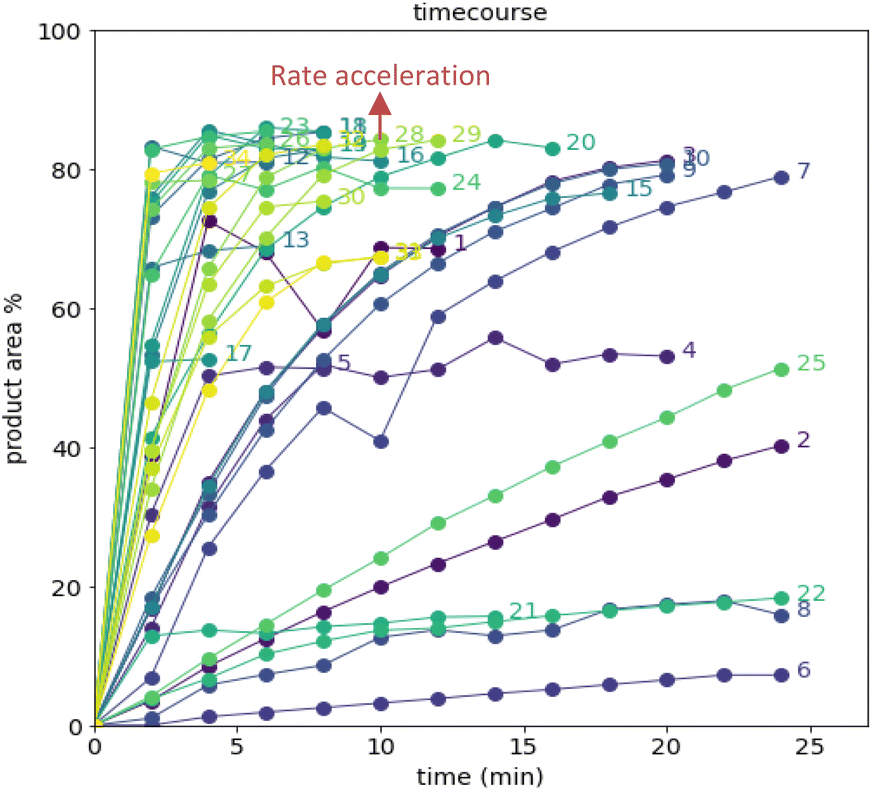 | ||
| Fig. 7 Reaction profiles of the second campaign with Gaussian process (GP) model-based Bayesian optimization (BO) sampled with the expected improvement (EI) acquisition function. D-optimal design seed in rounds 1–8. Colored by round. | ||
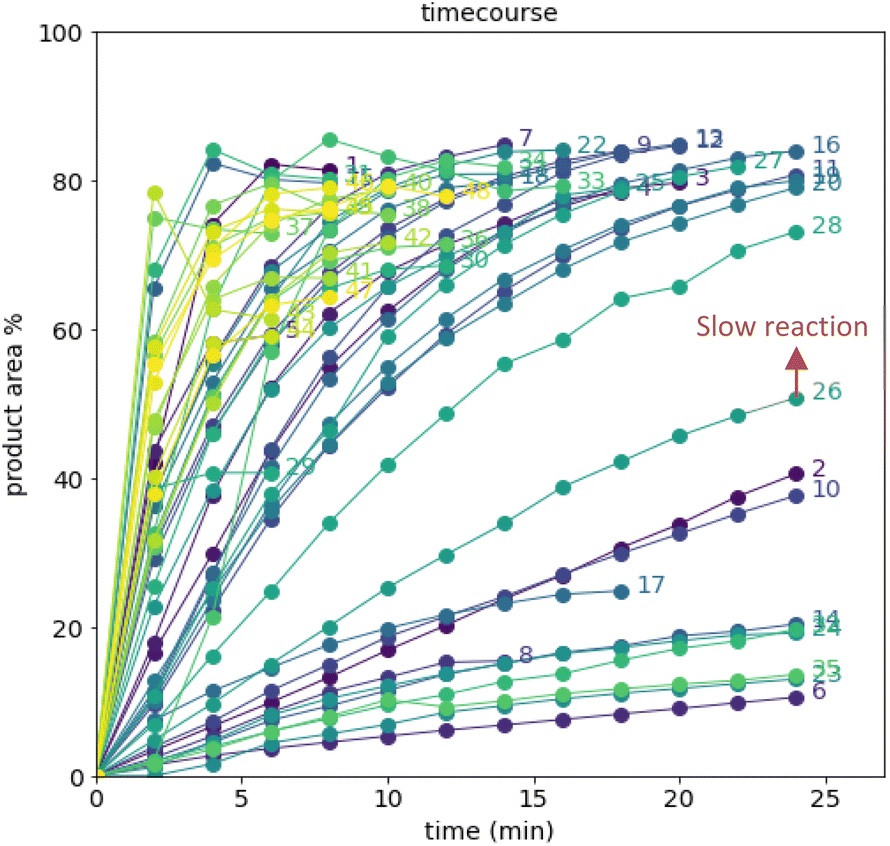 | ||
| Fig. 8 Reaction profiles of the third campaign with Gaussian process (GP) model-based Bayesian optimization (BO) sampled with alternating expected improvement (EI), probability of improvement (PI), and upper confidence bound (UCB) acquisition functions. D-optimal design seed in rounds 1–8; random sampling in round 10. Colored by round. | ||
The time course data reveals three general categories of kinetic profiles. In the first kinetic profile, excellent rate acceleration is observed, but this acceleration is accompanied by rapid decomposition after reaching a maximum product level (for example, plot 5 in Fig. 6). In the second kinetic profile, moderate and controlled rate acceleration is observed, resulting in moderate to high product formation (for example, plot 28 in Fig. 7). In the third kinetic profile, the reaction is slow and the plateau is reached at very low product levels (for example, plot 26 in Fig. 8). The ideal process would display the second kinetic profile, reaching a high level of product in a controlled fashion, with a low risk of decomposition. We observed that both BO campaigns converged to optima exhibiting the second kinetic profile category (Fig. 7 and 8), while the LM campaign did not appear to converge at all, but this can be mostly attributed to the optimizer code focusing on random sampling past iteration 21 (Fig. 6). These results, along with the virtual benchmarking studies provided in the ESI section,† indicate the implementation of a Gaussian process (GP) model-based Bayesian optimization approach (BO) as a superior optimization strategy.
Moreover, monitoring the reaction plateau and reporting the reaction outcome at the plateau point resulted in a much more meaningful comparison among the varied process conditions. Take, for example, the cases of iteration 19 and 39 in the first optimization campaign (plots 19 and 39 in Fig. 6, with their 4 minute and final samples colored red). If both iterations were sampled at 4 minutes, it would have appeared that 19 outperformed 39. Instead, sampling both iterations at their plateau points (10 minutes for 19 and 12 minutes for 39) revealed that, in fact, 39 significantly outperformed 19 upon reaction completion, because decomposition was observed in 19 after 4 minutes of reaction.
Although the time course data presented in Fig. 6 through Fig. 8 demonstrated the various kinetic profiles that could be observed in the photobromination reaction under study, additional visualizations that would provide deeper insights around local and global optima were still needed. Given that three categorical parameters were under evaluation, including reagent, additive and solvent, we hypothesized that multiple local optima were likely to exist. This certainly made the optimization more challenging. For multivariate data, we found the combined bar chart, line and scatter plot format to be the most informative data visualization technique (Fig. 9–11).
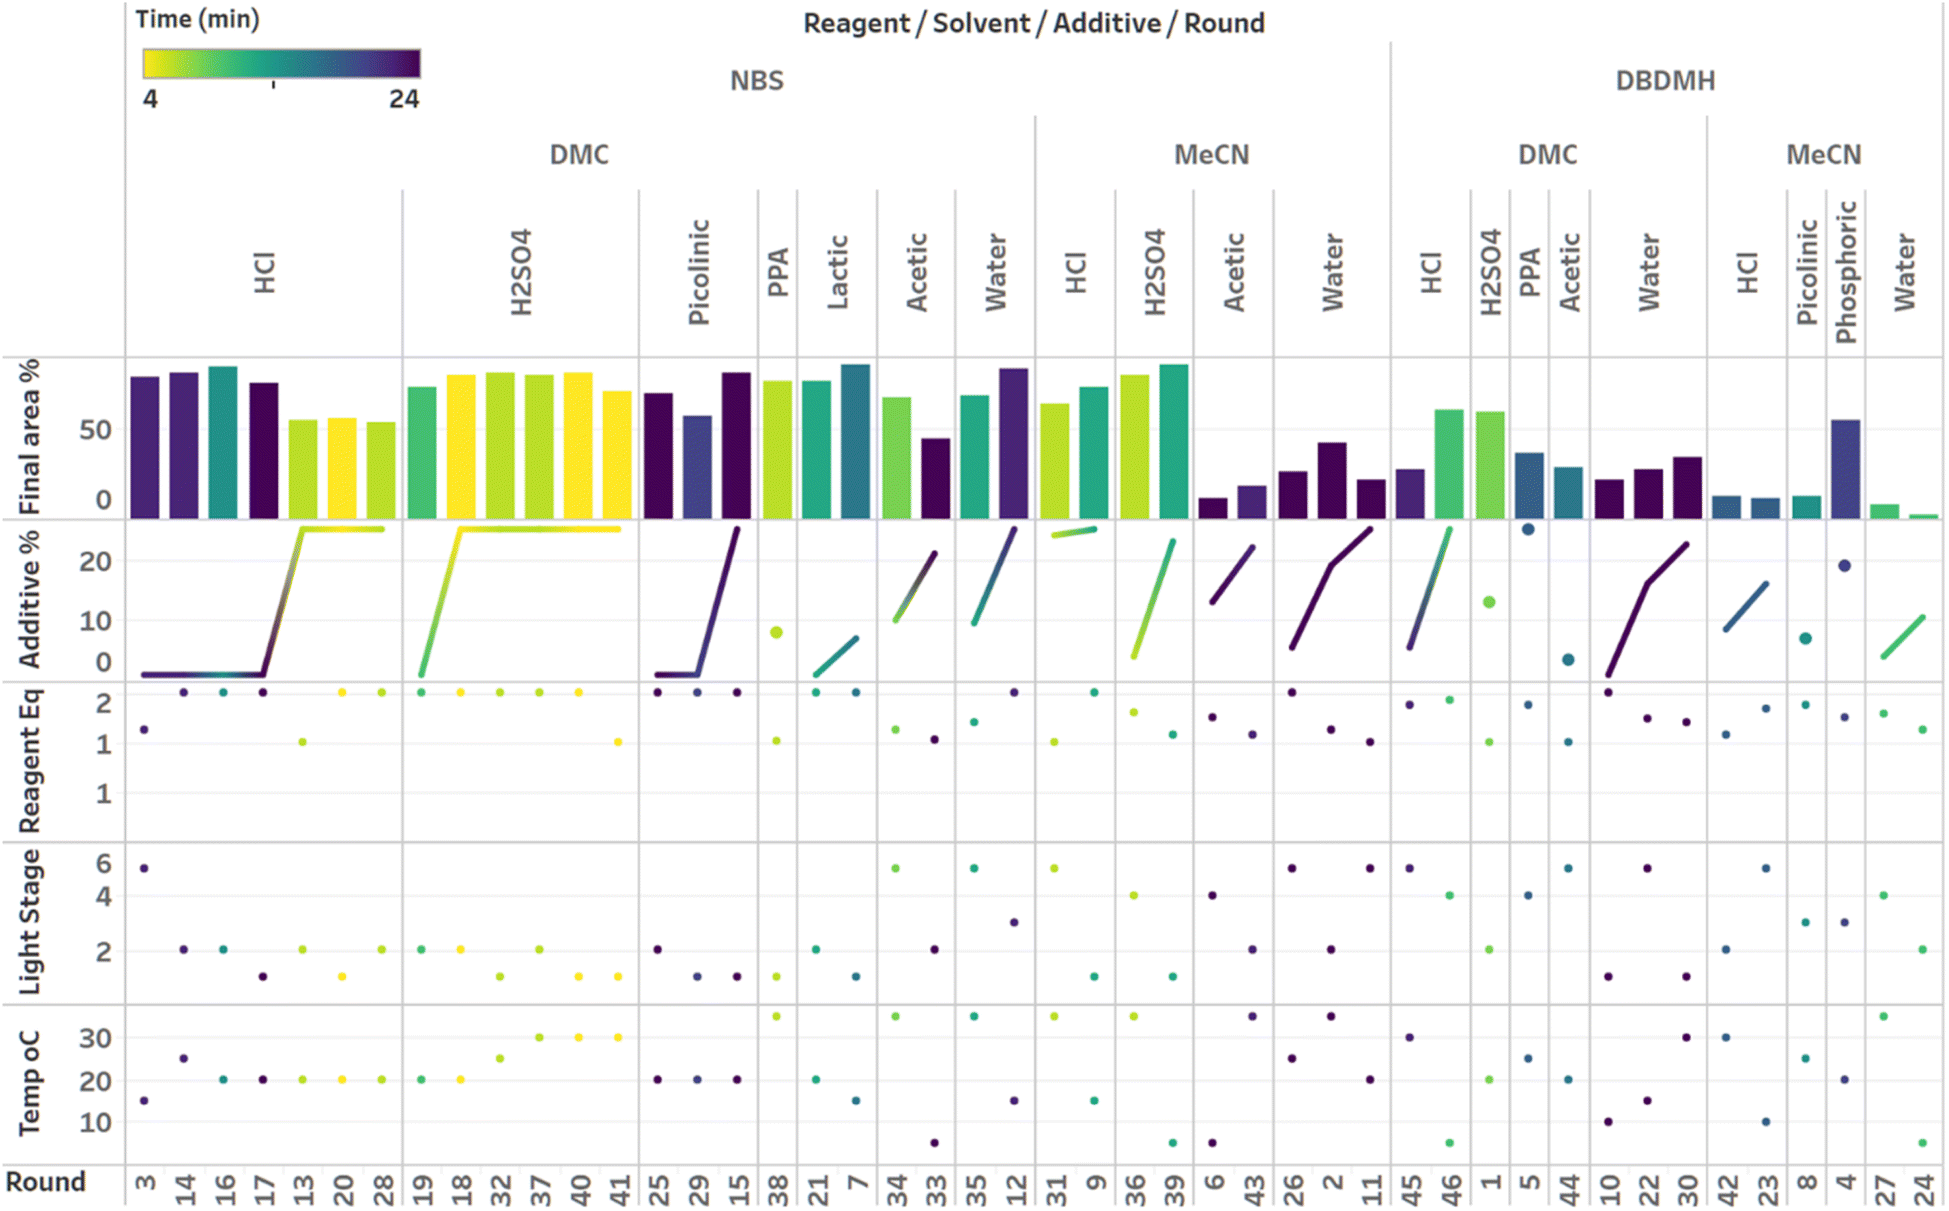 | ||
| Fig. 9 Visualization of the first campaign with a linear regression model (LM) based optimization sampled with the predicted mean acquisition function. Grouped by reagent, solvent, additive and round. Sorted by additive loading. Colored by plateau time. | ||
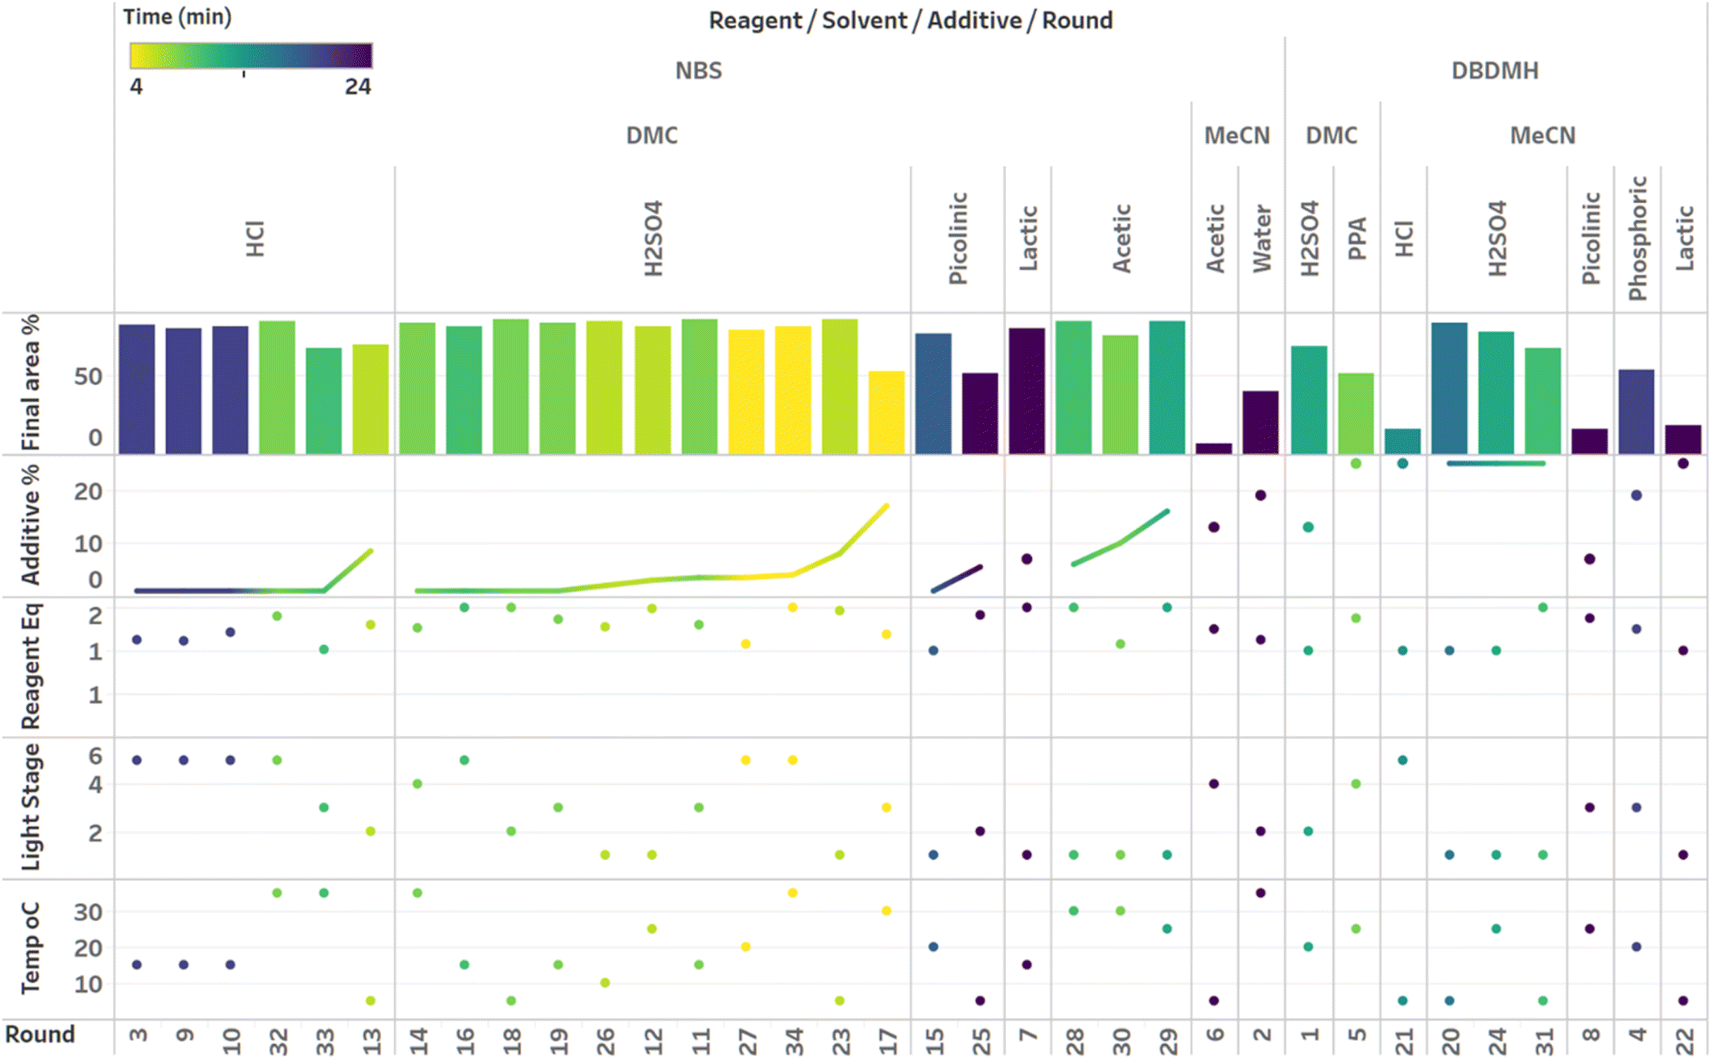 | ||
| Fig. 10 Visualization of the second campaign with Gaussian process (GP) model based Bayesian optimization (BO) sampled with the expected improvement (EI) acquisition function. Grouped by reagent, solvent, additive and round. Sorted by additive loading. Colored by plateau time. | ||
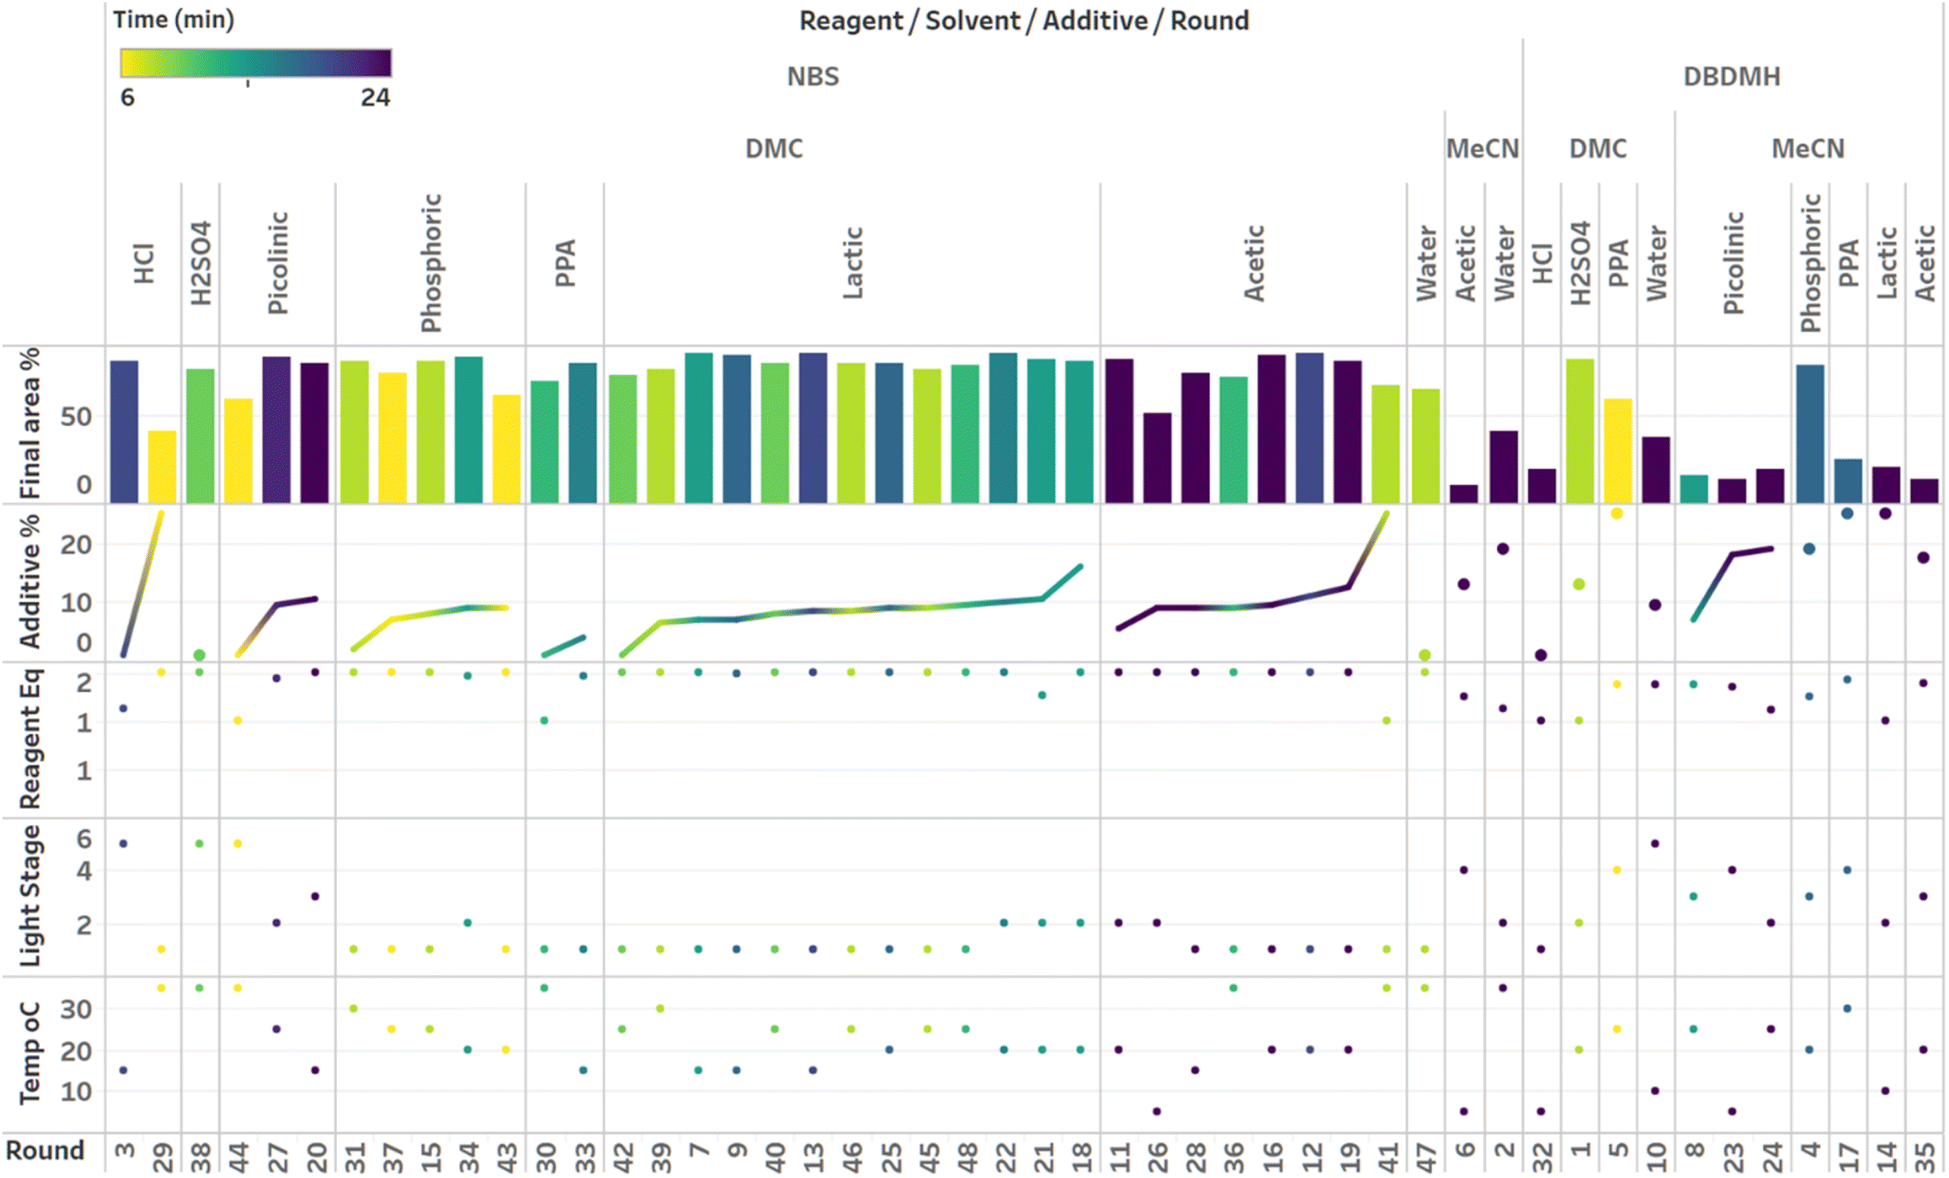 | ||
| Fig. 11 Visualization of the third campaign with Gaussian process (GP) model-based Bayesian optimization (BO) sampled with alternating expected improvement (EI), probability of improvement (PI), and upper confidence bound (UCB) acquisition functions. Grouped by reagent, solvent, additive and round. Sorted by additive loading. Colored by plateau time. | ||
Visualization of the multivariate data from first LM based optimization campaign demonstrates the importance of reagent, solvent and additive selection (Fig. 9). NBS outperformed DBDMH under a majority of conditions and DMC appeared to yield optimal results in combination with a broader selection of acid additives. The optimizer appeared to focus on HCl and H2SO4, which promoted significant rate acceleration, however the kinetic profiles with these additives aligned with the first category (decomposition after a maximum product level) at higher additive loadings. Visualization of the multivariate data from the second and third BO campaigns answered some of the questions that arose from the first campaign (Fig. 10 and 11). The second campaign also focused on HCl and H2O4 with NBS in DMC, with similar observations around decomposition under high loadings of these two additives. Here, acetic acid with NBS in DMC was sampled in higher detail, and this additive appeared to promote moderate rate acceleration to generate high product levels. The decomposition observed with the lower pKa acids (HCl and H2SO4) at higher loadings did not appear to be an issue with acetic acid. The third campaign shifted the focus from the lower to higher pKa acids, such as phosphoric, lactic, and acetic acid. This is likely because of the implementation of the UCB acquisition function, which was designed to explore unsampled regions of the parameter space, thus, it is not surprising that additional local optima were revealed with the implementation of this acquisition function. Although lactic acid promoted moderate rate acceleration, the reactions were still quite fast, reaching their plateaus within 8 and 20 minutes. What is preferred about lactic acid, from a process chemistry perspective, is the robustness in product purity levels observed across the entire sampled range, with minimal decomposition risk.
The autonomous process optimization experiments ultimately identified two optimal conditions for this process: (1) 1.5 equivalents NBS with 1.0 mol% H2SO4 in DMC, under a light intensity stage of 2 at 5 °C for 8 minutes (1) 1.5 equivalents NBS with 8.5 mol% lactic acid in DMC, under a light intensity stage of 1 at 15 °C for 20 minutes and, both resulting in the generation of 85 UPLC area % of product 2. The algorithmic optimization of a multivariate parameter space in tandem allowed for a broad variety of parameter combinations to be explored, unveiling two local optima, the latter displaying behavior more amenable to large scale processing.
Parameter importance modelling
Although the visual analyses presented up to this stage provided an understanding around categorical parameters such as reagent, solvent and additive, as well as some understanding around continuous parameter effects such as additive loading, the multivariate nature of the data made it difficult to measure individual continuous parameter effects. For this, we turned to Random Forest (RF) modeling, a machine learning technique that is especially effective in modeling categorical data.27When applied to the combined APO data, RF modeling was used to rank the influence of each parameter on the process outcome, as well as model the partial dependence of continuous parameters such as additive pKa and additive loading on predicted product 2 UPLC area % (Fig. 12). The ranking of parameter impacts aligned with our qualitative observations, where reagent, solvent, additive pKa and additive loading were determined to be most critical, while light intensity stage and temperature were determined to be less critical. The minimal impact of light intensity on reaction performance is not surprising because the Wohl–Ziegler bromination is proposed to proceed through a radical chain mechanism. In radical reactions with low quantum yields, light intensity can be a critical optimization parameter and should be investigated.28 The partial dependence plots of additive pKa and loading on predicted product 2 UPLC area % also aligned very well with our qualitative observations, where optimal performance with lower pKa additives was observed at lower loadings.
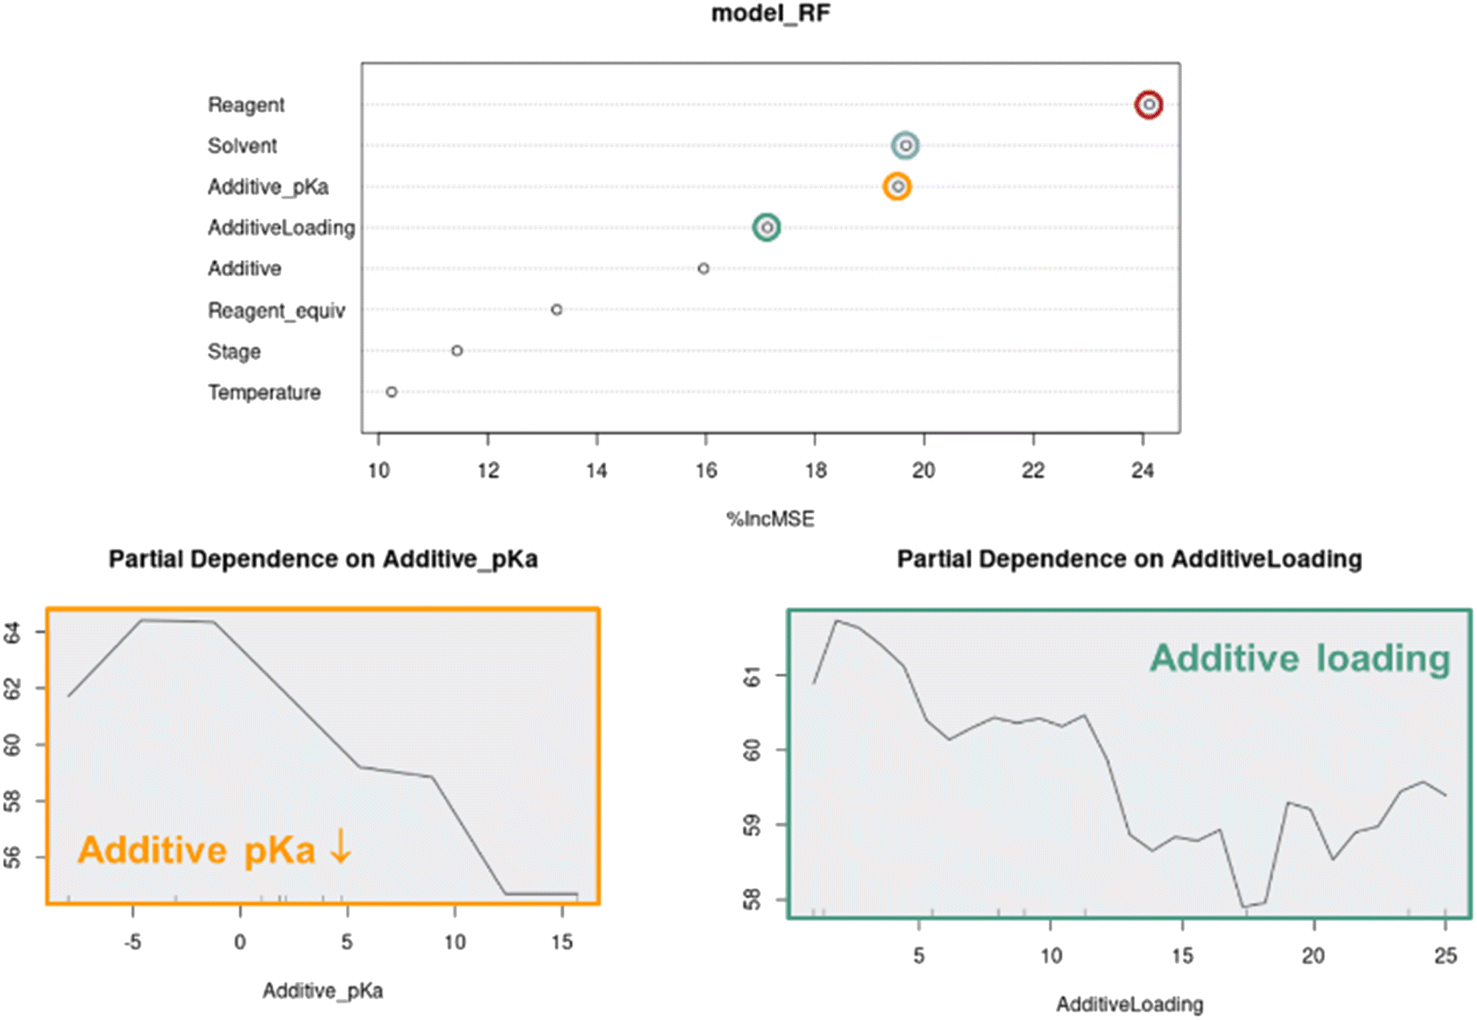 | ||
| Fig. 12 Random forest (RF) model of the combined autonomous optimization data ranking of parameter influences and partial dependence plots of predicted product 2 UPLC area % on additive pKa and loading. | ||
As multivariate optimization data sets become more complex, parameter importance modeling will become critical for the interpretation of APO data. The random forest feature importance scores are computed by permuting each feature and calculating the percent increase in mean squared error on the out-of-bag data. Although it can provide valuable insights on which features are more informative for the model prediction, we need to be cautious about the limitations that the feature importance ranking may be biased by many factors, such as overfitting, correlated features, imbalanced data, and categorical variables with more levels. The partial dependence plot provides a straightforward summary of the marginal effect of a feature on the outcome, but this average effect may also be biased in the presence of correlated features. Therefore, it is important to consider multiple model interpretation techniques in conjunction with domain knowledge to gain a comprehensive understanding of the input feature impacts. If resources allow, it is more rigorous to evaluate model generalizability or validate any scientific observation/hypothesis on prospective out-of-sample experimental data. In addition, we could have opted to rank parameter importance through the underlying linear and Gaussian process models, but decided a uniform modeling technique across all optimization campaigns, which leverage different modeling methods, would be more consistent.
Conclusions
In conclusion, we developed an autonomous process optimization (APO) system for the optimization of photochemical processes in batch microplate reactors with key reaction monitoring and real-time plateau detection capabilities. We applied this system to the optimization of a Wohl–Ziegler photobromination process. Even with a complex input parameter space including the combination of three categorical and three continuous parameters along with one discrete parameter, our optimization approach uncovered multiple local optima. It was critical to optimize multiple parameters in tandem, such as additive choice and additive loading, in order to identify conditions that balanced rate acceleration and decomposition.Our dynamic sampling strategy was key to the identification of three kinetic profiles associated with the process, which were largely influenced by reagent, solvent, additive, additive pKa, and additive loading, leading to the identification of decomposition-free conditions under high weak acid loadings or low strong acid loadings. Finally, the plateau detection capability allowed for reporting the process outcomes once process stream stability was reached, capturing accurate purity readings. As a bonus, the implementation of random forest (RF) modeling unveiled valuable process insights.
Future optimizations around processes with the propensity for decomposition will be more successful the development of algorithms capable of modeling time course data. The conclusions reached through visual inspection of the reaction profiles proved highly valuable and the incorporation of this valuable data in the automated decision-making process would significantly enhance future algorithmic process optimization efforts.
Data availability
The datasets supporting this article have been uploaded as part of the ESI† and the code is available at https://github.com/ekwan/zhulong.Author contributions
The project was led by Christensen M. under the guidance of Hein J. E. The high-throughput reaction profiling experiments, autonomous protocol development, robotic platform customization, photoreactor characterization, autonomous experimental execution, data analysis, data visualization and compound characterizations were carried out by Christensen M. The materials were synthesized by Fier P. S. and DiMaso M. J. The LED NMR studies were carried out by Ji Y. and Reibarkh M. The photoreactor development was carried out by Isom D. and Dabrowski M. from Analytical Sales in collaboration with Sun A. C. and Christensen M. The photoreactor integration was executed by Shay T. from Chemspeed Technologies in collaboration with Sun A. C. The Python interface code was developed by Kwan E. E. The optimization algorithms, plateau detection algorithms, optimization performance box plots, MDS trajectory analyses, optimization simulations and RF analyses were carried out by Xu Y. and Liaw A.Conflicts of interest
There are no conflicts to declare.Acknowledgements
The authors are grateful to the Defence Advanced Research Projects Agency (DARPA) for funding this project under the Accelerated Molecular Discovery Program (Cooperative Agreement No. HR00111920027, dated August 1, 2019). Additional financial support for this work was provided by the University of British Columbia, the Canada Foundation for Innovation (CFI-35883), and the Natural Sciences and Engineering Research Council of Canada (RGPIN-2021-03168, Discovery Accelerator Supplement). M. C. gratefully acknowledges the department of Process R&D at Merck & Co., Inc., Kenilworth, NJ, USA for student research support. The authors would also like to thank Rebecca T. Ruck and Kevin Stone for their assistance with the manuscript. The authors are grateful for Chemspeed Technologies and Analytical Sales for their assistance with the photoreactor development and integration.Notes and references
- R. Moorman, J. Frownfelter, S. Wretling, S. Price and S. Taraman, Intelligence-Based Medicine Artificial Intelligence and Human Cognition in Clinical Medicine and Healthcare, 2020, pp. 7–22 Search PubMed.
- B. J. Reizman and K. F. Jensen, Acc. Chem. Res., 2016, 49, 1786–1796 CrossRef CAS PubMed.
- D. C. Fabry, E. Sugiono and M. Rueping, React. Chem. Eng., 2016, 1, 129–133 RSC.
- F. Häse, L. M. Roch and A. Aspuru-Guzik, Trends Chem., 2019, 1, 282–291 CrossRef.
- C. Mateos, M. J. Nieves-Remacha and J. A. Rincón, React. Chem. Eng., 2019, 4, 1536–1544 RSC.
- C. W. Coley, N. S. Eyke and K. F. Jensen, Angew. Chem., Int. Ed., 2020, 59, 22858–22893 CrossRef CAS PubMed.
- C. W. Coley, N. S. Eyke and K. F. Jensen, Angew. Chem, Int. Ed., 2020, 59, 23414–23436 CrossRef CAS PubMed.
- F. Hutter, H. H. Hoos and K. Leyton-Brown, Learning and Intelligent Optimization, Springer, 2011, pp. 507–523 Search PubMed.
- W. Huyer and A. Neumaier, ACM Trans. Math. Softw., 2008, 35, 1–25 CrossRef.
- B. Shahriari, K. Swersky, Z. Wang, R. P. Adams and N. De Freitas, Proc. IEEE, 2016, 104, 148–175 Search PubMed.
- P. I. Frazier, A Tutorial on Bayesian Optimization, 2018 Search PubMed.
- F. Häse, M. Aldeghi, R. J. Hickman, L. M. Roch and A. Aspuru-Guzik, Appl. Phys. Rev., 2021, 8, 031406 Search PubMed.
- B. J. Shields, J. Stevens, J. Li, M. Parasram, F. Damani, J. I. M. Alvarado, J. M. Janey, R. P. Adams and A. G. Doyle, Nature, 2021, 590, 89–96 CrossRef CAS PubMed.
- Y. Wang, T. Y. Chen and D. G. Vlachos, J. Chem. Inf. Model., 2021, 61, 5312–5319 CrossRef CAS PubMed.
- F. Häse, L. M. Roch, C. Kreisbeck and A. Aspuru-Guzik, ACS Cent. Sci., 2018, 4, 1134–1145 CrossRef PubMed.
- M. Christensen, L. P. E. Yunker, F. Adedeji, F. Häse, L. M. Roch, T. Gensch, G. dos Passos Gomes, T. Zepel, M. S. Sigman, A. Aspuru-Guzik and J. E. Hein, Commun. Chem., 2021, 4, 1–12 Search PubMed.
- S. M. Mennen, C. Alhambra, C. L. Allen, M. Barberis, S. Berritt, T. A. Brandt, A. D. Campbell, J. Castanon, A. H. Cherney, M. Christensen, D. B. Damon, J. Eugenio de Diego, S. García-Cerrada, P. Garcia-Losada, R. Haro, J. M. Janey, D. C. Leitch, L. Li, F. Liu, P. C. Lobben, D. W. C. MacMillan, J. Magano, E. L. McInturff, S. Monfette, R. J. Post, D. M. Schultz, B. J. Sitter, J. M. Stevens, I. I. Strambeanu, J. Twilton, K. Wang and M. A. Zajac, Org. Process Res. Dev., 2019, 23, 1213–1242 CrossRef CAS.
- R. Grainger and S. Whibley, Org. Process Res. Dev., 2021, 25, 354–364 CrossRef CAS.
- M. Shevlin, ACS Med. Chem. Lett., 2017, 8, 601–607 CrossRef CAS PubMed.
- S. W. Krska, D. A. DiRocco, S. D. Dreher and M. Shevlin, Acc. Chem. Res., 2017, 50, 2976–2985 CrossRef CAS PubMed.
- Y. Ji, C. Bottecchia, F. Lévesque, K. Narsimhan, D. Lehnherr, J. P. McMullen, S. M. Dalby, K.-J. Xiao and M. Reibarkh, J. Org. Chem., 2021, 87, 2055–2062 CrossRef PubMed.
- C. Bottecchia, F. Lévesque, J. P. McMullen, Y. Ji, M. Reibarkh, F. Peng, L. Tan, G. Spencer, J. Nappi, D. Lehnherr, K. Narsimhan, M. K. Wismer, L. Chen, Y. Lin and S. M. Dalby, Org. Process Res. Dev., 2022, 26, 516–524 CrossRef CAS.
- D. Lehnherr, Y. Ji, A. J. Neel, R. D. Cohen, A. P. J. Brunskill, J. Yang and M. Reibarkh, J. Am. Chem. Soc., 2018, 140, 13843–13853 CrossRef CAS PubMed.
- Y. Ji, D. A. DiRocco, C. M. Hong, M. K. Wismer and M. Reibarkh, Org. Lett., 2018, 20, 2156–2159 CrossRef CAS PubMed.
- Y. Ji, D. A. DiRocco, J. Kind, C. M. Thiele, R. M. Gschwind and M. Reibarkh, ChemPhotoChem, 2019, 3, 984–992 CrossRef CAS.
- Bordwell pKa Table, https://organicchemistrydata.org/hansreich/resources/pka/#pka_general.
- D. T. Ahneman, J. G. Estrada, S. Lin, S. D. Dreher and A. G. Doyle, Science, 2018, 360, 186–190 CrossRef CAS PubMed.
- E. B. Corcoran, J. P. McMullen, F. Lévesque, M. K. Wismer and J. R. Naber, Angew. Chem., Int. Ed., 2020, 59, 11964–11968 CrossRef CAS PubMed.
Footnote |
| † Electronic supplementary information (ESI) available. See DOI: https://doi.org/10.1039/d3sc06884f |
| This journal is © The Royal Society of Chemistry 2024 |