
 Open Access Article
 This Open Access Article is licensed under a Creative Commons Attribution-Non Commercial 3.0 Unported Licence
Dynamic surface reconstruction of individual gold nanoclusters by using a co-reactant enables color-tunable electrochemiluminescence†
Yan-Mei
Lei
ab,
Di
Wu
c,
Mei-Chen
Pan
a,
Xiu-Li
Tao
a,
Wei-Jia
Zeng
a,
Li-Yong
Gan
 c,
Ya-Qin
Chai
a,
Ruo
Yuan
a and
Ying
Zhuo
*a
c,
Ya-Qin
Chai
a,
Ruo
Yuan
a and
Ying
Zhuo
*a
aKey Laboratory of Luminescence Analysis and Molecular Sensing (Southwest University), Ministry of Education, College of Chemistry and Chemical Engineering, Southwest University, Chongqing 400715, China. E-mail: yingzhuo@swu.edu.cn
bInstitute of Molecular Medicine, Renji Hospital, School of Medicine, Shanghai Jiao Tong University, Shanghai, 200127, China
cCollege of Physics and Center of Quantum Materials and Devices, Chongqing University, Chongqing, 401331, China
First published on 16th January 2024
Abstract
Here we report for the first time the phenomenon of continuously color-tunable electrochemiluminescence (ECL) from individual gold nanoclusters (Au NCs) confined in a porous hydrogel matrix by adjusting the concentration of the co-reactant. Specifically, the hydrogel-confined Au NCs exhibit strong dual-color ECL in an aqueous solution with triethylamine (TEA) as a co-reactant, with a record-breaking quantum yield of 95%. Unlike previously reported Au NCs, the ECL origin of the hydrogel-confined Au NCs is related to both the Au(0) kernel and the Au(I)–S surface. Surprisingly, the surface-related ECL of Au NCs exhibits a wide color-tunable range of 625–829 nm, but the core-related ECL remains constant at 489 nm. Theoretical and experimental studies demonstrate that the color-tunable ECL is caused by the dynamic surface reconstruction of Au NCs and TEA radicals. This work opens up new avenues for dynamically manipulating the ECL spectra of core–shell emitters in biosensing and imaging research.
Introduction
Gold nanoclusters (Au NCs) have recently become one of the most promising electrochemiluminescent (ECL) materials because of their excellent biocompatibility, high photostability, and fascinating molecular-like physicochemical features.1–3 The structure of Au NCs typically comprises an exterior Au(I)-ligand motif and an interior Au(0) kernel.4–6 So far, many strategies have been widely applied to modulate the ECL intensity and wavelength of Au NCs, which can be mainly classified into two approaches: (i) associated with the Au(0) kernel, such as modifying the kernel size and alloying the kernel with heteroatoms;7,8 (ii) associated with the surface Au(I)-ligand motifs, such as aggregation-induced emission (AIE) and host–guest recognition.9,10 The primary distinction between these two techniques is that the optical characteristics of the exterior Au(I)-ligand motif may be controlled continuously and easily, but the effects of the internal Au(0) kernel are discrete and difficult to regulate conveniently.11 Therefore, surface engineering of Au NCs has been widely accepted as an efficient way of manipulating their ECL characteristics.Although surface engineering has been a significant breakthrough in the research on ECL enhancement of Au NCs,9,12 it is still extremely challenging to dynamically regulate their ECL wavelength in practical applications. The following are the key causes: (i) numerous Au NCs exhibit extremely low ECL efficiency in an aqueous medium;12–14 (ii) the impact of the Au(I)-ligand motif and the Au(0) kernel on the ECL intensity and wavelength has not been fully revealed;7,8,15 (iii) the interior compact accumulation of the AIE products makes responding to fluctuations in the microenvironment difficult;10,16 (iv) discrete Au NCs are easily aggregated to produce uncertain excited state emission.17–19 Fortunately, our group recently developed a “spatial confinement-enhanced ECL” strategy for improving luminous efficiency by localizing emitters into the porous matrix, which not only restricts the structural vibration of emitters but also accelerates mass transport and electron transfer within confined pore channels.20,21 Therefore, confining Au NCs within the porous matrix probably provides an exclusive opportunity for customizing Au NCs with ultrabright and color-tunable ECL.
Here we report the first example of co-reactant-modulated ECL color from individual Au NCs confined in a porous hydrogel matrix. Specifically, the hydrogel-confined Au NCs exhibit strong dual-color ECL (with a record-breaking quantum yield of 95%) using triethylamine (TEA) as a co-reactant in an aqueous solution. Unlike previously reported Au NCs predominated by either core- or surface-related emission, the ECL origin of these Au NCs is related to both the Au(0) kernel and the Au(I)–S surface. Interestingly, when the TEA concentration changes, the surface-related ECL of Au NCs shows a continuous color-tunable ECL spanning 625–829 nm, whereas the core-related ECL remains constant at 489 nm. Mechanistic studies demonstrated that the color-tunable ECL property originates from the dynamic surface reconstruction of Au NCs and TEA radicals (TEA˙). This study presents new approaches for dynamically modulating the ECL spectrum of core–shell emitters in biosensing and imaging research.
Results and discussion
The fabrication process of hydrogel-confined Au NCs is illustrated in Fig. 1A and detailed in Scheme S1.† The chitosan hydrogel was initially crosslinked and functionalized with glutaraldehyde to produce a superabsorbent hydrogel. Scanning electron microscopy (SEM) images confirm that the superabsorbent hydrogel possesses abundant pore channels (Fig. 1B), which can provide confined spaces to entrap the reaction reagent. The porous hydrogel matrix was then modified with glutathione (SG) via the Schiff's base reaction, in which SG acted as both a ligand and a reducing reagent for Au NC generation under alkaline conditions. As shown in Fig. S1,† the zeta potential of the SG-functionalized hydrogel (19.8 mV) is substantially lower than that of a hydrogel (46.2 mV), showing that the negatively charged SG is strongly anchored inside the positively charged hydrogel matrix. Transmission electron microscopy (TEM) and high-resolution TEM (HR-TEM) images (Fig. 1C–E) show monodispersed Au NCs embedded inside the hydrogel matrix with an average size of 1.37 nm (Fig. 1F). A closer examination using HR-TEM revealed that the surface of the Au NCs had a characteristic fracture (Fig. S2A†), indicating the existence of surface defects. Furthermore, lattice fringes may be seen in Au NCs with a plane spacing of 0.232 nm (the inset of Fig. S2A†), which is equivalent to the (111) lattice spacing of face-centered cubic (fcc) Au.22 The concentric rings in the selected area electron diffraction patterns (Fig. S2B†) indicated that the Au NCs were polycrystalline. The energy-dispersive X-ray element analysis confirmed the Au NC stoichiometry with an Au/S ratio of 1.07![[thin space (1/6-em)]](https://www.rsc.org/images/entities/char_2009.gif) :1.00 (Fig. S3†), revealing that these Au NCs were formed via –Au–SR– repeated bondings.23 High-resolution X-ray photoelectron spectrometry shows two intense peaks (Fig. 1G) at 83.8 eV (Au 4f7/2) and 87.7 eV (Au 4f5/2) of Au NCs that are consistent with the presence of both Au (0) and Au(I) oxidation states.24 TEM-energy-dispersive X-ray (EDX) mapping analysis (Fig. 1H) demonstrates the uniform dispersion of Au, S, and O elements across the whole hydrogel matrix.
:1.00 (Fig. S3†), revealing that these Au NCs were formed via –Au–SR– repeated bondings.23 High-resolution X-ray photoelectron spectrometry shows two intense peaks (Fig. 1G) at 83.8 eV (Au 4f7/2) and 87.7 eV (Au 4f5/2) of Au NCs that are consistent with the presence of both Au (0) and Au(I) oxidation states.24 TEM-energy-dispersive X-ray (EDX) mapping analysis (Fig. 1H) demonstrates the uniform dispersion of Au, S, and O elements across the whole hydrogel matrix.
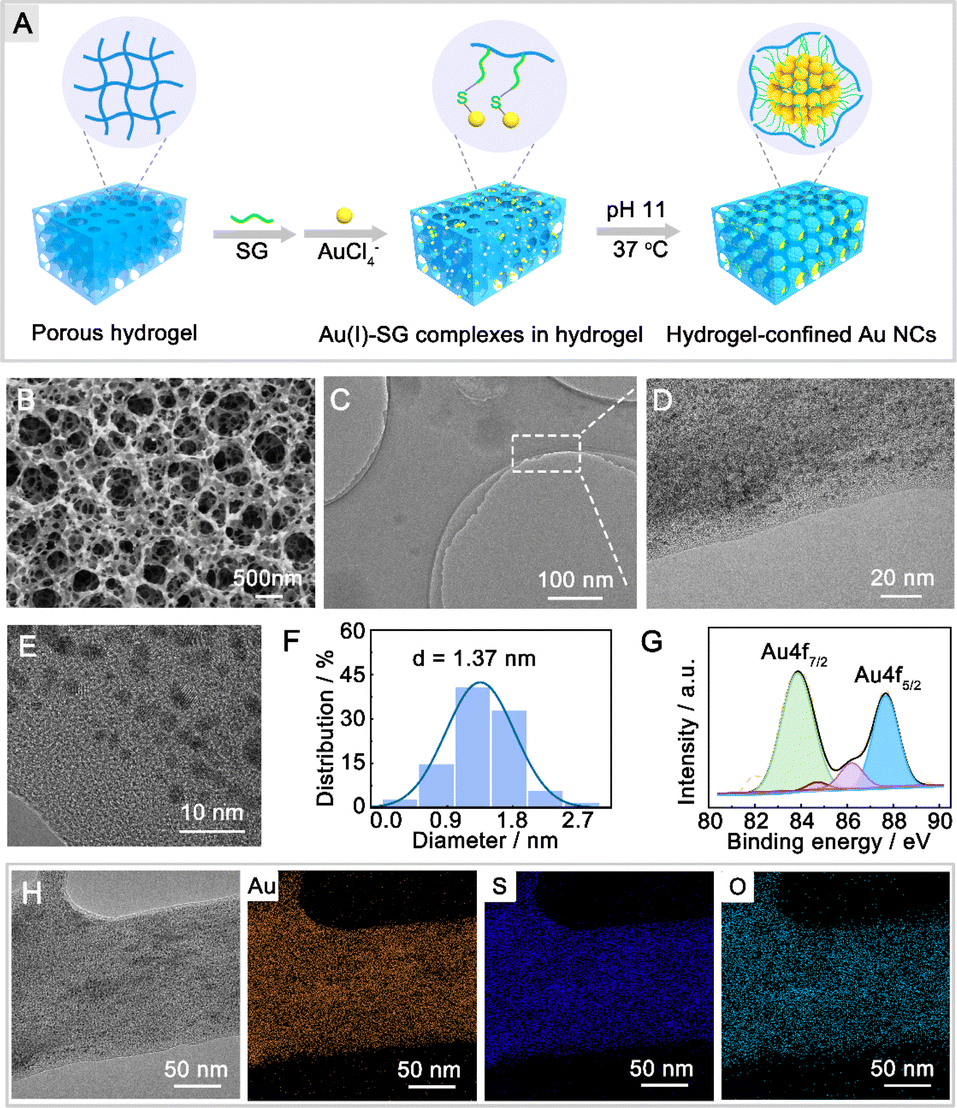 | ||
| Fig. 1 Fabrication and characterization of hydrogel-confined Au NCs. (A) Workflow for fabricating hydrogel-confined Au NCs by the “spatial confinement” strategy. (B) SEM image of the superabsorbent hydrogel obtained by cross-linking a chitosan hydrogel and glutaraldehyde. (C) TEM, (D and E) HR-TEM images of hydrogel-confined Au NCs. (F) Size distribution and (G) high-resolution X-ray photoelectron spectrometry analysis of Au NCs within the hydrogel. (H) TEM-EDX mappings of Au, S, and O of hydrogel-confined Au NCs. | ||
The optical characteristics of hydrogel-confined Au NCs, discrete Au NCs, and the mixture of Au NCs and the hydrogel were compared using UV-vis absorption, photoluminescence (PL), and PL decay measurements. The hydrogel-confined Au NCs exhibited an intense blue-green color (Fig. 2A inset) with a PL peak at 488 nm (Fig. 2A, green line). In contrast, the discrete Au NCs are easily precipitated out of the supernatant and emit an intense red light (inset of Fig. 2B) with two PL peaks at 480 and 639 nm (Fig. 2B, green line). These comparison results revealed discrete Au NCs with an AIE effect.25,26 Upon the addition of a hydrogel, the Au NCs are evenly distributed and emit an intense pink light (inset of Fig. 2C) with a strong PL peak at 488 nm and a minor PL peak at 639 nm (Fig. 2C, green line). These findings revealed that the hydrogel matrix inhibited the aggregation of discrete Au NCs, weakening the AIE effect.19 Furthermore, the PL excitation (PLE) spectra (Fig. 2A–C, blue line) of the three samples almost match the prominent maxima in the absorption spectra (Fig. 2A–C, purple line). These results indicated that these nanoclusters contain a consistent number of atoms, corresponding to the ground-state absorption energy of Au12–15SG12–13 species.27,28 Additionally, the precise chemical composition of Au NCs confined in a hydrogel matrix was further determined to be Au12–15SG12–13 species using mass spectra measurement (Fig. S4†). The PL lifetime of hydrogel-confined Au NCs is 2.4 ns (Fig. 2D, green line), corresponding to single excited states (S1).25 In contrast, the PL decay of discrete Au NCs is 92.9 ns (Fig. 2D, purple line), which is consistent with the triplet excited states (T1) in ligand–metal charge transfer behavior caused by the AIE effect.29 The lifetime of Au NCs is 10.4 ns in the presence of a hydrogel (Fig. 2D, blue line), which is shorter than that of discrete Au NCs (92.9 ns) due to the weakened AIE effect of Au NCs.30Fig. 2E and 2F depict the kernel-emission model and summarize the relaxation diagram of hydrogel-confined Au NCs and discrete Au NCs.6,19 The photophysical processes of discrete Au NCs occur in the following sequence (Fig. 2E): the S0 → Sn (n ≥ 1) of light absorption; the fast Sn → S1 of the internal conversion (IC); starting from S1, the radiative decay of S1 → S0 (core transition) and/or the intersystem crossing (ISC) to T1; finally, the radiative and nonradiative decays of T1 → S0 (core–shell transition). For hydrogel-confined Au NCs (Fig. 2F), the suppressed ISC of S1 → T1 is the key to achieving high-efficiency S1 → T0 luminescence. Collectively, the long-wavelength emission of hydrogel-confined Au NCs disappears completely, demonstrating that these Au NCs are individually dispersed in the porous hydrogel matrix.
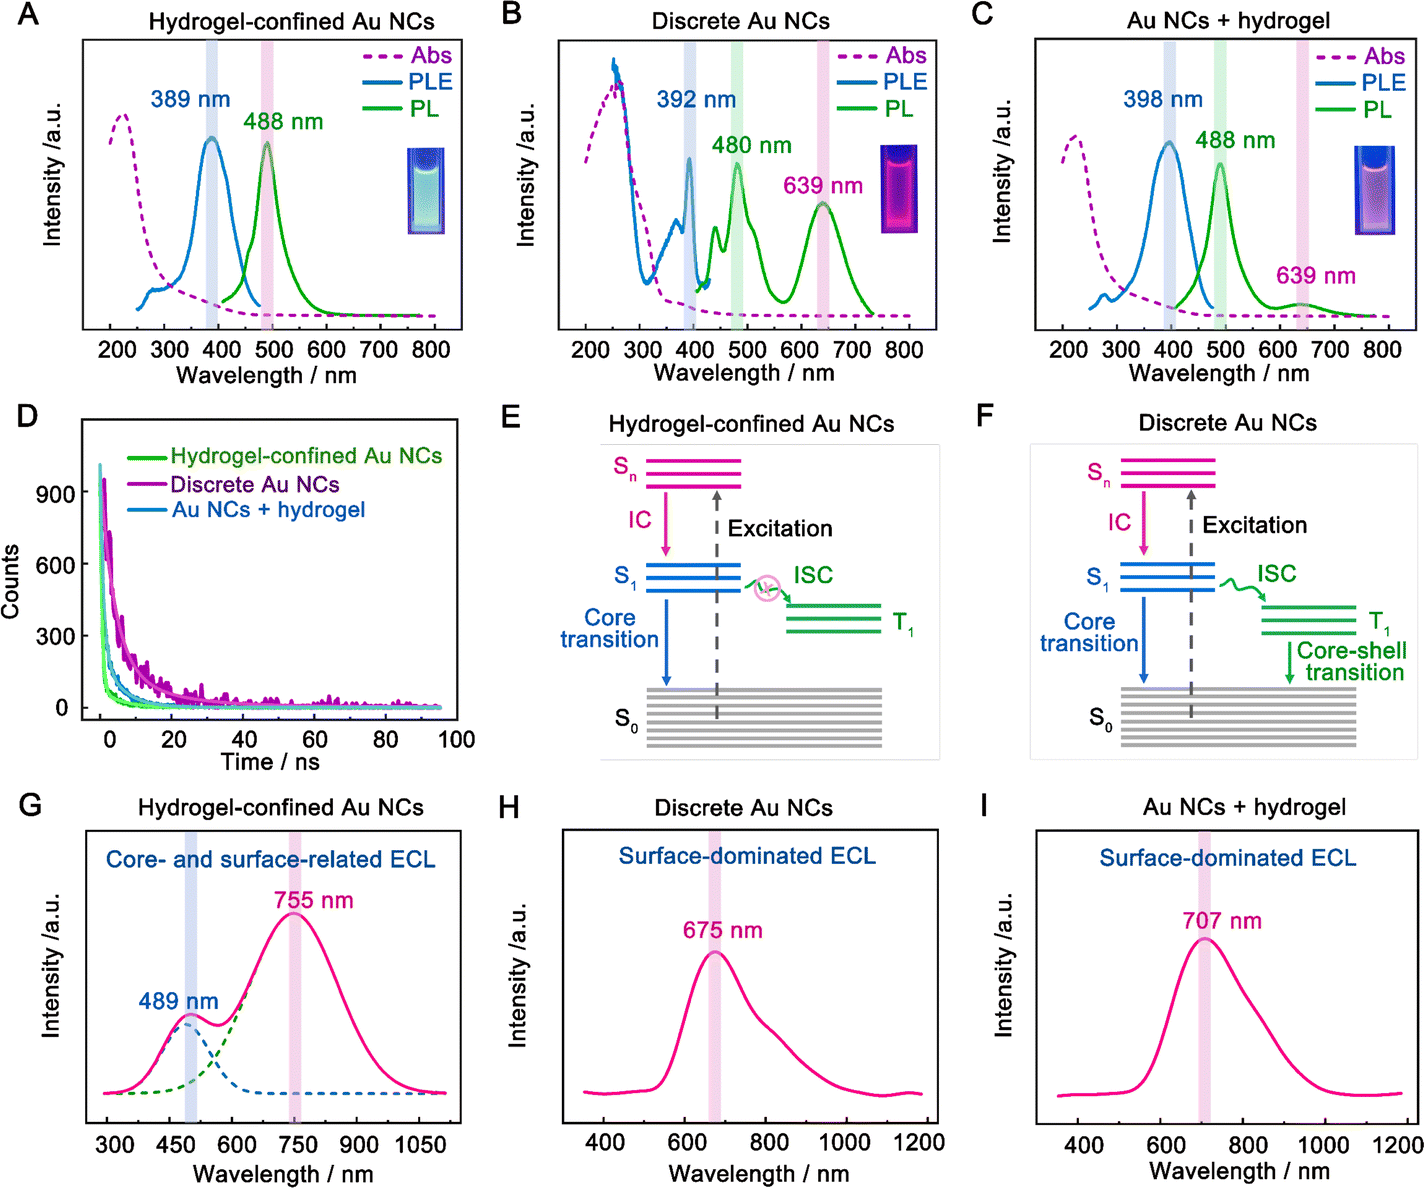 | ||
| Fig. 2 Optical characterization of hydrogel-confined Au NCs. UV-vis absorption (purple line), PLE (blue line), and PL (green line) spectra of (A) hydrogel-confined Au NCs, (B) discrete Au NCs, and (C) the mixture of Au NCs and the hydrogel. (D) PL decay profiles of hydrogel-confined Au NCs, discrete Au NCs, and the mixture of Au NCs and the hydrogel. Schematic diagram of the excited state relaxation dynamics of (E) hydrogel-confined Au NCs and (F) discrete Au NCs. S0 ground state, S1 lowest singlet state, Sn high singlet state, T1 lowest triplet state, IC internal conversion, and ISC intersystem crossing. ECL spectra of (G) hydrogel-confined Au NCs, (H) discrete Au NCs and (I) the mixture of Au NCs and the hydrogel obtained by scanning from 0 to 1.5 V in 0.1 M PBS (pH 7.4) solution with 50 mM TEA as the co-reactant. | ||
The ECL spectra of three samples were further recorded with TEA as a co-reactant in an aqueous solution. Before the experiment, we demonstrated that the hydrogel functioned as a support rather than a co-reactant, such as TEA (Fig. S5†). Additionally, we found that the hydrogel-confined Au NCs displayed excellent stability and repeatability in ECL by adjusting factors such as storage time, consecutive cycling scan, parallel scan, and pulse potential measurements (Fig. S6–S9†). The hydrogel-confined Au NCs exhibit strong dual-color ECL with distinct Gaussian curve maxima at 489 and 755 nm (Fig. 2G), suggesting two distinct excited states in the ECL process. As compared to their PL peak, the ECL peak at 755 nm was dramatically redshifted, corresponding to the surface-related transition of Au NCs;31 however, the ECL peak at 489 nm was almost similar to their PL peak, corresponding to the core-related transition of Au NCs.32 The ECL quantum yield (ΦECL) of hydrogel-confined Au NCs with TEA as a co-reactant was assessed by comparing it to the benchmark ECL emitter of [Ru(py)3]2+. The ΦECL of hydrogel-confined Au NCs was calculated to be 95%, breaking the current highest record of pre-oxidation (66%) and the RIM effect of Au NCs (78%) in an aqueous medium (Table 1).12,14 This boosted ECL phenomenon could be attributed to the “spatial confinement-enhanced ECL” effect.20 In contrast, only a red-shifted ECL peak is observed in both discrete Au NCs (675 nm, Fig. 2H) and the mixture of Au NCs and the hydrogel (707 nm, Fig. 2I), which is ascribed to the surface-related transition of Au NCs. As far as we know, this is the first example of strong dual-color ECL from Au NCs. It allows us to investigate their ECL mechanism at the single-cluster level, going beyond typical NCs at the population level.
To investigate the dual-color ECL mechanism of hydrogel-confined Au NCs, the ECL and cyclic voltammogram (CV) curves were recorded in 0.1 M PBS (pH 7.4) solution with and without TEA as a co-reactant. In the presence of TEA, two prominent ECL peaks of P1 (3791 a.u.) at 0.78 V and P2 (4560 a.u.) at 1.50 V are observed upon anodic scanning, and a weak ECL peak of P3 (623 a.u.) at 0.78 V is found upon reversal of the applied potential (Fig. 3A, green line), indicating the presence of many reaction processes in the ECL emission.7 Meanwhile, their CV curve displayed the onset oxidation potential at 0.60 V and the oxidation peak potential at 1.07 V (Fig. 3A, blue line), corresponding to the oxidation of TEA.33 In contrast, almost no ECL signal (Fig. 3B, green line) and redox peak (Fig. 3B, blue line) are observed in the absence of TEA. These findings showed that the co-reactant TEA was electro-oxidized to a highly reducing agent (TEA˙), which then interacted with the cationic radicals of Au NCs to emit intense light. Furthermore, the spooling ECL spectra of the hydrogel-confined Au NCs/TEA system exhibit dual-color ECL at 489 nm and 755 nm throughout the potential window (Fig. 3C). Interestingly, the ECL peaks at 0.78 V (Fig. 3C, curve a; anodic scanning), 1.50 V (Fig. 3C, curve b), and 0.78 V (Fig. 3C, curve c; cathodic scanning) are 489 nm, 755 nm, and 489 nm, respectively. Together, these comparison results demonstrated that the P1 peak and P3 peak were dominated by core-related ECL, while the P2 peak was dominated by surface-related ECL.
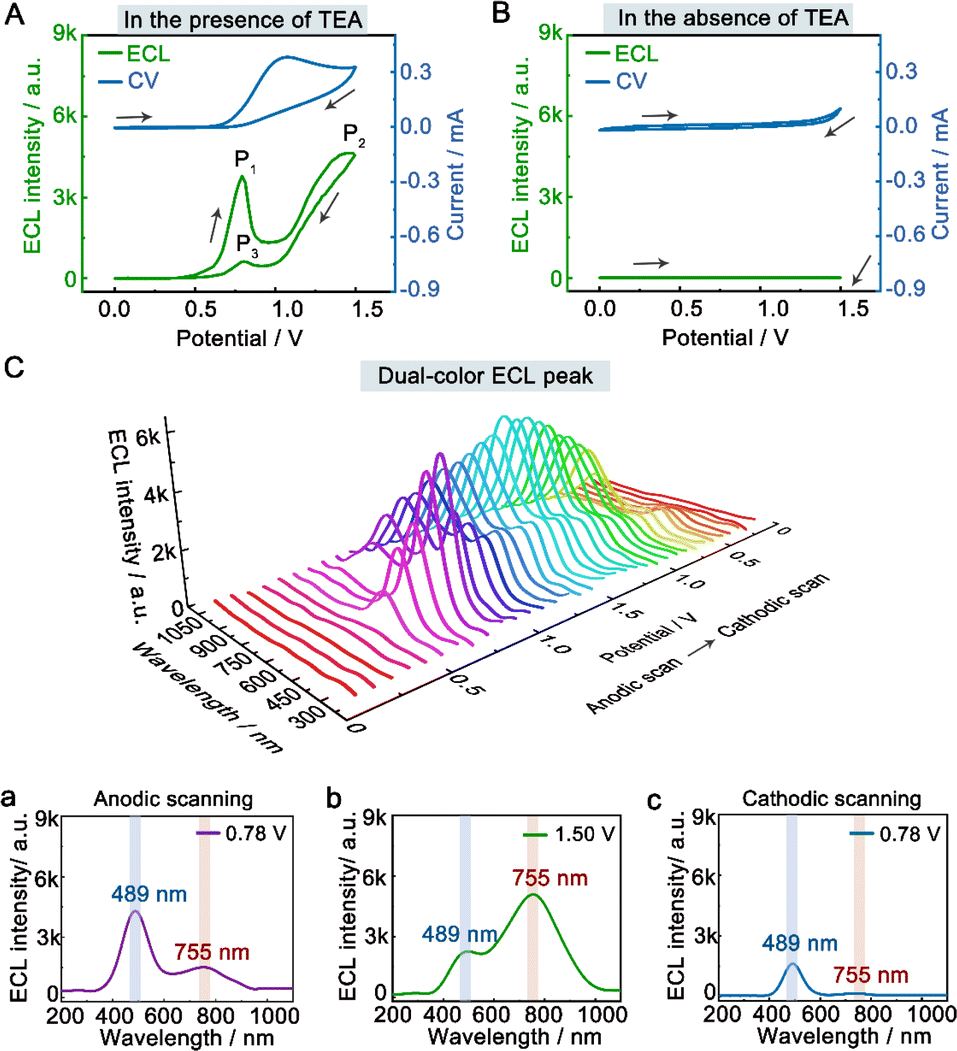 | ||
| Fig. 3 Dual-color ECL mechanism of hydrogel-confined Au NCs. ECL-voltage (green line) and CV (blue line) curves of hydrogel-confined Au NCs recorded by scanning from 0 to 1.5 V in 0.1 M PBS (pH 7.4) solution (A) with 50 mM TEA as the co-reactant and (B) without TEA, respectively. (C) Spooling ECL spectra of hydrogel-confined Au NCs recorded in 0.1 M PBS (pH 7.4) solution with 50 mM TEA as the co-reactant. The 2D ECL spectra were obtained at (a) 0.78 V (anodic scanning), (b) 1.50 V, and (c) 0.78 V (cathodic scanning), respectively. | ||
The ECL spectra of the hydrogel-confined Au NCs were further collected by varying the TEA concentration. Surprisingly, the ECL peak of surface-related ECL is continuously tuned from 625 to 829 nm, but the ECL peak of core-related ECL remained constant at 489 nm (Fig. 4A). Furthermore, the linear relationships of the ECL wavelengths of surface-related ECL (λsurface) and core-related ECL (λcore) to the logarithmic value of TEA concentration (lgc) are expressed as λsurface = 139.1 lgc + 514.9 (Fig. 4B, green line) and λcore = 489 (Fig. 4B, blue line), respectively. Furthermore, the ECL intensity features are observed from the surface-related (Fig. 4C, green line) and core-related (Fig. 4C, blue line) transitions of Au NCs. Collectively, by adjusting the TEA concentration, these Au NCs enable surface-related ECL with color- and brightness-tunable emission from 625 to 829 nm and core-related ECL with solely brightness-tunable emission at 489 nm. Nevertheless, it remains a mystery how TEA interacts with Au NCs to modulate surface-related ECL wavelengths.
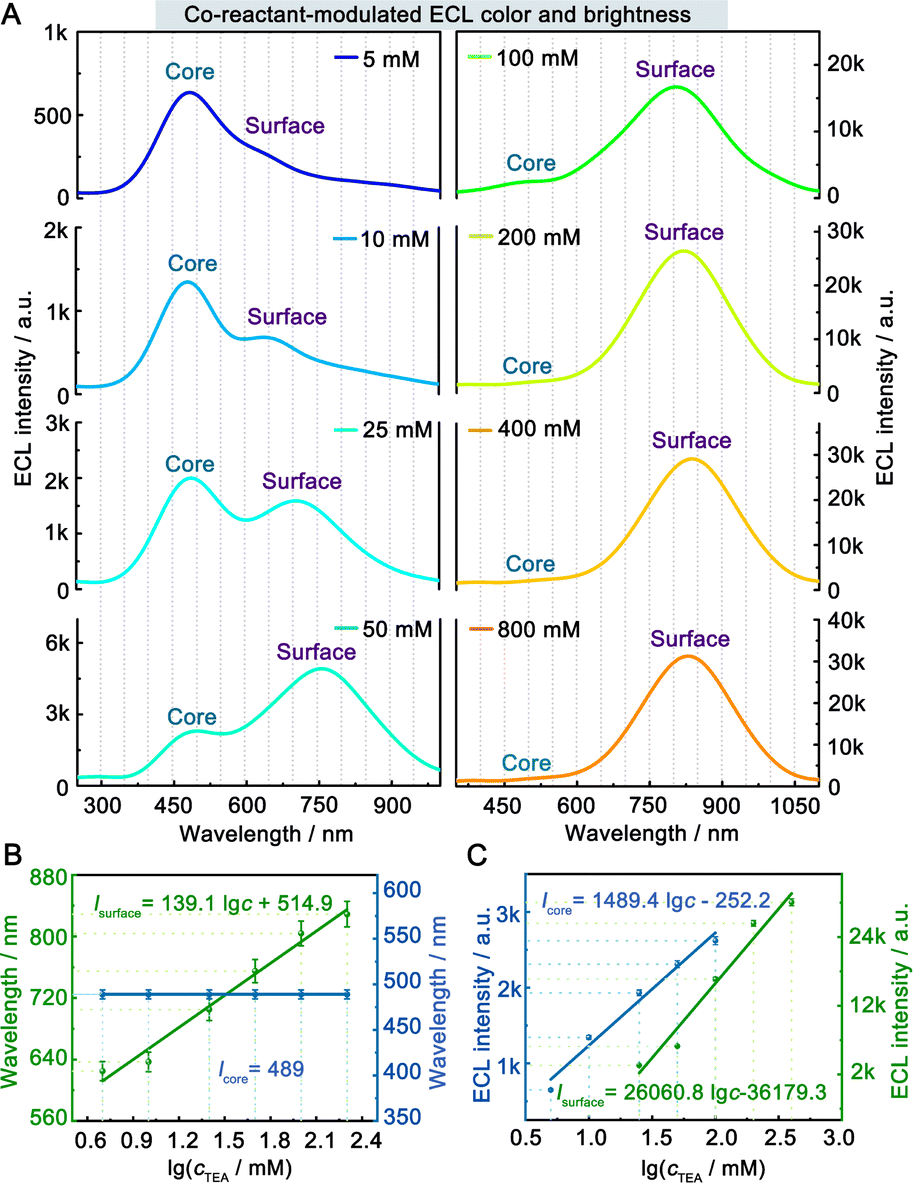 | ||
| Fig. 4 Co-reactant-modulated ECL color- and brightness of hydrogel-confined Au NCs. (A) ECL spectra of hydrogel-confined Au NCs recorded by scanning from 0 to 1.5 V in 0.1 M PBS (pH 7.4) solution with varying TEA concentrations from 5 to 800 mM. Calibration plot for the ECL (B) wavelength and (C) intensity of surface-related (green line) and core-related transitions (blue line) to the logarithm of TEA concentration. | ||
To gain insight into the color-tunable ECL mechanism of hydrogel-confined Au NCs, differential pulse voltammetry (DPV) and ECL characterization were carried out in a TBAPF6 acetonitrile solution. DPV (Fig. 5A) exhibits two reduction waves at −0.76 V (R1) and −1.48 V (R2) during cathodic scanning (Fig. 5A, green line), and two oxidation waves at −1.40 V and −0.64 V and four other oxidation waves at 0.52 V (O1), 0.88 V (O2), 1.12 V (O3), and 1.48 V (O4) during anodic scanning (Fig. 5A, blue line). Noticeably, the reverse of the cationic products is not observed during cathodic scanning, indicating that they are unstable. Meanwhile, one strong ECL peak of  and two unambiguous ECL peaks of
  and
and  are observed at the positive scan potential, and one weak ECL peak (
 ) and one obvious ECL peak (
 ) are found upon reversal of the applied potential (Fig. 5B). Unlike previously reported Au NCs, the strong ECL of these Au NCs (ΦECL = 7.81%) in the annihilation route can be attributed to the confinement-enhanced ECL. Furthermore, the spooling ECL spectra in the annihilation path remained constant at 489 nm across the potential window (Fig. S10† and the inset of Fig. 5B), demonstrating that only core-related emission is involved in the ECL process.7 Another co-reactant (tri-n-propylamine, TPrA) was used to explore the ECL spectrum of Au NCs. Surprisingly, the surface-related ECL of Au NCs showed continuous tuning from 625 to 680 nm as the TPrA concentration increased, while the core-related ECL remained constant at 489 nm (Fig. 5C), demonstrating the co-reactant-modulated ECL wavelength. Additionally, the surface-related ECL wavelength of Au NCs was easily modulated by adjusting the pH, scan rate, and scan voltage with TEA as a co-reactant (Fig. S11†). Given that two classical co-reactants can continuously regulate the surface-related ECL spectrum of Au NCs, we can reasonably speculate that amine compounds can closely interact with the Au shell, easily affecting the surface-related rather than the core-related ECL wavelength.
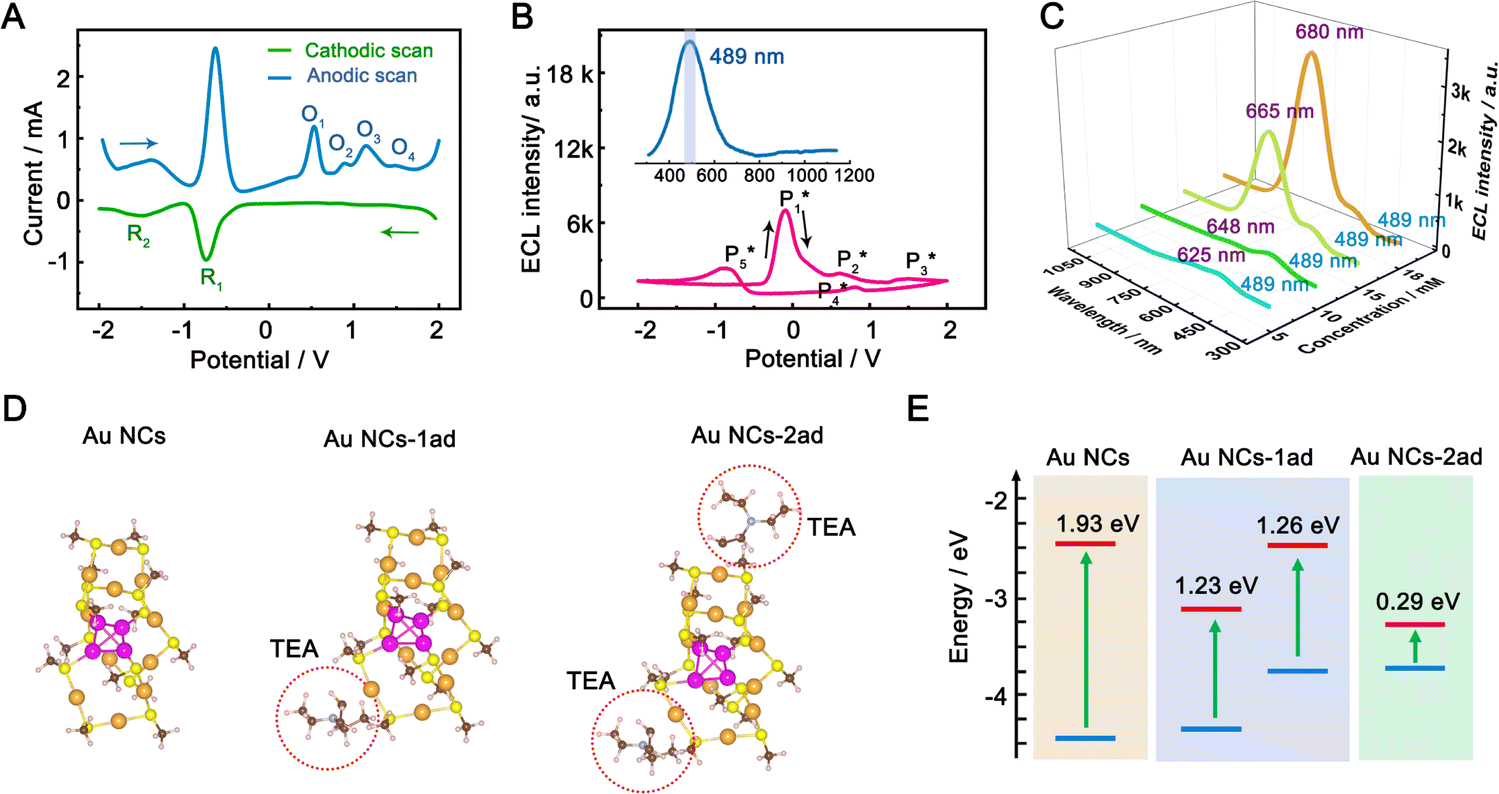 | ||
| Fig. 5 Co-reactant-modulated ECL mechanism of hydrogel-confined Au NCs. (A) Cathodic (green line) and anodic (blue line) DPV curves, (B) synchronous ECL-voltage curves of hydrogel-confined Au NCs recorded in 0.1 M tetra-n-butylammonium hexafluorophosphate (TBAPF6) acetonitrile solution. Inset: the corresponding ECL spectrum. (C) ECL spectra of hydrogel-confined Au NCs recorded in 0.1 M PBS (pH 7.4) solution with different TPrA concentrations from 5 to 18 mM. (D) Optimized molecular structures of the [Au15(SH)13] model monomer (Au NCs), with one TEA˙ (Au NCs-1ad), and two TEA˙ (Au NCs-2ad) adsorbed on the surface S atom. Au, orange or magenta; S, yellow; C, brown; H, white. (E) Comparison of ground-related orbital energy levels of bare Au NCs, Au NCs-1ad, and Au NCs-2ad. | ||
We performed density functional theory (DFT) calculations to gain deeper insight into the photophysical mechanism of Au NCs. We selected Au15(SR)13 as a starting model monomer, featuring a cyclic [Au(I)-SR] pentamer interlocked with two staple-like Au3(SR)4 trimers to protect the tetrahedral Au4 core.34 We optimize the molecular structures of the [Au15(SH)13] model monomer (Au NCs), with one TEA˙ (Au NCs-1ad) and two TEA˙ (Au NCs-2ad) adsorbed on the surface S atom (Fig. 5D). The DFT calculation demonstrated that once one or two TEA˙ closed with the Au shell closely, the bandgap of Au NCs narrowed and corresponded to the ECL red-shift (Fig. 5E). Specifically, the TEA˙ closed with the Au shell will distort the Au NC framework, as demonstrated by the variations in charges and bond lengths in Au NCs (Tables S1 and S2†). Additionally, Raman spectroscopy demonstrated the specific peaks in the adsorption of TEA˙ caused by surface defects of Au NCs (Fig. S12†). Hence, the dynamic surface reconstruction of Au NCs and TEA˙ is the source of color-tunable ECL characteristics.
Unlike previously reported Au NCs, the ECL pathways of hydrogel-confined Au NCs are associated with both the Au(0) core and the Au(I)–S surface. The schematic diagram in Fig. S13† depicts the co-reactant-type ECL mechanism. During positive potential scanning, the Au NCs underwent oxidation to form Au NCs+˙. Meanwhile, the co-reactant TEA underwent electro-oxidation to form TEA+˙ and subsequently underwent deprotonation to generate a TEA˙. The reduction of Au NCs+˙ by TEA˙ leads to the generation of excited Au NCs*, resulting in a core-related ECL signal.14 Strikingly, surface-related ECL emission is observed as a result of the surface reconstruction of Au NCs+˙ and TEA˙. This process leads to the generation of excited exciplexes [Au NCs and TEAoxidate]*,35 resulting in a surface-related ECL signal.
As a proof-of-concept, we developed a microenvironment-mapping ECL platform that utilized hydrogel-confined Au NCs as the mapping matrix to selectively monitor the cell–microenvironment interactions (Fig. S14A†). Liver cancer cells were selected as the model for endogenous hydrogen sulfide (H2S) analysis, which was first adhered to the platform surface. Then, cysteine and pyridoxal 5-phosphate monohydrate were used to stimulate cancer cells to release more H2S.36 Finally, H2S was produced and directly detected by the platform. According to the calibration equation obtained and the stimulated ECL response (Fig. S14B–E†), the H2S concentration is calculated to be 0.12 nM with an average cell count of 11.6. Therefore, the platform can accurately monitor tumor cell-derived H2S under oxidative stress conditions.
Conclusions
In conclusion, we achieved continuously color-tunable ECL by adjusting the co-reactant concentration from individual Au NCs confined in a porous hydrogel matrix. First, the surface-related ECL of Au NCs displays a wide color-tunable range of 625–829 nm, as the concentration of TEA co-reactant changes. This finding provides new potential for researchers to continuously manipulate the ECL spectra of Au NCs in a simple and dynamic manner. Second, the ECL origin of hydrogel-confined Au NCs is related to both the Au(0) kernel and the Au(I)–S surface. Mechanistic studies demonstrated that the color-tunable ECL property arises from the dynamic surface reconstruction of Au NCs and co-reactants. Finally, these Au NCs exhibited robust dual-color ECL using TEA as a co-reactant in an aqueous solution, with a record-breaking quantum yield of 95%. Such strong dual-emitting Au NCs with high sensitivity to microenvironmental factors and color-tunable features indicate that these Au NCs are promising ECL probes in biosensing and imaging research.Data availability
Essential data are provided in the main text and ESI.† Data can be made available from the corresponding author upon reasonable request.Author contributions
Y. M. Lei and Y. Zhuo proposed the project, designed the experiments, and wrote the manuscript. Y. M. Lei, M. C. Pan, X. L. Tao, and W. J. Zeng performed all the experiments. Y. M. Lei performed the analysis of the experimental data. D. Wu and L. Y. Gan conducted the DFT calculations. Y. Q. Chai, R. Yuan, and Y. Zhuo supervised the entire project.Conflicts of interest
There are no conflicts to declare.Acknowledgements
This work was financially supported by the National Natural Science Foundation of China (22022408) and the Fundamental Research Funds for the Central Universities (SWU-XJLJ202303), China.References
- M. F. Matus and H. Häkkinen, Nat. Rev. Mater., 2023, 8, 372–389 CrossRef CAS.
- S. Wang, L. Tang, B. Cai, Z. Yin, Y. Li, L. Xiong, X. Kang, J. Xuan, Y. Pei and M. Zhu, J. Am. Chem. Soc., 2022, 144, 3787–3792 CrossRef CAS PubMed.
- M. Hesari and Z. F. Ding, J. Am. Chem. Soc., 2021, 143, 19474–19485 CrossRef CAS PubMed.
- Y. Zhong, J. Zhang, T. Li, W. Xu, Q. Yao, M. Lu, X. Bai, Z. Wu, J. Xie and Y. Zhang, Nat. Commun., 2023, 14, 658 CrossRef CAS PubMed.
- L. J. Liu, F. Alkan, S. L. Zhuang, D. Y. Liu, T. Nawaz, J. Guo, X. Z. Luo and J. He, Nat. Commun., 2023, 14, 2397 CrossRef CAS PubMed.
- Q. Li, M. Zhou, W. Y. So, J. Huang, M. Li, D. R. Kauffman, M. Cotlet, T. Higaki, L. A. Peteanu, Z. Shao and R. Jin, J. Am. Chem. Soc., 2019, 141, 5314–5325 CrossRef CAS PubMed.
- M. Hesari and Z. Ding, Acc. Chem. Res., 2017, 50, 218–230 CrossRef CAS PubMed.
- S. Chen, H. Ma, J. W. Padelford, W. Qinchen, W. Yu, S. Wang, M. Zhu and G. Wang, J. Am. Chem. Soc., 2019, 141, 9603–9609 CrossRef CAS PubMed.
- L. Yang, B. Zhang, L. Fu, K. Fu and G. Zou, Angew. Chem., Int. Ed., 2019, 58, 6901–6905 CrossRef CAS PubMed.
- H.-H. Deng, X.-Q. Shi, F.-F. Wang, H.-P. Peng, A.-L. Liu, X.-H. Xia and W. Chen, Chem. Mater., 2017, 29, 1362–1369 CrossRef CAS.
- A. Cirri, H. Morales Hernandez, C. Kmiotek and C. J. Johnson, Angew. Chem., Int. Ed., 2019, 58, 13818–13822 CrossRef CAS PubMed.
- H. Peng, Z. Huang, H. Deng, W. Wu, K. Huang, Z. Li, W. Chen and J. Liu, Angew. Chem., Int. Ed., 2020, 59, 9982–9985 CrossRef CAS PubMed.
- K. N. Swanick, M. Hesari, M. S. Workentin and Z. Ding, J. Am. Chem. Soc., 2012, 134, 15205–15208 CrossRef CAS PubMed.
- H. Peng, Z. Huang, Y. Sheng, X. Zhang, H. Deng, W. Chen and J. Liu, Angew. Chem., Int. Ed., 2019, 58, 11691–11694 CrossRef CAS PubMed.
- Y. Xu, X. Gao, D. Wang, J. Jia, B. Zhang and G. Zou, Anal. Chem., 2022, 94, 12070–12077 CrossRef CAS PubMed.
- Y. M. Lei, Y. Zhuo, M. L. Guo, Y. Q. Chai and R. Yuan, Anal. Chem., 2020, 92, 2839–2846 CrossRef CAS PubMed.
- Z. Wu, Q. Yao, S. Q. Zang and J. Xie, Natl. Sci. Rev., 2021, 8, nwaa208 CrossRef PubMed.
- Z. Wang, R. Chen, Y. Xiong, K. Cepe, J. Schneider, R. Zboril, C.-S. Lee and A. L. Rogach, Part. Part. Syst. Charact., 2017, 34, 1700029 CrossRef.
- H. Deng, K. Huang, L. Xiu, W. Sun, Q. Yao, X. Fang, X. Huang, H. A. A. Noreldeen, H. Peng, J. Xie and W. Chen, Nat. Commun., 2022, 13, 3381 CrossRef CAS PubMed.
- W. J. Zeng, K. Wang, W. B. Liang, Y. Q. Chai, R. Yuan and Y. Zhuo, Chem. Sci., 2020, 11, 5410–5414 RSC.
- M. C. Pan, Y. M. Lei, Y. Q. Chai, R. Yuan and Y. Zhuo, Anal. Chem., 2020, 92, 13581–13587 CrossRef CAS PubMed.
- C. Wang, Y. Hu, C. M. Lieber and S. Sun, J. Am. Chem. Soc., 2008, 130, 8902–8903 CrossRef CAS PubMed.
- Y. Negishi, K. Nobusada and T. Tsukuda, J. Am. Chem. Soc., 2005, 127, 5261–5270 CrossRef CAS PubMed.
- Z. H. Liu, H. Tan, B. Li, Z. H. Hu, D. E. Jiang, Q. F. Yao, L. Wang and J. P. Xie, Nat. Commun., 2023, 14, 3374 CrossRef CAS PubMed.
- X. Jia, J. Li and E. Wang, Small, 2013, 9, 3873–3879 CrossRef CAS PubMed.
- H. Yang, Y. Liu, Z. Guo, B. Lei, J. Zhuang, X. Zhang, Z. Liu and C. Hu, Nat. Commun., 2019, 10, 1789 CrossRef PubMed.
- Z. Luo, X. Yuan, Y. Yu, Q. Zhang, D. T. Leong, J. Y. Lee and J. Xie, J. Am. Chem. Soc., 2012, 134, 16662–16670 CrossRef CAS PubMed.
- B. Santiago-Gonzalez, A. Monguzzi, J. M. Azpiroz, M. Prato, S. Erratico, M. Campione, R. Lorenzi, J. Pedrini, C. Santambrogio, Y. Torrente, F. De Angelis, F. Meinardi and S. Brovelli, Science, 2016, 353, 571–575 CrossRef CAS PubMed.
- Z. Wu, Y. Du, J. Liu, Q. Yao, T. Chen, Y. Cao, H. Zhang and J. Xie, Angew. Chem., Int. Ed., 2019, 58, 8139–8144 CrossRef CAS PubMed.
- Z. Wang, Y.-e. Shi, X. Yang, Y. Xiong, Y. Li, B. Chen, W.-F. Lai and A. L. Rogach, Adv. Funct. Mater., 2018, 28, 1802848 CrossRef.
- F. Wang, J. Lin, T. Zhao, D. Hu, T. Wu and Y. Liu, J. Am. Chem. Soc., 2016, 138, 7718–7724 CrossRef CAS PubMed.
- P. Wu, X. Hou, J. J. Xu and H. Y. Chen, Chem. Rev., 2014, 114, 11027–11059 CrossRef CAS PubMed.
- S. Yu, Y. Du, X. Niu, G. Li, D. Zhu, Q. Yu, G. Zou and H. Ju, Nat. Commun., 2022, 13, 7302 CrossRef CAS PubMed.
- D. E. Jiang, S. H. Overbury and S. Dai, J. Am. Chem. Soc., 2013, 135, 8786–8789 CrossRef CAS PubMed.
- P. Zhang, Z. Xue, D. Luo, W. Yu, Z. Guo and T. Wang, Anal. Chem., 2014, 86, 5620–5623 CrossRef CAS PubMed.
- J. Guo, L. Yang, H. Xu, C. Zhao, Z. Dai, Z. Gao and Y. Song, Anal. Chem., 2019, 91, 13746–13751 CrossRef CAS PubMed.
Footnote |
| † Electronic supplementary information (ESI) available. See DOI: https://doi.org/10.1039/d3sc06148e |
| This journal is © The Royal Society of Chemistry 2024 |