
Optimizing testing feedback in introductory chemistry: a multi-treatment study exploring varying levels of assessment feedback and subsequent performance†
Kristen L.
Murphy
 a,
David G.
Schreurs
a,
Melonie A.
Teichert
b,
Cynthia J.
Luxford
c,
Jaclyn M.
Trate‡
a,
Jordan T.
Harshmann§
d and
Jamie L.
Schneider
*d
a,
David G.
Schreurs
a,
Melonie A.
Teichert
b,
Cynthia J.
Luxford
c,
Jaclyn M.
Trate‡
a,
Jordan T.
Harshmann§
d and
Jamie L.
Schneider
*d
aUniversity of Wisconsin-Milwaukee, Milwaukee, Wisconsin 53211, USA
bUnited States Naval Academy, Annapolis, Maryland 21402, USA
cTexas State University, San Marcos, Texas 78666, USA
dUniversity of Wisconsin-River Falls, River Falls, Wisconsin 54022, USA. E-mail: jamie.schneider@uwrf.edu
First published on 9th May 2024
Abstract
Providing students with feedback on their performance is a critical part of enhancing student learning in chemistry and is often integrated into homework assignments, quizzes, and exams. However, not all feedback is created equal, and the type of feedback the student receives can dramatically alter the utility of the feedback to reinforce correct processes and assist in correcting incorrect processes. This work seeks to establish a ranking of how eleven different types of testing feedback affected student retention or growth in performance on multiple-choice general chemistry questions. These feedback methods ranged from simple noncorrective feedback to more complex and engaging elaborative feedback. A test-retest model was used with a one-week gap between the initial test and following test in general chemistry I. Data collection took place at multiple institutions over multiple years. Data analysis used four distinct grading schemes to estimate student performance. These grading schemes included dichotomous scoring, two polytomous scoring techniques, and the use of item response theory to estimate students’ true score. Data were modeled using hierarchical linear modeling which was set up to control for any differences in initial abilities and to determine the growth in performance associated with each treatment. Results indicated that when delayed elaborative feedback was paired with students being asked to recall/rework the problem, the largest student growth was observed. To dive deeper into student growth, both the differences in specific content-area improvement and the ability levels of students who improved the most were analyzed.
Introduction and theory
General chemistry is often taught in large lecture sections influencing instructor choices to utilize multiple-choice exams, frequently with limited feedback. Feedback provided after a multiple-choice exam is often a passive activity whereby faculty post scores, an answer key, and/or worked out solutions, but it is up to the individual student whether and how to engage with that feedback. Thus, understanding the best ways to use and provide feedback for multiple-choice exams could greatly help instructors employ best practices to maximize student learning through testing.Testing effect is commonly cited as a robust concept established through numerous research studies (Karpicke and Roediger, 2008; Rowland, 2014, Todd et al., 2021). Testing Effect is the finding that retrieval of information (testing) leads to better retention compared to restudying of the material, which suggests that testing could also be considered a learning tool in addition to an assessment tool (Karpicke, 2012; American Psychological Association (APA), 2021). Unlike the content often tested in a general chemistry course, much of the Testing Effect literature involves materials that require fact-based retrieval like word lists, symbol-word pairs, and reading comprehension of a prose passage (Wheeler et al., 2003; Roediger and Karpicke, 2006; Coppens et al., 2011). Although Karpicke and Aue argued that Testing Effect is beneficial for more complex materials citing several examples, Van Gog and Sweller challenged this notion suggesting that there was a limit to testing benefits with complex problem solving that requires more than recall but also generation and reconstruction of information (Karpicke and Aue, 2015; Van Gog and Sweller, 2015; Van Gog et al., 2015). Van Gog et al. proposed that the drop off in efficacy of Testing Effect was because earlier fact-based studies required declarative memory encoding, whereas problem solving required declarative schema construction and inclusion of procedural memory. In three experiments, Van Gog et al. had university students from various programs participate in learning about and solving problems related to circuits. In the fourth experiment, students in a math course were recruited to solve probability calculations. The goal of these experiments was to assess restudy of problems versus testing with the problems. In each experiment, ANOVA analysis of a final test one week after the initial treatment revealed no significant differences between the populations that restudied the material versus the populations that took a test of the material. Although this study seemed to contradict the many Testing Effect studies, there were several limitations to this study. Limitations included relatively short acquisition times for novice students to learn about circuits, small sample sizes with each experiment consisting of 57–120 students split between multiple treatment conditions, and final judgement based on performance of only a few items. They do suggest that further research with the addition of corrective feedback and with students with stronger prior knowledge of the material would be beneficial to elucidate the boundaries of Testing Effect with problem solving.
Testing with feedback has been shown to enhance Testing Effects. One issue with multiple-choice testing, and testing in general, is that choosing an answer (even a wrong answer) creates a relatively strong memory when completed under testing conditions. Without corrective feedback, incorrect answers are likely to show up again (Roediger and Marsh, 2005). Butler and Woodward provide a nice summary of the literature using task-level feedback to promote learning of facts and concepts (Butler and Woodward, 2018), defining task-level feedback as “feedback provided by an external agent after individual events that require memory retrieval”. They also provide a careful analysis and theoretical interpretation of testing feedback literature that contains a variety of feedback types and timing, each factor potentially changing the efficacy of outcomes. Our research group also provided a summary of testing feedback literature in an ACS Symposium chapter on testing (Schneider et al., 2014). To summarize the testing feedback literature: delayed corrective feedback produces better retention compared to immediate feedback, but immediate feedback may be useful with initial acquisition of information, especially for poor performing learners (Wright and Gescheider, 1970; Kulhavy and Anderson, 1972; Butler et al., 2007; Butler and Roediger, 2008; Mullet et al., 2014). For high efficacy of testing feedback on future performance, corrective feedback type should contain the original item, student's answer, and the correct answer (Hintzman, 2010). The feedback type with the most discrepant research was feedback that provided elaboration or explanation for the answer choices, with some research showing no improvement with elaboration while others showing moderate improvement for certain types of questions (Moreno, 2004; Butler et al., 2013). For future research, Butler and Woodward suggest the following: further investigation of errors and specifically feedback effects on different types of errors, investigating strategies that require generation and active processing during feedback, shifting from verbatim repeat testing to more transfer situations, and assessing the influence of metacognitive cues on confidence judgements and processing of feedback (Butler and Woodward, 2018). With all of these studies, there is a hope that this research will continue to inform educational practices, particularly in the context of science instruction (Risley, 2007; Henderson and Harper, 2009; Knaus et al., 2009; Andaya et al., 2017).
Our team endeavoured to use this rich literature to establish a research program investigating testing feedback efficacy on future performance outcomes in introductory chemistry courses. As practitioners and researchers, we wanted to design our study in a way that would directly link to classroom testing/practice testing applications in most introductory science and math courses and would apply robust, reproducible methods to add to the testing feedback literature. To establish experimental conditions with student prior knowledge and motivation similar to a multiple-choice testing scenario, we elected to use a practice test given to students enrolled in general chemistry courses at multiple institutions a few weeks prior to the course final exam. After and/or during the practice test, students were given some feedback condition. About 1 week later, the same students took an isomorphic practice test. The change in test performance, including the change in test performance by different groups of students, was then studied using a variety of modelling techniques to investigate the efficacy of different feedback mechanisms.
Research questions
Methods and analysis for this study were structured to answer the following research questions:(1) How do different types of feedback relate to student growth in exam performance, and which type of feedback is most effective?
(2) How does the growth related to each type of feedback differentially benefit students of particular ability levels?
(3) Does the content area of the question influence student growth, and how is that different between the treatments?
Methodology
Volunteer students enrolled in general chemistry at five institutions (labelled I1–I5) over 8 years participated in the test-retest study. A brief summary of each of these institutions is included in the ESI† (Section 1). Unique student groups were assigned to each feedback condition, but within the feedback condition the same group of students took the initial and final practice tests (between-within design). Two isomorphic exams consisting of introductory chemistry concepts [chemical composition (6 items); gram, mole, molecule conversions (6 items); reaction stoichiometry (4 items); and limiting reactant stoichiometry (4 items)] were used for data collection (Murphy et al. (Manuscript in preparation)). Items were written to assess both quantitative and conceptual reasoning, including interpretation of particulate-level drawings. Previous work has provided evidence of high validity for the data produced by these items when administered to general chemistry students (Murphy et al. (Manuscript in preparation); Schreurs et al., 2024; Trate et al., 2020). Reliability was also assessed through Cronbach's alphas and average inter-item correlations which are included in ESI,† Section 4.2. Practice Tests are available upon request from the corresponding author. Detailed information on the scoring of these tests is detailed elsewhere and in ESI,† Section 12 (Murphy et al. (Manuscript in preparation)). Student consent was obtained per IRB at each institution, and all students who did not provide consent were excluded from analysis.General practice methodology: delayed noncorrective (DNC)
The general data collection strategies were held constant at each testing site with instructors at each institution proctoring the practice exams during out of class sessions and/or laboratory sessions. Faculty proctors were given recruitment information and PowerPoint presentations to guide their introduction of the testing protocols. Students were invited to participate in the study about 3–4 weeks prior to the course final exam to help prepare for the final exam in some key course concepts. Students had up to 60 minutes to complete the initial 20-item multiple-choice Exam A. The proctors scanned the exam scoring sheets and sent them to the research team to score using electronic scoring software (Gravic, 2023). A score feedback sheet sorted by pre-assigned research student IDs was generated by the research team and posted for the participating students on a course management site (like D2L or Canvas) within 2–3 days of initial testing by the proctor. The feedback sheet indicated how many items were correct out of 20 and how many items were correct in each of the four topic areas. One week after taking the initial test, students returned to take an isomorphic 20-item multiple-choice Exam B with the same 60-minute limitation. Exam B had the same order of items with the same stem language but with different elements, compounds, and/or quantities. The answer choices also had the same language and same processing errors; however, the order of the answer choices was different to encourage re-processing of items rather than recalling answer choice order. Exam B was processed like Exam A with a score feedback sheet posted to the course management site within 2–3 days of testing. This general practice testing methodology constituted what we describe as delayed noncorrective feedback since students received their scores after taking the exam, but they did not receive information on which questions they missed, what their errors were, or the correct answers. Students were given access to overall score and subscores for all treatments in this study. This experimental condition is Treatment 1.Validation steps were taken to ensure the week 2 exam (Exam B) was comparable to the week 1 exam (Exam A). The student sample analysed for the validation included 2025 students who completed Exam A and 219 students who completed Exam B during week 1, without immediate feedback. The exams were graded dichotomously (correct or incorrect) and polytomously. Two partial-credit polytomous grading schemes were used and were dubbed “open” and “hierarchy”. Partial credit values were determined by expert raters. The open partial credit values could be any permutation of 0, 0.25, 0.5, or 1 where values could be used multiple times or excluded entirely. Questions under the hierarchy scheme required each of the values (0, 0.25, 0.5, 1) to be used once per question for the 4 answer choices. More details about these partial credit methods are provided elsewhere (Murphy et al. (Manuscript in preparation)). To ensure cloning, test performance was compared between both versions and is included in ESI,† Section 4.2. All analyses pointed towards both exams performing comparably.
Corrective feedback methodology
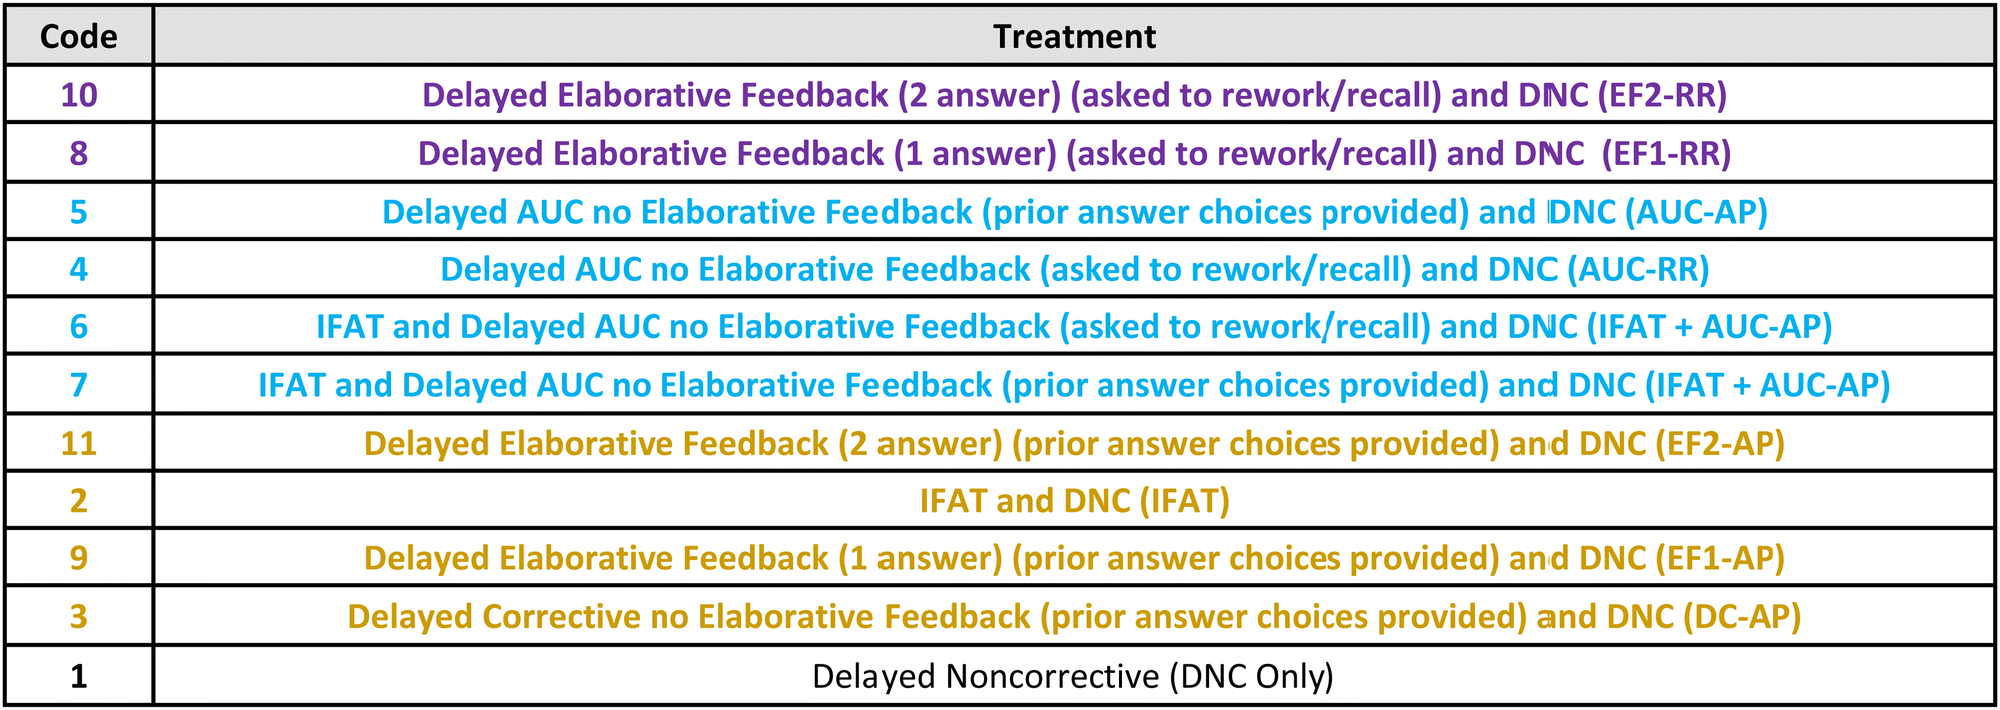
Each corrective feedback condition was added to the general practice testing methodology (Treatment 1) with changes occurring either during week 1 testing (immediate feedback conditions) or between week 1 and 2 testing (delayed feedback conditions). All Treatments utilized the same exams: A then B. The delayed noncorrective feedback condition described by the general methodology (Treatment 1) served as the control (e.g., item correctness was not indicated). In all, there were 10 different corrective feedback conditions (Treatments 2–11) described in Table 1. Only students who fully answered all 20 items on both week 1 and week 2 exams and who fully participated in the corrective feedback were included in the analysis.| Code | Treatmenta | Description |
|---|---|---|
| a All treatments involved DNC. | ||
| 1 | DNC only | Delayed noncorrective (DNC) |
| 2 | IFAT | IFAT and DNC |
| 3 | DC-AP | Delayed corrective no elaborative feedback (prior answer choices provided) and DNC |
| 4 | AUC-RR | Delayed AUC no elaborative feedback (asked to rework/recall) and DNC |
| 5 | AUC-AP | Delayed AUC no elaborative feedback (prior answer choices provided) and DNC |
| 6 | IFAT + AUC-RR | IFAT and delayed AUC no elaborative feedback (asked to rework/recall) and DNC |
| 7 | IFAT + AUC-AP | IFAT and delayed AUC no elaborative feedback (prior answer choices provided) and DNC |
| 8 | EF1-RR | Delayed elaborative feedback (1 answer) (asked to rework/recall) and DNC |
| 9 | EF1-AP | Delayed elaborative feedback (1 answer) (prior answer choices provided) and DNC |
| 10 | EF2-RR | Delayed elaborative feedback (2 answer) (asked to rework/recall) and DNC |
| 11 | EF2-AP | Delayed elaborative feedback (2 answer) (prior answer choices provided) and DNC |
Immediate feedback assessment technique (IFAT)
During Treatments 2, 6, and 7 week 1 testing, students were instructed to bubble in their first answer choice on an electronically scored answer sheet and then to use a commercially available Immediate Feedback Assessment Technique (IFAT) form to scratch off a waxy coating to reveal the correctness of their answer choice (CognaLearn, 2024). The intent of the IFAT form is to provide immediate feedback to students so that they may correct their process before progressing to the next item. IFAT was the only corrective feedback mechanism employed for Treatment 2. The specific directions provided to students for using the IFAT forms are provided in ESI,† Section 2.Delayed corrective (DC)
In Treatments 3–11, some form of delayed corrective (DC) feedback was provided 2–6 days after week 1 testing but before week 2 testing. Electronic platforms (Web Assign and Qualtrics) were used to deliver the delayed feedback conditions. In the delayed feedback conditions, students were shown each item one at a time, and students either entered their original Exam A answer choice (student prior answer choices were provided to them by the researchers) or the students were asked to recall/rework the problem and enter their answer choice. Based on testing feedback research optimal conditions, students would view the original item, their answer, the correctness of their answer, and the correct answer during the testing feedback process (Butler and Woodward, 2018). In Treatments 3, 5, 7, 9, and 11, student answer choices for week 1 were provided to the students’ course management site for students to input into the online feedback test to get item by item corrective feedback (Answers Provided, AP). In Treatments 4, 6, 8 and 10, students recalled/reworked (RR) each item during the Exam A feedback. In the delayed corrective condition (Treatment 3), students were given the following types of messages based on the correctness of their answer:“Your answer choice was incorrect. The correct answer choice was D 55.3%.”
“Your answer choice of D 55.3% was correct.”
Answer until correct (AUC)
In the delayed answer until correct (AUC) condition (Treatments 4–7), students were instructed to continue to answer each item one at a time until they chose the correct answer. After each attempt, students were given the following messages based on the correctness of their answer:“You answered A. This is incorrect. Please try another answer.”
“You answered B. This is correct. Good job! Please go on to the next problem.”
Elaborative feedback (EF)
In the elaborative feedback (EF) conditions, students were given additional information on the likely mistake they made based on the answer choice selected and a possible solution to obtain the correct answer. In Treatments 8 & 9 (EF1), this took the form of only one answer being elaborated to the students. The elaborative feedback was developed from response process research done with student interviews (Trate et al., 2020; Schreurs et al., 2024). An example of this is provided below and an additional example for a conceptual item is included in ESI,† Section 6: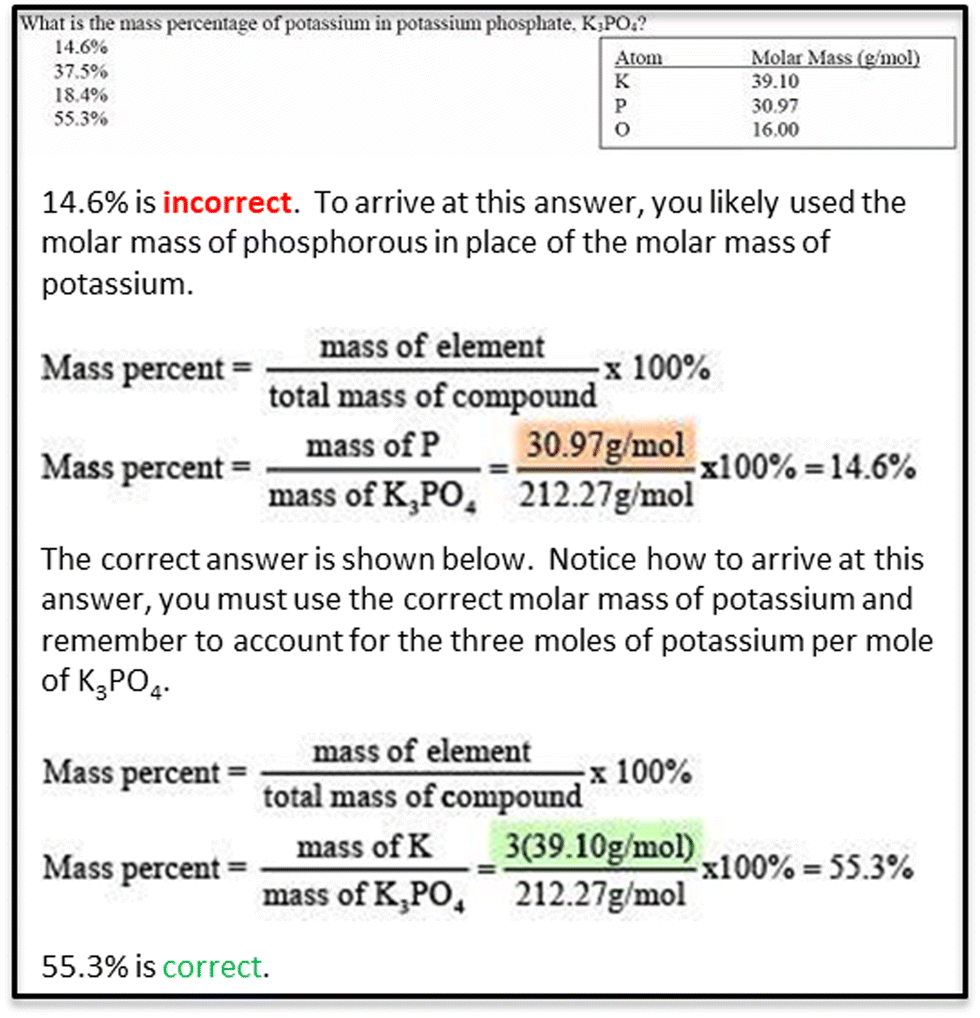
In Treatments 10 & 11 (EF2), students were given the same elaborative feedback information if they were incorrect on the first answer choice but instead of the correct answer solution they were told to “click on the next page to try this question again”. On the second attempt, they got the same feedback as the students did on the elaborative feedback condition (1 answer).
All 11 treatment conditions are summarized in Table 1, which is ordered to approximately mimic an increasing amount of feedback to the student (e.g. Treatment 11 is substantially more feedback to the student than Treatment 1, for example).
Statistical analysis of exam score data
The classical treatment of test-retest data comparing different feedback mechanisms would be to utilize a repeated measures ANOVA analysis. Because of the number of treatments (11 treatment conditions) and the partial-credit scoring options, a more sophisticated approach was taken to more carefully discern differences in student performance. Specifically, our analysis of the exam data necessitated the use of many mathematical tools such as Hierarchal Linear Modelling (HLM) and Item Response Theory (IRT). HLMs were chosen as the primary modelling technique because of their efficiency when investigating the relationships within and between hierarchical levels such as students within treatments over time (Woltman et al., 2012). For some analyses, HLM was paired with IRT. IRT attempts to transform the observed performance on a given assessment into a more accurate prediction of underlying ability. A commonly used statistic within IRT is the Lord's Wald test which provides a metric for showing significant difference between two groups on a common item (e.g., do week 1 and week 2 perform the same on this question?). Differences between two groups can also be visualized using Item Characteristic Curves (ICCs). ICCs plot student's ability levels against the probability of answering each item correctly (Schurmeier et al., 2010). If the treatment improved student performance, that ICC would be expected to appear higher (more likely to answer correctly) at most ability levels. Effect size for each ability level can be calculated using Cohen's h to compare the proportion of students at each ability level who are likely to answer correctly (based on the ICC) before and after the treatment (Cohen, 1988). Further background on HLM, IRT, and the Lord's Wald test are included in ESI,† Sections 3.1 and 3.2.Software specifications
The analyses required the implementation of IRT and the construction of HLMs. All statistical analysis was conducted using R 3.6.2 (R Core Team, 2022). To import raw data from excel, the R package ‘readxl’ was used (Wickham and Bryan, 2019). After all analyses, the R package ‘xlsx’ was used to export results from R back into excel (Dragulescu and Arendt, 2020). The ‘ltm’ package was used to construct the IRT models and ‘difR’ was used to compare the models using Lord's Wald test (Rizopoulos, 2006; Magis et al., 2010). HLMs were created using both the ‘nlme’ and ‘lme4’ package (Bates et al., 2015; Pinheiro et al., 2020). After the HLMs were formed, the ‘arm’ package was used to estimate the standard error associated with the random effects (Gelman and Su, 2020).Pilot hierarchical linear models
To determine the optimal model to fit the data, four pilot models were constructed and compared. The initial model was the simplest and was tested against 3 iterations of building up the model through the addition of fixed and random effects. The process of these models is explained in detail in ESI,† Section 3.3 but the optimal model (referred to as “m2”) used: student initial performance, student improvement between weeks, and a random effect based on the student's treatment.Results
The average exam scores and total number of students who took the exam are displayed in Table 2 with the data broken down by institution and semester. These data illustrate the diversity of student performance profiles among our sample. Table 3 shows averages and counts broken down by the type of feedback (hereafter referred to as treatment) provided to the student between week 1 and week 2 testing. Our goal was to compare the different feedback treatments to address the research questions regarding how the types of feedback relate to student growth in exam performance and how that growth relates to students of different achievement levels and to different content areas.| Week 1 | Institution | Overall average | |||||
|---|---|---|---|---|---|---|---|
| I1 | I2 | I3 | I4 | I5 | |||
| Average dichotomous score | Fall | 13.87 | 10.89 | 13.73 | 10.70 | 13.30 | |
| Spring | 12.59 | 11.05 | 13.63 | 10.97 | 14.56 | 13.09 | |
| Average open score | Fall | 14.87 | 12.40 | 14.75 | 12.16 | 14.39 | |
| Spring | 13.74 | 12.55 | 14.72 | 12.39 | 15.52 | 14.22 | |
| Average hierarchy score | Fall | 15.52 | 13.24 | 15.45 | 13.13 | 15.10 | |
| Spring | 14.52 | 13.44 | 15.38 | 13.35 | 16.18 | 14.96 | |
| Week 1 | Institution | Overall count | |||||
|---|---|---|---|---|---|---|---|
| I1 | I2 | I3 | I4 | I5 | |||
| Fall | 379 | 85 | 417 | 74 | 955 | ||
| Spring | 304 | 20 | 345 | 112 | 166 | 947 | |
| Total | 683 | 105 | 762 | 186 | 166 | 1902 | |
| Treatment | Overall average | ||||||||||||
|---|---|---|---|---|---|---|---|---|---|---|---|---|---|
| 1 | 2 | 3 | 4 | 5 | 6 | 7 | 8 | 9 | 10 | 11 | |||
| Average dichotomous score | Week 1 | 12.71 | 13.78 | 12.59 | 12.79 | 12.88 | 15.54 | 13.97 | 14.79 | 13.55 | 13.08 | 12.57 | 13.20 |
| Week 2 | 13.02 | 14.77 | 13.30 | 14.40 | 14.62 | 16.65 | 15.21 | 16.70 | 14.25 | 15.31 | 13.81 | 14.24 | |
| Average open score | Week 1 | 13.93 | 14.82 | 13.74 | 13.91 | 13.98 | 16.28 | 14.97 | 15.71 | 14.52 | 14.20 | 13.78 | 14.31 |
| Week 2 | 14.22 | 15.67 | 14.47 | 15.38 | 15.54 | 17.24 | 16.00 | 17.32 | 15.15 | 16.11 | 14.84 | 15.23 | |
| Average hierarchy score | Week 1 | 14.70 | 15.45 | 14.47 | 14.68 | 14.88 | 16.73 | 15.59 | 16.22 | 15.37 | 15.00 | 14.53 | 15.03 |
| Week 2 | 14.93 | 16.21 | 15.15 | 16.00 | 16.20 | 17.64 | 16.56 | 17.64 | 15.86 | 16.60 | 15.52 | 15.84 | |
| Treatment | Overall count | |||||||||||
|---|---|---|---|---|---|---|---|---|---|---|---|---|
| 1 | 2 | 3 | 4 | 5 | 6 | 7 | 8 | 9 | 10 | 11 | ||
| Count | 592 | 327 | 112 | 194 | 82 | 57 | 110 | 66 | 64 | 205 | 93 | 1902 |
Hierarchical linear modelling m2 coefficients and random effects
Using the results from pilot models (ESI,† Section 3.3), the optimal model (m2) was used to model the full data to estimate the value added by each treatment. Since the primary focus of this study is the growth in student performance caused by each treatment, the initial ability levels (β0 and θ0j(i)) are not reported here but are included in ESI,† Section 5. When interpreting the coefficients directly, β1 is the average growth of the full sample and θ1j(i) is how much the growth of treatment j differs from that average. However, rather than interpreting β1 and θ1j(i) independently, a more useful metric is interpreting the sum of β1 and θ1j(i). The interpretation of the sum of these two coefficients is now the slope of treatment j, which can be interpreted as how many points of improvement were caused by treatment j. This model (m2) was run using dichotomous, open, and hierarchy scoring and the slopes (β1 + θ1j(i)) for each treatment along with the standard error of θ1j(i) are plotted in Fig. 1.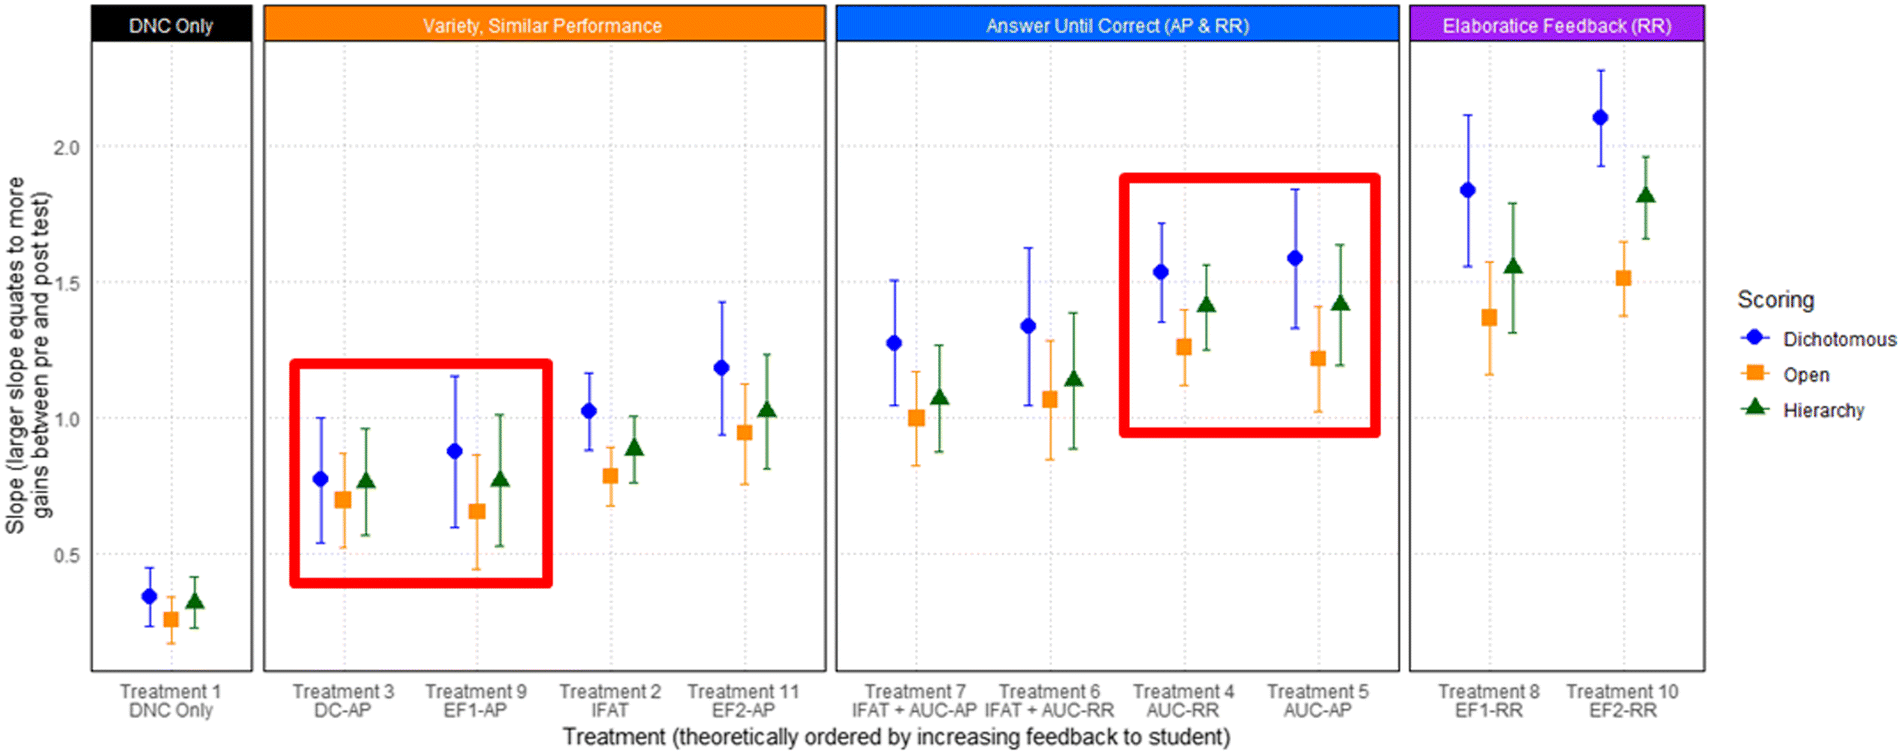 | ||
| Fig. 1 Estimates for the slope (β1 + θ1j(i)) of each treatment under the m2 model. The slope of each treatment is interpreted as how many points of improvement were caused by that treatment. Error bars correspond to the standard error of the treatment slope. Treatments are boxed based on how they were later collapsed. | ||
The values of the slopes within each treatment vary between grading schemes. This is to be expected because the partial credit schemes gave students more opportunities for points which inflated their week 1 scores and gave them less room to improve during week 2. It is because of this week 1 inflation that dichotomous (lowest average score) is consistently the highest growth, followed by open (second lowest average score), followed by hierarchy (highest average score). These slopes may have agreed more closely with a more difficult exam where students wouldn’t have been as likely to obtain the highest possible score.
Regardless of the slight differences in slopes within each treatment, the between-treatments trend is fairly consistent. The smallest gain was observed for the control treatment (delayed noncorrective only), whereas the largest gains were observed for the delayed elaborative feedback conditions (whether 1 or 2 answer attempts allowed) where students were asked to rework the problem or recall their initial response. All the scoring schemes showed the same progression of treatments with two exceptions under the hierarchy grading scheme (boxed in red on Fig. 1). These differences were minor and only caused a flipping-in-order of two pairs of treatments.
Sample collapse by treatment
While the order of student growth caused by the treatments is shown in Fig. 1, many neighbouring treatments have standard error bars which overlap. In an attempt to further separate the differences caused by treatments and obtain sample sizes large enough to conduct IRT analysis, samples which received similar treatments were collapsed into groups. This process was guided by both the quantitative results that showed the ordering of treatment effectiveness, and by qualitatively analysing the treatments which are likely to produce similar results.The first grouping (Group 1, purple in Table 4) was the highest performing treatment and consists of delayed elaborative feedback (asked to rework/recall). Grouping 2 (blue) was similar in that all treatments contained delayed AUC without elaborative feedback. The third grouping (orange) qualitatively has a wider variety of treatments together; however, quantitatively they all performed very similarly in Fig. 1. Group 4 (black) was students who were only provided delayed noncorrective feedback and this treatment was left on its own because its standard error did not overlap with any of the other treatments, and because this treatment (as Treatment 1) served as the control for comparison.
|
After these treatment groupings (TG) were determined, a new HLM was constructed using a slight modification of the previous model (m2). The model for TG is 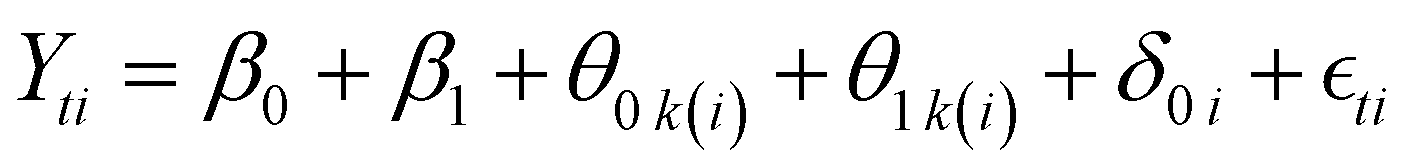
where all of the coefficients and indexes are interpreted in the same way. The only change to this model is that instead of treatment j, the new model has TG k. The values of the coefficients for this model are shown in ESI,† Section 8. Fig. 2 shows the slopes (β1 + θ1k(i)) for each TG along with the group's standard errors. These TG for each scoring scheme (along with the true score which is discussed in the next section) show the expected ordering and separation of the treatment groups. Specifically, regardless of the scoring method, the smallest gain (slope) was observed for the control treatment (delayed noncorrective feedback), and the greatest gains were seen for delayed elaborative feedback where students were asked to recall or rework the problem.
 | ||
| Fig. 2 Estimates for the slope (β1 + θ1k(i)) of each treatment group under the m2 model. Error bars correspond to the standard error of the TG slope. | ||
Dichotomous 2-parameter logistic item response theory model
An additional benefit of collapsing the treatments into broader groupings is the increase in sample size of each group (see Table 5). Using these collapsed samples and within each week and TG, a 2-parameter logistic (2-PL) model was used which could accommodate both for question difficulty and discrimination. IRT true scores for each week were used following the same HLM procedure that was used above. These models, based on an alternative measure of student ability, led to the same conclusions that were drawn from the other dichotomous and polytomous scores (Fig. 1). However, the true scores based on IRT modelling suggest the benefit caused by treatment group 2 and 3 may be understated by the other methods, and the benefit from treatment group 1 may be overstated (Fig. 2).
|
Lord's test for differential item functioning between week 1 and week 2 item response theory models
IRT analysis also allowed for week 1 and week 2 results to be more accurately compared through the use of Lord's Wald test. The significance threshold was set at the 0.001 level where a significant result indicates that week 1 and week 2 performed significantly different. Since the results of this test do not necessitate that week 2 performed better than week 1, ICC's (item characteristic curves) were analysed in the next section which show the probability of a student of any ability level answering the problem correctly. This analysis confirmed improvement in performance for most ability levels. Questions that showed a significant difference under each TG are shown in Table 6 and are later expanded upon in the section “Treatment grouping results summary”. The presence of significant differences was then broken down by the content area of the question. Significance values for each Lord comparison can be found in ESI,† Section 10.| Content area | Question # | TG1 | TG2 | TG3 | TG4 |
|---|---|---|---|---|---|
| Chemical formulas | Q16 | X | X | ||
| Conceptual understanding of molar mass | Q14 | X | |||
| Empirical formula | Q13 | X | X | X | |
| Identify excess products | Q20 | X | X | ||
| Stoichiometric calculations | Q8 | X | |||
| Limiting reactant calculations | Q19 | X | X | ||
| Limiting reactant calculations | Q9 | X | |||
| Limiting reactant calculations | Q10 | X | X |
Item characteristic curve (ICC) comparison
The primary limitation with the Lord results is while significant differences were found, no indication of effect size had been determined. While quantitative methods do exist for finding IRT overall effect size, for this study ICC's were compared to visualize how the effect size changed for each student ability level. In other words, ICC comparison allowed for visualization of not only which content areas benefited from each treatment, but also which student ability levels benefited the most. One example of direct ICC comparison is shown in Fig. 3 with TG1, question 9. This figure shows that week 2 had a higher probability of students answering the question correctly for nearly every ability level. Students of average ability level (ability = 0), appear to benefit the most because this is where the week 1 and week 2 plots are most separated. It is also worth noting that the region where week 1 outperforms week 2 seems to be a result of the question discriminating better week 2 as opposed to a counterintuitive shift in improvement which benefits week 1. Comparing ICC's in this manner is effective; however, it is tedious and would lead to the analysis of 160 plots (20 questions × 2 weeks × 4 TG). Analysis can be dramatically simplified by instead investigating the difference between the weeks. This is shown for question 9 in the red box of Fig. 3 and can be simply interpreted as the more positive the line, the more the treatment benefited students of that ability level. These differences for each question can then be summed to provide a rough estimate of which student abilities benefit overall under each TG. The plot of these sums is shown in Fig. 4. | ||
| Fig. 3 Side-by-side comparison of ICCs between week 1 and week 2 of treatment grouping 1, question 9. Within the red box, is the area between these curves. | ||
 | ||
| Fig. 4 Sum of the differences between week 1 and week 2 ICC's for every question within each treatment grouping. | ||
For ease of explanation, Fig. 4 was broken into three categories of students using a cut-point of ±1.5: below-average (<−1.5 ability level), average (−1.5 to 1.5 ability level), and above-average (>1.5 ability level). The categories are colour coded in the figure. Interpretation of the plot shows that the TG effectiveness follows the expected pattern (TG1 > TG2 > TG3 > TG4) for average and above-average student. Above average students showed a smaller gap in growth due to the initial start of higher performance (ceiling effect). An interesting pattern is seen for below-average students (TG3 > TG2 > TG1 > TG4). This drop in treatment effectiveness may be caused by low-ability students not engaging in the ‘asked to rework or recall’ portions of the treatments which was pivotal for both TG1 and TG2. In addition, low-ability students may not engage as productively in “Answer Until Correct (AUC)” feedback methods, simply guessing through the answer choices rather than reasoning through alternate answers.
The ICC can also be used to analyse content-specific growth. Raw differences in the ICC (as were used to establish Fig. 4) after being broken down by content area can be found in ESI,† Section 11. However, to better quantify the effect size of these differences, Cohen's h was calculated based on these ICC differences for each ability level. To determine if a content area experienced growth as a result of the TG, the cut-point of 0.5 was used which signifies a medium effect size (Cohen, 1988). Content groups that fell above this cut point are shown tabularly (Table 7) and analysed further in the section “Treatment grouping results summary”.
| Content | Measurement | TG1 | TG2 | TG3 | TG4 |
|---|---|---|---|---|---|
| Chemical formulas | Lord statistic | X | X | ||
| IRT ICC | X | X | |||
| Conceptual understanding of molar mass | Lord statistic | X | |||
| IRT ICC | X | X | |||
| Application of molar mass | No significant differences | ||||
| Mass percent | Significant differences only observed through multimode analysis (see ESI,† Section 12) | ||||
| Empirical formula | Lord statistic | X | X | X | |
| IRT ICC | X | X | |||
| Mole to mole ratio | No significant differences | ||||
| Identify excess products | Lord statistic | X | X | ||
| IRT ICC | X | ||||
| Mole to mole conversion | No significant differences | ||||
| Stoichiometric calculations | Lord statistic | X | |||
| IRT ICC | |||||
| Limiting reactant calculations | Lord statistic | X | X | ||
| IRT ICC | X |
Treatment grouping results summary
The benefit to students caused by each TG has now been analysed through two distinct methods: Lord's Wald test and ICC comparison. An independent qualitative approach to scoring was also completed (termed ‘multimode scoring”) and is documented in ESI,† Section 12. A tabular summary of which content groups were determined to be benefited for each TG under each method are shown in Table 7.Table 8 is a transformation of Table 7 and shows the ability level where students received the most benefit when ICCs within each content area were averaged. The ability levels are reported as a z-score so a value of 0 indicates average ability students, negative indicates below average ability students, and positive indicates above average students. For example, Table 8 shows that in the content area of “Chemical Formulas”, TG1 resulted in the most growth for students with a factor score of −1.420. This means students who performed 1.420 standard deviations below the class average were most aided by this treatment grouping in this content area. However, this treatment grouping was most beneficial to students who were 1.036 standard deviations above the class average in the content areas of “Identify Excess Products”. This transformation was only conducted for content areas where at least one of the three (Lord Statistic, IRT ICC, or Multimode) detection methods summarized in Table 7 showed growth for that treatment grouping. Interpretation of Table 8 is three-fold and involves analysis of the overall pattern, the within TG trend, and the between TG trend. Overall, the detection pattern is intuitive and shows that TG1 and TG2 led to growth in the most content areas, followed by TG3, and ending with no growth above the thresholds with TG4.
| Content | TG1 | TG2 | TG3 | TG4 |
|---|---|---|---|---|
| Chemical formulas | −1.420 | −1.523 | ||
| Conceptual understanding of molar mass | −0.787 | −1.247 | −0.883 | |
| Mass percent | −0.269 | |||
| Empirical formula | −0.422 | −0.806 | 0.115 | |
| Identify excess products | 1.036 | −0.576 | ||
| Stoichiometric calculations | −0.192 | |||
| Limiting reactant calculations | −0.294 | 0.166 |
For analysis within treatment groupings, with the exception of a few content areas within TG1, the later the content area the higher the ability of students benefited. This means that lower achieving students are benefiting from the treatments by expanding their foundation knowledge of chemistry while higher achieving students who already possess sufficient foundational knowledge are expanding their peripheral knowledge.
When comparing between TG, the question becomes which grouping provides benefit to the widest array of students. Analysis of the ranges from Table 8 show that TG1 benefited students of the most diverse abilities with a range of −2.456 (−1.420 to 1.036 = −2.456). This was followed subsequently by TG2 (−1.689) and TG3 (−0.998). The large range of benefit to students provided by TG1 strengthens the argument for its use and confirms that it's not only beneficial to a specific ability student.
Conclusions
Implications
The results provided by the m2 HLM show a clear ordering of the effectiveness of different types of feedback treatments (research question 1). After sample collapse by treatment, the standard errors did not overlap with neighbouring groupings and showed particular benefit for providing students with delayed elaborative feedback coupled with students being asked to recall or rework each problem. Further investigation into this growth showed that students of a wide range of abilities all benefited from TG1 (delayed elaborative feedback) lending weight to its use for a larger variety of students (research question 2). More specifically, the data presented here suggest practitioners will provide the greatest benefit to their students, as a whole, by providing them with an opportunity for delayed elaborative feedback along with having the students recall/rework the exam questions. This can be operationalized by providing students with the opportunity to rework exam questions with item-by-item feedback, for example with an electronic platform or course management system which would provide elaborative feedback in real time. Note this suggestion does not necessarily advocate for exam retakes for improved exam grades, but as a post-exam assignment with the purpose of learning from errors for future assessments.It is noteworthy to address the significant instructor time investment of programming in item-by-item elaborative feedback. In the case where such feedback is not realistic to be implemented, dramatic student improvement was also seen using AUC (TG2). Assuming the course-management system supports AUC, this method requires no additional instructor intervention and therefore may be a more preferable option to many instructors.
Another important result of the work presented here is that with all methods of analysis, the control treatment, which consisted of delayed noncorrective feedback that provided a score but no information on missed questions or correct answers, showed the lowest gain, and as shown in Tables 7 and 8 (as TG4) showed no gain for any content area. Further, delayed corrective feedback (Treatment 3 in Table 1, collapsed into TG3 in the subsequent analysis) showed little to no gain in performance either. This feedback condition mimics the predominant feedback given in a large-enrolment course: students can see which questions they answered correctly/incorrectly and an answer key is posted. The work presented here indicates that this method of feedback does not lead to improved performance for students. Effective feedback must include an opportunity to rework exam questions through initial attempts and/or through answer-until-correct attempts (TG1 & TG2), and the most effective feedback will also contain item-by-item (TG1) elaborative feedback. The results of this work have implications for best practices in exam feedback as well as for online homework systems.
An interesting caveat is that lower-performing students experience the lowest gain from the delayed elaborative feedback. Thus, if an instructor is attempting to help primarily low-performing students, it may be more beneficial to provide those students with their original answers to questions before they engage in a delayed feedback opportunity as opposed to being asked to recall or rework questions as is indicated in Fig. 4. It is also important to note that for reasonable elaborative feedback to be given and for student improvement through item-by-item feedback, multiple-choice assessments should be built with logical distractors. There is also an advantage to incorporating partial credit scoring, which provides credit for partially-correct processes, a method of giving feedback to students with initial scoring (Murphy et al. (Manuscript in preparation)).
These results also indicated a relationship between feedback type and content area being assessed (research question 3). However, while this analysis shows that a relationship between content and feedback exists, this study was not designed to make claims about what causes a particular type of feedback to be effective within a specific content area. Based on prior research, it can be assumed a portion of this relationship can be explained by the ratio of complex problem solving versus fact-based retrieval the item required (Wheeler et al., 2003; Roediger and Karpicke, 2006; Coppens et al., 2011; Karpicke and Aue, 2015; Van Gog and Sweller, 2015; Van Gog et al., 2015). However, a deeper investigation is required to better understand what types of problems are ideal for which type of feedback.
Regardless of the type of feedback an instructor wishes to provide to students, an important consideration is the feedback options provided by their course management system. For example, functionality to provide students with immediate feedback during testing or testing feedback (as opposed to feedback following test completion) may not be available. The feedback mechanisms we investigated follow best practices of connecting item stem with answer choices to student answers to corrective feedback with feedback coming at the moment students are thinking about a particular item. Most online course managements systems only allow for whole test feedback at the end of submission. Given that the benefit of different feedback types was found to vary based on content and student ability, we encourage course management systems to provide a greater variety of possible feedback mechanisms for instructors to choose from.
Limitations
The effectiveness of each individual treatment is based on student performance in introductory chemistry and may not be consistent at other levels of chemistry or in other fields. Additionally, the influence of TG on content-specific growth uses a limited number of questions to predict student growth for a more general content area. The intention of the content-specific growth results is not to encourage a specific type of feedback based on the content area being studied. Rather, this study only demonstrates that students may respond to feedback differently based on the content being assessed. To understand the cause of differential improvement between content areas, a deeper qualitative investigation into changes in student process would be necessary.The differential performance of treatments between content areas would be expected to be even more apparent for content which rely on different processes. Another limitation of this work is that many of the items tested could be solved algorithmically. The Testing Effect literature suggests the Testing Effect may be even stronger for fact-based items than the complex problem-solving items we tested (Karpicke and Aue, 2015; Van Gog and Sweller, 2015; Van Gog et al., 2015).
Finally, while these results are based on 5 distinct and diverse universities, they do not encompass or account for all populations of students, and no analysis was done to date on this data to investigate how different student populations (besides ability) grow differently when exposed to these treatments. Furthermore, even though student growth was observed between the week 1 and week 2 assessment, it is unclear how well the learning gains students experienced translated to other course work later in the semester. Similar feedback research in the more authentic classroom setting is an important next step.
Conflicts of interest
There are no conflicts to declare.Acknowledgements
Funding from NSF TUES grant (DUE 1140914), lead-PI Jamie Schneider, and NSF IUSE Grant (DUE 1625233), PI Jamie Schneider. Any opinion, findings, and conclusions or recommendations expressed in this material are those of the author(s) and do not necessarily reflect the views of the National Science Foundation. We are also grateful to Dr Christopher Bauer and Dr Panayiota Kendeou for their continued guidance and assessment of our projects as the external evaluators on the NSF grants. Dr Arunendu Chatterjee provided much statistical advice and preliminary analysis during the early stages of the project. We would also like to acknowledge many undergraduate research students (Andrew Beszhak, Alex Cimaglio, Marcus Engle, Chad Fleck, Julian Ikeri, Matthew Larson) who helped with data entry and organization. Finally, we would like to show our appreciation to all the students who took the exams and the professors who aided in the distribution of the exams.Notes and references
- American Psychological Association (APA), (2021), APA Dictionary of Psychology.
- Andaya G., Hrabak V. D., Reyes S. T., Diaz R. E. and McDonald K. K., (2017), Examining the Effectiveness of a Postexam Review Activity to Promote Self-Regulation in Introductory Biology Students, J. Colloids Sci. Teach., 46(4), 84–92.
- Bates D., Mächler M., Bolker B. and Walker S., (2015), Fitting Linear Mixed-Effects Models Using lme4, J. Stat. Softw., 67(1), 1–48 DOI:10.18637/jss.v067.i01.
- Butler A. C., Godbole N. and Marsh E. J., (2013), Explanation feedback is better than correct answer feedback for promoting transfer of learning, J Educ. Psychol., 105(2), 290–298 DOI:10.1037/a0031026.
- Butler A. C., Karpicke J. D. and Roediger H. L., (2007), The Effect of Type and Timing of Feedback on Learning From Multiple-Choice Tests, J. Exp. Psychol. Appl., 13(4), 273–281 DOI:10.1037/1076-898X.13.4.273.
- Butler A. C. and Roediger H. L., (2008), Feedback enhances the positive effects and reduces the negative effects of multiple-choice testing, Mem. Cognit., 36(3), 604–616 DOI:10.3758/MC.36.3.604.
- Butler A. C. and Woodward N. R., (2018), Toward consilience in the use of task-level feedback to promote learning, Psychol. Learn. Motivation – Adv. Res. Theory, 69, 1–38 DOI:10.1016/BS.PLM.2018.09.001.
- CognaLearn, (2024), Immediate Feedback Assessment Technique, https://www.cognalearn.com/ifat.
- Cohen J., (1988), Statistical Power Analysis for the Behavioural Science, 2nd edn.
- Coppens L. C., Verkoeijen P. P. J. L. and Rikers R. M. J. P., (2011), Learning Adinkra symbols: the effect of testing, J. Cognitive Psychol., 23(3), 351–357 DOI:10.1080/20445911.2011.507188.
- Dragulescu A. and Arendt C., (2020), xlsx: Read, Write, Format Excel 2007 and Excel 97/2000/XP/2003 Files. CRAN.
- Gelman A. and Su Y.-S., (2020), arm: Data Analysis Using Regression and Multilevel/Hierarchical Models, CRAN (R package version 1.11-1), https://cran.r-project.org/package=arm.
- Gravic [Computer software], (2023), Remark.
- Henderson C. and Harper K. A., (2009), Quiz Corrections: Improving Learning by Encouraging Students to Reflect on Their Mistakes, Phys. Teach., 47(9), 581–586 DOI:10.1119/1.3264589.
- Hintzman D. L., (2010), How does repetition affect memory? Evidence from judgments of recency, Mem. Cognit., 38(1), 102–115 DOI:10.3758/MC.38.1.102.
- Karpicke J. D., (2012), Retrieval-Based Learning: Active Retrieval Promotes Meaningful Learning, Curr. Dir. Psychol. Sci., 21(3), 157–163 DOI:10.1177/0963721412443552.
- Karpicke J. D. and Aue W. R., (2015), The Testing Effect Is Alive and Well with Complex Materials, Educ. Psychol. Rev., 27(2), 317–326 DOI:10.1007/s10648-015-9309-3.
- Karpicke J. D. and Roediger H. L., (2008), The critical importance of retrieval for learning, Science, 319(5865), 966–968 DOI:10.1126/science.1152408.
- Knaus K. J., Murphy K. L. and Holme T. A., (2009), Designing Chemistry Practice Exams for Enhanced Benefits. An Instrument for Comparing Performance and Mental Effort Measures, J. Chem. Educ., 86(7), 827–832 DOI:10.1021/ed086p827.
- Kulhavy R. W. and Anderson R. C., (1972), Delay-retention effect with multiple-choice tests, J. Educ. Psychol., 63(5), 505–512 DOI:10.1037/h0033243.
- Magis D., Béland S., Tuerlinckx F. and De Boeck P., (2010), A general framework and an R package for the detection of dichotomous differential item functioning, Behav. Res. Methods, 42(3), 847–862 DOI:10.3758/BRM.42.3.847.
- Moreno R., (2004), Decreasing cognitive load for novice students: effects of explanatory versus corrective feedback in discovery-based multimedia, Instr. Sci., 32(1–2), 99–113 DOI:10.1023/b:truc.0000021811.66966.1d.
- Mullet H. G., Butler A. C., Verdin B., von Borries R. and Marsh E. J., (2014), Delaying feedback promotes transfer of knowledge despite student preferences to receive feedback immediately, J. Appl. Res. Mem. Cogn., 3(3), 222–229 DOI:10.1016/j.jarmac.2014.05.001.
- Murphy K., Schreurs D., Teichert M., Luxford C. and Schneider J., (Manuscript in preparation) A Comparison of Observed Scores, Partial Credit Schemes, and Modeled Scores Among Chemistry Students of Different Ability Groupings.
- Pinheiro J., Douglas B., DebRoy S., Sarkar D. and R Core Team, (2020), nlme (R package version 3.1–144), https://cran.r-project.org/package=nlme.
- R Core Team, (2022), R: A Language and Environment for Statistical Computing, Vienna, Austria: R Foundation for Statistical Computing, https://www.R-project.org/.
- Risley J. M., (2007), Reworking Exams To Teach Chemistry Content and Reinforce Student Learning, J. Chem. Educ., 84(9), 1445 DOI:10.1021/ed084p1445.
- Rizopoulos D., (2006), ltm: An R package for Latent Variable Modelling and Item Response Theory Analyses. J. Stat. Softw., 17(5), 1–25 DOI:10.18637/jss.v017.i05.
- Roediger H. L. and Karpicke J. D., (2006), Test-enhanced learning: taking memory tests improves long-term retention. Psychol. Sci., 17(3), 249–255 DOI:10.1111/j.1467-9280.2006.01693.x.
- Roediger H. L. and Marsh E. J., (2005), The Positive and Negative Consequences of Multiple-Choice Testing. J Exp. Psychol. Learn. Mem. Cogn., 31(5), 1155–1159 DOI:10.1037/0278-7393.31.5.1155.
- Rowland C. A., (2014), The Effect of Testing Versus Restudy on Retention: A Meta-Analytic Review of the Testing Effect. Psychol. Bull., 140(6), 1432–1463 DOI:10.1037/a0037559.
- Schneider J. L., Hein S. M. and Murphy K. L., (2014), Feedback in testing, the missing link, ACS Symposium Ser., 1182, 93–112 DOI:10.1021/bk-2014-1182.ch006.
- Schreurs D., Trate J., Srinivasan S., Teichert M., Luxford C., Schneider J. and Murphy K., (2024), Investigation into the intersection between response process validity and answer-until-correct validity: Development of the Repeated Attempt Processing Issue Detection (RAPID) method, Chem. Educ. Res. Pract., 2024, 25, 560–576 10.1039/D3RP00204G.
- Schurmeier K. D., Atwood C. H., Shepler C. G. and Lautenschlager G. J., (2010), Using item response theory to assess changes in student performance based on changes in question wording, J. Chem. Educ., 87(11), 1268–1272 DOI:10.1021/ed100422c.
- Todd K., Therriault D. J. and Angerhofer A., (2021), Improving students’ summative knowledge of introductory chemistry through the forward testing effect: examining the role of retrieval practice quizzing, Chem. Educ. Res. Pract., 22(1), 175–181 10.1039/d0rp00185f.
- Trate J. M., Teichert M. A., Murphy K. L., Srinivasan S., Luxford C. J. and Schneider J. L., (2020), Remote Interview Methods in Chemical Education Research, J. Chem. Educ., 97(9), 2421–2429 DOI:10.1021/acs.jchemed.0c00680.
- Van Gog T., Kester L., Dirkx K., Hoogerheide V., Boerboom J. and Verkoeijen P. P. J. L., (2015), Testing After Worked Example Study Does Not Enhance Delayed Problem-Solving Performance Compared to Restudy, Educ. Psychol. Rev., 27(2), 265–289 DOI:10.1007/s10648-015-9297-3.
- Van Gog T. and Sweller J., (2015), Not New, but Nearly Forgotten: the Testing Effect Decreases or even Disappears as the Complexity of Learning Materials Increases, Educ. Psychol. Rev., 27(2), 247–264 DOI:10.1007/s10648-015-9310-x.
- Wheeler M. A., Ewers M. and Buonanno J. F., (2003), Different rates of forgetting following study versus test trials, Memory, 11(6), 571–580 DOI:10.1080/09658210244000414.
- Wickham H. and Bryan J., (2019), readxl: Read Excel Files.
- Woltman H., Feldstain A., Mackay J. C., Rocchi M., Woltman H., Feldstain A. and Rocchi M., (2012), An introduction to hierarchical linear modeling, 8(1), 52–69.
- Wright J. H. and Gescheider G. A., (1970), Role of Immediate and Delayed Knowledge of Results in Paired-Associate Learning under the Anticipation Procedure, J Psychol, 74(2), 249–257 DOI:10.1080/00223980.1970.9923736.
Footnotes |
| † Electronic supplementary information (ESI) available. See DOI: https://doi.org/10.1039/d4rp00077c |
| ‡ Now located at: University of Wisconsin-Madison, Madison, Wisconsin 53706. |
| § Now located at: Auburn University, Auburn, Alabama 36849. |
| This journal is © The Royal Society of Chemistry 2024 |