 Open Access Article
Creative Commons Attribution 3.0 Unported Licence
Optimisation of greener and more efficient 1,7-octadiene epoxidation catalysed by a polymer-supported Mo(VI) complex via response surface methodology
Md Masud Rana
Bhuiyan
 and
Basudeb
Saha
 *
*
School of Engineering, Lancaster University, Lancaster LA1 4YW, UK. E-mail: b.saha@lancaster.ac.uk
First published on 28th February 2024
Abstract
In this study, a greener and more efficient alkene epoxidation process has been developed using a heterogeneous polybenzimidazole supported Mo(VI) catalyst and tert-butyl hydroperoxide (TBHP) as an oxidising reagent. Polybenzimidazole supported Mo(VI) complex, i.e., PBI·Mo has been prepared, characterised, and evaluated successfully. Batch epoxidation experiments have been carried out in a jacketed stirred batch reactor to evaluate the catalytic activity and stability of PBI·Mo catalyst for the epoxidation of 1,7-octadiene. The suitability and efficiency of the catalyst have been compared by studying the effect of four independent factors such as reaction temperature, the feed mole ratio of 1,7-octadiene to TBHP, catalyst loading, and reaction time on the yield of 1,2-epoxy-7-octene for optimisation of reaction conditions. Response surface methodology (RSM) using Box–Behnken design (BBD) was employed for designing experimental runs and studying the interaction effect of different variables on the reaction response. A quadratic regression model has been developed representing an empirical relationship between reaction variables and response. To determine the adequacy of the predicted model, numerous statistical validation techniques including analysis of variance (ANOVA) have been applied at a 95% confidence level. The numerical optimisation technique concluded that the maximum yield that can be reached is 66.22% at a feed molar ratio of 7.97![[thin space (1/6-em)]](https://www.rsc.org/images/entities/char_2009.gif) :
:![[thin space (1/6-em)]](https://www.rsc.org/images/entities/char_2009.gif) 1, reaction temperature of 347 K, 0.417 mol% catalyst loading, and reaction time of 218 min. The predicted optimal conditions have been validated experimentally with a 1.92% relative error.
1, reaction temperature of 347 K, 0.417 mol% catalyst loading, and reaction time of 218 min. The predicted optimal conditions have been validated experimentally with a 1.92% relative error.
Introduction
Alkene epoxidation has been established as an important process for chemical synthesis because it enables the direct oxidation of two adjacent carbon atoms from an alkene using catalysts made of transition metal complexes and oxidising agents such hydroperoxides, peracids, or molecular oxygen in the presence of oxidising reagents.1–3 The three-membered ring unit of epoxide shows straightforward elaboration to useful new functionality by opening the epoxide ring.4 The resultant epoxide acts as a raw material or intermediate that can be transformed into many useful substances such as plasticizers, perfumes, and epoxy resins.5 The importance of epoxides has made the alkene epoxidation reaction one of the most widely studied reactions in organic chemistry.6 In the fine chemical industries, the conventional epoxidation method represents stoichiometric peracids e.g., peracetic acid and m-chloroperbenzoic acid or chlorohydrin as oxidising agents in liquid phase batch reactions.7,8 This process has the drawback that using these reagents is not environmentally friendly because peracids produce an equivalent amount of acid waste while chlorohydrin produces chlorinated by-products.8 Additionally, there are security concerns related to the handling and storage of peracid.9 The Halcon process, which is catalysed by homogeneous Mo(VI) or heterogeneous Ti(IV) supported on SiO2, is another important liquid phase epoxidation.10 Due to corrosion and deposition on the reactor, as well as significant requirements in terms of work-up, product isolation, and purification techniques, homogeneous catalysed epoxidation methods are not economically viable for industrial applications.11 There is a great need for safer epoxidation processes that generate little waste. Because of this, efforts have been made to develop more environmentally friendly and effective epoxidation processes that use a heterogeneous catalyst and a safe oxidant.Various attempts have been made to find acceptable heterogeneous catalysts for epoxidation by immobilisation of catalytically active metal species on organic or inorganic materials, such as silica,12,13 zeolites,14,15 alumina,16,17 ion-exchange resins,18,19 polymers, and metal–organic frameworks.20 However, polymer-supported heterogeneous catalysts have been successfully used for the synthesis of epoxides in recent years in the presence of alkyl hydroperoxide as an oxidant and have shown high catalytic activity and product selectivity.21 Due to polymers' stability, inertness, nontoxicity, and insoluble nature, polymers have attracted attention as potential substrates for catalysts. However, despite numerous published works on polymer-supported Mo(VI) catalysts in the epoxidation of different alkene substrates, there appears to be no report yet on the epoxidation of 1,7-octadiene with tert-butyl hydroperoxide as an oxidising reagent in the presence of polymer-supported Mo(VI) catalyst.
In this process, an efficient and selective polybenzimidazole supported molybdenum(VI) complex (PBI·Mo) has been used as a catalyst for the batch epoxidation of 1,7-octadiene. This system is free of solvents and uses the environmentally friendly TBHP as an oxidant. Experiments have been carried out to study the effect of different parameters including reaction temperature, feed molar ratio of alkene to TBHP, and catalyst loading on the yield of 1,2-epoxy-7-octene to optimize the reaction conditions in a classical batch reactor. A quadratic regression model has been developed representing an empirical relationship between reaction variables and response. Response surface methodology (RSM) using Box–Behnken design (BBD) was employed for designing experimental runs and studying the interaction effect of different variables on the reaction response. This study presents the optimization of 1,7-octadiene epoxidation using TBHP as an oxidant and polymer-supported Mo(VI) complex as a catalyst in a batch reactor.
Materials and methods
Materials
All chemicals used during catalyst preparation were purchased from Sigma-Aldrich Co Ltd. and gas chromatography (GC) was used to verify the purity of the chemicals. Microporous polybenzimidazole (PBI) resin beads were supplied by Celanese Corporation, USA. The preparation of polybenzimidazole supported Mo(VI) complex, i.e., PBI·Mo catalyst was carried out using sodium hydroxide (purum p.a. ≥98%), deionised water, acetone, molybdenyl acetylacetonate (MoO2(acac)2) (99%), and toluene (anhydrous, 99.8%). Reactants involved in this study were 1,7-octadiene (97%) and tert-butyl hydroperoxide (TBHP) solution in water (70% (w/w)). The water content of TBHP was removed by the Dean–Stark apparatus from the toluene solution and the concentration of the resulting TBHP solution was determined by iodometric titration. The concentration of TBHP in toluene was found to be 3.57 mol L−1. The quantification of samples collected from the reactor was carried out using the internal standard method in the GC and iso-octane (anhydrous, 99.8%) was used as an internal standard.Preparation and characterisation of polymer-supported Mo(VI) catalyst
PBI has a high degree of thermal stability as PBI can be heated at high temperatures, and it never melts or burns.22 These characteristics make PBI resin ideal for a range of uses, including ion-exchange, separations, purifications, and support for polymer-supported catalysts.9 NaOH solution (1 M) was used to stir wet polybenzimidazole (PBI) resin beads. The polymer beads were then washed with deionised water; then acetone was used to wash the polymer beads. Thereafter, the beads were collected and dried under a vacuum at 40 °C. The treated PBI resin was refluxed with excess MoO2(acac)2 in anhydrous toluene for a period of 4 days. The PBI·Mo catalyst particles were separated by filtration at the end of the reaction and excess MoO2(acac)2 was removed by exhaustive extraction with acetone. The green colour disappeared by washing upon repeated introduction of fresh solvent until the solution remained colourless. It was observed that molybdenum in the produced catalysts was uniformly distributed throughout the polymer. The synthesis of polybenzimidazole supported Mo(VI) (PBI·Mo) catalyst is shown in Fig. 1. Malvern Mastersizer was used to determine the particle size distribution of PBI·Mo catalyst. Brunauer–Emmett–Teller (BET) surface area, pore volume, and pore diameter were determined by nitrogen adsorption and desorption method using Micromeritics Gemini VII. The molybdenum content of the prepared catalysts was analysed using a PerkinElmer NexION 350D spectrophotometer. The properties of the prepared PBI·Mo catalyst are given in Table 1.| Catalyst properties | PBI·Mo catalyst |
|---|---|
| BET surface area | 18.44 m2 g−1 |
| Pore volume | 0.021986 cm3 g−1 |
| Mo loading (mmol Mo per g resin) | 0.825 |
| Average pore diameter | 21.595 Å |
| Average particle size | 210–295 μm |
Experimental design
Response surface methodology (RSM) is a collection of statistical and mathematical techniques for designing, modifying, and optimising processes. It is a useful tool for examining the interactions between factors and quantitatively illustrating how certain parameters affect measured responses.23 RSM was designed to identify the optimal conditions for epoxide production by examining the relationship between each variable and the response yield. The Box–Behnken design (BBD) method is one of the RSM techniques used to examine the significant effect of process factors on the response.24 Moreover, it examines how the interactions between the factors affect the response.25 The experimental runs have been operated based on 4 independent variables including reaction feed molar ratio of 1,7-octadiene to TBHP, reaction temperature, catalyst loading, and reaction time which were labelled as A, B, C, and D respectively. Three levels for each variable have been coded as −1, 0, +1 as shown in Table 2. The yield of 1,2-epoxy-7-octene has been selected as the response for this study. The studies were finished in a random order to reduce the impact of unexplained inconsistency in the response.26 Design Expert 13 software (Stat-Ease Inc., Minneapolis, MN, USA) was used to identify and operate the experimental design procedures. Twenty-nine runs were carried out randomly, and their responses were determined based on the outcomes of the experiment as shown in Table 3 (actual yield).27| Factors | Code | Levels | ||
|---|---|---|---|---|
| −1 | 0 | 1 | ||
| FMR | A | 2.5 | 6.25 | 10 |
| Temperature (K) | B | 333 | 343 | 353 |
| Catalyst loading (mol%) | C | 0.15 | 0.375 | 0.6 |
| Time (min) | D | 0 | 130 | 260 |
| Run | FMR | Temperature (K) | Catalyst loading (mol%) | Time (min) | Actual yield | Predicted yield |
|---|---|---|---|---|---|---|
| (A) | (B) | (C) | (D) | (%) | (%) | |
| 1 | 6.25 | 353 | 0.15 | 130 | 49.88 | 47.48 |
| 2 | 6.25 | 343 | 0.375 | 130 | 52.29 | 52.29 |
| 3 | 10 | 343 | 0.375 | 0 | 0 | −0.7667 |
| 4 | 10 | 333 | 0.375 | 130 | 38.61 | 40.59 |
| 5 | 6.25 | 343 | 0.375 | 130 | 52.29 | 52.29 |
| 6 | 6.25 | 343 | 0.6 | 0 | 0 | 2.41 |
| 7 | 6.25 | 333 | 0.15 | 130 | 37.23 | 38.01 |
| 8 | 6.25 | 333 | 0.375 | 260 | 51 | 47.82 |
| 9 | 6.25 | 333 | 0.375 | 0 | 0 | −2.59 |
| 10 | 2.5 | 343 | 0.375 | 0 | 0 | −1.60 |
| 11 | 6.25 | 343 | 0.375 | 130 | 52.29 | 52.29 |
| 12 | 2.5 | 343 | 0.375 | 260 | 48.38 | 47.48 |
| 13 | 2.5 | 353 | 0.375 | 130 | 44.32 | 44.10 |
| 14 | 6.25 | 353 | 0.375 | 0 | 0 | 3.09 |
| 15 | 6.25 | 343 | 0.15 | 260 | 53.46 | 52.81 |
| 16 | 10 | 343 | 0.15 | 130 | 41.2 | 42.33 |
| 17 | 6.25 | 343 | 0.15 | 0 | 0 | −0.5350 |
| 18 | 10 | 343 | 0.6 | 130 | 54.47 | 52.70 |
| 19 | 10 | 353 | 0.375 | 130 | 53.57 | 53.06 |
| 20 | 6.25 | 353 | 0.375 | 260 | 61.23 | 63.73 |
| 21 | 6.25 | 343 | 0.6 | 260 | 57.82 | 60.11 |
| 22 | 6.25 | 333 | 0.6 | 130 | 41.07 | 41.81 |
| 23 | 10 | 343 | 0.375 | 260 | 61.28 | 61.21 |
| 24 | 2.5 | 343 | 0.6 | 130 | 41.38 | 40.16 |
| 25 | 2.5 | 343 | 0.15 | 130 | 38.62 | 40.30 |
| 26 | 6.25 | 353 | 0.6 | 130 | 56.38 | 53.93 |
| 27 | 6.25 | 343 | 0.375 | 130 | 52.29 | 52.29 |
| 28 | 6.25 | 343 | 0.375 | 130 | 52.29 | 52.29 |
| 29 | 2.5 | 333 | 0.375 | 130 | 32.72 | 34.99 |
Statistical analysis
To fit the experimental response with the independent variables, a model equation was developed.28 The mathematical model was defined using the general quadratic model as shown in eqn (1). | (1) |
The adequacy of the predicted models was checked by several statistical validations including coefficient of correlation (R2), adjusted coefficient of determination (Radj2) and the predicted coefficient of determination (Rpred2). The statistical significance of the predicted models was analysed by ANOVA using Fisher's test, i.e., F-test at a 95% confidence interval. The statistical significance of the results was presented by p-value, where the result is significant when the p-value is less than 0.05. Design Expert 13 software (Stat-Ease Inc., Minneapolis, MN, USA) was used to perform the initial experimental design, model prediction, statistical analysis, and optimisation.
Batch epoxidation studies
A 0.25 L jacketed four-neck glass reactor was used for the batch epoxidation of 1,7-octadiene with TBHP as the oxidant in the presence of a polymer-supported Mo(VI) catalyst. The condenser, overhead stirrer, digital thermocouple, sampling point, and water bath were all included in the batch reactor's setup. Known quantities of 1,7-octadiene and TBHP were weighed out and added to the reactor vessel and stirrer speed was set at 400 rpm. The feed molar ratio (FMR) of 1,7-octadiene to TBHP of 2.5![[thin space (1/6-em)]](https://www.rsc.org/images/entities/char_2009.gif) :
:![[thin space (1/6-em)]](https://www.rsc.org/images/entities/char_2009.gif) 1–10
1–10![[thin space (1/6-em)]](https://www.rsc.org/images/entities/char_2009.gif) :
:![[thin space (1/6-em)]](https://www.rsc.org/images/entities/char_2009.gif) 1 was selected for charging the reactor. The temperature of the reaction mixture was allowed to reach the desired value, i.e., 333–353 K, and was maintained throughout the batch experiment. When the reaction reached the correct temperature, a known quantity of catalyst (0.15–0.6 mol% Mo loading) was added. The reaction scheme for the epoxidation of 1,7-octadiene with TBHP is shown in Fig. 2.
1 was selected for charging the reactor. The temperature of the reaction mixture was allowed to reach the desired value, i.e., 333–353 K, and was maintained throughout the batch experiment. When the reaction reached the correct temperature, a known quantity of catalyst (0.15–0.6 mol% Mo loading) was added. The reaction scheme for the epoxidation of 1,7-octadiene with TBHP is shown in Fig. 2.
A sample was collected after the catalyst was added and the time was noted as zero time, i.e., t = 0. Subsequent samples were taken from the reaction mixture at specific time intervals and recorded. The samples collected were analysed using Shimadzu GC-2014 gas chromatography (GC).
Method of analysis
A specific quantity of internal standard (iso-octane) was added to samples and Shimadzu GC-2014 gas chromatography was used to analyse all the reactant and product compositions. The instrument was fitted with a flame ionisation detector (FID), auto-injector, and a 30 m long Econo-CapTM-5 (ECTM-5) capillary column. Helium was used as a carrier gas. The flow rate of carrier gas was 1 mL min−1. The split ratio was 100![[thin space (1/6-em)]](https://www.rsc.org/images/entities/char_2009.gif) :
:![[thin space (1/6-em)]](https://www.rsc.org/images/entities/char_2009.gif) 1 and an injection volume of 0.5 μL was selected. The temperature for both the injector and detector was 523 K. The oven temperature was maintained at 313 K for 4 minutes after the sample was injected and ramped from 313 K to 498 K at a rate of 20 °C per minute. Each sample takes ∼13 min to be analysed by GC and the temperature was cooled back to 313 K before starting the next run.
1 and an injection volume of 0.5 μL was selected. The temperature for both the injector and detector was 523 K. The oven temperature was maintained at 313 K for 4 minutes after the sample was injected and ramped from 313 K to 498 K at a rate of 20 °C per minute. Each sample takes ∼13 min to be analysed by GC and the temperature was cooled back to 313 K before starting the next run.
Results and discussion
Development of regression model and adequacy checking
The predicted model was examined for adequacy in reporting any errors associated with the assumptions of normality. After performing the 29 experiments as shown in Table 3 and evaluating the yield of 1,2-epoxy-7-octene (reaction response) for each run, the response analysis using BBD has been applied. Design Expert software generated an equation of regression representing an empirical relationship between the response variable and the reaction parameters. By fitting the experimental results, the generic quadratic equation shown in eqn (1) was used to obtain a model of polynomial regression. The polynomial equation is shown in eqn (2).| Y = +52.29 + 3.64A + 5.40B + 2.56C + 27.76D + 0.8400AB + 2.63AC + 3.23AD + 0.6650BC + 2.56BD + 1.09CD − 5.27A2 − 3.84B2 − 3.15C2 − 20.44D2 | (2) |
The developed models have demonstrated the effect of each independent variable, variable interactions, and excess of each variable on the response. The positive sign of each variable coefficient represents the synergetic effect of the variable on the response. However, the negative sign represents the antagonistic effect on the response.29
It is clear from eqn (2), that the linear terms of feed molar ratio, temperature, catalyst loading, and time had positive coefficients, but their quadratic terms had negative coefficients. This would indicate that an increase in feed molar ratio, temperature, catalyst loading, and time to a certain extent, could increase the epoxide yield. However, a reduction in the epoxide yield could have occurred when applying too high a feed molar ratio, temperature, catalyst loading, and time.
ANOVA has been applied to examine the significance of the model parameters at a 95% confidence level. The significance of each parameter has been determined by F-test and p-value. The higher the value of the F-test and the smaller the p-value, the more significant the corresponding parameter.30
ANOVA has been used to validate the RSM model coefficient using the F-test and p-value. These values have been concluded as 159.75 and <0.0001, respectively as shown in Table 4 which proves that the developed quadratic model is statistically significant with a 95% confidence level. The determination coefficient values, R2 and Radj2, which measure the reliability of the model fitting, have been calculated to be 0.9938 and 0.9876, respectively. The adequate precision is 38.74 which is desirable and ensures the model fitting to the experimental data.
| Source | Sum of squares | df | Mean square | F-Value | p-Value | Significance |
|---|---|---|---|---|---|---|
| Model | 12![[thin space (1/6-em)]](https://www.rsc.org/images/entities/char_2009.gif) 671.98 671.98 |
14 | 905.14 | 159.75 | <0.0001 | Significant |
| A-FMR | 159.21 | 1 | 159.21 | 28.10 | 0.0001 | Significant |
| B-Temperature | 349.38 | 1 | 349.38 | 61.66 | <0.0001 | Very significant |
| C-Catalyst loading | 78.69 | 1 | 78.69 | 13.89 | 0.0023 | Significant |
| D-Time | 9250.19 | 1 | 9250.19 | 1632.59 | <0.0001 | Very significant |
| AB | 2.82 | 1 | 2.82 | 0.4981 | 0.4919 | Not significant |
| AC | 27.62 | 1 | 27.62 | 4.87 | 0.0445 | Significant |
| AD | 41.60 | 1 | 41.60 | 7.34 | 0.0169 | Significant |
| BC | 1.77 | 1 | 1.77 | 0.3122 | 0.5852 | Not significant |
| BD | 26.16 | 1 | 26.16 | 4.62 | 0.0496 | Significant |
| CD | 4.75 | 1 | 4.75 | 0.8388 | 0.3753 | Not significant |
| A 2 | 180.06 | 1 | 180.06 | 31.78 | <0.0001 | Very significant |
| B 2 | 95.46 | 1 | 95.46 | 16.85 | 0.0011 | Significant |
| C 2 | 64.31 | 1 | 64.31 | 11.35 | 0.0046 | Significant |
| D 2 | 2710.34 | 1 | 2710.34 | 478.36 | <0.0001 | Very significant |
| Residual | 79.32 | 14 | 5.67 | |||
| Lack of fit | 79.32 | 10 | 7.93 | |||
| Pure error | 0.0000 | 4 | 0.0000 | |||
| Cor total | 12![[thin space (1/6-em)]](https://www.rsc.org/images/entities/char_2009.gif) 751.31 751.31 |
28 |
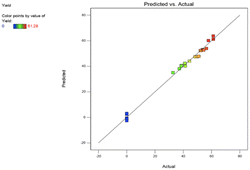
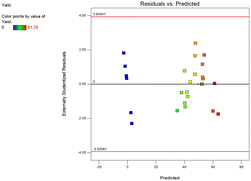
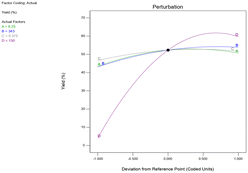
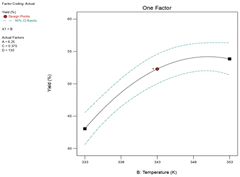
The model performance has been observed using different techniques. A plot of the predicted versus experimental result of the yield of epoxide in Fig. 3 showed a high correlation and reasonable agreement. The good estimate for the response values from the model is concluded from the similarity between the predicted and actual experimental results as shown in Fig. 3. In addition, a plot of residual distribution versus predicted response has been presented to check the fitting performance of the model as shown in Fig. 4. Residual value is defined as the difference between predicted and experimental values of the response variable. The plot confirms that the quadratic model adequately represents the experimental data as the distribution does not follow a specified trend with respect to the predicted values of the response variable. Moreover, the perturbation plot represents the effect of each variable on the reaction response as shown in Fig. 5. The curvature of the variables from the centre point indicates the significance of each variable which confirms the statistical results obtained from ANOVA as shown in Table 4. Sharp curvature of the independent variables, e.g., time (D) and temperature (B) indicates their high significance as seen from the ANOVA results. It also represents the significance of feed molar ratio and catalyst loading. The plot indicates that time and temperature have progressively increasing effects on the yield of epoxide until reaching the central point and catalyst loading (C) is the least significant parameter.
Response surface plots analysis
3D response surface plots and their corresponding 2D contour plots were created for a model equation after constructing the regression model and evaluating the model adequacy. Different contour plot shapes represent differing levels of interaction between two variables. For example, an oval plot indicates strong interactions between the two specified variables, but a circular plot indicates otherwise.31 3D response surfaces help in understanding system behaviour. Additionally, it helps in identifying the reaction surface's characters.32,33Effect of one factor at a time experiments on response (OFAT)
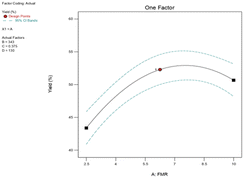
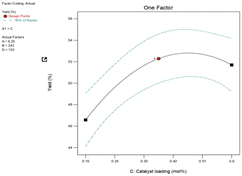
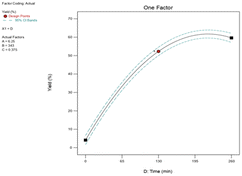
The 3D-surface and 2D-contour plots produced from the anticipated quadratic model have been used to investigate the effects of each independent process variable (feed molar ratio, temperature, catalyst loading, and time) and their interactions on reaction responses (epoxide yield), as shown in Fig. 6–9. The experiments have been carried out by varying one reaction parameter at a time while keeping other parameters constant at the following reaction conditions: feed molar ratio 6.25![[thin space (1/6-em)]](https://www.rsc.org/images/entities/char_2009.gif) :
:![[thin space (1/6-em)]](https://www.rsc.org/images/entities/char_2009.gif) 1, reaction temperature 343 K, catalyst loading 0.375 (mol%), and time 130 min.
1, reaction temperature 343 K, catalyst loading 0.375 (mol%), and time 130 min.
![[thin space (1/6-em)]](https://www.rsc.org/images/entities/char_2009.gif) :
:![[thin space (1/6-em)]](https://www.rsc.org/images/entities/char_2009.gif) 1 and 10
1 and 10![[thin space (1/6-em)]](https://www.rsc.org/images/entities/char_2009.gif) :
:![[thin space (1/6-em)]](https://www.rsc.org/images/entities/char_2009.gif) 1. Fig. 6 demonstrates that the rate of epoxide production increased steadily from 43.38% to 53% as the feed molar ratio increased from 2.5
1. Fig. 6 demonstrates that the rate of epoxide production increased steadily from 43.38% to 53% as the feed molar ratio increased from 2.5![[thin space (1/6-em)]](https://www.rsc.org/images/entities/char_2009.gif) :
:![[thin space (1/6-em)]](https://www.rsc.org/images/entities/char_2009.gif) 1 to 7.6
1 to 7.6![[thin space (1/6-em)]](https://www.rsc.org/images/entities/char_2009.gif) :
:![[thin space (1/6-em)]](https://www.rsc.org/images/entities/char_2009.gif) 1. However, when the FMR of an alkene to TBHP is raised from 7.85
1. However, when the FMR of an alkene to TBHP is raised from 7.85![[thin space (1/6-em)]](https://www.rsc.org/images/entities/char_2009.gif) :
:![[thin space (1/6-em)]](https://www.rsc.org/images/entities/char_2009.gif) 1 to 10
1 to 10![[thin space (1/6-em)]](https://www.rsc.org/images/entities/char_2009.gif) :
:![[thin space (1/6-em)]](https://www.rsc.org/images/entities/char_2009.gif) 1, epoxide formation is slowed. Fig. 6 suggests that alkene concentration affects the epoxidation of alkenes using a PBI catalyst.9 Ambroziak et al.34 mentioned that increasing the feed molar ratio lowers the TBHP concentration to such an extent that it slows down the conversion of TBHP into epoxide. A similar feed molar ratio effect was reported in my previous published results;35 it has been demonstrated that there was no significant difference in the rate of epoxidation when the feed molar ratio of 1,5-hexadiene to TBHP was increased from 2.5
1, epoxide formation is slowed. Fig. 6 suggests that alkene concentration affects the epoxidation of alkenes using a PBI catalyst.9 Ambroziak et al.34 mentioned that increasing the feed molar ratio lowers the TBHP concentration to such an extent that it slows down the conversion of TBHP into epoxide. A similar feed molar ratio effect was reported in my previous published results;35 it has been demonstrated that there was no significant difference in the rate of epoxidation when the feed molar ratio of 1,5-hexadiene to TBHP was increased from 2.5![[thin space (1/6-em)]](https://www.rsc.org/images/entities/char_2009.gif) :
:![[thin space (1/6-em)]](https://www.rsc.org/images/entities/char_2009.gif) 1 to 10
1 to 10![[thin space (1/6-em)]](https://www.rsc.org/images/entities/char_2009.gif) :
:![[thin space (1/6-em)]](https://www.rsc.org/images/entities/char_2009.gif) 1.
1.
Effect of process variables and their interactions
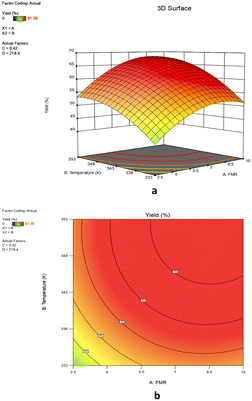
Using ANOVA findings, 3D surface, and 2D contour plots, the interaction effect of each pair of reaction variables has been examined. When different levels of other variables are present, the interaction effect of specific process factors on epoxide yield produces different effects. The 3D-surface and 2D contour plots of the epoxide yield versus the interaction of two independent variables are displayed. The two remaining independent variables were kept constant at their centre points in each plot. When it comes to establishing precise forecasts about process optimization, 3D graphs have been instrumental.36 According to ANOVA Table 4, all four reaction parameters are regarded as significant and have a significant impact on the process response at various levels of interaction. As a result, the interaction between process variables directly affects system optimization. Nandiwale and Bokade reported that if the contour plot of the response surface is circular, the interaction impact between a pair of variables would be insignificant. On the other hand, if the contour plot is elliptical, the interaction effect would be significant.37 Therefore, the interactions were examined, which is important for a comprehensive optimization study, rather than just analysing a single variable (as in the conventional method).![[thin space (1/6-em)]](https://www.rsc.org/images/entities/char_2009.gif) :
:![[thin space (1/6-em)]](https://www.rsc.org/images/entities/char_2009.gif) 1), an increase in the reaction temperature from 333 K to 348 K increases the epoxide yield from 40.6% to 53.4%. An increase in feed molar ratio 2.5
1), an increase in the reaction temperature from 333 K to 348 K increases the epoxide yield from 40.6% to 53.4%. An increase in feed molar ratio 2.5![[thin space (1/6-em)]](https://www.rsc.org/images/entities/char_2009.gif) :
:![[thin space (1/6-em)]](https://www.rsc.org/images/entities/char_2009.gif) 1 to 8.5
1 to 8.5![[thin space (1/6-em)]](https://www.rsc.org/images/entities/char_2009.gif) :
:![[thin space (1/6-em)]](https://www.rsc.org/images/entities/char_2009.gif) 1 gave 53.4% and 68% yield of 1,2-epoxy-7-octene, respectively at 353 K. However, when the feed molar ratio of 1,7-octadiene to TBHP was beyond 8.5
1 gave 53.4% and 68% yield of 1,2-epoxy-7-octene, respectively at 353 K. However, when the feed molar ratio of 1,7-octadiene to TBHP was beyond 8.5![[thin space (1/6-em)]](https://www.rsc.org/images/entities/char_2009.gif) :
:![[thin space (1/6-em)]](https://www.rsc.org/images/entities/char_2009.gif) 1 there was no significant difference in the percentage yield of epoxidation (Fig. 10a). Increasing the feed molar ratio decreases the TBHP concentration to such an extent that it inhibits the conversion of TBHP into epoxide, which is the reason for the reduced epoxide yield. Furthermore, at a different level of interaction between feed molar ratio and temperature (e.g., from 8.5
1 there was no significant difference in the percentage yield of epoxidation (Fig. 10a). Increasing the feed molar ratio decreases the TBHP concentration to such an extent that it inhibits the conversion of TBHP into epoxide, which is the reason for the reduced epoxide yield. Furthermore, at a different level of interaction between feed molar ratio and temperature (e.g., from 8.5![[thin space (1/6-em)]](https://www.rsc.org/images/entities/char_2009.gif) :
:![[thin space (1/6-em)]](https://www.rsc.org/images/entities/char_2009.gif) 1 to 10
1 to 10![[thin space (1/6-em)]](https://www.rsc.org/images/entities/char_2009.gif) :
:![[thin space (1/6-em)]](https://www.rsc.org/images/entities/char_2009.gif) 1 and 347–353 K), another noticeable effect was the steady drop in epoxide yield, an indication that the optimal conditions had been reached. This shows that variation in feed molar ratio had a negative effect on the yield of 1,2-epoxy-7-octene at higher values. As a result, the process response is significantly influenced by the relationship between feed molar ratio and temperature. A mutual interactive effect of the reaction variables on response is demonstrated by the elliptical shape of the 2D contour plot in Fig. 10b.
1 and 347–353 K), another noticeable effect was the steady drop in epoxide yield, an indication that the optimal conditions had been reached. This shows that variation in feed molar ratio had a negative effect on the yield of 1,2-epoxy-7-octene at higher values. As a result, the process response is significantly influenced by the relationship between feed molar ratio and temperature. A mutual interactive effect of the reaction variables on response is demonstrated by the elliptical shape of the 2D contour plot in Fig. 10b.
![[thin space (1/6-em)]](https://www.rsc.org/images/entities/char_2009.gif) :
:![[thin space (1/6-em)]](https://www.rsc.org/images/entities/char_2009.gif) 1). An increase in feed molar ratio 2.5
1). An increase in feed molar ratio 2.5![[thin space (1/6-em)]](https://www.rsc.org/images/entities/char_2009.gif) :
:![[thin space (1/6-em)]](https://www.rsc.org/images/entities/char_2009.gif) 1 to 8.5
1 to 8.5![[thin space (1/6-em)]](https://www.rsc.org/images/entities/char_2009.gif) :
:![[thin space (1/6-em)]](https://www.rsc.org/images/entities/char_2009.gif) 1 gave 53% and 67.1% yield of 1,2-epoxy-7-octene, respectively at 0.42 mol% Mo. However, the percentage yield of epoxidation did not differ significantly when the feed molar ratio of 1,7-octadiene to TBHP was greater than 8.5
1 gave 53% and 67.1% yield of 1,2-epoxy-7-octene, respectively at 0.42 mol% Mo. However, the percentage yield of epoxidation did not differ significantly when the feed molar ratio of 1,7-octadiene to TBHP was greater than 8.5![[thin space (1/6-em)]](https://www.rsc.org/images/entities/char_2009.gif) :
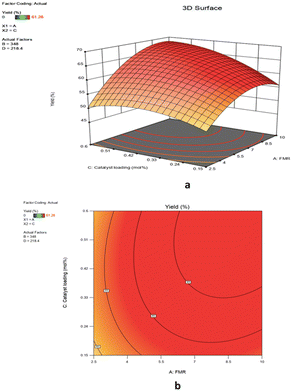
:![[thin space (1/6-em)]](https://www.rsc.org/images/entities/char_2009.gif) 1 and the catalyst loading was greater than 0.42 mol% Mo (Fig. 11a). The contour plot in Fig. 11b with an elliptical shape demonstrated the significant and combined effect of the catalyst loading and feed molar ratio. The result has also supported a lower p-value (0.0445) of the interaction AC term. As seen in Fig. 11a, the yield of 1,2-epoxy-7-octene increases proportionally with catalyst loading at any designated value between 0.15 mol% and 0.42 mol%. A low p-value (0.0023) also provided support for this observation.
1 and the catalyst loading was greater than 0.42 mol% Mo (Fig. 11a). The contour plot in Fig. 11b with an elliptical shape demonstrated the significant and combined effect of the catalyst loading and feed molar ratio. The result has also supported a lower p-value (0.0445) of the interaction AC term. As seen in Fig. 11a, the yield of 1,2-epoxy-7-octene increases proportionally with catalyst loading at any designated value between 0.15 mol% and 0.42 mol%. A low p-value (0.0023) also provided support for this observation.
![[thin space (1/6-em)]](https://www.rsc.org/images/entities/char_2009.gif) :
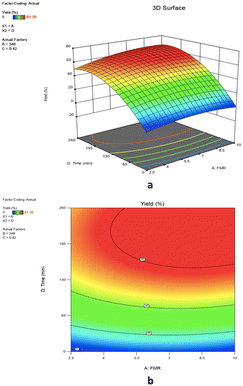
:![[thin space (1/6-em)]](https://www.rsc.org/images/entities/char_2009.gif) 1), the increase of reaction time from 0 min to 218 min improves the epoxide yield from 0% to 52.9%. Increasing the feed molar ratio from 2.5
1), the increase of reaction time from 0 min to 218 min improves the epoxide yield from 0% to 52.9%. Increasing the feed molar ratio from 2.5![[thin space (1/6-em)]](https://www.rsc.org/images/entities/char_2009.gif) :
:![[thin space (1/6-em)]](https://www.rsc.org/images/entities/char_2009.gif) 1 to 8.5
1 to 8.5![[thin space (1/6-em)]](https://www.rsc.org/images/entities/char_2009.gif) :
:![[thin space (1/6-em)]](https://www.rsc.org/images/entities/char_2009.gif) 1 resulted in yields of 1,2-epoxy-7-octene of 52.9% and 67.24%, respectively, after 218 minutes of reaction time. However, when the 1,7-octadiene to TBHP feed molar ratio was larger than 8.5
1 resulted in yields of 1,2-epoxy-7-octene of 52.9% and 67.24%, respectively, after 218 minutes of reaction time. However, when the 1,7-octadiene to TBHP feed molar ratio was larger than 8.5![[thin space (1/6-em)]](https://www.rsc.org/images/entities/char_2009.gif) :
:![[thin space (1/6-em)]](https://www.rsc.org/images/entities/char_2009.gif) 1 and the reaction time was greater than 218 minutes, the percentage yield of epoxidation did not change significantly (Fig. 12a). According to the 3D surface plot, the maximum epoxide yield (67.24%) was obtained at a reaction time of 218 minutes and a feed molar ratio of 8.5
1 and the reaction time was greater than 218 minutes, the percentage yield of epoxidation did not change significantly (Fig. 12a). According to the 3D surface plot, the maximum epoxide yield (67.24%) was obtained at a reaction time of 218 minutes and a feed molar ratio of 8.5![[thin space (1/6-em)]](https://www.rsc.org/images/entities/char_2009.gif) :
:![[thin space (1/6-em)]](https://www.rsc.org/images/entities/char_2009.gif) 1, showing that increasing the reaction time from 0 minutes to 218 minutes increases the yield of 1,2-epoxy-7-octene as shown in Fig. 12a. The results demonstrate a rise in epoxidation rate with increasing time. However, an increase in feed molar ratio of 1,7-octadiene to TBHP beyond 8.5
1, showing that increasing the reaction time from 0 minutes to 218 minutes increases the yield of 1,2-epoxy-7-octene as shown in Fig. 12a. The results demonstrate a rise in epoxidation rate with increasing time. However, an increase in feed molar ratio of 1,7-octadiene to TBHP beyond 8.5![[thin space (1/6-em)]](https://www.rsc.org/images/entities/char_2009.gif) :
:![[thin space (1/6-em)]](https://www.rsc.org/images/entities/char_2009.gif) 1 at 218 min of reaction time was unfavorable to the reactive system causing a marginal drop in epoxide yield from 67.24% to 66.66%. Response surface and contour plots of Fig. 12 clearly show that the yield of epoxide had a linear effect with increasing reaction time until the optimum condition was achieved. It can be concluded from the ANOVA Table 4 that the reaction time was found to be a highly influencing parameter on epoxide yield as evidenced by a low p-value (<0.0001).
1 at 218 min of reaction time was unfavorable to the reactive system causing a marginal drop in epoxide yield from 67.24% to 66.66%. Response surface and contour plots of Fig. 12 clearly show that the yield of epoxide had a linear effect with increasing reaction time until the optimum condition was achieved. It can be concluded from the ANOVA Table 4 that the reaction time was found to be a highly influencing parameter on epoxide yield as evidenced by a low p-value (<0.0001).
![[thin space (1/6-em)]](https://www.rsc.org/images/entities/char_2009.gif) :
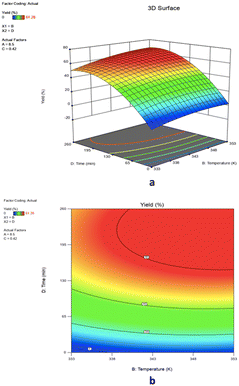
:![[thin space (1/6-em)]](https://www.rsc.org/images/entities/char_2009.gif) 1. The 3-D surface plot revealed that the yield of epoxide was 67.07% at a reaction time of 218 minutes and temperature of 348 K, suggesting that raising the reaction temperature from 333 K to 348 K increases epoxide yield as shown in Fig. 13a. The yield of epoxidation did not change considerably when the reaction temperature was raised above 348 K at 218 minutes. The yield of 1,2-epoxy-7-octene increased from 67.07% to 68.2% with a rise in reaction temperature from 348 K to 353 K. With an increase in reaction time from 218 minutes to 260 minutes at a reaction temperature of 348 K, the epoxide production slowly drops until it reaches 66.4%. In the presence of a PBI·Mo catalyst, Mohammed et al. and co-workers reported a similar outcome for the epoxidation of 1-hexene with TBHP.9 When cyclohexene and limonene were oxidized with TBHP using PBI·Mo catalyst, at 353 and 343 K, a similar effect was observed.39 The quality and stability of a product may also be impacted by chemical degradation or thermal decomposition losses at higher reaction temperatures.40 A strong and combined effect of the catalyst loading and feed molar ratio on epoxide yield was demonstrated by the elliptical-shaped contour plot in Fig. 13b. The result has also supported a lower p-value (0.0496) of the interaction BD term. The reaction temperature has been demonstrated as a highly affecting parameter on percentage yield, as evidenced by the low p-value (<0.0001) in ANOVA Table 4.
1. The 3-D surface plot revealed that the yield of epoxide was 67.07% at a reaction time of 218 minutes and temperature of 348 K, suggesting that raising the reaction temperature from 333 K to 348 K increases epoxide yield as shown in Fig. 13a. The yield of epoxidation did not change considerably when the reaction temperature was raised above 348 K at 218 minutes. The yield of 1,2-epoxy-7-octene increased from 67.07% to 68.2% with a rise in reaction temperature from 348 K to 353 K. With an increase in reaction time from 218 minutes to 260 minutes at a reaction temperature of 348 K, the epoxide production slowly drops until it reaches 66.4%. In the presence of a PBI·Mo catalyst, Mohammed et al. and co-workers reported a similar outcome for the epoxidation of 1-hexene with TBHP.9 When cyclohexene and limonene were oxidized with TBHP using PBI·Mo catalyst, at 353 and 343 K, a similar effect was observed.39 The quality and stability of a product may also be impacted by chemical degradation or thermal decomposition losses at higher reaction temperatures.40 A strong and combined effect of the catalyst loading and feed molar ratio on epoxide yield was demonstrated by the elliptical-shaped contour plot in Fig. 13b. The result has also supported a lower p-value (0.0496) of the interaction BD term. The reaction temperature has been demonstrated as a highly affecting parameter on percentage yield, as evidenced by the low p-value (<0.0001) in ANOVA Table 4.
Optimisation study of reaction variables
Due to regulatory regulations and rising intermediate manufacturing costs, there is an increasing quest for greener and more effective chemical synthesis methods. As a result, when investigating process optimum conditions and the interacting relationships between effective working variables, researchers are turning to RSM rather than more traditional optimization techniques. While using RSM, determining the best reaction parameters for a single answer is rather straightforward, while optimising many responses is more difficult.38 An optimisation process of the epoxidation reaction has been carried out to define the optimum values for the independent variables affecting the dependent response variable. Design Expert software has been used to develop the numerical optimisation step by combining the desirability of each independent variable into a single value and then searching for optimum values for the response goals. Accordingly, to determine the optimum conditions of the independent variables, a set of targets must be defined on the software to guide the optimisation process.30Table 5 shows the optimization targets for this study, the values have been set to maximize the process productivity.| Factor | Code | Goal | Limits | |
|---|---|---|---|---|
| Lower | Upper | |||
| FMR | A | In range | 2.5 | 10 |
| Temperature (K) | B | Minimise | 333 | 353 |
| Catalyst loading (mol%) | C | In range | 0.15 | 0.6 |
| Time (min) | D | Minimise | 0 | 260 |
| Epoxide yield | Y | Maximise | 30 | 68 |
The reaction temperature and time have both been targeted to minimal values to minimise production cost at a maximum economic benefit, while the dependent response variable, which is the yield of 1,2-epoxy-7-octene, has been set to be maximised to obtain the maximum yield. No specific target for catalyst loading has been established due to the catalyst's stability and efficiency at optimal conditions. The numerical optimisation technique concluded that the maximum yield that can be reached is 66.22% at a feed molar ratio of 7.97![[thin space (1/6-em)]](https://www.rsc.org/images/entities/char_2009.gif) :
:![[thin space (1/6-em)]](https://www.rsc.org/images/entities/char_2009.gif) 1, reaction temperature 347 K, 0.417 mol% catalyst loading, and reaction time of 218 min.
1, reaction temperature 347 K, 0.417 mol% catalyst loading, and reaction time of 218 min.
Optimum conditions validation
The main aim of this research is to identify optimal conditions for epoxide formation using the response surface methodology (RSM) technique. As a result, after finishing the five experiments which constitute the central point of the experimental design, the median value was taken to finish the experimental design and it has been proved statistically significant. To validate the optimal response values of the predicted quadratic equation, experiments have been performed at optimum conditions i.e., feed molar ratio of 7.97![[thin space (1/6-em)]](https://www.rsc.org/images/entities/char_2009.gif) :
:![[thin space (1/6-em)]](https://www.rsc.org/images/entities/char_2009.gif) 1, reaction temperature 347 K, 0.417 mol% catalyst loading, and reaction time of 218 min. The experimental results showed a similar response value to the predicted optimal response of 64.97% with a relative error of 1.92%. The relative error can be affected by the temperature variation of the reaction.
1, reaction temperature 347 K, 0.417 mol% catalyst loading, and reaction time of 218 min. The experimental results showed a similar response value to the predicted optimal response of 64.97% with a relative error of 1.92%. The relative error can be affected by the temperature variation of the reaction.
Conclusions
The polymer-supported Mo(VI) (PBI·Mo complex) has been prepared and characterized. Using TBHP as an oxidant, the performance of the catalyst was evaluated for the epoxidation of 1,7-octadiene in a jacketed stirred batch reactor. PBI·Mo catalyst has been proven to be active for batch reactions. Reaction variables and operating conditions of the reaction have been optimised. A quadratic polynomial model has been developed demonstrating the yield of 1,2-epoxy-7-octene in four independent variables. Batch epoxidation experiments were carried out to analyse the effect of temperature, the molar ratio of reactants, and catalyst loading on the yield of 1,2-epoxy-7-octene. The optimum conditions observed for the maximum yield of 1,2-epoxy-7 octene are a 7.97![[thin space (1/6-em)]](https://www.rsc.org/images/entities/char_2009.gif) :
:![[thin space (1/6-em)]](https://www.rsc.org/images/entities/char_2009.gif) 1 molar feed ratio of alkene to TBHP, 347 K reaction temperature, 218 min reaction time, and 0.417 mol% catalyst loading. The optimisation result has been validated experimentally resulting in an epoxide yield of 64.97%, which shows the adequacy of the predicted optimum conditions with a 1.92% relative error from the experimental results. This study demonstrates that polymer-supported Mo(VI) (PBI·Mo complex) could be used as an effective catalyst for a greener and more efficient epoxidation of 1,7-octaadiene with tert-butyl hydroperoxide (TBHP) as an oxidising reagent.
1 molar feed ratio of alkene to TBHP, 347 K reaction temperature, 218 min reaction time, and 0.417 mol% catalyst loading. The optimisation result has been validated experimentally resulting in an epoxide yield of 64.97%, which shows the adequacy of the predicted optimum conditions with a 1.92% relative error from the experimental results. This study demonstrates that polymer-supported Mo(VI) (PBI·Mo complex) could be used as an effective catalyst for a greener and more efficient epoxidation of 1,7-octaadiene with tert-butyl hydroperoxide (TBHP) as an oxidising reagent.
Author contributions
M. M. R. B. – methodology, software, validation, visualization, formal analysis, data curation, writing – original draft preparation; B. S. – conceptualization, writing – review and editing, formal analysis, data curation, resources, supervision, and project administration.Conflicts of interest
There are no conflicts to declare.References
- R. Mbeleck, M. L. Mohammed, K. Ambroziak, D. C. Sherrington and B. Saha, Catal. Today, 2015, 256, 287–293 CrossRef CAS.
- M. L. Mohammed and B. Saha, Energies, 2022, 15, 1–15 Search PubMed.
- R. Mbeleck, K. Ambroziak, B. Saha and D. C. Sherrington, React. Funct. Polym., 2007, 67, 1448–1457 CrossRef CAS.
- S. E. Schaus, B. D. Brandes, J. F. Larrow, M. Tokunaga, K. B. Hansen, A. E. Gould, M. E. Furrow and E. N. Jacobsen, J. Am. Chem. Soc., 2002, 124, 1307–1315 CrossRef CAS PubMed.
- G. Grivani, S. Tangestaninejad, M. H. Habibi and V. Mirkhani, Catal. Commun., 2005, 6, 375–378 CrossRef CAS.
- G. Grivani, S. Tangestaninejad, M. H. Habibi, V. Mirkhani and M. Moghadam, Appl. Catal., A, 2006, 299, 131–136 CrossRef CAS.
- E. Santacesaria, R. Tesser, M. D. Serio, R. Turco, V. Russo and D. Verde, Chem. Eng. J., 2011, 173, 198–209 CrossRef CAS.
- The Many Uses and Hazards of Peracetic Acid, https://synergist.aiha.org/201612-peracetic-acid-uses-and-hazards, (accessed August 2023).
- M. L. Mohammed, D. Patel, R. Mbeleck, D. Niyogi, D. C. Sherrington and B. Saha, Appl. Catal., A, 2013, 466, 142–152 CrossRef CAS.
- J. Kollar, Epoxidation Process, US Pat., US53617966A, 1967 Search PubMed.
- M. Salavati-Niasari, E. Esmaeili, H. Seyghalkar and M. Bazarganipour, Inorg. Chim. Acta, 2011, 375, 11–19 CrossRef CAS.
- Y. Shen, P. Jiang, J. Zhang, G. Bian, P. Zhang, Y. Dong and W. Zhang, Mol. Catal., 2017, 433, 212–223 CrossRef CAS.
- C. Bisio, A. Gallo, R. Psaro, C. Tiozzo, M. Guidotti and F. Carniato, Appl. Catal., A, 2019, 581, 133–142 CrossRef CAS.
- L. Cai, C. Chen, W. Wang, X. Gao, X. Kuang, Y. Jiang, L. Li and G. Wu, Ind. Eng. Chem. Res., 2020, 191–200 CrossRef CAS.
- Z. Wu, Z. He, D. Zhou, Y. Yang, X. Lu and Q. Xia, Mater. Lett., 2020, 128549 CrossRef CAS.
- W. Lueangchaichaweng, B. Singh, D. Mandelli, W. A. Carvalho, S. Fiorilli and P. P. Pescarmona, Appl. Catal., A, 2019, 571, 180–187 CrossRef CAS.
- E. Mikolajska, V. Calvino-Casilda and M. A. Bañares, Appl. Catal., A, 2012, 164–171 CrossRef CAS.
- V. B. Borugadda and V. V. Goud, Energy Procedia, 2014, 54, 75–84 CrossRef CAS.
- C. Peng, X. H. Lu, X. T. Ma, Y. Shen, C. C. Wei, J. He, D. Zhou and Q. H. Xia, J. Mol. Catal. A: Chem., 2016, 423, 393–399 CrossRef CAS.
- K. Otake, S. I. Ahn, J. Knapp, J. T. Hupp, J. M. Notestein and O. K. Farha, Inorg. Chem., 2021, 60, 2457–2463 CrossRef CAS PubMed.
- M. L. Mohammed and B. Saha, in Ion Exchange and Solvent Extraction, ed. A. K. SenGupta, CRC Press, Boca Raton, 2016, p. 33 Search PubMed.
- L. Paglia, V. Genova, M. P. Bracciale, C. Bartili, F. Marra, M. Natali and G. Pulci, J. Therm. Anal. Calorim., 2020, 142, 2149–2161 CrossRef CAS.
- J. Yuan, J. Huang, G. Wu, J. Tong, G. Xie, J. Duan and M. Qin, Ind. Crops Prod., 2015, 74, 192–199 CrossRef CAS.
- O. Aboelazayem, M. Gadalla and B. Saha, Renewable Energy, 2018, 124, 144–154 CrossRef CAS.
- M. Khajeh, J. Food Compos. Anal., 2009, 22, 343–346 CrossRef CAS.
- H. Jaliliannosrati, N. A. S. Amin and A. Talebian-Kiakalaieh, Bioresour. Technol., 2013, 136, 565–573 CrossRef CAS PubMed.
- V. Onyenkeadi, O. Aboelazayem and B. Saha, Catal. Today, 2020, 346, 10–22 CrossRef CAS.
- O. Aboelazayem, N. S. El-Gendy, A. A. Abdel-Rehim and F. Ashour, Energy, 2018, 157, 843–852 CrossRef CAS.
- N. S. El-Gendy, A. A. S. A. El-Gharabawy, S. S. A. Amr and F. H. Ashour, Int. J. ChemTech Res., 2015, 8, 385–398 CAS.
- N. S. El-Gendy, S. F. Deriase and A. Hamdy, Energy Sources, Part A, 2014, 36, 623–637 CrossRef CAS.
- D. W. Lee, N. Marasini, B. K. Poudel, J. H. Kim, H. J. Cho, B. K. Moon, H. G. Choi, C. S. Yong and J. O. Kim, J. Microencapsulation, 2014, 31, 31–40 CrossRef CAS PubMed.
- X. Long, L. Cai and W. Li, Constr. Build. Mater., 2019, 197, 406–420 CrossRef CAS.
- H. Mohammadifard and M. C. Amiri, J. Water Environ. Nanotechnol., 2018, 3, 141–149 CAS.
- K. Ambroziak, R. Mbeleck, B. Saha and D. C. Sherrington, Int. J. Chem. React. Eng., 2010, 8, 1–13 Search PubMed.
- M. M. R. Bhuiyan, M. L. Mohammed and B. Saha, Reactions, 2022, 3, 537–552 CrossRef CAS.
- M. Bahrami, M. J. Amiri and F. Bagheri, J. Environ. Chem. Eng., 2019, 7, 700–793 Search PubMed.
- K. Y. Nandiwale and V. V. Bokade, Ind. Eng. Chem. Res., 2014, 53, 18690–18698 CrossRef CAS.
- B. Olaniyan and B. Saha, Energies, 2020, 13, 741 CrossRef CAS.
- K. Ambroziak, R. Mbeleck, Y. He, B. Saha and D. C. Sherrington, Ind. Eng. Chem. Res., 2009, 48, 3293–3302 CrossRef CAS.
- J. Peng, S. Wang, H. Yang, B. Ban, Z. Wei, L. Wang and B. Lei, Fuel, 2018, 224, 481–488 CrossRef CAS.
| This journal is © The Royal Society of Chemistry 2024 |


