
Synthesis of double Z-scheme CdS/Bi2O2CO3/BiOCl heterojunction photocatalysts for degradation of rhodamine B under visible light†
Yueyi
Li
,
Yuehui
Liu
,
Xuguang
Liu
and
Xia
Li
 *
*
College of Materials Science and Technology, Qingdao University of Science & Technology, Qingdao 266042, P.R. China. E-mail: lix@qust.edu.cn
First published on 13th October 2023
Abstract
In this paper, novel CdS/Bi2O2CO3/BiOCl photocatalysts with a double Z-scheme heterojunction were successfully obtained by a simple one-step hydrothermal method. XRD, SEM, and TEM were used to verify the formation of the catalysts, and FTIR and XPS were used to evaluate their chemical composition and binding energy. To evaluate the performance of these photocatalysts, the degradation of RhB was performed under visible light and the effects of the catalyst dose and pH on the photocatalytic performance were examined. The results showed that the 10 mol% CdS/Bi2O2CO3/BiOCl catalyst (0.1 g, pH = 5) showed the best activity, with a degradation rate of 97% in 90 min. The BET results showed that the composites have stronger adsorption properties. Electrochemical test results demonstrated that the Z-scheme heterojunction was responsible for promoting the carrier separation efficiency. The combination of strong visible light absorption and the effective separation of photogenerated electron–hole pairs remarkably enhanced the catalytic activity.
1. Introduction
Protecting water resources and the removal of pollutants from water environments are increasingly important environmental issues.1 However, traditional high-temperature and biological methods used to remove pollutants from water exhibit high energy consumption and easily introduce secondary pollution. Recently, photocatalysis has been widely investigated to replace traditional water treatment methods because it is clean, efficient, and low-cost.2 Many photocatalysts have been widely investigated, including ZnO2,3 g-C3N4,4 graphene,5 bismuth-based photocatalysts,6–8 and so on. Among them, bismuth-based photocatalysts have been thoroughly studied owing to their simple preparation process and high responsiveness in the UV region.9 These bismuth-based catalysts include BiPO4,10 Bi2S3,11 BiOCl,12 and Bi2O2CO3.13 However, individual semiconductor materials exhibit drawbacks such as a poor response to visible light and rapid carrier recombination.14–16 Therefore, the catalytic efficiency of these materials is not sufficient. To improve the conversion ability of catalysts, many methods have been proposed to modify Bi-based photocatalysts, such as noble metal deposition,17 non-metal doping,18 and preparing composites with other semiconductors to form heterojunction structures.19,20Heterojunction structures have attracted an increasing amount of attention because they can be used for the effective separation and migration of carriers. For instance, binary Z-scheme or type II heterojunction photocatalysts such as PbBiO2Br/BiOBr,21 Ag2O/Bi2O2CO3,22 and BiVO4/CeO2 (ref. 23) can reduce the recombination of carriers, and they also exhibit a broader optical response range. Unfortunately, the electrostatic repulsion between electrons (or holes) prevents their effective transfer, so the redox ability of carriers is weakened in the conventional type II heterojunction mechanism. In contrast, in Z-scheme heterostructures, holes and electrons with poor redox ability will recombine. Meanwhile, the stronger oxidative holes and reductive electrons are still retained in the semiconductor materials of the heterostructure, resulting in high catalytic activity.24
On the basis of these binary heterojunction systems, new ternary heterojunction systems have gradually been investigated. Compared with single heterojunctions, double heterojunctions have higher carrier separation efficiency, longer lifetimes, and larger visible response ranges. For example, the BiVO4/CDs/CdS photocatalysts prepared by Kang et al. showed better performance for the production of hydrogen via water decomposition.25 This was due to the effective separation of carriers and the extended lifetime of electrons and holes in the photocatalyst. Gao et al. successfully synthesized a g-C3N4/BiOI/Bi2O2CO3 photocatalyst by an in situ conversion approach which showed good performance for the degradation of RhB.26 Luo et al. also prepared a CdS/Bi2MoO6/BiOBr photocatalyst that effectively degraded up to 94.41% of tetracycline hydrochloride (TC).27 While these ternary photocatalysts show good promise in terms of catalytic performance, their preparation requires multi-step synthetic methods, and convenient one-step strategies have only rarely been reported.
Bi2O2CO3 is an n-type semiconductor with alternating stacks of [Bi2O2]2+ sheet layers and CO32− layers. However, the wide band gap (3.2–3.5 eV) of Bi2O2CO3 has significantly limited its application.28 In contrast, BiOCl has a suitable energy band position, providing it with a good light response in the UV region.29 CdS is a material with some visible light photocatalytic activity, but its carrier recombination rate is too high. Due to the narrow band gap and low carrier lifetime of CdS, B.G. Mishra et al. coupled CdS with wide band gap semiconductors to fully exploit its role.30 Therefore, it is proposed that combining Bi2O2CO3, BiOCl, and CdS in a new semiconductor will take advantage of their respective advantages to provide an enhanced catalytic effect. However, to the best of our knowledge, a CdS/Bi2O2CO3/BiOCl composite photocatalyst has not been reported yet.
Inspired by this speculation, we synthesized a series of CdS/Bi2O2CO3/BiOCl ternary visible light photocatalysts using an easy one-step strategy. The structure, properties, and catalytic mechanism of the as-obtained samples were comprehensively evaluated using various characterization techniques. The ternary photocatalysts exhibited excellent RhB degradation performance and maintained high stability after four repeated experiments. In addition, a double Z-scheme heterojunction mechanism was confirmed according to radical trapping experiments, ESR tests, and the band location. This work offers insight into the preparation and application of highly efficient bismuth-based composite photocatalysts.
2. Experimental section
2.1 Synthesis of Bi2O2CO3, BiOCl, CdS, Bi2O2CO3/BiOCl, Bi2O2CO3/CdS, and BiOCl/CdS
The synthesis process for obtaining Bi2O2CO3 (BSC), BiOCl (BOC), CdS, Bi2O2CO3/BiOCl (BSC/BOC), Bi2O2CO3/CdS (BSC/CdS), and BiOCl/CdS (BOC/CdS) is described in the ESI.†2.2 Synthesis of CdS/Bi2O2CO3/BiOCl
First, bismuth nitrate pentahydrate (Bi(NO3)3·5H2O, 2.021 g), urea (CH4N2O, 0.25 g), and potassium chloride (KCl, 0.315 g) were added to 25 mL of distilled water and continuously stirred for 1 h to obtain solution A. Cadmium chloride hemi(pentahydrate) (CdCl2·2.5H2O) (0.048 g, 0.096 g, 0.192 g) and thiourea (CH4N2S) (0.080 g, 0.160 g, 0.320 g) were mixed in 15 mL water and evenly stirred to obtain solution B. Then, solutions B and A were mixed and stirred for 1 h. Finally, the mixed solution was added to a PTFE-lined reactor and heated at 160 °C for 24 h. After cooling, each obtained sample was centrifuged several times, filtered, and dried at 60 °C for 24 h. The different ratios of CdCl2·2.5H2O and CH4N2S resulted in ternary composites with 5, 10, and 20 mol% CdS content. These products (5, 10, and 20 mol% CdS/Bi2O2CO3/BiOCl) were denoted 5CBB, 10CBB, and 20CBB, respectively. Details of the ternary composite photocatalyst synthesis process are illustrated in Fig. 1.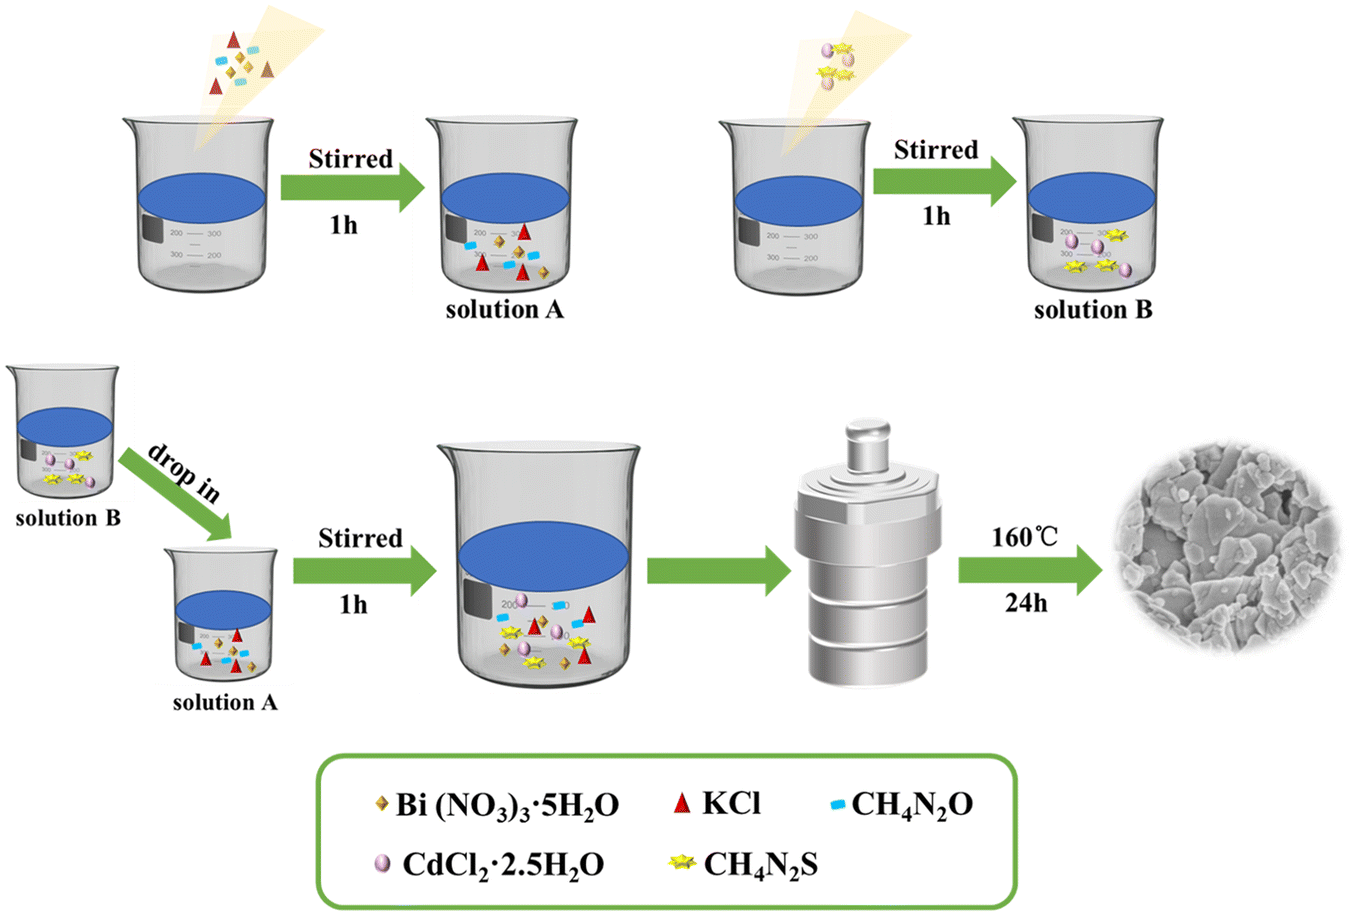 | ||
| Fig. 1 Fabrication of CdS/Bi2O2CO3/BiOCl. | ||
2.3 Characterization
Crystal phase analysis of all products was performed with X-ray powder diffraction (D/MAX-2500/PC). The FTIR spectra of the samples were obtained with an infrared spectrometer (Nicolet IS10). The surface elements and chemical valence bonds of products were evaluated using X-ray photoelectron spectroscopy (XPS, ESCALAB XI+). The microstructure and morphology of the samples were observed by SEM (JSM-6700F) and TEM (JEM-2100 plus). UV-vis diffuse reflectance spectra were obtained with a UV-vis spectrophotometer (Cary 5000). An Aptar PGSTAT302N electrochemical workstation was used to determine the photoelectric properties of the photocatalysts. Time-resolved transient fluorescence lifetimes were measured with an FLSP920 instrument. Electron spin resonance (ESR) was performed with a Bruker A-300.2.4 Photocatalytic performance tests
The photocatalytic behaviour of CdS/Bi2O2CO3/BiOCl was evaluated by degrading RhB under visible light. A 300 W xenon lamp was used to simulate sunlight (λ > 420 nm). First, 0.1 g catalyst was added to 100 mL (20 mg L−1) of RhB solution, and this mixture was stirred for 30 min to achieve adsorption–desorption equilibrium. Next, the lamp was turned on and 5 mL samples were removed for evaluation at 15 min intervals. Each sample was tested by measuring the maximum absorbance peak of the RhB solution at 554 nm. At the end of each photocatalytic experiment, all catalyst samples were recovered and washed to evaluate their reusability. Subsequent photocatalytic tests were performed using the same experimental parameters. Finally, the active species of the ternary composite photocatalysts were explored by ESR tests and radical capture experiments.3. Results and discussion
3.1 Structure and morphology
The crystal phases of the as-obtained photocatalysts were analysed by XRD. The XRD patterns of BOC, BSC, and CdS along with their PDF cards are revealed in Fig. 2a. The hexagonal phase of CdS (PDF#41-1049), tetragonal phase of BOC (PDF#06-0249), and tetragonal phase of BSC (PDF#41-1488) were observed.31–33 The XRD patterns of BSC/BOC and the ternary photocatalysts are provided in Fig. 2b. In the BSC/BOC binary composite diffraction pattern, the characteristic peaks of BOC were more prominent and obvious than those of BSC, indicating that BOC was the main phase. The characteristic peaks of BSC were observed at 12.9°, 30.3°, 42.3°, and 52.4° (marked by “♦” in Fig. 2b). In addition, the peak intensity of BOC was enhanced when BSC was complexed with BOC, suggesting that BSC and BOC interacted with each other instead of simply being mechanically adhered. Wang et al. believed that this was due to the formed heterojunction causing structural changes.27 | ||
| Fig. 2 (a) XRD patterns of CdS, BOC, and BSC with their respective PDF cards; (b) XRD patterns of BSC/BOC, 5CBB, 10CBB, and 20CBB. | ||
BOC was still the dominant phase based on the diffraction peaks of the ternary composites. The BSC peaks are indicated with “♦” markers while those of CdS are marked with “•” symbols. With increasing CdS content, the CdS peak intensity was enhanced, while the intensity of the BOC peaks at 12.0°, 24.1°, and other locations decreased as the increasing amount of CdS covered the surface of BOC. Yin et al. suggested that lattice distortion also leads to a decline in crystallinity, implying that the phases interacted with each other to some extent.28 The XRD patterns of Bi2O2CO3/10 mol% CdS (BSC/10CdS) and BiOCl/10 mol% CdS (BOC/10CdS) are shown in Fig. S1.† Overall, these results indicate that each catalyst was correctly prepared, and the absence of extra peaks demonstrates their high purity.
The FTIR spectra of the prepared photocatalysts are displayed in Fig. 3a. The band at approximately 3440 cm−1 in all the spectra was assigned to the O–H stretching vibration of atmospheric water.34,35 The band at 1633 cm−1 was caused by the H–O–H bending vibration of adsorbed water.36 For pure BSC, absorption bands were observed at 544 cm−1 (Bi–O stretching vibration), 845 cm−1 (non-planar bending vibration of the CO32− groups), and 1391 cm−1 (asymmetric vibration of the CO32− groups).37 The BOC spectrum showed a peak at 525 cm−1, which was ascribed to Bi–O vibrations.38 The CdS spectrum has peaks at 1036 and 1403 cm−1 caused by the vibration of the Cd–S bonds.25Fig. 3b shows the corresponding enlarged view of the 500–1500 nm region in Fig. 3a. The Bi–O stretching vibration peak of 10CBB was observed in the range of 525 and 544 cm−1. This peak was probably caused by the merging of the infrared bands of BSC and BOC.30 The peak at 845 cm−1 was significantly weakened and the other two BSC peaks (at 1036 and 1391 cm−1) were slightly shifted. These changes indicate that chemical reactions occurred between the three components of the composite material. This was confirmed by further characterization, as discussed below.
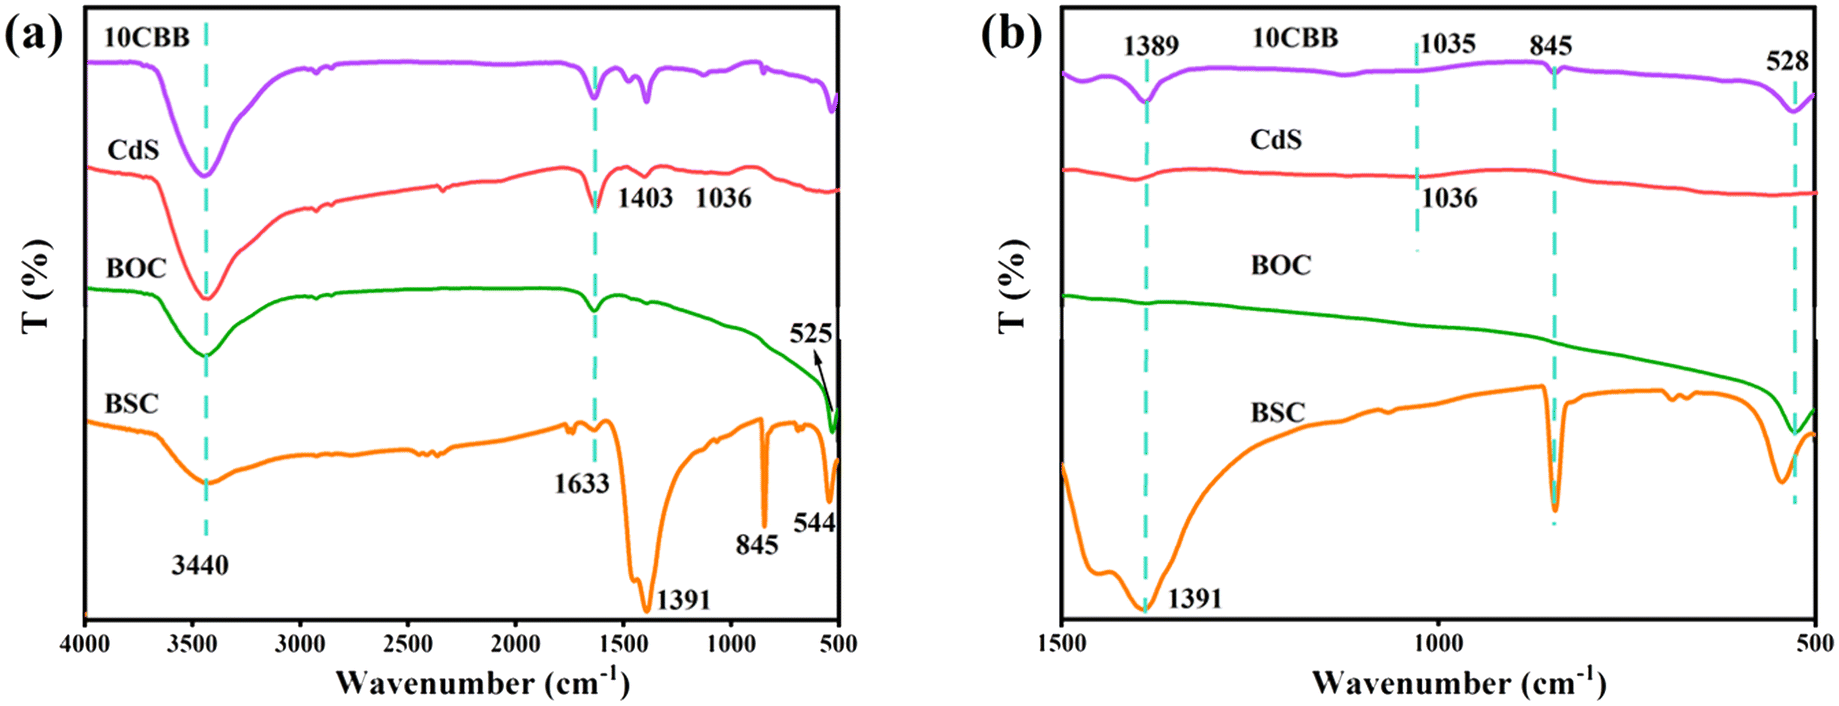 | ||
| Fig. 3 (a) FTIR spectra of BSC, BOC, CdS, and 10CBB and (b) enlarged view of the 500–1500 nm region of the FTIR spectra. | ||
The microscopic morphology of the prepared samples was examined by SEM. BSC consisted of plates with lengths of about 200–400 nm (Fig. 4a). BOC consisted of large pieces with lengths of about 1–3 μm (Fig. 4b). However, CdS exhibited an irregular granular block structure (Fig. 4c). The binary BSC/BOC photocatalysts (Fig. 4d) showed the presence of small BSC plates and large BOC plates. Stacking BSC and BOC together increased the contact area, providing more opportunities for the transfer and recombination of electrons. The micromorphology of 10CBB is presented in Fig. 4e. CdS granules were uniformly distributed on the surfaces of BSC and BOC, benefiting from the high degree of dispersion provided by the hydrothermal method. These CdS particles can serve as electron transfer sites, promoting carrier separation and enhancing photocatalytic activity. The elemental mapping from the SEM image (Fig. S2†) and EDS spectra (Fig. S3†) further revealed the uniform spatial distribution of the Bi, C, Cl, O, S, and Cd elements in this sample.
 | ||
| Fig. 4 SEM images of (a) BSC, (b) BOC, (c) CdS, (d) BSC/BOC, and (e) 10CBB. | ||
To further explore the micromorphology and microstructure of the heterojunction photocatalyst, 10CBB was analysed by TEM and HRTEM. As presented in Fig. 5a and b, both BSC and BOC had irregular plate structures and nanosized CdS particles were attached to these nanosheets. This was in good agreement with the SEM images. Fig. 5c shows an HRTEM image of the rectangular area marked in Fig. 5b. The observed crystal plane spacings of 1.720, 3.586, and 3.720 nm corresponded to the (202) plane of BOC, the (100) face of CdS, and the (011) face of BSC, respectively. Therefore, HRTEM analysis reveals that the CdS nanoparticles were chemically bonded with the two Bi-based crystalline phases, leading to the formation of a heterostructure. In addition, the heterojunction structure of 10CBB is also supported by the elemental mapping from the TEM image (Fig. S4†). The closer contact between the three phases creates favourable conditions for electron transfer.
 | ||
| Fig. 5 (a) and (b) TEM and (c) HRTEM images of 10CBB. | ||
The surface elemental valence states and binding energy of 10CBB were studied using XPS. The presence of Bi, C, Cl, O, S, and Cd was demonstrated using a survey spectrum (Fig. 6a). The S 2p binding energy is close to that of Bi 4f. Therefore, the spectrum shown in Fig. 6b had four fitted peaks. The peaks at 159.3 and 164.6 eV corresponded to the Bi 4f7/2 and Bi 4f5/2 signals of Bi3+, respectively. The peaks at 160.2 and 165.8 eV were ascribed to S 2p3/2 and S 2p1/2.39–41 The Cl 2p spectrum (Fig. 6c) was deconvoluted into two peaks at 198.0 and 199.7 eV, which were ascribed to the Cl 2p3/2 and Cl 2p1/2 signals of BiOCl, respectively.42 As shown in Fig. 6d, the three C 1s peaks at 284.5, 285.8, and 289.0 eV were associated with adventitious carbon, C–O groups, and O–C![[double bond, length as m-dash]](https://www.rsc.org/images/entities/char_e001.gif) O groups, respectively.43,44 The Cd 3d peaks at 405.2 and 411.9 eV were ascribed to the Cd 3d5/2 and Cd 3d3/2 signals of CdS (Fig. 6e).45 In the O 1s spectrum (Fig. 6f), the peaks at 529.9 and 531.1 eV were ascribed to the Bi–O bonds and the O atoms of carbonate groups, respectively.46 All the characteristic peaks were clearly distinguished, demonstrating the successful preparation of the ternary heterojunction photocatalyst.
O groups, respectively.43,44 The Cd 3d peaks at 405.2 and 411.9 eV were ascribed to the Cd 3d5/2 and Cd 3d3/2 signals of CdS (Fig. 6e).45 In the O 1s spectrum (Fig. 6f), the peaks at 529.9 and 531.1 eV were ascribed to the Bi–O bonds and the O atoms of carbonate groups, respectively.46 All the characteristic peaks were clearly distinguished, demonstrating the successful preparation of the ternary heterojunction photocatalyst.
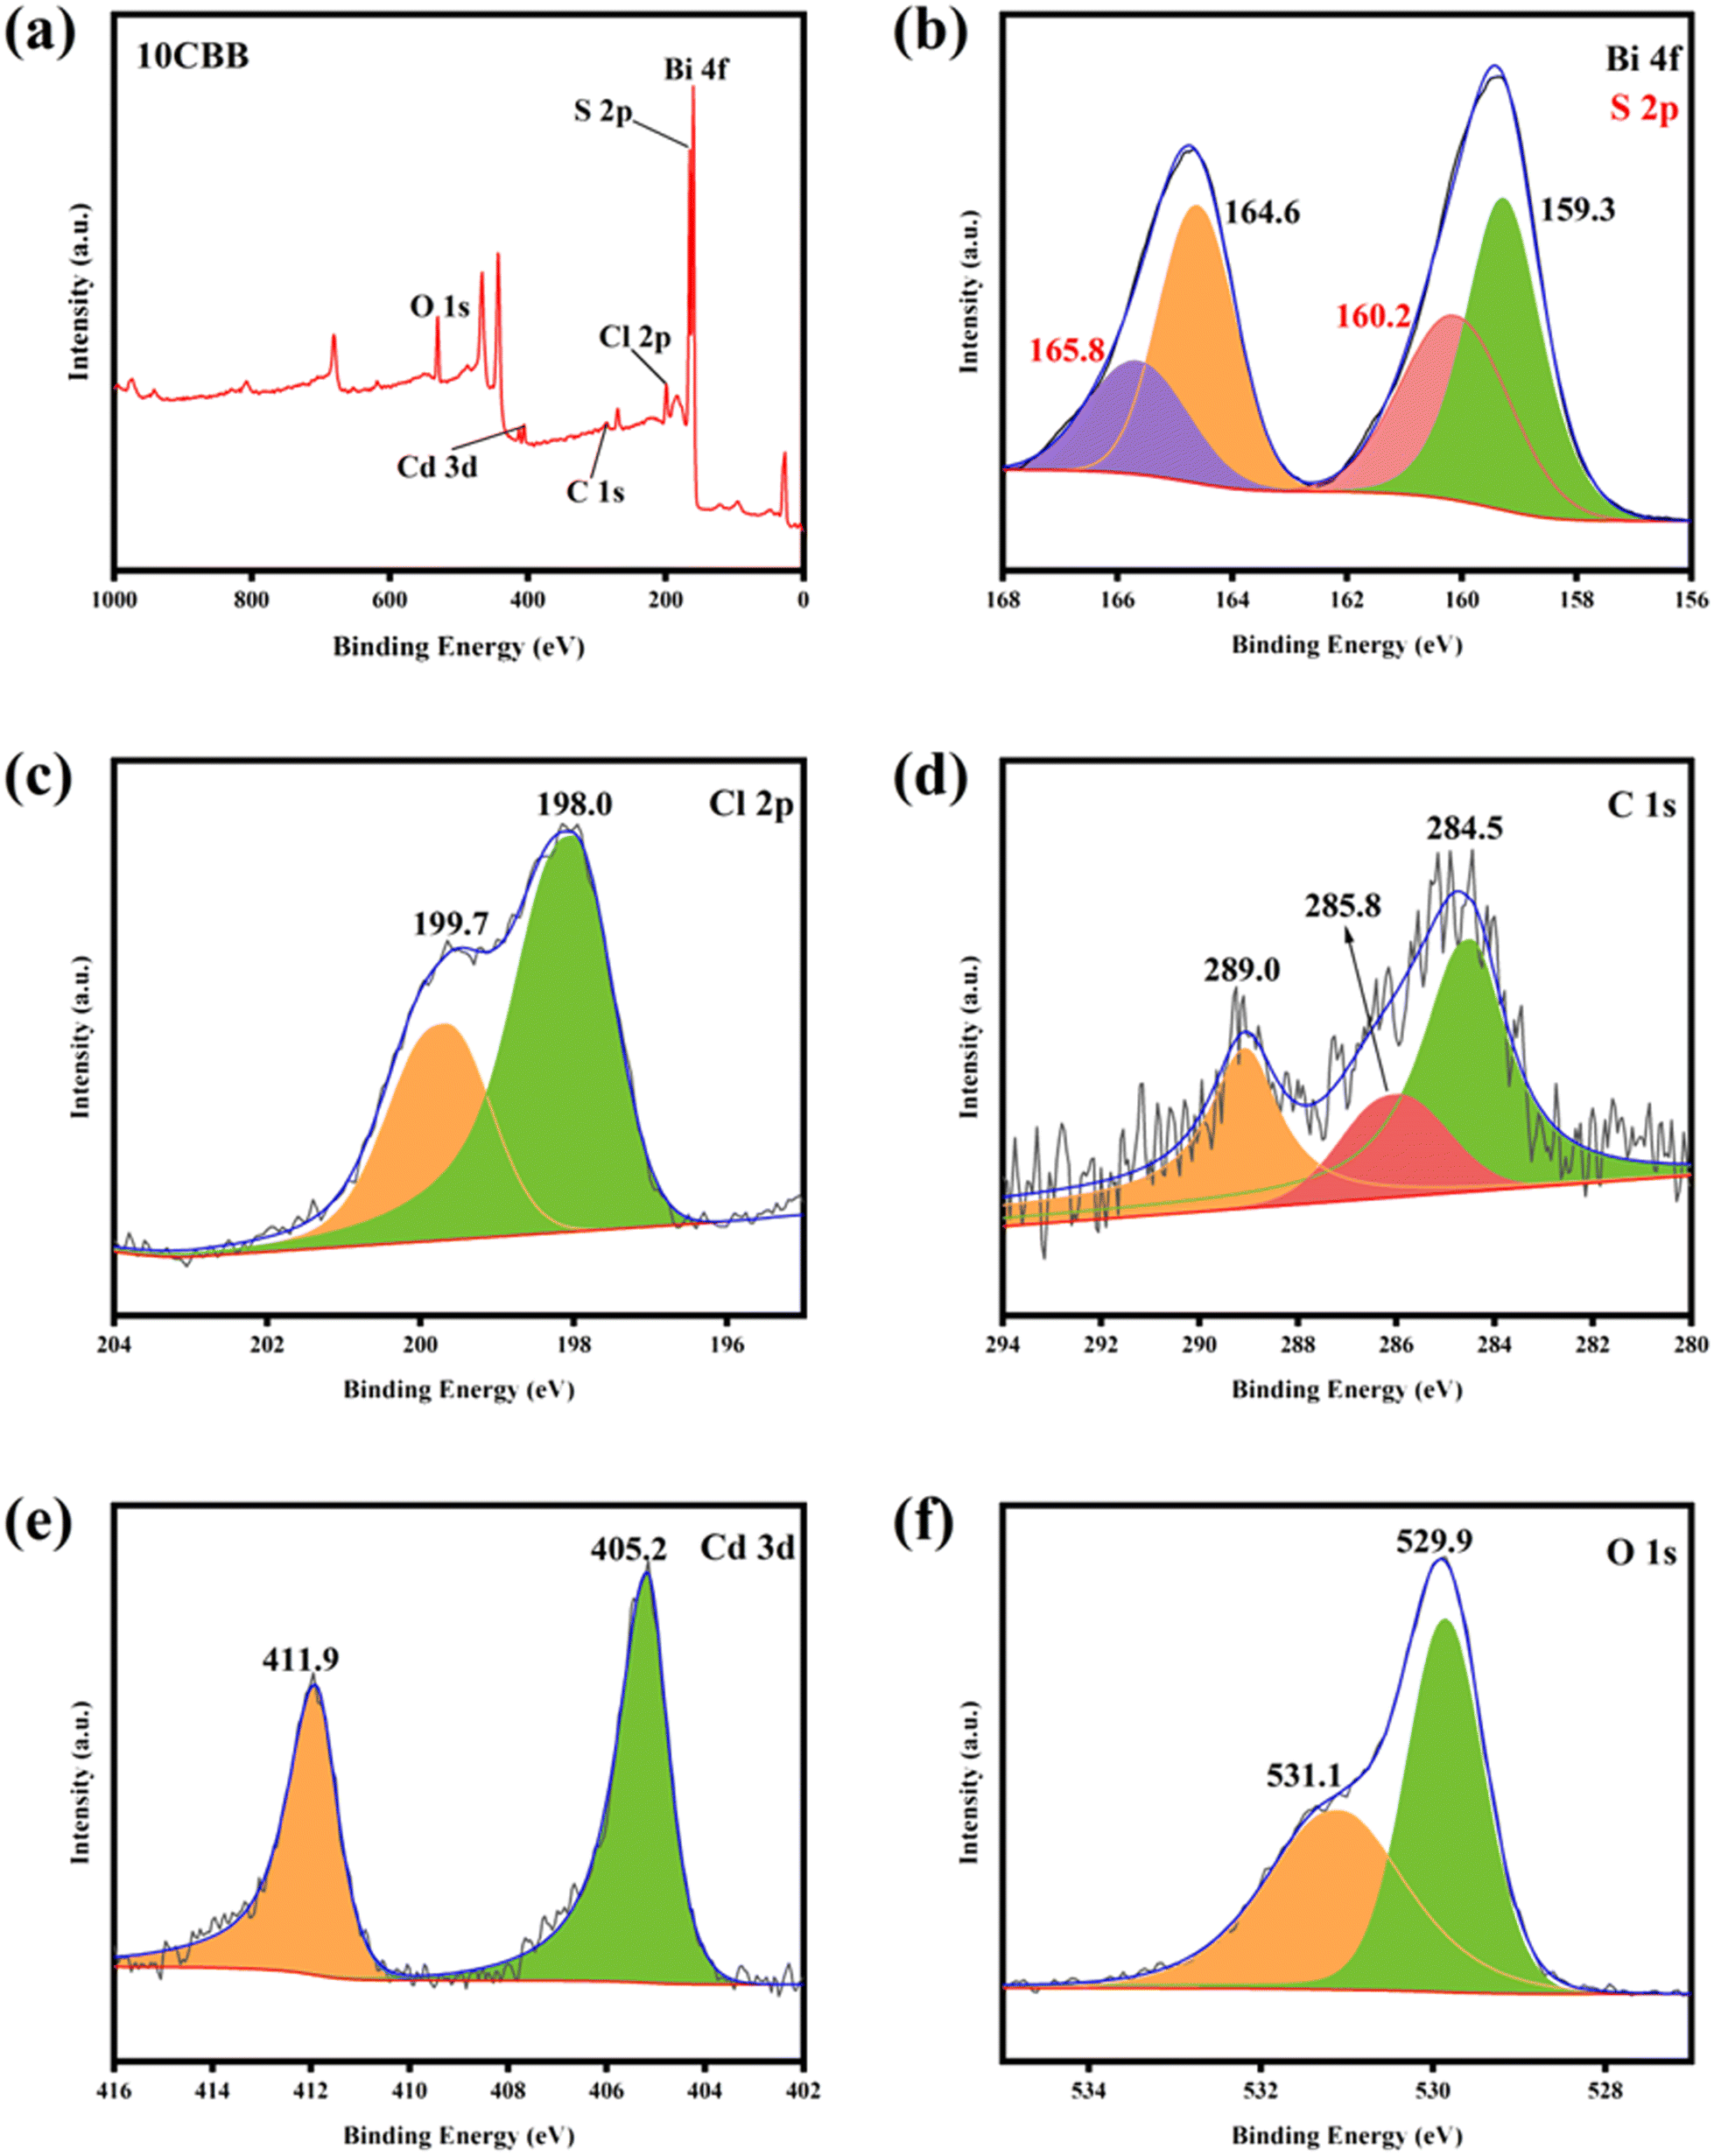 | ||
| Fig. 6 XPS survey spectrum (a) of 10CBB: (b) Bi 4f and S 2p, (c) Cl 2p, (d) C 1s, (e) Cd 3d, and (f) O 1s. | ||
In summary, the XRD, FTIR, HRTEM, EDS, and XPS results confirmed the presence of CdS, Bi2O2CO3, and BiOCl in the heterojunction.
3.2 Optical properties
The UV-vis diffuse reflectance spectra of the catalysts are shown in Fig. 7a. Both BSC and BOC had absorption edges at about 370 nm and a strong response in the UV region. However, the visible light responsiveness of BSC/BOC was not improved. In contrast, the ternary photocatalyst samples showed significantly enhanced absorption intensity in the visible light region. This was potentially due to the superior visible light absorption properties of CdS and the formation of the heterostructure improving the electron excitation efficiency of the ternary material.41 The band gaps of the pure components were obtained through Tauc's equation:47| αhv = A(hv − Eg)n/2 | (1) |
| EVB = X − Ee + 0.5Eg | (2) |
| ECB = EVB − Eg | (3) |
 | ||
| Fig. 7 (a) UV-vis diffuse reflectance spectra of the as-obtained catalysts and (b) estimated bandgaps of CdS, BOC, and BSC. | ||
3.3 Photocatalytic activity detection
The RhB degradation activity of the prepared photocatalysts is shown in Fig. 8a. Using blank RhB as a reference, it was observed that BSC and BOC had almost no degradation effect on RhB. This was because they could absorb only UV light. It should be noted that the RhB degradation efficiency of CdS was only about 33%, even though CdS had a good visible light response. This was most likely because the rapid recombination of carriers in CdS reduced its photocatalytic efficiency. Furthermore, as reported by Fan et al., small CdS particles can easily agglomerate, which reduces their specific surface area and active sites.50 The RhB degradation rate of the BSC/BOC composite reached 56%, which was probably due to the formation of a single heterojunction in this composite material.51 The ternary photocatalysts showed a markedly improved degradation performance, and 10CBB had the best catalytic effect, with an RhB degradation efficiency of 97% in 90 min. This was because the excellent visible light response and double heterostructure of 10CBB allowed for the more efficient transfer of electrons. A low loading of CdS is not enough to provide more active sites to improve the photocatalytic activity, while a too high loading leads to inactivation of the active sites. Therefore, the photocatalytic performance of 5CBB and 20CBB is poorer than that of 10CBB. For comparison, the performance of the binary BSC/10CdS and BOC/10CdS systems is also provided in Fig. S5.† These binary photocatalysts showed a much worse performance than the ternary 10CBB catalyst. In addition, to demonstrate that the dye is degraded by photocatalytic degradation rather than adsorption driven dye removal, we subjected 10CBB to a longer (120 min) dark reaction, and the result is shown in Fig. S6.† The curve almost equilibrates after 30 min, indicating that adsorption and desorption reach equilibrium, and will not drive dye removal. | ||
| Fig. 8 (a) Degradation curves of RhB (pH = 5, 1 g L−1 10CBB), (b) corresponding kinetic curves, (c) UV-vis spectra of RhB at 400–700 nm for 10CBB at different light reaction times and (d) cyclic photocatalytic experiments of 10CBB. | ||
The kinetic constant composite first-order dynamic equations of the photocatalysts are presented in Fig. 8b. The k values of BOC, BSC, CdS, BSC/BOC, 5CBB, 10CBB, and 20CBB were 0.0010, 0.0013, 0.0033, 0.0070, 0.0227, 0.0282, and 0.0091 min−1, respectively. The catalytic activity of 10CBB can be attributed to its higher electron excitation efficiency, better separation efficiency, and stronger light absorption intensity. The UV-vis spectra of RhB on 10CBB at different light reaction times in the range of 400–700 nm are displayed in Fig. 8c. The peak at 554 nm significantly declined in intensity with time, indicating that RhB was successfully degraded. Degradation experiments were performed with the recovered 10CBB sample to explore its stability (Fig. 8d). The degradation rate of 10CBB was still approximately 83% after four repeated tests. The slight decline was caused by sample loss during the recovery process.52 XRD was used to evaluate 10CBB after the reaction, as shown in Fig. S7.† The diffraction pattern of 10CBB did not significantly change after four repeated tests, indicating the stability of this sample during the photocatalytic reaction. The RhB degradation performance of 10CBB was compared with those of recently reported photocatalysts. As shown in Table S1,† it can be found that 10CBB has lower energy consumption and higher degradation efficiency.
3.4 Effects of different factors on photocatalytic performance
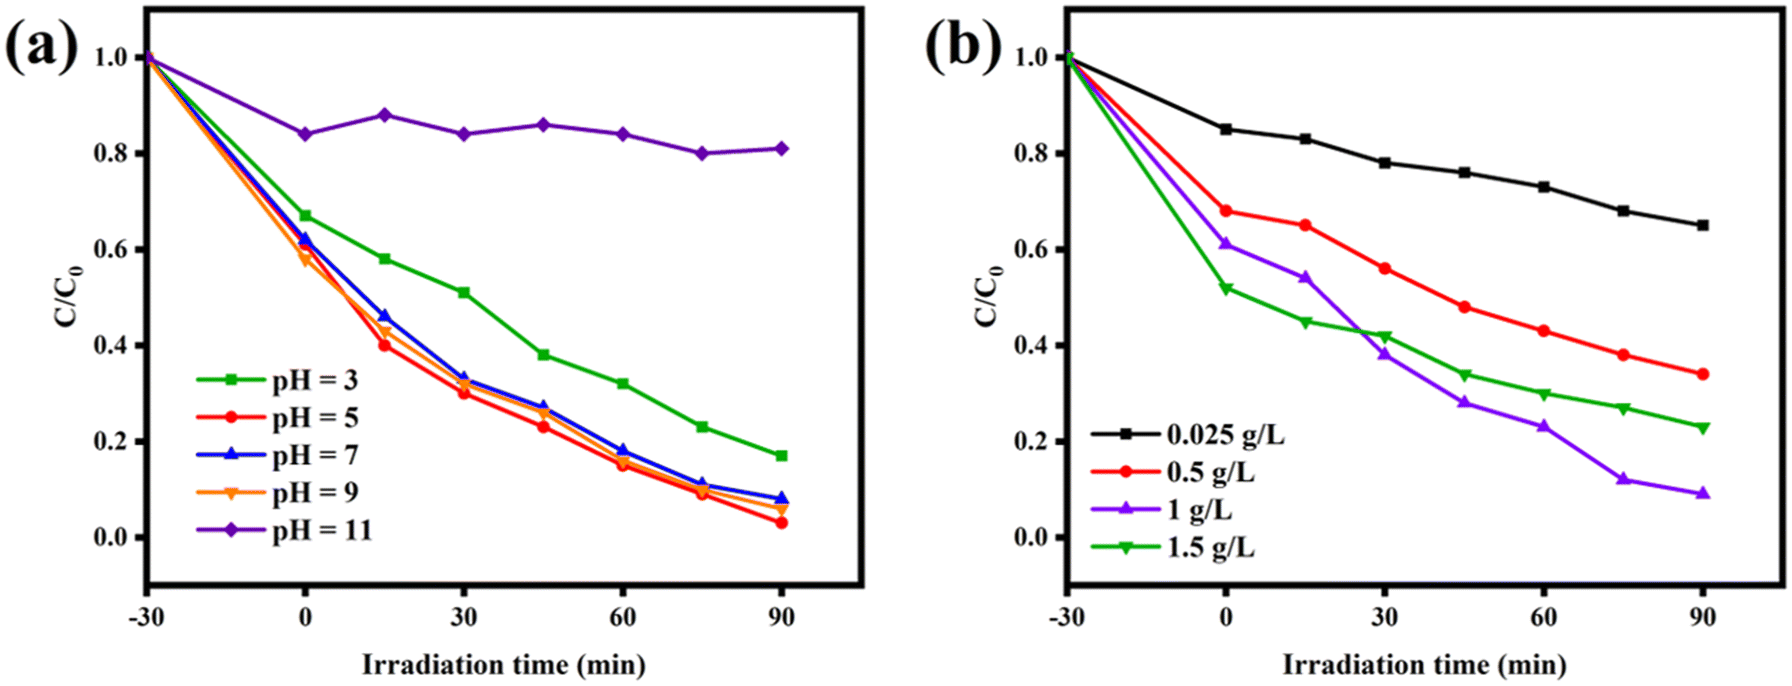 | ||
| Fig. 9 (a) 10CBB degradation curves of RhB at different pH values; (b) 10CBB with different dosage degradation curves of RhB. | ||
3.5 N2 adsorption–desorption isotherms
The larger the specific surface area of the material, the stronger the adsorption properties and the more active sites can be provided. The N2 adsorption–desorption isotherms of BSC, BOC, BSC/BOC, and 10CBB are displayed in Fig. 10a, and these samples exhibit type IV isotherms.27 The specific surface areas (Fig. 10b) of BOC, BSC, BSC/BOC, and 10CBB were 0.544, 1.325, 1.838 and 9.331 m2 g−1, respectively. The results indicated that after the three substances were mixed together, the specific surface area increased significantly. In other words, the adsorption capacity for RhB was greatly enhanced.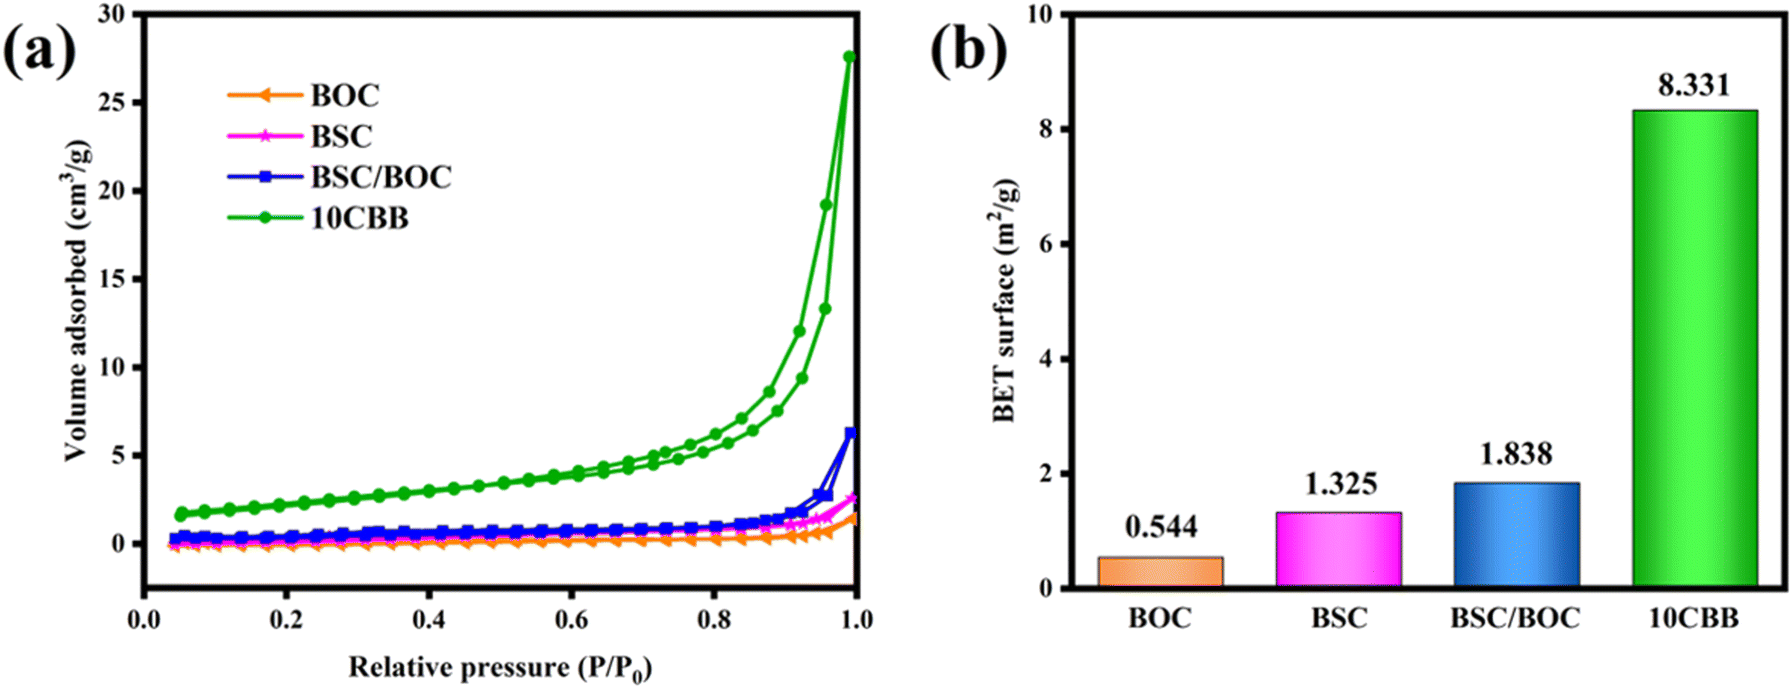 | ||
| Fig. 10 (a) N2 adsorption–desorption isotherms of BOC, BSC, BSC/BOC, and 10CBB; (b) BET surface area of the corresponding materials. | ||
3.6 Electrochemical characterization
The transient photocurrent responses of the as-prepared catalysts are shown in Fig. 11a. The photocurrent density of 10CBB was significantly enhanced compared to those of the other catalysts. This may be related to the heterostructure of 10CBB, which sharply improved the separation of carriers. The EIS Nyquist plots of these materials are presented in Fig. 11b. It is well-known that a smaller arc radius implies lower charge migration resistance. 10CBB had the smallest radius, suggesting that faster electron migration occurred on the 10CBB surface.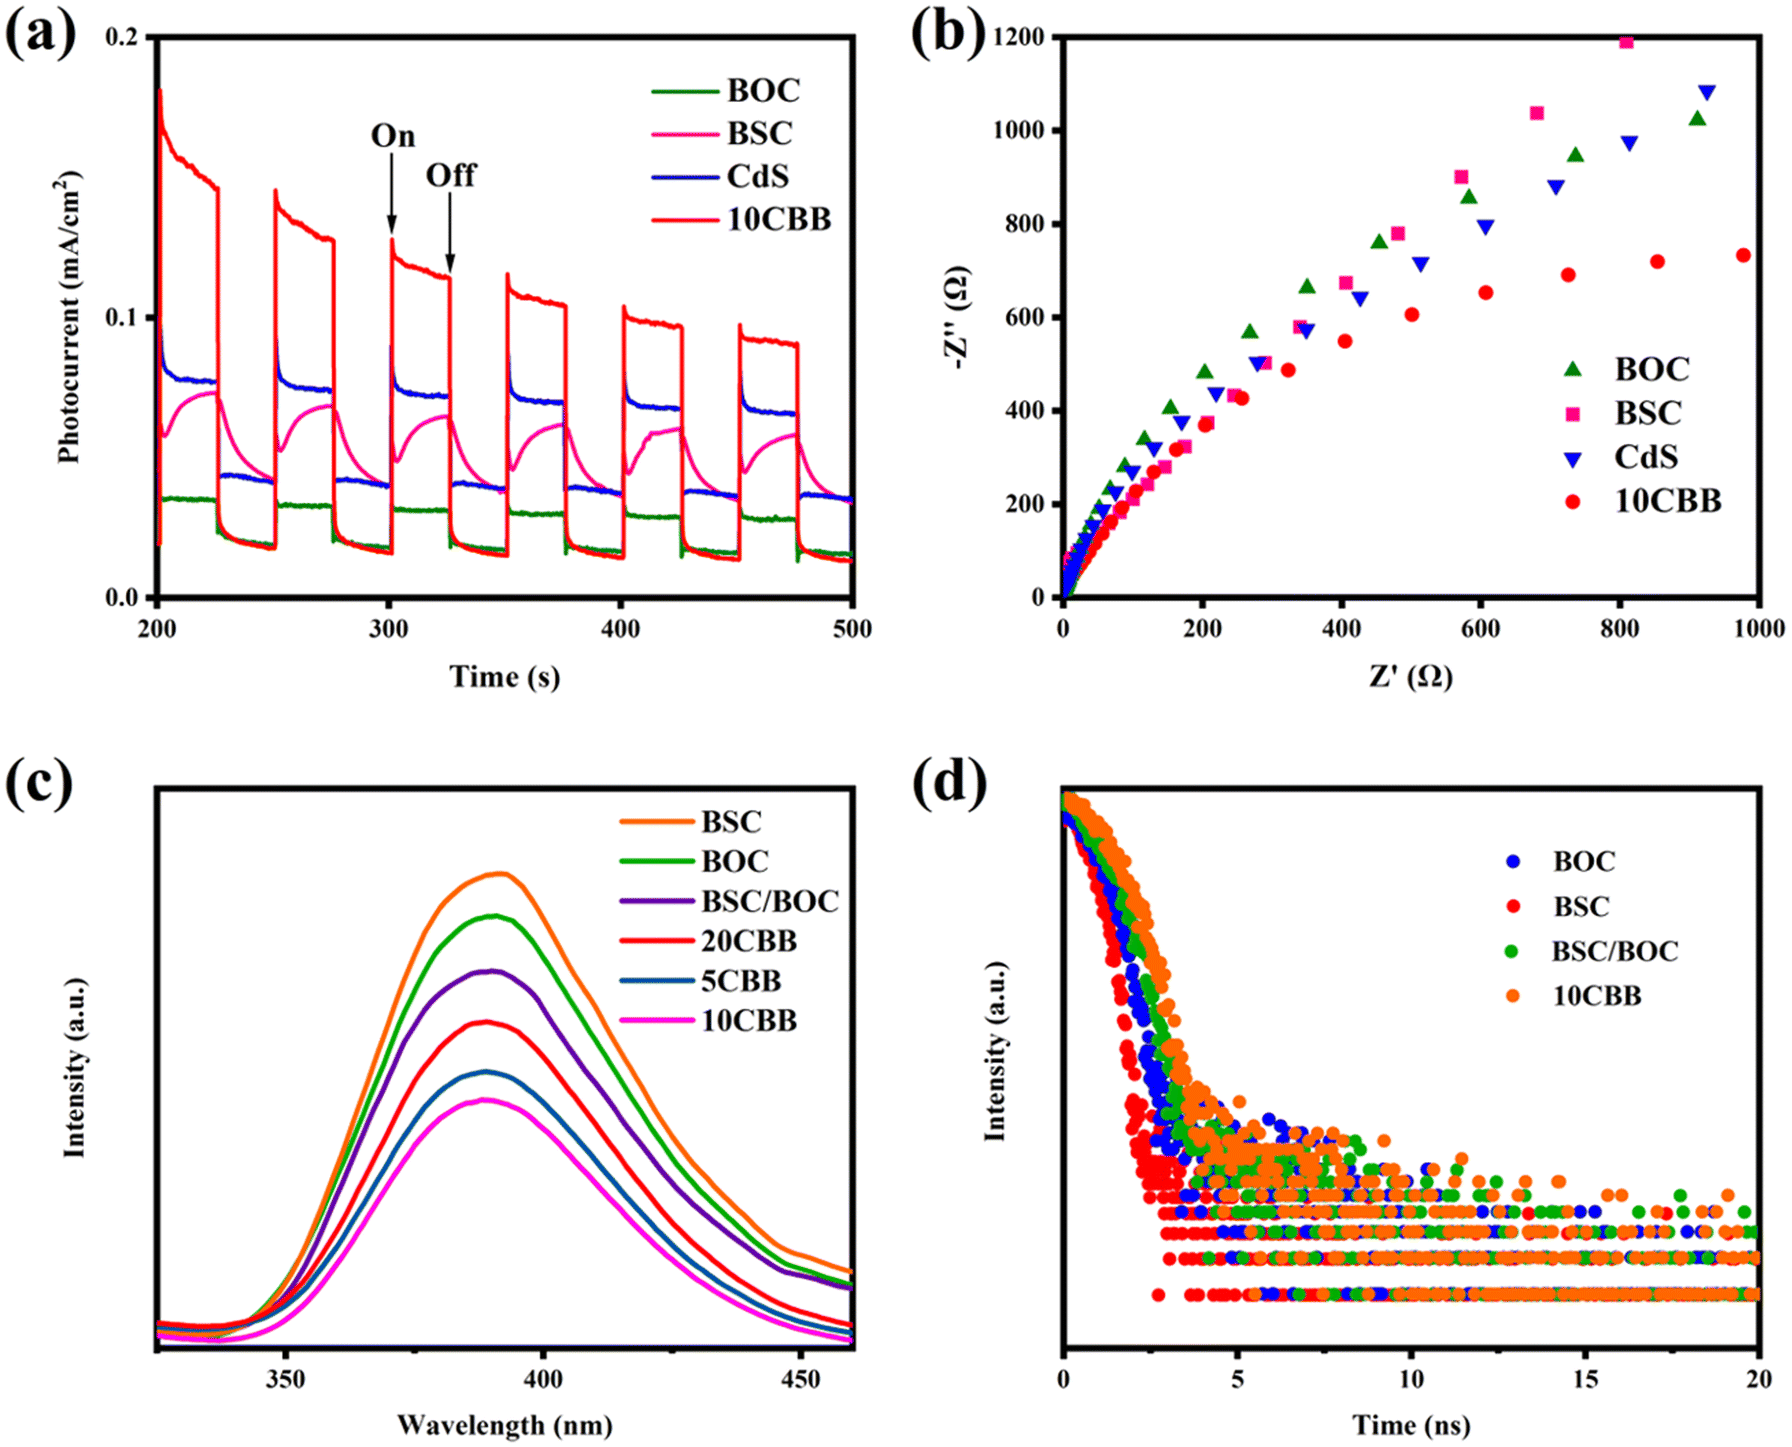 | ||
| Fig. 11 (a) Transient photocurrent response and (b) EIS Nyquist plots of BOC, BSC, CdS and 10CBB, (c) PL spectra of all catalysts, (d) time-resolved transient fluorescence spectra of BSC, BOC, BSC/BOC and 10CBB. | ||
The recombination of free electrons and holes leads to fluorescence intensity, and a high fluorescence intensity indicates a high carrier recombination rate. As indicated in Fig. 11c, the ternary photocatalyst had a lower fluorescence intensity, indicating a higher carrier separation ability. This was due to the influence of the heterostructure and the visible light absorption properties of this catalyst. The carrier separation kinetics were further investigated by fluorescence lifetime measurements, as shown in Fig. 11d. The curves were fitted by the following equation:30
| I(t) = I0e−t/τ | (4) |
3.7 Photocatalytic mechanism
In order to investigate the process of the photodegradation of RhB, ESR tests were performed using DMPO technology. As displayed in Fig. 12a, no characteristic DMPO–·O2− or DMPO–·OH signals were obtained in the dark. In contrast, both signals were easily observed after 5 min and 10 min of visible light irradiation, and the signal intensity was enhanced with the extension of illumination time. This indicated that both superoxide radicals (·O2−) and hydroxyl radicals (·OH) coexisted during the photocatalytic degradation process. In addition, we detected the presence of ·OH in the 10CBB photocatalyst using terephthalic acid (TA). These reactive oxygen species are captured by TA to produce highly fluorescent 2-hydroxyterephthalic acid. With the generation of ·OH, the fluorescence intensity will gradually increase.56 The result (Fig. 12b) showed that the holes in 10CBB have sufficient potential to produce ·OH. Similarly, nitroblue tetrazolium (NBT) was used as a molecular probe to investigate the presence of ·O2−. The reaction of NBT with ·O2− resulted in the formation of methoxy derivatives, which led to the decrease of UV absorption strength.57 The UV-vis absorbance spectra of NBT aqueous solution containing the 10CBB photocatalyst are shown in Fig. 12c, which strongly indicated the high yield of ·O2− in the 10CBB photocatalyst.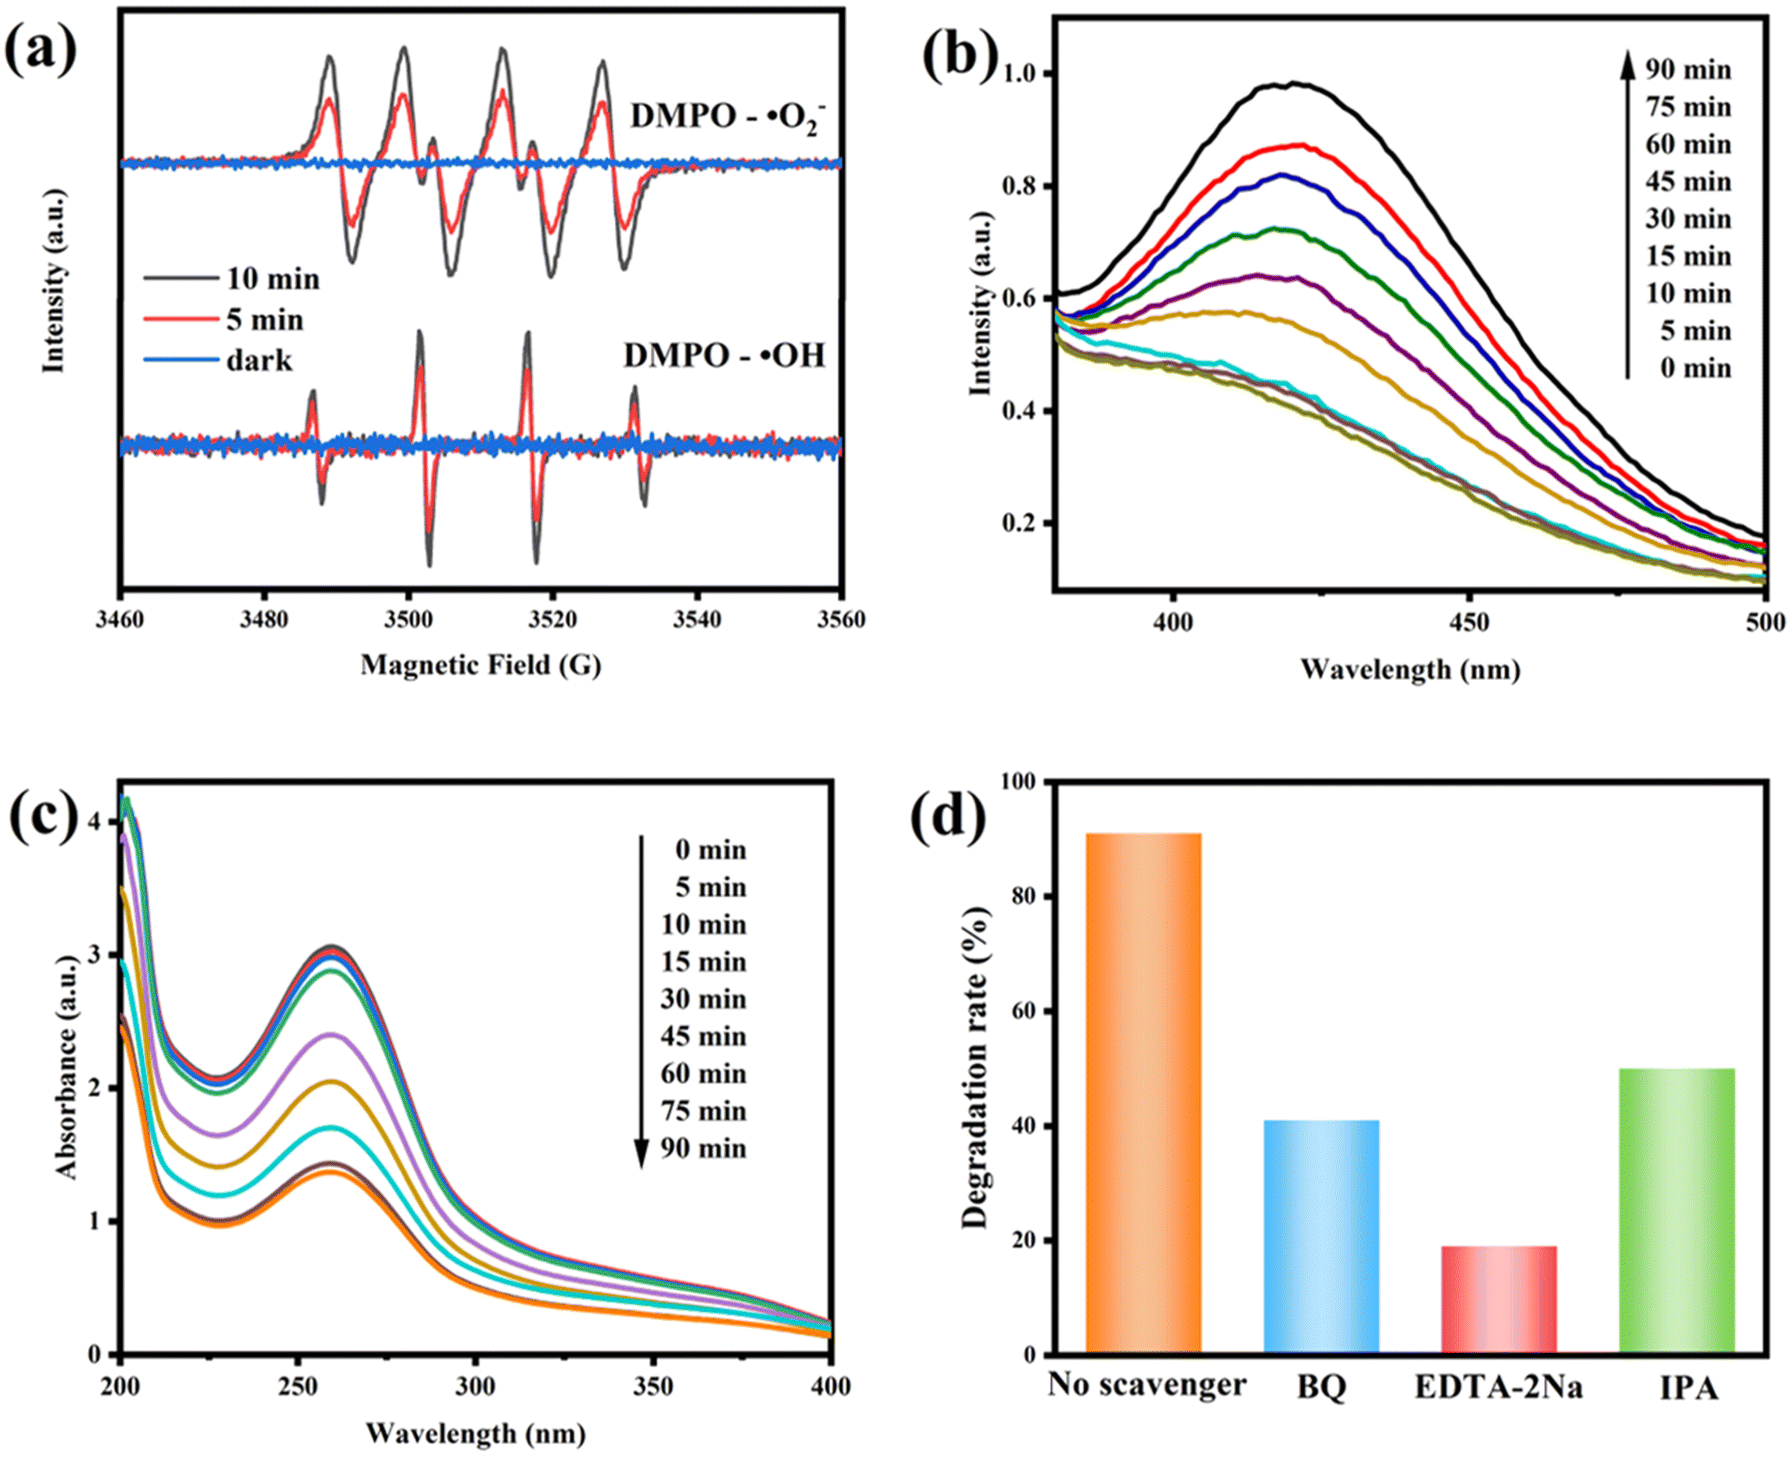 | ||
| Fig. 12 (a) ESR spectra of the DMPO–·O2− and DMPO–·OH adducts in 10CBB aqueous suspension under dark and illuminated conditions (5 min and 10 min); (b) PL spectra of TA aqueous suspension containing the 10CBB photocatalyst; (c) UV-vis absorbance spectra of NBT aqueous solution containing the 10CBB photocatalyst; (d) experiments on the capture of active species during RhB photodegradation. | ||
Further, the trapping experiment of ·O2−, ·OH, and h+ was also performed using benzoquinone (BQ), isopropyl alcohol (IPA), and disodium ethylenediaminetetraacetate (EDTA-2Na), respectively. As shown in Fig. 12d, the degradation efficiency was only 19% after the addition of EDTA-2Na, implying that h+ was the primary radical responsible for RhB degradation. Degradation rates of 41% and 50% were respectively achieved after adding BQ and IPA. These indicated that ·O2− and ·OH were also active species involved in the process of photodegradation.
Based on the above experiment and energy band structure, a reasonable mechanism of photodegradation was proposed. Prior to this, the conduction and valence band positions of BSC, BOC and CdS before contact were calculated according to eqn (1), (2) and (3) (Fig. 13a). After being in contact with each other to form a heterojunction, the energy levels of CdS, BOC, and BSC were moved in order to maintain the equilibrium of the Fermi energy level, and then the composite photocatalyst absorbed enough visible light energy, making the electrons excited from the VB to the CB.
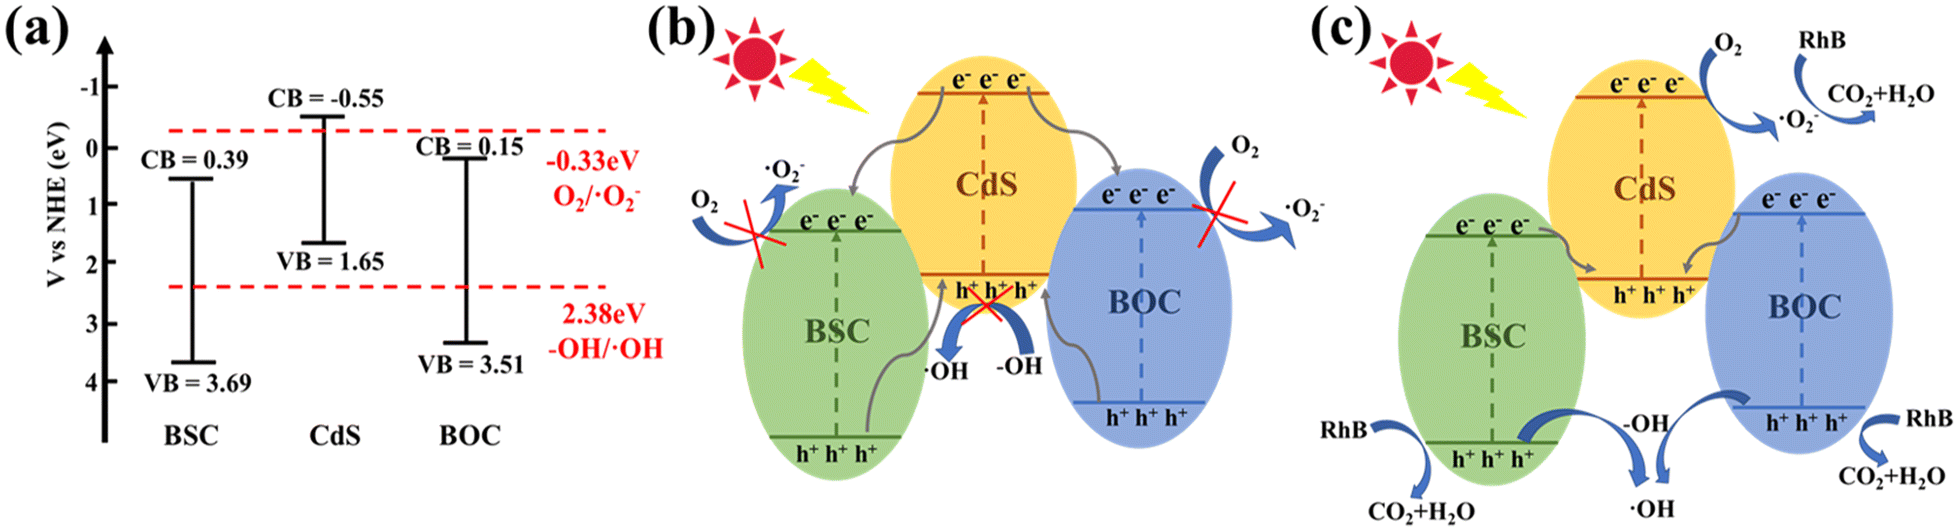 | ||
| Fig. 13 (a) Band structure before contact, (b) type II heterojunction mechanism, and (c) double Z-scheme heterojunction mechanism. | ||
First, if it's a type II heterojunction system (Fig. 13b), electrons will transfer from the CB of CdS to the CBs of BOC and BSC. The CB potentials of BSC and BOC are more positive than that of O2/·O2− (−0.33 eV vs. NHE), so the electrons are not able to reduce O2. Similarly, h+ will eventually transfer to the VB of CdS. But the VB of CdS is more negative than that of H2O/·OH (2.38 eV vs. NHE), so h+ cannot oxidize H2O to produce ·OH.58,59 Therefore, the traditional type II heterojunction mechanism is inconsistent with the ESR and radical capture experimental results reported in this work.
As a consequence, a more reasonable double Z-scheme heterostructure degradation process was also evaluated. As shown in Fig. 13c, the electrons on the CBs of BSC and BOC transfer to the VB of CdS. After the migration of electrons is completed, most of the electrons are located in the CB of CdS (<−0.33 eV), where they can reduce O2 to produce ·O2−. The holes occupy the VB of BSC and BOC (>2.38 eV), where they can oxidize H2O to generate ·OH.60,61 Thus, ·OH, ·O2− and h+ further degrade RhB to H2O, CO2, and other small molecules. The redox capacity of the double Z-scheme heterojunction mechanism is stronger than that of type II, which can effectively promote carrier separation.
4. Conclusions
In this study, we synthesized innovative ternary CdS/Bi2O2CO3/BiOCl photocatalysts with a double Z-scheme heterojunction through a one-pot method. Compared with the single components, the ternary composite photocatalysts had a better adsorption performance, higher carrier separation efficiency, stronger visible light absorption and longer fluorescence lifetime. The photocatalytic activity test results showed that the CBB photocatalysts (0.1 g, pH = 5) have a superior degradation effect on RhB (20 mg mL−1) under visible light. The high catalytic activity was still maintained after four cycles of testing. The reasons for the improved activity of the ternary photocatalysts include the narrowing of the forbidden band width and the light response range widening to the visible light area. And a double Z-scheme heterojunction is also formed, which increases the carrier separation efficiency and improves the electron migration path. We believe that this article will provide new ideas for the structural design of Bi-based ternary photocatalysts.Author contributions
Yueyi Li: formal analysis, investigation, methodology, data curation, and writing – original draft. Yuehui Liu: formal analysis, investigation, methodology, and writing – original draft. Xuguang Liu: project administration and writing – review & editing. Xia Li: supervision, project administration, and writing – review & editing.Conflicts of interest
There are no conflicts to declare.Acknowledgements
This work was supported by the Natural Science Foundation of Shandong Province (Approval No.: ZR2022ME054).References
- D. Han, M. J. Currell and G. Cao, Environ. Pollut., 2016, 218, 1222–1233 CrossRef CAS.
- A. Wang, J. Zhang, W. Zhao, W. Zhu and Q. Zhong, J. Alloys Compd., 2018, 748, 929–937 CrossRef CAS.
- Q. Feng, D. Tang, H. Lv, W. Zhang and W. Li, J. Alloys Compd., 2017, 691, 185–194 CrossRef CAS.
- Y. Ma, Y. Bian, P. Tan, Y. Shang, Y. Liu, L. Wu, A. Zhu, W. Liu, X. Xiong and J. Pan, J. Colloid Interface Sci., 2017, 497, 144–154 CrossRef CAS PubMed.
- S. Thakur, T. Kshetri, N. H. Kim and J. H. Lee, J. Catal., 2017, 345, 78–86 CrossRef CAS.
- S. Adhikari, S. Mandal and D. H. Kim, J. Hazard. Mater., 2021, 418, 126263–126279 CrossRef CAS PubMed.
- Y. Zhang, L. Wang, F. Dong, Q. Chen, H. Jiang, M. Xu and J. Shi, J. Colloid Interface Sci., 2019, 536, 575–585 CrossRef CAS PubMed.
- Y. Huang, H. Xu, H. Yang, Y. Lin, H. Liu and Y. Tong, ACS Sustainable Chem. Eng., 2018, 6, 2751–2757 CrossRef CAS.
- X. Meng, L. Yao, L. Shi, Y. Zhang and L. Cui, Mater. Sci. Semicond. Process., 2021, 121, 105411–105419 CrossRef CAS.
- F. Duo, Y. Wang, X. Mao, X. Zhang, Y. Wang and C. Fan, Appl. Surf. Sci., 2015, 340, 35–42 CrossRef CAS.
- X. Li, J. Chen, H. Li, J. Li, Y. Xu, Y. Liu and J. Zhou, J. Nat. Gas Chem., 2011, 20, 413–417 CrossRef CAS.
- X. Zhang, X. B. Wang, L. W. Wang, W. K. Wang, L. L. Long, W. W. Li and H. Q. Yu, ACS Appl. Mater. Interfaces, 2014, 6, 7766–7772 CrossRef CAS.
- H. Huang, X. Li, J. Wang, F. Dong, P. K. Chu, T. Zhang and Y. Zhang, ACS Catal., 2015, 5, 4094–4103 CrossRef CAS.
- T. Saison, N. Chemin, C. Chanéac, O. Durupthy, V. Ruaux, L. Mariey, F. Maugé, P. Beaunier and J.-P. Jolivet, J. Phys. Chem. C, 2011, 115, 5657–5666 CrossRef CAS.
- Z. Ni, Y. Sun, Y. Zhang and F. Dong, Appl. Surf. Sci., 2016, 365, 314–335 CrossRef CAS.
- S. Füldner, P. Pohla, H. Bartling, S. Dankesreiter, R. Stadler, M. Gruber, A. Pfitzner and B. König, Green Chem., 2011, 13, 640–643 RSC.
- F. Wang, F. Zhou, S. Zhan, Q. He, Y. Song, C. Zhang and J. Lai, Environ. Res., 2021, 198, 111256–111264 CrossRef CAS.
- J. Zhang, W. Cui, P. Chen, K. Li, H. Wu and F. Dong, Catal. Today, 2021, 380, 230–236 CrossRef CAS.
- H. Huang, Y. He, X. Du, P. K. Chu and Y. Zhang, ACS Sustainable Chem. Eng., 2015, 3, 3262–3273 CrossRef CAS.
- H. Huang, K. Xiao, K. Liu, S. Yu and Y. Zhang, Cryst. Growth Des., 2015, 16, 221–228 CrossRef.
- H.-P. Lin, W. W. Lee, S.-T. Huang, L.-W. Chen, T.-W. Yeh, J.-Y. Fu and C.-C. Chen, J. Mol. Catal. A: Chem., 2016, 417, 168–183 CrossRef CAS.
- N. Liang, M. Wang, L. Jin, S. Huang, W. Chen, M. Xu, Q. He, J. Zai, N. Fang and X. Qian, ACS Appl. Mater. Interfaces, 2014, 6, 11698–11705 CrossRef CAS.
- N. Wetchakun, S. Chaiwichain, B. Inceesungvorn, K. Pingmuang, S. Phanichphant, A. I. Minett and J. Chen, ACS Appl. Mater. Interfaces, 2021, 4, 3718–3723 CrossRef PubMed.
- D. Liu, S. Chen, R. Li and T. Peng, Wuli Huaxue Xuebao, 2020, 0, 2010017–2010047 Search PubMed.
- X. Wu, J. Zhao, L. Wang, M. Han, M. Zhang, H. Wang, H. Huang, Y. Liu and Z. Kang, Appl. Catal., B, 2017, 206, 501–509 CrossRef CAS.
- S. Zhong, H. Zhou, M. Shen, Y. Yao and Q. Gao, J. Alloys Compd., 2021, 853, 157307–157317 CrossRef CAS.
- R. Wang, P. Zhu, M. Duan, J. Xu, M. Liu and D. Luo, J. Alloys Compd., 2021, 870, 159385–159398 CrossRef CAS.
- L. Wang, H. Yin, S. Wang, J. Wang and S. Ai, Appl. Catal., B, 2022, 305, 121039–121054 CrossRef CAS.
- Y. Liu, J. Xu and M. Chen, Sep. Purif. Technol., 2021, 276, 119255–119264 CrossRef CAS.
- D. Majhi, K. Das, A. Mishra, R. Dhiman and B. G. Mishra, Appl. Catal., B, 2020, 260, 118222–118234 CrossRef CAS.
- W. Cui, W. An, L. Liu, J. Hu and Y. Liang, Appl. Surf. Sci., 2014, 319, 298–305 CrossRef CAS.
- Q. Li, Z. Guan, D. Wu, X. Zhao, S. Bao, B. Tian and J. Zhang, ACS Sustainable Chem. Eng., 2017, 5, 6958–6968 CrossRef CAS.
- J. Hu, D. Chen, N. Li, Q. Xu, H. Li, J. He and J. Lu, ACS Sustainable Chem. Eng., 2018, 6, 2676–2683 CrossRef CAS.
- Q. Xiang, J. Yu and M. Jaroniec, J. Phys. Chem. C, 2011, 115, 7355–7363 CrossRef CAS.
- A. Mohamed, M. M. Ghobara, M. K. Abdelmaksoud and G. G. Mohamed, Sep. Purif. Technol., 2019, 210, 935–942 CrossRef CAS.
- I. Ilia, M. Stamatakis and T. Perraki, Open Geosci., 2009, 1, 393–403 CrossRef.
- L. Zhang, C. Hu and H. Ji, Appl. Catal., B, 2017, 205, 34–41 CrossRef CAS.
- Q. Wang, J. Hui, J. Li, Y. Cai, S. Yin, F. Wang and B. Su, Appl. Surf. Sci., 2013, 283, 577–583 CrossRef CAS.
- Y. Guo, H. Huang, Y. He, N. Tian, T. Zhang, P. K. Chu, Q. An and Y. Zhang, Nanoscale, 2015, 7, 11702–11711 RSC.
- S. Shenoy, K. Tarafder and K. Sridharan, Phys. B, 2020, 595, 412367–412373 CrossRef CAS.
- T. Senasu, S. Nijpanich, S. Juabrum, N. Chanlek and S. Nanan, Appl. Surf. Sci., 2021, 567, 150850–150868 CrossRef CAS.
- L.-w. Shan, G.-l. Wang, L.-z. Liu and Z. Wu, J. Mol. Catal. A: Chem., 2015, 406, 145–151 CrossRef CAS.
- X. Lin, Y. Wang, J. Zheng, C. Liu, Y. Yang and G. Che, Dalton Trans., 2015, 44, 19185–19193 RSC.
- D. Vidyasagar, S. G. Ghugal, A. Kulkarni, P. Mishra, A. G. Shende, Jagannath, S. S. Umare and R. Sasikala, Appl. Catal., B, 2018, 221, 339–348 CrossRef CAS.
- F. Xu, Y. Yuan, H. Han, D. Wu, Z. Gao and K. Jiang, CrystEngComm, 2012, 14, 3615–3622 RSC.
- Y. Zhang, D. Li, Y. Zhang, X. Zhou, S. Guo and L. Yang, J. Mater. Chem. A, 2014, 2, 8273–8280 RSC.
- Q. Yan, Y. Fu, Y. Zhang, H. Wang, S. Wang and W. Cui, Sep. Purif. Technol., 2021, 263, 118389–118399 CrossRef CAS.
- B. Zhang, Y. Liu, K. Zhou, H. Zhu, D. Gu, W. Ge, Y. Gan and J. Hao, J. Mater. Sci.: Mater. Electron., 2021, 32, 20539–20547 CrossRef CAS.
- L. Ye, J. Liu, C. Gong, L. Tian, T. Peng and L. Zan, ACS Catal., 2012, 2, 1677–1683 CrossRef CAS.
- Q. Fan, Y. Huang, C. Zhang, J. Liu, L. Piao, Y. Yu, S. Zuo and B. Li, Catal. Today, 2016, 264, 250–256 CrossRef CAS.
- X. Zheng, J. Yuan, J. Shen, J. Liang, J. Che, B. Tang, G. He and H. Chen, J. Mater. Sci.: Mater. Electron., 2019, 30, 5986–5994 CrossRef CAS.
- Y. Liu, X. Shi, X. Liu and X. Li, Int. J. Hydrogen Energy, 2022, 47, 11211–11223 CrossRef CAS.
- B. Shao, X. Liu, Z. Liu, G. Zeng, Q. Liang, C. Liang, Y. Cheng, W. Zhang, Y. Liu and S. Gong, Chem. Eng. J., 2019, 368, 730–745 CrossRef CAS.
- Z. Chen, S. Yu, J. Liu, Y. Zhang, Y. Wang, J. Yu, M. Yuan, P. Zhang, W. Liu and J. Zhang, Environ. Res., 2023, 232, 116311–116324 CrossRef CAS PubMed.
- Y. Zhou, J. Zhang and D. Wu, ChemistrySelect, 2023, 8, e202301237–e202301249 CrossRef CAS.
- D. Majhi, Y. P. Bhoi, P. K. Samal and B. G. Mishra, Appl. Surf. Sci., 2018, 455, 891–902 CrossRef CAS.
- S. Obregón, M. A. Ruíz-Gómez and D. B. Hernández-Uresti, J. Colloid Interface Sci., 2017, 506, 111–119 CrossRef.
- X. Yan, Q. Ji, C. Wang, J. Xu and L. Wang, J. Colloid Interface Sci., 2021, 587, 820–830 CrossRef CAS.
- A. G. Shende, T. Bhoyar, D. Vidyasagar, J. Singh, P. T. Kosankar and S. S. Umare, ChemistrySelect, 2021, 6, 6707–6713 CrossRef CAS.
- C. Lai, F. Xu, M. Zhang, B. Li, S. Liu, H. Yi, L. Li, L. Qin, X. Liu, Y. Fu, N. An, H. Yang, X. Huo, X. Yang and H. Yan, J. Colloid Interface Sci., 2021, 588, 283–294 CrossRef CAS PubMed.
- T. Bhoyar, D. J. Kim, B. M. Abraham, S. Tonda, N. R. Manwar, D. Vidyasagar and S. S. Umare, Appl. Catal., B, 2022, 310, 121347–121357 CrossRef CAS.
Footnote |
| † Electronic supplementary information (ESI) available. See DOI: https://doi.org/10.1039/d3re00407d |
| This journal is © The Royal Society of Chemistry 2024 |