An investigation on a WO3/MoO3−x heterojunction photocatalyst for excellent photocatalytic performance and enhanced molecular oxygen activation ability†
Yuxuan
Shao
a,
Dan
You
*a,
Yuqi
Wan
ab,
Qingrong
Cheng
 *a and
Zhiquan
Pan
a
aEngineering Research Center of Phosphorous Development and Utilization of Ministry of Education, Wuhan Institute of Technology, Wuhan, 430205, PR China. E-mail: apnaor@qq.com; chengqr383121@sina.com
bThe Department of Electrical and Electronic Engineering, The University of Hong Kong, Hong Kong, 999077, PR China
First published on 15th September 2023
Abstract
The activation capacity of molecular oxygen is an important indicator to evaluate the photocatalytic efficiency of a catalyst. In this paper, MoO3−x nanosheets with oxygen vacancies were deposited on WO3 nanoflowers to form a WOM heterojunction, which improved the photocatalytic performance and molecular oxygen activation ability of the catalyst. This novel WOM heterojunction exhibited excellent photoactivity for degrading rhodamine B (RhB), photocatalytic water splitting ability and molecular oxygen activation ability under sunlight irradiation. Among all the samples, WOM83% could degrade 98% of 30 ppm RhB in 40 min. Meanwhile, WOM83% exhibited the highest hydrogen generation rate (4214.2 μmol h−1 g−1) and the strongest TMB oxidation capacity, and can generate 2.23 μmol of ·O2− in 50 min. The enhanced photocatalytic performance via heterojunction construction may be attributed to these following reasons: (i) higher light absorption achieved by the MoO3−x and WO3 composite; (ii) the matched energy band gap of MoO3−x and WO3 led to higher photogenerated carrier mobility; (iii) MoO3−x with oxygen vacancies as electron traps suppressed the photogenerated carrier recombination; (iv) enhanced molecular oxygen activation ability of the WOM heterojunction, such as the production of ·O2−. The measurements for TMB photo-oxidation and ·O2− showed excellent molecular oxygen activation ability of WOM heterojunctions. Finally, a possible photocatalytic mechanism was proposed. This study provided a viable option for the application of materials with oxygen vacancies to remove pollutants and improve molecular oxygen activation ability.
1. Introduction
With the rapid development of industry in recent decades, more and more factory wastewater is being discharged into rivers and oceans, posing a great threat to the survival of humans and other organisms.1–3 Dye wastewater has a more serious impact. Dye wastewater has many problems such as dark colour, staining that is difficult to remove, carcinogenicity and teratogenicity, low biodegradability, high stability and high emissions, so researchers have made a number of efforts to eliminate dyes from wastewater.4 The usual methods of water treatment are natural sedimentation, electrostatic adsorption and membrane separation,5,6 but these methods have high costs, low treatment efficiency, incomplete treatment and are prone to secondary pollution.7,8 Meanwhile, over-consumption of fossil fuels has triggered an energy crisis,9,10 while hydrogen energy is a green, environmentally friendly and safe source of clean energy.11–13 Due to the high cost of hydrogen production, photocatalysis was considered as the best way to produce hydrogen in large quantities,14 and photocatalysis is also an emerging, cutting-edge, green, inexpensive and efficient technology.15–17 However, the photocatalytic performance of semiconductors depends on the size of the band gap. High band gap semiconductors, such as TiO2 and ZnO,18–20 can only be excited by ultraviolet light, which accounts for 5% of the sunlight and has a low utilisation of light energy.21 Narrow bandgap semiconductors such as PbS, PbTe, etc. have a narrow bandgap, which makes it easy for photogenerated carriers to recombine and reduces photocatalytic efficiency.Semiconductors with moderate band gaps have become increasingly popular in recent decades for photocatalytic applications such as BiOIO3,22 g-C3N4,23,24 CdS,25 Ag3PO4,26etc. Among them, tungsten trioxide (WO3) is a semiconductor with a moderate band gap, high chemical stability and good solar response,27–30 environmentally friendly and non-toxic, which was widely used in photocatalytic hydrogen production, carbon dioxide reduction and pollutant degradation.31 However, WO3 has many disadvantages such as a small specific surface area and fast photogenerated charge recombination, which inhibits its photocatalytic applications.32 Usually, WO3 is combined with other semiconductors to build heterojunctions for improving the photocatalytic performance, such as WO3/TiO2,33,34 Ag@WO3,35 WO3/CNT36 and others.
Molybdenum trioxide (MoO3), similar to WO3, is a moderate band gap semiconductor with important applications in batteries, thin films, and sensors. Due to the low solar light utilization and high photogenerated carrier recombination efficiency of MoO3, its application in photocatalysis is limited. Recent studies have shown that defect engineering can improve the photocatalytic performance of MoO3.37 MoO3 with oxygen vacancies exhibited localized surface plasmon resonance (LSPR) effects, and the LSPR effect can broaden the light absorption range of semiconductors, thus improving the light absorption capacity.38–41 In addition, oxygen vacancies can act as an electron trap to impede the recombination of photogenerated carriers.42 Therefore, MoO3−x also has a lower band gap and higher photogenerated charge separation efficiency. As a non-precious metal and a semiconductor with the LSPR effect, MoO3−x has a wider range of photocatalytic applications. MoO3−x is often used to build heterojunctions with other semiconductors to further enhance the photocatalytic performance, such as MoS2/MoO3−x,43 TiO2/MoO3−x,44 g-C3N4/MoO3−x,45,46 SnO2/MoO3−x,47 WO3−x/MoO3−x,48etc.
Molecular oxygen is a green molecular oxidant. Activated molecular oxygen is called reactive oxygen species (ROS), such as superoxide radicals (·O2−), hydrogen peroxide (·OH), etc. Photocatalysis is a gentle method of generating reactive oxygen species, in which photogenerated electrons and holes interact with molecular oxygen in a series of interactions to produce ROS under light illumination.49
There is little research on the photocatalytic performances of MoO3 with oxygen-vacancies and its heterojunction. In this study, a novel WOM heterojunction photocatalyst was constructed using MoO3 with oxygen-vacancies and WO3 by the solvothermal method. To evaluate its photocatalytic performance, the molecular oxygen activation capacity, the photodegradation of RhB and NBT, the photo-oxidation of TMB and the photocatalytic water splitting ability under sunlight irradiation were also investigated.
2. Experiment
2.1 Reagents
The chemicals used in the experiment were all of analytical grade and used without further purification.N,N′-Dimethylformamide (DMF), ethanol (C2H6O), 30% hydrogen peroxide (H2O2), ethylenediaminetetraacetic acid (EDTA), tert-butanol (t-BuOH), benzoquinone (BQ), and carbon tetrachloride (CCl4) were purchased from Shanghai Sinopharm Chemical Reagent Co. Tungsten chloride (WCl6), nitrotetrazolium blue chloride (NBT), rhodamine B (RhB), and molybdenum powder (Mo) were obtained from Macklin Reagent. L-Histidine (L-His) was bought from Ge Ao Chemical Reagent Co. 3,3′,5,5′-Tetramethylbenzidine (TMB) was bought from Aladdin Reagent.
2.2 Synthesis of the WO3 nanoflowers
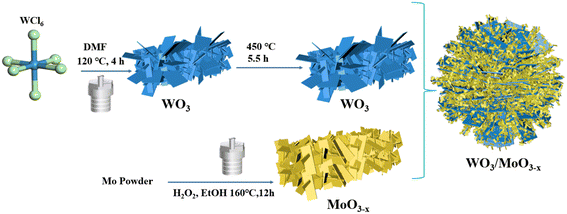
WO3 nanoflowers were synthesized by the solvothermal method.50 1.0 g of WCl6 was dissolved in 30 ml DMF, then after the mixture was completely dissolved, it was magnetically stirred for 20 h. Then the solution was transferred to a Teflon high-pressure reactor and heated at 120 °C for 4 h. After cooling to room temperature, a white precipitate was collected and washed three times with deionized and ethanol, respectively. In the end, it was dried in a vacuum drying oven at 60 °C for 12 h. The white solid was annealed in a muffle furnace at 450 °C for 5 h.2.3 Synthesis of the MoO3−x nanosheets
MoO3−x nanosheets were synthesized by a previously reported hydrothermal method.51 0.192 g of molybdenum powder was dispersed in 24 ml of ethanol and 88 mmol of 30% hydrogen peroxide was added, after stirring for 30 minutes, the molybdenum powder dissolved and formed a yellow solution, then the solution was transferred to a Teflon high-pressure reactor and heated at 160 °C for 12 h. After cooling to room temperature, the blue-black product was washed three times with ethanol, then dried under air at 60 °C for 12 h.2.4 Synthesis of WO3/MoO3−x heterojunctions
WO3/MoO3−x heterojunctions were obtained by a one-step simple solvothermal method. 0.1 g of WO3 was dispersed in 24 ml of ethanol, then an amount of molybdenum powder and 30% hydrogen peroxide were added, followed by stirring for 30 minutes to obtain a yellow solution. The solution was transferred to a Teflon high-pressure reactor and heated at 160 °C for 12 h. After cooling to ambient temperature, the obtained blue-black precipitate was washed three times with ethanol and dried under air at 60 °C for 12 h. Thereinto, different mass ratios of MoO3−x were denoted as WO3/MoO(3−x)y (y = 30%, 50% and 83%), abbreviated as WOMy, respectively. The synthesis process of WO3/MoO3−x is illustrated in Scheme 1.2.5 Photoactivity and cycling experiments
The photodegradation efficiency of all the catalysts was evaluated by degradation of RhB under sunlight irradiation. Before illumination, 10 mg of photocatalyst was added to 50 ml of 30 ppm RhB solution and then stirred for 30 minutes in the dark to gain adsorption–desorption equilibrium. Then, the RhB mixture was photodegraded under a 300 W Xe lamp. After 5 min intervals, 3 ml of the solution was aspirated, the solid particles were removed by a 0.22 μm microporous filter and the actual concentration of RhB was measured with a UV-visible spectrophotometer at the maximum absorption peak at 550 nm.In order to determine the active species produced in photocatalysis, nitrotetrazolium blue chloride (NBT), ethylenediaminetetraacetic acid (EDTA), L-histidine, and tert-butanol were used as scavengers to capture the superoxide radical (·O2−), hole (h+), singlet oxygen (1O2), and hydroxyl radical (·OH), respectively. During the photocatalytic reaction, 10 mg EDTA, 10 mg L-histidine,1 ml tert-butanol and 1 ml 0.4 mM NBT were added to the RhB solution, respectively. Then the operations were the same as the photocatalytic degradation TC experiment.
The stability of the WOM83% heterojunction photocatalyst was measured by six consecutive photodegradation experiments of RhB.
2.6 Photocatalytic hydrogen production test
Before illumination, 30 mg of photocatalyst, 80 ml deionized water, 10 ml 0.25 M sodium sulfide solution, and 10 ml 0.35 M sodium sulfite solution were added to a sealed quartz reactor. After stirring completely, N2 was slowly passed through the reactor for 30 minutes until interfering gases (like O2, CO2) were removed from the reactor. The mixture was irradiated under sunlight with a 300 W Xe lamp, the gas in the reactor was extracted every hour and the amount of hydrogen was measured by a gas chromatograph. Usually, hydrogen was continuously collected over 4 hours; meanwhile, four cycles of hydrogen generation experiments were also conducted.2.7 Photocatalytic ROS detection
Molecular oxygen activation capacity was measured by 3,3′,5,5′-tetramethylbenzidine (TMB) photo-oxidation.52 Usually, 4 mg of photocatalyst was ultrasonically dispersed in 1 ml of pure water, then 0.2 ml of the mixture was added to 50 ml of 0.5 mM TMB HAc/NaAc buffer, the 3,3′,5,5′-tetramethylbenzidine (TMB). The mixture was irradiated under a 300 W Xe lamp. 3 ml solution was taken every 3 minutes and the solid particles were removed by a 0.22 μm microporous filter. The TMB photo-oxidation product concentrations were recorded by a UV-visible spectrophotometer at 370 nm. In order to explore the reactive oxygen species during the photocatalytic reaction, 10 mg EDTA, 10 mg L-histidine, 1 ml 0.4 mM NBT, 1 ml tert-butanol and 1 ml CCl4 were added to the TMB solution, respectively. Then the operations were the same as the photo-oxidation TMB experiment.20 ppm NBT was used to measure the ·O2− concentration, because the reaction molar ratio of NBT with ·O2− is 1![[thin space (1/6-em)]](https://www.rsc.org/images/entities/char_2009.gif) :
:![[thin space (1/6-em)]](https://www.rsc.org/images/entities/char_2009.gif) 4. Commonly, 10 mg of WO3, MoO3−x and WOM83% was added to 50 ml of 20 ppm NBT solution and then stirred for 30 min in the dark to gain adsorption–desorption equilibrium. Then, the mixture was photodegraded under a 300 W Xe lamp. Every 10 min, 3 ml of the solution was aspirated, the solid particles were removed by a 0.22 μm microporous filter and the actual concentration of NBT was measured by a UV-visible spectrophotometer at the maximum absorption peak at 259 nm.
4. Commonly, 10 mg of WO3, MoO3−x and WOM83% was added to 50 ml of 20 ppm NBT solution and then stirred for 30 min in the dark to gain adsorption–desorption equilibrium. Then, the mixture was photodegraded under a 300 W Xe lamp. Every 10 min, 3 ml of the solution was aspirated, the solid particles were removed by a 0.22 μm microporous filter and the actual concentration of NBT was measured by a UV-visible spectrophotometer at the maximum absorption peak at 259 nm.
2.8 Electrochemical tests
Electrochemical measurements were carried out on an electrochemical workstation (CHI 760E) connected to a standard three-electrode system, namely the working electrode prepared from the test sample, a platinum plate as the counter electrode and a saturated Ag/AgCl electrode as the reference electrode. The working electrode was prepared as follows: 10 mg of sample was weighed and poured into a 5 mL EP tube, then 2 mL of Nafion injection (Nafion![[thin space (1/6-em)]](https://www.rsc.org/images/entities/char_2009.gif) :
:![[thin space (1/6-em)]](https://www.rsc.org/images/entities/char_2009.gif) isopropanol = 1
isopropanol = 1![[thin space (1/6-em)]](https://www.rsc.org/images/entities/char_2009.gif) :
:![[thin space (1/6-em)]](https://www.rsc.org/images/entities/char_2009.gif) 25) was added and sonicated for 15 min. 200 μL of each drop was applied to the conductive glass surface using a micro syringe, dispersed evenly and dried under a sun lamp. The test system for both was 0.5 M Na2SO4 solution, which was required to submerge the three electrodes. Electrochemical impedance spectroscopy (EIS) data were obtained from the electrochemical workstation with a circuit potential in the frequency range of 0.1 Hz–100 kHz and a test voltage of 1.5 eV. Samples were subjected to transient photocurrent response (PC) under sun light conditions (300 W xenon lamp) for 30 s with the lamp on and 30 s with the lamp off for 5 consecutive cycles.
25) was added and sonicated for 15 min. 200 μL of each drop was applied to the conductive glass surface using a micro syringe, dispersed evenly and dried under a sun lamp. The test system for both was 0.5 M Na2SO4 solution, which was required to submerge the three electrodes. Electrochemical impedance spectroscopy (EIS) data were obtained from the electrochemical workstation with a circuit potential in the frequency range of 0.1 Hz–100 kHz and a test voltage of 1.5 eV. Samples were subjected to transient photocurrent response (PC) under sun light conditions (300 W xenon lamp) for 30 s with the lamp on and 30 s with the lamp off for 5 consecutive cycles.
2.9 Characterization
The crystal structures of the photocatalysts were characterized by powder X-ray diffraction (XRD) on a Bruker D8 Advance diffractometer using Cu Kα1 radiation at an operating voltage of 40 kV and current of 40 mA. The scanning speed was 2° per minute and the angle range was 5–90°. The morphology of the photocatalysts was investigated through scanning electron microscopy (SEM, TESCAN MIRA LMS at an accelerating voltage of 15 kV) and transmission electron microscopy (TEM, JEM-2100 at an accelerating voltage of 200 kV). Elemental distributions of the material were studied with EDS and element mapping images. The element valance states of the photocatalysts were measured through XPS (Thermo Scientific K-Alpha) and using Mg Kα radiation as the non-monochromatized source (hν = 1253.6 eV). Meanwhile, the electron binding energies of the elements were corrected using C 1s as the reference (284.8 eV). The UV-vis diffuse reflectance spectra (DRS) of the photocatalysts were measured using a Shimadzu UV-3600 spectrometer with BaSO4 as the reference and the wavelength range of the test was 200–800 nm. The Mott–Schottky curves (M–S) of the samples were recorded on a CHI 760E electrochemical system (Chenhua, Shanghai, China) at the frequency of 1000 and 1500 Hz in 0.5 M Na2SO4 solution with the Ag/AgCl potential varying from −1.0 to 1.0 eV. ESR was carried out on a Bruker EMXplus-6/1 self-selecting resonator with DMPO and TEMP as trapping reagents and electron paramagnetic resonance (EPR) spectra were recorded on a Bruker EMXplus-6/1 at room temperature and the magnetic field modulation frequency was 100 kHz. The photodegradation products of RhB were recorded by high-performance liquid chromatography-mass spectrometry (HPLC-MS, Agilent-1290/6550-QTOF LC/MS). The Brunauer–Emmett–Teller (BET) specific surface area was measured by the nitrogen adsorption–desorption method using a Micromeritics ASAP 2460. Photoluminescence (PL) spectra were measured with an Edinburgh FLS1000 and the excitation wavelength was 455 nm.3. 3.Results and discussion
3.1 Characterization
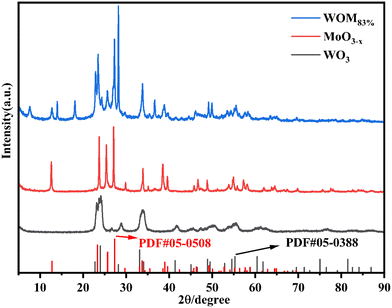
The XRD patterns of the photocatalysts are shown in Fig. 1. For WO3, the peaks at 22.7°, 24.0°, 28.2°, 33.2° and 34.1° were attributed to the (001), (110), (101), (111) and (200) planes, respectively. The diffraction peak results were consistent with that of WO3 (PDF#05-0388), indicating the successful synthesis of WO3. For MoO3−x, the main diffraction peaks at 12.6°, 23.7°, 25.4°, 27.1°, 33.9°, and 38.5° were attributed to the (020), (110), (040), (021), (111) and (060) crystal planes of MoO3−x, respectively, which was consistent with the results reported in the literature.51 For WOM83%, the diffraction peaks appeared at 12.6°, 23.7°, 25.4°, 27.1°, 33.9°, and 38.5°, which corresponded to MoO3−x. Meanwhile, the diffraction peaks of WO3 were discovered at 22.7°, 24.0°, 28.2° and 33.2°, revealing that both WO3 and MoO3−x appeared in the heterojunction.The microscopy morphologies of the monomers and the heterojunctions were studied by scanning electron microscopy (SEM) and transmission electron microscopy (TEM). As shown in Fig. 2(a) and (d), spherical WO3 nanoflowers self-assembled from some nanosheets with a length of tens to hundreds of nm. As shown in Fig. 2(b) and (e), MoO3−x showed an irregular sheet-like stacked structure, and the average length was about 2–3 μm, which was consistent with the reported literature.51 As shown in Fig. 2(c) and S1,† the WOM83% composite exhibited a distinct nanoflower shape, and MoO3−x nanosheets with smaller size grew tightly on the surface of the larger WO3 nanoflowers. Meanwhile, MoO3−x nanosheets also self-assembled into a nano-flower shape, increasing the specific surface area of the catalyst. In addition, the lattice spacing was obtained from the HRTEM image of Fig. 2(f), and the lattice pitch of 0.39 and 0.38 nm was attributed to the (001) crystal planes of WO3 and the (110) crystal planes of MoO3−x, respectively, which indicated that WO3 and MoO3−x existed and interacted with each other in the heterojunctions. In order to further research the elements in WOM83%, EDS mapping was performed and shown in Fig. S2.† The results showed the presence of W, Mo and O elements, and these elements were evenly distributed throughout the composites, indicating the successful synthesis of the WOM83% heterojunction.
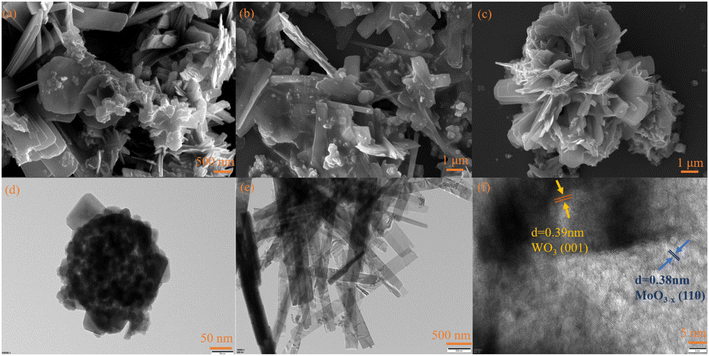 | ||
| Fig. 2 (a) SEM image of WO3, (b) SEM image of MoO3−x, (c) SEM image of WOM83%, (d) TEM image of WO3, (e) TEM image of MoO3−x and (f) HRTEM image of WOM83%. | ||
In order to investigate the specific surface area and pore size distribution of WO3, MoO3−x and WOM83%, BET analysis was conducted. The results are shown in Fig. 3(a). WO3, MoO3−x and WOM83% exhibited type IV isotherms and H3 hysteresis loops, indicating the mesoporous properties of these photocatalysts. Meanwhile, the specific surface areas of WO3, MoO3−x and WOM83% were 21.31 m2 g−1, 14.11 m2 g−1 and 19.64 m2 g−1, respectively. Besides, the pore size distribution shown in Fig. 3(b), (c) and (d) indicated that the pore size of prepared WO3, WOM83% and MoO3−x was about 10.92, 23.47 and 25.98 nm, respectively. The average pore volume increased sequentially and could provide more reactive active sites for adsorption and photocatalysis of RhB.
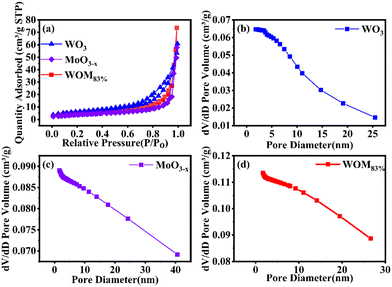 | ||
| Fig. 3 (a) N2 adsorption–desorption isotherm of WO3, MoO3−x and WOM83%; (b), (c) and (d) pore size distribution curves for WO3, MoO3−x and WOM83%. | ||
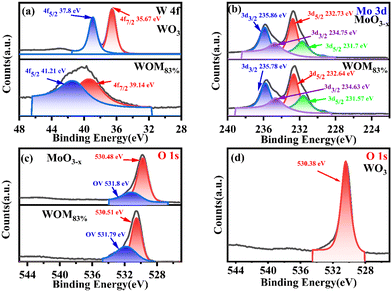
X-ray photoelectron spectroscopy (XPS spectroscopy) was used to study the major elements and chemical bonding energy changes on the surface of the monomers and the composites. The full XPS elemental spectra and high resolution XPS spectra of all the catalysts are shown in Fig. S3† and 4, respectively. The full XPS spectrum exhibited the presence of O W, Mo elements in WOM83%, indicating the successful synthesis of the composites. Fig. 4(a) shows the fine spectra of W 4f in WO3 and WOM83%. For WO3, the peaks of W 4f5/2 (37.8 eV) and W 4f7/2 (35.67 eV) were attributed to W6+. In WOM83%, the peaks of W 4f5/2 (41.21 eV) and W 4f7/2 (39.14 eV) were attributed to W6+. Meanwhile, the peaks of WOM83% shifted to higher binding energy by 3.41 and 3.47 eV, respectively, indicating a strong interaction of MoO3−x and WO3 in WOM83%.
As shown in Fig. 4(b), in MoO3−x, the peaks of Mo 3d3/2 (235.86 eV) and Mo 3d5/2 (232.73 eV) were attributed to Mo6+. However, the peaks of Mo 3d3/2 (234.75 eV) and W 3d5/2 (231.57 eV) were attributed to Mo5+, indicating the presence of Mo5+ in MoO3−x.51 For WOM83%, the peaks of Mo6+ and Mo5+ shifted to lower binding energy by 0.08, 0.09, 0.12 and 0.12 eV, respectively.
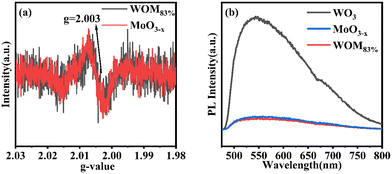
All of these further supported the existence of the interaction between WO3 and MoO3−x in the WOM83% heterojunction. O 1s spectra are shown in Fig. 4(c) and (d). The peaks of O (530.48 eV) in MoO3−x, the peaks of O (530.51 eV) in WOM83% and the peaks of O (530.38 eV) in WO3 were attributed to metal oxides, respectively. However, both WOM83% and MoO3−x showed a faint oxygen peak (531.8 eV), which was attributed to oxygen vacancies. The presence of oxygen vacancies was demonstrated by XPS. To further prove the existence of oxygen vacancies, the oxygen vacancies of MoO3−x and WOM83% were measured through EPR, and the results are shown in Fig. 5(a). Both MoO3−x and WOM83% exhibited a signal peak at the g value of 2.003, which confirmed the presence of oxygen vacancies in MoO3−x and the WOM83% heterojunction.51 Due to the electron trapping effect of oxygen vacancies, the electron cloud was biased from WO3 to MoO3−x, strengthening the interaction between WO3 and MoO3−x in the heterojunctions.
Meanwhile, in order to explore the photogenerated carrier separation ability of the photocatalysts, PL was measured, as shown in Fig. 5(b). WO3 exhibited the highest emission peaks due to having the strongest recombination of photogenerated carriers. Compared with WO3, MoO3−x and WOM83% exhibited low emission peak intensity. Due to the WOM83% was constructed, which showing the lowest emission peaks intensity. Therefore, the presence of oxygen vacancies promoted the photogenerated carrier separation, and construction of heterojunctions can further enhance the photogenerated charge separation efficiency.
The light absorption capacity and absorption range of the photocatalysts were researched by UV-vis spectroscopy. The UV-vis DRS spectra of WO3, MoO3−x and WOM83% are shown in Fig. 6(a). The light absorption ability of MoO3−x was stronger than that of WO3, and WOM83% exhibited strong light absorption ability at 200–800 nm, indicating that MoO3−x was an excellent photoresponsive catalyst due to the LSPR effect. In addition, compared to MoO3−x, the absorption ability of WOM83% was enhanced at 200–800 nm, which indicated that MoO3−x interacted with WO3. The band gap of the catalyst was calculated by the equation αhv = (hv − Eg)1/2, in which α, v and Eg are the absorption coefficient, photon frequency and band gap of the photocatalyst, respectively. As shown in Fig. 6(b), the band gaps of WO3, MoO3−x, and WOM83% were 2.97, 2.81 and 2.78 eV, respectively. The conduction band values of WO3 and MoO3−x were measured from MS curves. When the tangent line of the M–S curve of a semiconductor has a positive slope, the semiconductor is an n-type semiconductor. Fig. 6(c) and (d) showed that both WO3 and MoO3−x were n-type semiconductors, and the Efb of WO3 and MoO3−x was −0.4 V and −0.62 V versus Ag/AgCl, respectively. As the electrode potential of Ag/AgCl was 0.2224 V, the Efb of WO3 and MoO3−x was −0.18 V and −0.4 V vs. NHE, respectively. Meanwhile, because WO3 and MoO3−x were n-type semiconductors, the position of Efb was very close to that of the CB. According to EVB = ECB + Eg, the VB values of WO3 and MoO3−x were 2.79 and 2.41 eV, respectively. As shown in Fig. S4,† the VB values for WO3 and MoO3−x were 2.79 and 2.41 eV, respectively, which was consistent with the calculated values.
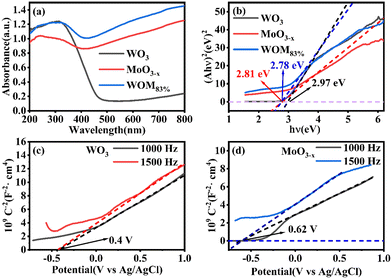 | ||
| Fig. 6 (a) UV-vis DRS spectra of the photocatalysts, (b) band gap diagrams of the photocatalysts, (c) and (d) M–S curves of WO3 and MoO3−x. | ||
In order to study the generation and separation efficiency of photogenerated carriers, photocurrent (PC) response and electrical impedance spectroscopy (EIS) were performed on the photocatalysts. As shown in Fig. 7(a), 5 irradiation cycles were conducted with each cycle being 60 seconds under sunlight irradiation. Usually, the higher the value of photocurrent response, the higher the generation and separation efficiency of the photogenerated electrons and holes. WO3 showed weak photocurrent response, and WOM83% exhibited a stronger photocurrent response than all the photocatalysts, indicating that WOM83% had the strongest photogenerated charge generation and separation efficiency. With increasing the content of MoO3−x in the heterojunction, the photocurrent increased gradually and was very stable, which further verified that the presence of oxygen vacancies as electron traps inhibited the recombination of photogenerated carriers. The electrical impedance spectroscopy (EIS) results are shown in Fig. 7(b). Component-based simulations show that the diameters of the Nyquist semicircle for the three heterojunctions WO3/MoO(3−x)y (y = 30%, 50% and 83%) in the high-frequency region were much smaller than that of WO3, suggesting the higher efficiency of interfacial photocharge-transfer of the heterojunctions formed between MoO3−x nanosheets and WO3. Meanwhile, WOM83% showed the smallest radius among the heterojunctions and monomers, which indicated that it had the lowest interfacial carrier transfer impedance, thus WOM83% has a high photocatalytic capacity.
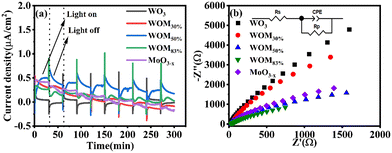 | ||
| Fig. 7 (a) Photocurrent response graph of WO3, MoO3−x and WOMy (y = 30%, 50%, 83%) and (b) EIS diagram of WO3, MoO3−x and WOMy (y = 30%, 50%, 83%). | ||
3.2 Photocatalytic performance
The photocatalytic ability of the as-prepared photocatalysts was evaluated by the degradation of RhB in an aqueous solution under sunlight irradiation at room temperature. In the RhB degradation experiment, 10 mg of the photocatalyst was added to 50 ml of 30 ppm RhB. In addition, a blank experiment was also performed. Before photocatalysis operations, all the photocatalysts were stirred for 30 minutes in RhB solution in the dark to establish adsorption–desorption equilibrium. After dark treatment, 3 ml of RhB mixture solution was taken and marked as C0. In photocatalytic degradation, 3 ml of mixture solution was taken every 5 minutes and marked as C5, C10, etc. The results are displayed in Fig. 8(a).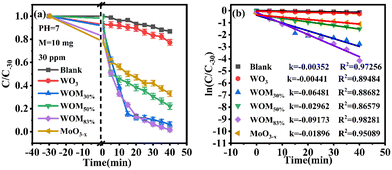 | ||
| Fig. 8 (a) Photocatalytic degradation curves of RhB over different photocatalysts; (b) pseudo-first-order kinetic curves of photocatalytic degradation performance of all the photocatalysts. | ||
As shown in Fig. 8(a), the concentration of RhB has no evident change in the blank experiment, indicating that the degradation of RhB was negligible under visible light without photocatalysts. WO3 exhibited negligible photocatalytic activity, while the degradation rate can reach 42% over MoO3−x within 40 min. After forming the WOM heterojunction, WOM83% displayed the highest photocatalytic performance, the degradation rate increased to 98% in 40 min and the degradation velocity was faster than the other photocatalysts.
In addition, a kinetic study was used to further illustrate the photocatalytic activity of RhB degradation, and it followed the pseudo-first-order dynamics model below:
| −ln(Ct/C0) = k·t | (1) |
3.3 Stability
The stability of the WOM83% heterojunction was assessed by recycling tests for the photocatalytic degradation of RhB. The XRD of WOM83% after the recycling tests is displayed in Fig. 9(a). The peak pattern of the XRD spectra before and after the recycling tests was almost unchanged. As shown in Fig. 9(b), after 6 cycles of experiments, the photodegradation efficiency of WOM83% reduced slightly, which further proved the stability of WOM83% in photodegradation.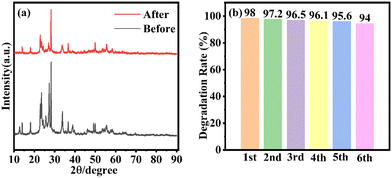 | ||
| Fig. 9 (a) XRD results of WOM83% before and after six cycles; (b) degradation performance of WOM83% in six consecutive photocatalytic degradation experiments for RhB. | ||
3.4 Photocatalytic hydrogen production and cyclic stability
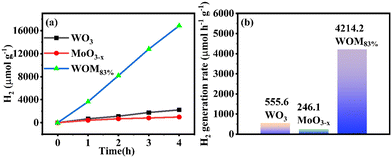
To further evaluate the photocatalytic performance of the catalysts, the photocatalytic hydrogen production was researched in deionized water under sunlight irradiation. The results are shown in Fig. 10(a); the amount of hydrogen produced by the monomer WO3, MoO3−x and WOM83% heterojunction in 4 hours was 2222.3 μmol g−1, 984.6 μmol g−1 and 16855.07 μmol g−1, respectively. WOM83% had the strongest hydrogen production in 4 hours, which was 7.6 and 17.1 times higher than those of pure WO3 and MoO3−x, respectively. Meanwhile, the hydrogen generation rate of the photocatalysts is exhibited in Fig. 10(b). The hydrogen generation rate of WO3, MoO3−x and WOM83% in 4 hours was 555.6 μmol h−1 g−1, 246.1 μmol h−1 g−1 and 4214.2 μmol h−1 g−1, respectively. WOM83% also had the highest hydrogen generation rate in all the photocatalysts, indicating that after building the WOM heterojunction, the presence of oxygen vacancies facilitates the separation of photogenerated carriers, thus, WOM83% had the strongest hydrogen production and highest hydrogen production rate within 4 hours, and constructing heterojunctions can enhance the photocatalytic splitting ability of water.A cyclic photocatalytic hydrogen evolution experiment was carried out to study the stability of the WOM83% heterojunction. After each cycle, the reaction mixture was bubbled with N2 and then used for subsequent runs. As shown in Fig. S5,† the successive H2 production demonstrated that the WOM83% heterojunction had high stability and efficiency.
3.5 Photocatalytic mechanism and test of molecular oxygen activation
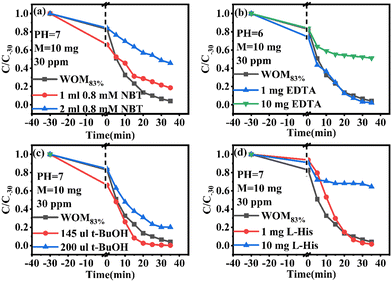
In order to understand the full photodegradation process and research the molecular oxygen activation capacity of the catalysts, a free radical trapping experiment was conducted. Usually, the scavengers EDTA, t-BuOH, NBT, and L-His were used to remove h+, ·OH, ·O2−, and 1O2, respectively. As shown in Fig. 11, the addition of EDTA, NBT, and L-His greatly inhibited the photocatalytic performance of the catalyst. Meanwhile, the effect of different doses of trapping agents on the photocatalytic performance was studied (Fig. 12). The results suggested that h+, ·O2− and 1O2 were the main active species in the RhB photodegradation system. To demonstrate the existence of ·O2− in the photocatalytic process, the ESR spin capture technique was performed. As shown in Fig. 11b–d, no ·O2− or ·OH signal peaks were produced under dark conditions and the signal peaks gradually increased with the extension of illumination time. DMPO–·O2− showed strong characteristic signal peaks under sunlight irradiation. It should be noted that ·OH characteristic signal peaks were also detected, which was mainly because the water molecule was oxidated by h+ to generate ·OH. In addition, 1O2 was not present in the 1O2 ESR profile, indicating that 1O2 was produced by photosensitization of RhB. Combining the free radical trapping tests and the ESR results, h+ and ·O2− were the main active species in this photodegradation system.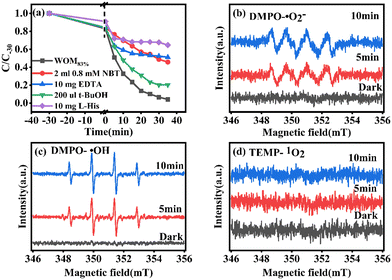 | ||
| Fig. 11 (a) Radical trapping test for WOM83%; ESR spectra of (b) DMPO–·O2−, (c) DMPO–·OH and (d) TEMP–1O2 over WOM83%. | ||
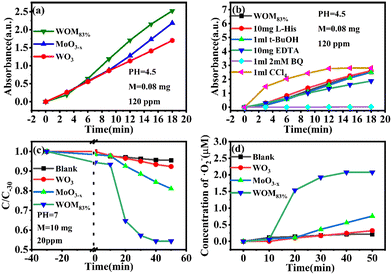
Moreover, the molecular oxygen activation ability of the catalysts was also studied. The TMB oxidation activity of the photocatalysts was determined under sunlight illumination (Fig. 13a). The results showed that WO3 and MoO3−x exhibited common oxidizing ability, but WOM83% had enhanced TMB photooxidation ability; meanwhile, WOM83% has the highest activity to photooxidize TMB, which indicated that constructing heterojunctions can enhance the photocatalytic ability. In order to explore the oxygen species in TMB photooxidation, different scavengers were added in the photooxidation process of TMB under sunlight. The scavengers BQ, L-His, EDTA, t-BuOH and CCl4 were used to capture ·O2−, 1O2, h+, ·OH and e−, respectively, and the result is displayed in Fig. 13(b). When different trapping agents were added, the photooxidation capacity of TMB over WOM83% was inhibited. Evidently, BQ and EDTA greatly inhibited the photooxidation of TMB, which indicated that ·O2− and h+ were the main active species in TMB oxidation.
In order to study the production of ·O2− during photocatalysis, NBT photodegradation over WOM83% was performed. As the reaction molar ratio of NBT to ·O2− is 1![[thin space (1/6-em)]](https://www.rsc.org/images/entities/char_2009.gif) :
:![[thin space (1/6-em)]](https://www.rsc.org/images/entities/char_2009.gif) 4, the ·O2− concentration could be quantitatively calculated by NBT photodegradation. The UV-vis maximum absorption peak of NBT at 259 nm gradually decreased with the increase of photodegradation time. As shown in Fig. 13(c) and (d), NBT was almost not degraded in the presence of WO3, which was similar to the result of the blank condition, indicating that WO3 cannot produce ·O2−. For WOM83 and MoO3−x, about 45.7% and 15.6% of NBT were degraded, and the corresponding generation amounts of ·O2− were 2.23 and 0.76 μmol, respectively. This result indicated that WOM83% had stronger activity to produce ·O2− than pure WO3 and MoO3−x, and constructing heterojunctions could enhance the production capacity of ·O2−.
4, the ·O2− concentration could be quantitatively calculated by NBT photodegradation. The UV-vis maximum absorption peak of NBT at 259 nm gradually decreased with the increase of photodegradation time. As shown in Fig. 13(c) and (d), NBT was almost not degraded in the presence of WO3, which was similar to the result of the blank condition, indicating that WO3 cannot produce ·O2−. For WOM83 and MoO3−x, about 45.7% and 15.6% of NBT were degraded, and the corresponding generation amounts of ·O2− were 2.23 and 0.76 μmol, respectively. This result indicated that WOM83% had stronger activity to produce ·O2− than pure WO3 and MoO3−x, and constructing heterojunctions could enhance the production capacity of ·O2−.
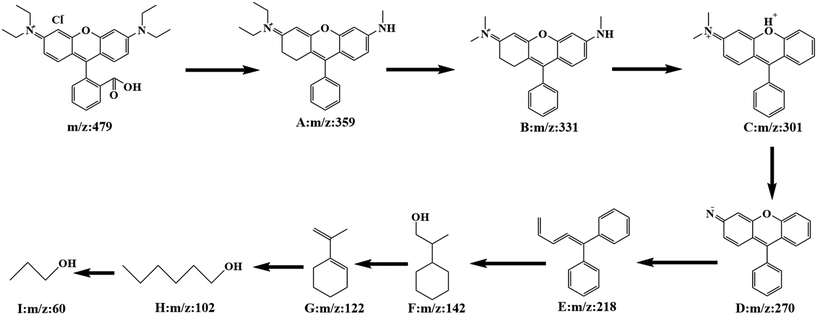
In order to investigate the specific process of RhB photodegradation, the HPLC-MS system was used to determine the degradation products at different time intervals. Several major intermediates were studied and the variation in relative peak intensities is shown in Fig. S6.† As the degradation time increased, the RhB peak at m/z = 479 disappeared and a number of fragment peaks (m/z = 359, 331, 301, 270, 218, 142, 122, 102 and 60) appeared. The results showed that the relative intensities of the fragment peaks (m/z = 359, 331, 301 and 102) decreased and the relative intensities of the fragment peaks (m/z = 270, 218 and 60) increased, indicating that the degradation of the RhB intermediate had occurred. After analysis, a potential degradation mechanism for RhB was proposed. As shown in Fig. 14, the RhB molecule was directly demethylated to give intermediate A (m/z = 359), and A was demethylated to yield intermediate B (m/z = 331). Removal of a nitrogen atom produced intermediate C (m/z = 301), which was further demethylated to give intermediate D (m/z = 270). Subsequently, due to the progressive rupture of the hexameric ring, intermediate E (m/z = 218) was produced, and intermediates F (m/z = 142) and G (m/z = 122) were obtained by hydrogenated carbon bond breakage and dehydroxylation. The final rupture of the hexameric ring gave small fragmented molecules m/z = 102 and 60. After 35 minutes, there was almost no molecular ion peak for RhB, indicating that RhB (m/z = 479) could be completely degraded within 35 min.
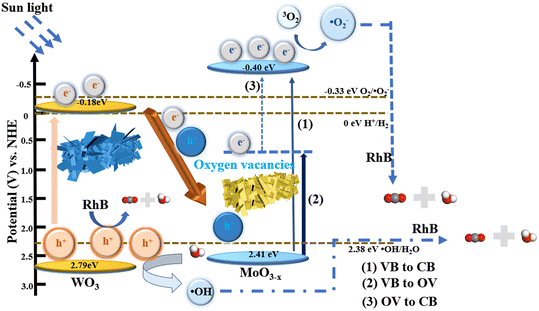
Based on the above experimental results, a possible mechanism for the degradation of RhB over WOM heterojunctions is proposed in Scheme 2. Based on the results of DRS, M–S curves and VB-XPS, the CB of WO3 and MoO3−x was −0.18 eV and −0.40 eV, respectively; meanwhile, the VB of WO3 and MoO3−x was 2.79 eV and 2.41 eV, respectively.
Based on the band structure of the heterojunction, we proposed a possible type-II heterojunction between MoO3−x and WO3. Under sunlight irradiation, both MoO3−x and WO3 produced photogenerated electron–hole pairs. Due to the presence of oxygen vacancies in MoO3−x, photogenerated electrons can be more easily excited to the CB by the defective energy level.53 Because of the electron trapping effect of the oxygen vacancies, the recombination of photogenerated carriers was restricted. Meanwhile, the presence of oxygen vacancies may lead to the formation of intermediate energy bands below the CB. Therefore, there were three possible ways for transfer of photogenerated electrons: (1) photogenerated electrons excited from the VB to the CB; (2) photogenerated electrons excited from the VB to the oxygen-deficient states; and (3) photogenerated electrons excited from the oxygen-deficient states to the CB. Thus, the presence of oxygen-deficient states further inhibited the photogenerated carrier recombination and reduced the direct excitation energy of photogenerated electrons. If the traditional type II electron–hole transfer mechanism occurred, electrons in the CB of MoO3−x were injected into the CB of WO3 and holes in the VB of WO3 were injected into the VB of MoO3−x. However, as the conduction bands of WO3 were higher than that of the superoxide radical (O2/˙O2− = −0.33 eV vs. NHE), the WOM83% heterojunction cannot produce ·O2−, which did not correspond to the results of the experiments. Therefore, the Z scheme was exploited to explain the photocatalytic mechanism. The photogenerated electrons in the CB of WO3 migrate to the VB of MoO3−x to combine with photogenerated holes. In addition, the CB value of MoO3−x (−0.4 eV) was more negative than the potential of ·O2− (O2/·O2− = −0.33 eV vs. NHE), which allowed the photogenerated electrons to interact with oxygen in RhB solution to generate ·O2−. Meanwhile, the VB of WO3 (2.79 eV) was more positive than the hydroxyl radical generation potential (·OH/H2O = 2.38 eV, vs. NHE), and the water in solution was oxidized to ·OH by h+, while h+ also participated in the oxidation of RhB. Moreover, due to the photosensitivity of RhB, 1O2 was also produced. Eventually, these reactive oxygen species (·O2−, and ·OH), along with h+ and 1O2, were involved in the degradation of RhB, which was consistent with the results of molecular oxygen activation experiments, free radical capture tests and ESR.
The process of RhB photodegradation by WOM83% may be described as follows:
| WO3/MoO3−x + hv → [WO3(e− + h+)/MoO3−x(e− + h+)] | (2) |
| MoO3−x(e−)VB → CB | (3) |
| MoO3−x(e−)VB → OV | (4) |
| MoO3−x(e−)OV → CB | (5) |
| WO3(e−) → MoO3−x(h+) | (6) |
| O2 + e− → ·O2− | (7) |
| H2O + h+ → ·OH | (8) |
| RhB + h+ → Degradation products(CO2 + H2O + others) | (9) |
| RhB + ·O2− + ·OH → Degradation products(CO2 + H2O + others) | (10) |
4. Conclusion
In this work, a Z type WO3/MoO3−x heterojunction was constructed by in situ growth of MoO3−x nanosheets on the surface of WO3 nanoparticles via a simple solvothermal method. The WO3/MoO3−x heterojunction with abundant oxygen vacancies can significantly improve the photocatalytic performance and molecular oxygen activation, and the H2 production and the RhB degradation rate were 17.1 and 4.83 times higher than those of the pure MoO3−x nanosheets, respectively. The outstanding photo-oxidative reduction ability of WO3/MoO3−x should be attributed to the formation of the heterojunction structure with strong charge transport ability. The photoelectrochemical measurements and PL spectroscopy further confirmed the substantial increase in the electron–hole pair separation efficiency for the WO3/MoO3−x heterojunction. In addition, the presence of oxygen vacancies enhanced the molecular oxygen activation capacity, further facilitating the photocatalytic reaction. This work provides new opportunities for the design of other novel oxygen vacancy catalysts without precious metals.Author contributions
Yuxuan Shao and Dan You: conceptualization; Yuqi Wan: investigation; Qingrong Cheng: funding acquisition; Zhiquan Pan: administration.Conflicts of interest
The authors declare that they have no known competing financial interests or personal relationships that could have appeared to influence the work reported in this paper.Acknowledgements
This work was supported by the Graduate Innovative Fund of Wuhan Institute of Technology [CX2022453].References
- Z. Li, G. Huang, K. Liu, X. Tang, Q. Peng, J. Huang, M. Ao and G. Zhang, J. Cleaner Prod., 2020, 272, 122892 CrossRef CAS.
- G. Palanisamy, K. Bhuvaneswari, T. Pazhanivel and G. Bharathi, Optik, 2020, 204, 164171 CrossRef CAS.
- A. Singh, A. K. Singh, J. Liu and A. Kumar, Catal. Sci. Technol., 2021, 11, 3946–3989 RSC.
- H. Zhang, H. Yang, Z. Pan and Q. Cheng, React. Chem. Eng., 2022, 7, 1626–1639 RSC.
- A. Ali, U. Garg, K. U. Khan and Y. Azim, J. Polym. Environ., 2022, 30, 4435–4451 CrossRef CAS.
- E. Matei, C. I. Covaliu-Mierla, A. A. Turcanu, M. Rapa, A. M. Predescu and C. Predescu, Membranes, 2022, 12, 1–35 CrossRef PubMed.
- J. Gan, X. Li, K. Rizwan, M. Adeel, M. Bilal, T. Rasheed and H. M. N. Iqbal, Chemosphere, 2022, 286, 131710 CrossRef CAS PubMed.
- H. Zhao, Z. Xing, S. Su, S. Song, T. Xu, Z. Li and W. Zhou, Appl. Mater. Today, 2020, 21, 100821 CrossRef.
- J. Ke, J. Liu, H. Sun, H. Zhang, X. Duan, P. Liang, X. Li, M. O. Tade, S. Liu and S. Wang, Appl. Catal., B, 2017, 200, 47–55 CrossRef CAS.
- X. Yang, A. Banerjee, Z. Xu, Z. Wang and R. Ahuja, J. Mater. Chem. A, 2019, 7, 27441–27449 RSC.
- Z. Kong, J. Zhang, H. Wang, B. Cui, J. Zeng, X. Chen, P. Tian, G. Huang, J. Xi and Z. Ji, Int. J. Energy Res., 2019, 44, 1205–1217 CrossRef.
- L. Su, L. Luo, H. Song, Z. Wu, W. Tu, Z.-j. Wang and J. Ye, Chem. Eng. J., 2020, 388, 124346 CrossRef CAS.
- V. Navakoteswara Rao, P. Ravi, M. Sathish, M. Vijayakumar, M. Sakar, M. Karthik, S. Balakumar, K. R. Reddy, N. P. Shetti, T. M. Aminabhavi and M. V. Shankar, J. Hazard. Mater., 2021, 415, 125588 CrossRef CAS PubMed.
- S. Mao, Y. Zou, G. Sun, L. Zeng, Z. Wang, D. Ma, Y. Guo, Y. Cheng, C. Wang and J. W. Shi, J. Colloid Interface Sci., 2021, 581, 1–10 CrossRef CAS PubMed.
- N. Chang, Y.-R. Chen, F. Xie, Y.-P. Liu and H.-T. Wang, Colloids Surf., A, 2021, 616, 126351 CrossRef CAS.
- L. Sun, Y. Yuan, F. Wang, Y. Zhao, W. Zhan and X. Han, Nano Energy, 2020, 74, 104909 CrossRef CAS.
- Q. Xi, J. Liu, Z. Wu, H. Bi, Z. Li, K. Zhu, J. Zhuang, J. Chen, S. Lu, Y. Huang and G. Qian, Appl. Surf. Sci., 2019, 480, 427–437 CrossRef CAS.
- Y. Yang, M. Liu, S. Han, H. Xi, C. Xu, R. Yuan, J. Long and Z. Li, Appl. Surf. Sci., 2021, 537, 147991 CrossRef CAS.
- H.-B. Zheng, D. Wu, Y.-L. Wang, X.-P. Liu, P.-Z. Gao, W. Liu, J. Wen and E. V. Rebrov, J. Alloys Compd., 2020, 838, 155219 CrossRef CAS.
- L. Wang, G. Huang, L. Zhang, R. Lian, J. Huang, H. She, C. Liu and Q. Wang, J. Energy Chem., 2022, 64, 85–92 CrossRef CAS.
- P. Gholami, A. Khataee and A. Bhatnagar, J. Cleaner Prod., 2020, 275, 124157 CrossRef CAS.
- Z. Zhu, C. Zhu, C. Hu and B. Liu, J. Colloid Interface Sci., 2022, 607, 595–606 CrossRef CAS.
- Z. Lu, D. Zeng, H. Zheng, Q. Liu, X. Gao, X. He, L. Wei and W.-J. Ong, J. Mater. Sci., 2020, 55, 13114–13126 CrossRef CAS.
- Z. You, X. Yue, D. Zhang, J. Fan and Q. Xiang, J. Colloid Interface Sci., 2022, 607, 662–675 CrossRef CAS.
- D. You, Z. Pan and Q. Cheng, J. Alloys Compd., 2023, 930, 167069 CrossRef CAS.
- Y. Zhu, Y. Zhuang, L. Wang, H. Tang, X. Meng and X. She, Chin. J. Catal., 2022, 43, 2558–2568 CrossRef CAS.
- Y. Ishida, S. Motono, W. Doshin, T. Tokunaga, H. Tsukamoto and T. Yonezawa, ACS Omega, 2017, 2, 5104–5110 CrossRef CAS.
- I. M. Szilágyi, B. Fórizs, O. Rosseler, Á. Szegedi, P. Németh, P. Király, G. Tárkányi, B. Vajna, K. Varga-Josepovits, K. László, A. L. Tóth, P. Baranyai and M. Leskelä, J. Catal., 2012, 294, 119–127 CrossRef.
- F. Pei, S. Feng, Y. Wu, X. Lv, H. Wang, S. M. Chen, Q. Hao, Y. Cao, W. Lei and Z. Tong, Biosens. Bioelectron., 2021, 189, 113373 CrossRef CAS.
- G. Zheng, J. Wang, H. Li, Y. Li and P. Hu, Appl. Catal., B, 2020, 265, 118561 CrossRef CAS.
- D. Pan, S. Xiao, X. Chen, R. Li, Y. Cao, D. Zhang, S. Pu, Z. Li, G. Li and H. Li, Environ. Sci. Technol., 2019, 53, 3697–3706 CrossRef CAS.
- Q. Liu, F. Wang, H. Lin, Y. Xie, N. Tong, J. Lin, X. Zhang, Z. Zhang and X. Wang, Catal. Sci. Technol., 2018, 8, 4399–4406 RSC.
- Q. Wang, W. Zhang, X. Hu, L. Xu, G. Chen and X. Li, J. Water Process. Eng., 2021, 40, 101943 CrossRef.
- S. Higashimoto, Y. Ushiroda and M. Azuma, Top. Catal., 2008, 47, 148–154 CrossRef CAS.
- J. Zhang, X. Fu, H. Hao and W. Gan, J. Alloys Compd., 2018, 757, 134–141 CrossRef CAS.
- A. A. Isari, M. Mehregan, S. Mehregan, F. Hayati, R. Rezaei Kalantary and B. Kakavandi, J. Hazard. Mater., 2020, 390, 122050 CrossRef CAS PubMed.
- Y. Zhang, X. Yu, H. Liu, X. Lian, B. Shang, Y. Zhan, T. Fan, Z. Chen and X. Yi, Environ. Sci.: Nano, 2021, 8, 2049–2058 RSC.
- P. Wang, M. Li, T. Song, P. Yang and G. Gao, Nanotechnology, 2020, 31, 425605 CrossRef CAS PubMed.
- Y. Ren, C. Li, Q. Xu, J. Yan, Y. Li, P. Yuan, H. Xia, C. Niu, X. Yang and Y. Jia, Appl. Catal., B, 2019, 245, 648–655 CrossRef CAS.
- D. Luo, L. Peng, Y. Wang, X. Lu, C. Yang, X. Xu, Y. Huang and Y. Ni, J. Mater. Chem. A, 2021, 9, 908–914 RSC.
- Z. Sun, Y. Gao, C. Ban, J. Meng, J. Wang, K. Wang and L. Gan, ACS Appl. Nano Mater., 2023, 6, 8635–8642 CrossRef CAS.
- J. Wu, Y. Tao, C. Zhang, Q. Zhu, D. Zhang and G. Li, J. Hazard. Mater., 2023, 443, 130363 CrossRef CAS PubMed.
- J. Li, X. Xu, B. Huang, Z. Lou and B. Li, ACS Appl. Mater. Interfaces, 2021, 13, 10047–10053 CrossRef CAS.
- J. Shang, X. Xu, K. Liu, Y. Bao, Y. Yang and M. He, Ceram. Int., 2019, 45, 16625–16630 CrossRef.
- F. Zheng, F. Dong, Z. Lv, H. Li, L. Zhou, Y. Chen, T. Huo and X. Luo, Colloid Interface Sci. Commun., 2021, 43, 100434 CrossRef CAS.
- Y. Guo, B. Chang, T. Wen, S. Zhang, M. Zeng, N. Hu, Y. Su, Z. Yang and B. Yang, J. Colloid Interface Sci., 2020, 567, 213–223 CrossRef CAS.
- H. Zhang, G. Wang, G. Dai and X. Xu, Res. Chem. Intermed., 2019, 45, 2369–2381 CrossRef CAS.
- Y. Liu, X. Dong, Q. Yuan, J. Liang, Y. Zhou, X. Qu and B. Dong, Colloids Surf., A, 2021, 621, 126582 CrossRef CAS.
- Y. Yang, C. Zhang, D. Huang, G. Zeng, J. Huang, C. Lai, C. Zhou, W. Wang, H. Guo, W. Xue, R. Deng, M. Cheng and W. Xiong, Appl. Catal., B, 2019, 245, 87–99 CrossRef CAS.
- J.-Y. Shen, L. Zhang, J. Ren, J.-C. Wang, H.-C. Yao and Z.-J. Li, Sens. Actuators, B, 2017, 239, 597–607 CrossRef CAS.
- Q. Liu, Y. Wu, J. Zhang, K. Chen, C. Huang, H. Chen and X. Qiu, Appl. Surf. Sci., 2019, 490, 395–402 CrossRef CAS.
- M. Zhang, C. Lai, B. Li, F. Xu, D. Huang, S. Liu, L. Qin, Y. Fu, X. Liu, H. Yi, Y. Zhang, J. He and L. Chen, Chem. Eng. J., 2020, 396, 125343 CrossRef CAS.
- L. Liang, Q. Chang, T. Cai, N. Li, C. Xue, J. Yang and S. Hu, Chem. Eng. J., 2022, 428, 131139 CrossRef CAS.
Footnote |
| † Electronic supplementary information (ESI) available. See DOI: https://doi.org/10.1039/d3re00396e |
| This journal is © The Royal Society of Chemistry 2024 |

