
 Open Access Article
 This Open Access Article is licensed under a Creative Commons Attribution-Non Commercial 3.0 Unported Licence
Synthesis of green fluorescent carbon dots and their application in mercury ion detection†
Juan Hou *a,
Qinqin Chenb,
Xiangzhi Menga,
Huiling Liub and
Wei Feng*b
*a,
Qinqin Chenb,
Xiangzhi Menga,
Huiling Liub and
Wei Feng*b
aSchool of Chemistry and Environmental Engineering, Jilin Provincial Science and Technology Innovation Center of Optical Materials and Chemistry, Jilin Provincial International Joint Research Center of Photo-functional Materials and Chemistry, Changchun University of Science and Technology, Changchun 130022, China. E-mail: houjuan0503@126.com
bDepartment of Chemistry, Chemical Engineering and Resource Utilization, Northeast Forestry University, Harbin 150040, China. E-mail: wfeng@nefu.edu.cn
First published on 12th November 2024
Abstract
Green fluorescent carbon dots (GCDs) were synthesized using o-phenylenediamine and ethylenediamine through a one-step hydrothermal method, thereby eliminating the need for further processing. The GCDs exhibited strong green fluorescence that was effectively quenched by Hg2+ and Fe3+, with minimal interference from other metal ions, anions, and small biological molecules. By optimizing the buffer solution, interference from Fe3+ was mitigated, which enhanced the robustness of the GCDs as a fluorescence probe for Hg2+ detection. The detection range for Hg2+ was 0–100 μM, with a detection limit of 300 nM. The quenching mechanism was thoroughly investigated, and the GCDs were successfully applied to detect Hg2+ in real water samples, yielding satisfactory results. This work highlights the potential of GCDs for practical environmental monitoring and water quality analysis.
1 Introduction
Heavy metal contamination, particularly mercury (Hg2+), poses a significant threat to environmental and public health due to its high toxicity and persistence in ecosystems. Mercury can enter aquatic systems through industrial discharge, mining activities, and agricultural runoff, leading to bioaccumulation and presenting serious risks to both ecological systems and human health. Hg2+ has been reported to cause numerous health issues, including neurological damage, liver failure, and brain disorders.1–3 Therefore, the detection and quantification of Hg2+ in environmental samples is crucial for monitoring pollution levels and ensuring compliance with environmental regulations.Various conventional methods have been developed for detecting Hg2+ in aqueous media, including atomic absorption spectroscopy (AAS),4 inductively coupled plasma mass spectrometry (ICP-MS)5 and electrochemical techniques.6 Although these methods demonstrate high sensitivity and accuracy, they often require sophisticated instrumentation, time-consuming sample preparation, and high operational costs. This has created a demand for the development of more accessible, cost-effective, and rapid analytical techniques. In recent years, fluorescence sensors have gained significant attention due to their low cost, high sensitivity, straightforward operation, rapid analysis, and non-destructive nature.7–9 Currently, a variety of fluorescence probes are being actively developed, such as organic dye molecules,10 metal nanoparticles,11 and semiconductor quantum dots.12 However, these fluorescent materials often suffer from challenges such as toxicity, low sensitivity, low selectivity, hydrophobicity, and high cost.
Carbon dots (CDs) have emerged as a promising alternative for fluorescence-based sensing owing to their unique optical properties, including high fluorescence quantum yields, excellent photostability, and tunable emission spectra.13–16 These properties render CDs suitable for the development of sensitive and selective fluorescent probes. The ability of CDs to interact with specific ions or molecules, resulting in fluorescence quenching or enhancement, forms the basis of many fluorescence detection methods. To date, numerous CDs have been successfully employed for the detection of Hg2+ in aqueous solutions. For instance, Hao et al. synthesized blue fluorescent CDs exhibiting a quantum yield of 15% using citric acid and urea, achieving a linear detection range of 0.5–40 μM and a detection limit of 0.138 μM.17 Liu et al. synthesized yellow fluorescent CDs by carbonizing hydrogen peroxide with o-phenylenediamine and p-aminobenzoic acid, achieving a detection range of 20–150 μM and a low detection limit of 0.12 μM, applicable to actual water samples.18 However, most reported method for the detection of Hg2+, while providing low detection limits, exhibit narrow detection ranges and often rely on blue light emission. Even when long-wavelength emissive CDs are synthesized, post-synthesis processing remains complex, often requiring chromatographic purification,19 which significantly limits their practical application.
Herein, we report a straightforward synthesis approach for green fluorescent nitrogen-doped carbon dots (GCDs) utilizing o-phenylenediamine and ethylenediamine as precursors. Subsequently, through a systematic investigation of the effects of pH and buffer types on quenching efficiency, the optimal conditions of Hg2+ detection were identified to minimize interference from other ions. The primary mechanism responsible for Hg2+ detection was elucidated through various analytical techniques. The satisfactory results demonstrated the practical applicability of the proposed method in real water samples. This research highlights the potential of GCDs as an effective and practical tool for detecting Hg2+. By providing a cost-effective, rapid, and sensitive alternative to traditional methods, the developed GCD-based probe could significantly enhance environmental monitoring efforts and safeguard public health. This study not only advances the field of fluorescence-based sensing, but also contributes to the development of accessible analytical techniques for detecting hazardous pollutants across diverse environmental matrices.
2 Experimental section
2.1 Material and reagent
All reagents used in this experiment were of analytical grade. o-Phenylenediamine was purchased from Tianjin Guangfu Fine Chemical Research Institute. Small molecules were obtained from Aladdin Reagents (Shanghai) Co., Ltd. PBS buffer solutions (0.01 M) were acquired from Beijing Solarbio Science & Technology Co., Ltd. Other reagents and chemicals were purchased from Tianjin Tianda Chemical Reagent Factory. The water used throughout the experiment was doubly distilled water (>18 MΩ cm).2.2 Instrumentation and spectrometry
The morphology, particle size, and lattice spacing of the GCDs were characterized using a JEM-2100 high-resolution transmission electron microscope (HRTEM) operated at an accelerating voltage of 200 kV. Raman spectroscopy was conducted using a DXR2 confocal Raman spectrometer. To examine the surface functional groups of the GCDs, Fourier-transform infrared (FT-IR) spectroscopy was performed using a Nicolet AVATAR 360 spectrometer, with KBr powder serving as the sample matrix. The elemental composition and relative ratios of the GCDs, along with further insights into their surface functional groups of the GCDs, were analyzed using X-ray photoelectron spectroscopy (XPS). Fluorescence spectra of the GCDs were recorded at room temperature using a Shimadzu RF-5301 fluorescence spectrophotometer (FL). Ultraviolet-visible (UV-vis) absorption spectra were obtained using a Shimadzu UV-2550 UV-vis spectrophotometer.2.3 Preparation of GCDs
GCDs were synthesized by a simple hydrothermal preparation method. Initially, 0.8 g of o-phenylenediamine, 800 μL of anhydrous ethylenediamine and 30 mL of deionized water were added to a beaker. The mixture was subjected to ultrasonication until complete dissolution. The resulting solution was subsequently transferred to a 50 mL Teflon-lined reaction vessel and heated at 200 °C for 5 h. After the reaction was complete, the mixture was allowed to cool to room temperature. The resulting deep brown GCDs solution was filtered through a 0.22 μm microporous filter.2.4 Detection of Hg2+
As a typical procedure, 20 μL of GCDs solution was diluted with deionized water (pH 7) to prepare a GCDs stock solution for use. Then, 50 μL of the GCDs stock solution was mixed with 100 μL of PBS buffer solution (pH 7.2–7.4, 0.01 M). Various concentrations of Hg2+ solutions were added, and the mixture was diluted to 4 mL with deionized water. After incubation for 5 min at room temperature, the fluorescence emission spectra were measured with an excitation wavelength set to 390 nm. The emission wavelength range was recorded from 410 nm to 700 nm, with both the excitation and emission slit widths set at 5 nm.2.5 Real sample detection
Real water samples were collected from laboratory tap water, dormitory tap water, surface water, Majiagou river and Nanhu lake. The water samples were filtered through a 0.22 μm microporous filter to remove particulate matter. Subsequently, 50 μL of GCDs, 100 μL of PBS buffer solution, and varying concentrations of Hg2+ were added to a 5 mL centrifuge tube, and the volume was adjusted to 4 mL with the actual water sample. The fluorescence emission spectra were measured with an excitation wavelength of 390 nm, an emission wavelength range of 410–700 nm, and both the excitation and emission slit widths set at 5 nm. The spiked recovery rate and relative standard deviation were calculated.3 Results and discussion
3.1 Structure characterization of GCDs
The morphology of the synthesized GCDs was characterized by TEM. As shown in Fig. 1a, the GCDs are uniformly dispersed spherical nanoparticles of similar sizes. The size distribution of 150 GCDs was analyzed, resulting in a size distribution plot and a Gaussian fitting curve, as depicted in Fig. 1b. The size distribution ranges from 1.8 to 3.9 nm, with an average diameter of 2.8 nm. High-resolution TEM (HR-TEM) images in the inset of Fig. 1b reveal clear lattice fringes with a lattice spacing of 0.22 nm, consistent with the (100) plane of graphite. The X-ray diffraction (XRD) pattern in Fig. 1c displays a broad diffraction peak at 2θ = 21.3°, which is associated with the graphitic structure. FT-IR spectroscopy results in Fig. 1d indicates a broad peak at 3437 cm−1, attributed to O–H and N–H stretching vibrations. An absorption peak at 1630 cm−1 is assigned to C![[double bond, length as m-dash]](https://www.rsc.org/images/entities/char_e001.gif) N and CO stretching vibrations. Peaks at 1503 cm−1 and 1384 cm−1 correspond to CC and CN stretching vibrations, respectively. The absorption peak at 1119 cm−1 represents C–N/C–O groups, while the peak at 1044 cm−1 is related to C–O group stretching vibrations.
N and CO stretching vibrations. Peaks at 1503 cm−1 and 1384 cm−1 correspond to CC and CN stretching vibrations, respectively. The absorption peak at 1119 cm−1 represents C–N/C–O groups, while the peak at 1044 cm−1 is related to C–O group stretching vibrations.
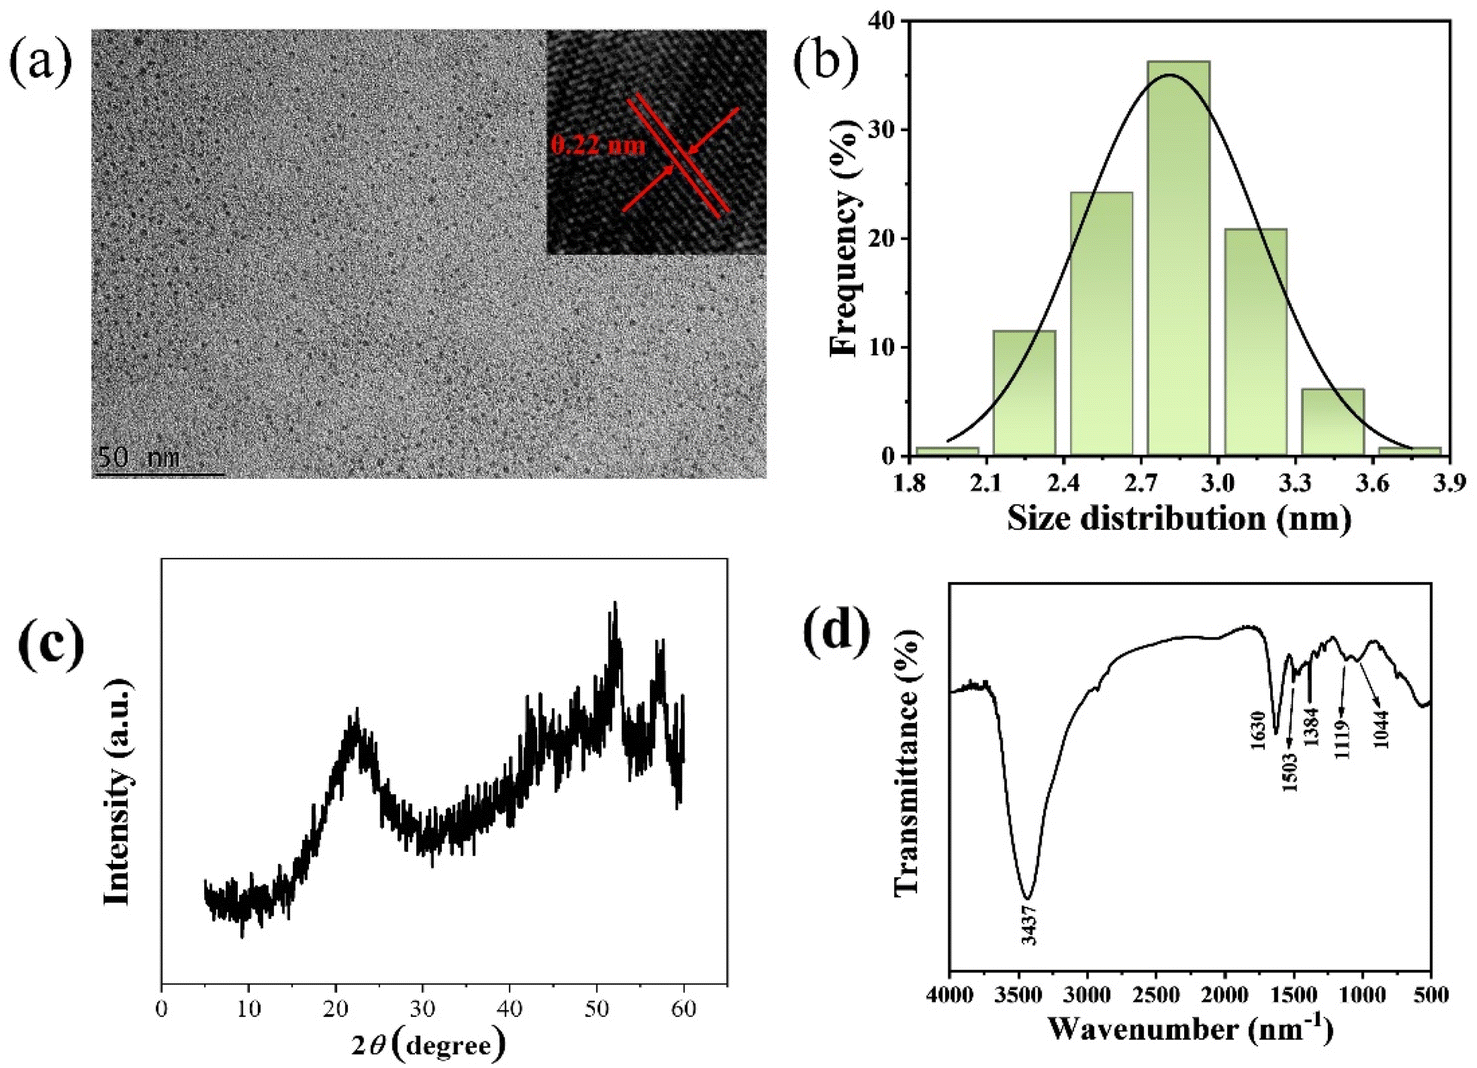 | ||
| Fig. 1 (a) TEM and HR-TEM (inset), (b) particle size distribution histograms, (c) XRD pattern and (d) FTIR spectrum of GCDs. | ||
XPS was employed to analyze the surface elemental composition and chemical states of the GCDs. Fig. 2a displays characteristic peaks for C1s (285.4 eV), N1s (401.8 eV), and O1s (532.1 eV), with atomic percentages of 34.3%, 18.0%, and 47.7%, respectively. The high-resolution C1s spectrum (Fig. 2b) shows four distinct peaks at 284.5 eV, 285.1 eV, 286.2 eV, and 287.7 eV, corresponding to CC, C–C, C–N/C–O, and CN bonds, respectively. The high-resolution N1s spectrum (Fig. 2c) exhibits two peaks at 400.7 eV and 401.6 eV, attributed to N–H and C–N bonds. The O1s spectrum (Fig. 2d) splits into two peaks at 531.7 eV and 532.3 eV, suggesting the presence of CO and C–O–C/C–OH groups on the surface of GCDs. Collectively, these results indicate that the GCDs possess a surface rich in nitrogen and oxygen-containing functional groups, endowing excellent water solubility to the GCDs.
 | ||
| Fig. 2 Total XPS (a), C1s (b), N1s (c), O1s XPS spectrum (d) of GCDs. | ||
3.2 Optical properties of GCDs
The optical properties of the GCDs were investigated using UV-vis absorption and fluorescence spectroscopy. As shown in Fig. 3a, two absorption peaks at 233 nm and 289 nm are attributed to the π–π* transition of CC bonds and the n–π* transition of CO bonds, respectively.20 The GCDs exhibit optimal excitation and emission wavelengths of 390 nm and 518 nm, respectively. Consequently, under UV light at 365 nm, the GCDs emit bright green fluorescence, while the GCDs solution appears deep brown under daylight (inset of Fig. 3a). Additionally, as the excitation wavelength increases from 330 nm to 460 nm, the emission wavelength shifts from 518 nm to 580 nm (Fig. 3b). The various functional groups and irregularities on the surface can introduce localized energy levels within the bandgap. These surface states may trap excitons and alter the recombination dynamics, leading to a shift in the emission wavelength as the excitation energy increases. Similarly, smaller CDs often exhibit quantum confinement effects, leading to blue-shifted emission, while larger CDs can show red shifts due to decreased bandgap. Thus the excitation wavelength-dependent behavior may be attributed to the interplay between surface defects and size variations.21–23 The absolute fluorescence quantum yield of the GCDs was calculated to be 23.1%
 | ||
| Fig. 3 (a) UV-vis absorption and FL spectra of the GCDs, inset: photos of the GCDs under daylight (left) and UV lamp (right), (b) fluorescence spectra of GCDs at different excitation wavelengths. | ||
Fluorescence stability is crucial for the performance of fluorescence sensors. To investigate the fluorescence stability of the GCDs, we assessed key factors including the effects of salt solutions (NaCl), pH, exposure to 365 nm UV light, and storage time on their fluorescence intensity. Fig. S1a† illustrates the fluorescence intensity of the GCDs in NaCl solutions ranging from 0 to 2 M. It was observed that the fluorescence intensity of the GCDs decreases slightly with increasing NaCl concentration. Even at a high concentration of 2 M NaCl, the fluorescence intensity remains approximately 90% of its initial value. Fig. S1b† shows the fluorescence intensity of the GCDs at different pH levels. As the pH value increases from 1 to 13, the fluorescence intensity first increases and then decreases, reaching a maximum at pH 7. This trend may be attributed to the protonation and deprotonation of carboxyl and amino groups on the surface under acidic and alkaline conditions, respectively.24 Fig. S1c† depicts the change in fluorescence intensity of the GCDs upon continuous exposure to 365 nm UV light for 90 min. The fluorescence intensity remains relatively stable, indicating that GCDs possess good photobleaching resistance. Additionally, the fluorescence intensity still retains approximately 93% of its initial value after storage for 35 days, demonstrating the excellent storage stability of the GCDs (Fig. S1d†).
3.3 Detection of Hg2+
The fluorescence response of the GCDs to a range of metal ions, anions, and small molecules was investigated in a Tris–HCl buffer solution at pH 7 (Fig. S2†). Both Fe3+ and Hg2+ were found to significantly quench the fluorescence of the GCDs, and Hg2+ caused a greater quenching effect (Fig. S2a†). Other anions and small molecules had a minimal impact on the fluorescence of the GCDs (Fig. S2b and c†). To determine the optimal pH for Hg2+ detection and minimize interference from Fe3+, we tested various pH levels (pH 4–13) and buffer types (Tris–HCl, HEPES, and PBS) for their effects on fluorescence quenching. As shown in Fig. S3a,† the fluorescence intensity of the GCDs was highest at pH 7, and the quenching effect of Hg2+ was also maximal at pH 7. Fig. S3b† indicates that PBS buffer effectively reduces interference from Fe3+, therefore, PBS at pH 7 was selected for subsequent tests.As depicted in Fig. 4, only Hg2+ demonstrated a significant quenching effect on the GCDs in PBS buffer (pH = 7). Thus, the GCDs can be utilized as a fluorescent probe for detecting Hg2+. Fig. S4† illustrates the change in fluorescence intensity ratio (F/F0) of the GCDs before and after the addition of Hg2+ over time. The fluorescence intensity of GCDs gradually quenches upon Hg2+ addition and reaches a stable level after approximately 4 min, thus a reaction time of 5 min was chosen for Hg2+ detection.
 | ||
| Fig. 4 Selectivity experiments of the GCDs on metal ions (a), anions (b) and small molecules (c). | ||
Under the optimized experimental conditions, we further evaluated the capability of the GCDs to detect Hg2+. Fig. 5a shows the fluorescence spectra of the GCDs in the presence of 0–110 μM Hg2+. The fluorescence intensity of the GCDs decreases with increasing Hg2+ concentration. As illustrated in Fig. 5b, there is a good linear relationship between F/F0 and Hg2+ concentration in the range of 0–100 μM (R2 = 0.9973), represented by the following linear equation:
| F/F0 = 1.00624 − 0.00792cHg2+ |
 | ||
| Fig. 5 (a) The fluorescence spectra of the GCDs with different concentrations of Hg2+ (0–110 μM), (b) the linear relationship between F/F0 and the concentration of Hg2+. | ||
3.4 Detection mechanism
To elucidate the quenching mechanism of GCDs in the presence of Hg2+, we investigated the fluorescence decay curves, UV absorption spectra, zeta potentials, and Fourier-transform infrared (FTIR) spectra of the GCDs and GCDs-Hg2+ system. Plotting F0/F against the concentration of Hg2+ (Fig. S5a†) reveals a distinct upward curvature, indicating that the quenching of GCDs results from a combination of dynamic and static quenching mechanism.25 Specifically, the presence of Hg2+ affects the surface functional groups of GCDs, leading to fluorescence quenching.Fig. S5b† presents the fluorescence decay curves of GCDs with and without Hg2+. Upon the addition of 80 μM Hg2+, the fluorescence lifetime of the GCDs increased from 2.16 ns to 2.35 ns, which is contrary to the expected outcome for Förster resonance energy transfer (FRET), typically characterized by a significant reduction in fluorescence lifetime. Thus, FRET is not the primary mechanism involved in the quenching process.
The FTIR spectra (Fig. S5c†) indicate notable changes in the absorption peaks of nitrogen and oxygen-containing functional groups after the addition of Hg2+, particularly at 1384 cm−1 (CN), 1119 cm−1 (C–N/C–O), and 1044 cm−1 (C–O). These changes suggest that Hg2+ interact with these functional groups, potentially forming new coordination complexes. This interaction can lead to the alterations in the electronic environment surrounding the GCDs, which may facilitate fluorescence quenching.
Additionally, the UV-vis absorption spectra (Fig. S5d†) indicate significant changes in the spectra of GCDs upon the addition of varying concentrations of Hg2+, suggesting the formation of new complexes. Notably, the absorption spectra of Hg2+ show minimal overlap with the optimal excitation and emission spectra of the GCDs, effectively ruling out the inner filter effect (IFE) as a contributing factor to the observed quenching performance.
Zeta potential measurements (Fig. S5e†) reveal that the GCDs are negatively charged. After the addition of 20, 50, and 80 μM Hg2+, the zeta potential gradually becomes more positive, supporting the notion of complex formation between Hg2+ and GCDs. This positive shift in zeta potential indicates strong electrostatic interactions, which are particularly relevant given that Hg2+ has a high binding affinity for certain functional groups on the GCDs.
The selective quenching of fluorescence by Hg2+ compared to other metal ions can be attributed to these strong interactions and the unique energy transfer dynamics involved. While other cations may not interact as effectively with the surface groups of the GCDs, the binding affinity and specific coordination chemistry of Hg2+ enable a more pronounced quenching effect. Thus, we conclude that static quenching is the predominant mechanism for fluorescence quenching in this system, driven by the formation of stable complexes between GCDs and Hg2+.
3.5 Real water samples detection
To further demonstrate the practical application potential of the proposed fluorescence probe, we conducted Hg2+ detection in real water samples, including laboratory tap water, dormitory tap water, surface water, and samples from the Majiagou river and Nanhu lake, designated as samples 1, 2, 3, 4 and 5, respectively. No Hg2+ was detected in these samples by ICP-MS. As shown in Table 1, the proposed method also confirmed the absence of Hg2+ in all real water samples. Through spiked recovery tests, the recovery rates for Hg2+ ranged from 95.40% to 109.9%, with relative standard deviations between 1.27% and 3.65%. These results demonstrate that GCDs exhibit good sensitivity and accuracy in detecting Hg2+ in real water samples, confirming their potential for practical water quality monitoring.| Sample | Detected by this work (μM) | Detected by ICP-MS (μM) | Added (μM) | Found (μM) | Recovery (%) | RSD (%, n = 3) |
|---|---|---|---|---|---|---|
| 1 | — | — | 5 | 4.89 | 97.80 | 3.65 |
| 20 | 21.20 | 106.0 | 2.57 | |||
| 80 | 80.45 | 100.6 | 1.27 | |||
| 2 | — | — | 5 | 5.21 | 104.2 | 3.11 |
| 20 | 20.05 | 100.2 | 3.56 | |||
| 80 | 78.90 | 98.62 | 2.09 | |||
| 3 | — | — | 5 | 4.88 | 97.60 | 2.21 |
| 20 | 20.78 | 103.9 | 1.67 | |||
| 80 | 80.56 | 100.7 | 1.34 | |||
| 4 | — | — | 5 | 4.92 | 98.40 | 2.21 |
| 20 | 20.78 | 103.9 | 2.58 | |||
| 80 | 78.23 | 97.79 | 3.12 | |||
| 5 | — | — | 5 | 4.77 | 95.40 | 3.44 |
| 20 | 21.98 | 109.9 | 3.42 | |||
| 80 | 81.24 | 101.6 | 1.45 |
Compared to other recently developed CDs-based fluorescence probes for detecting Hg2+, the proposed method demonstrates a comparable detection limit, a wider linear range, and a simpler preparation and operational procedure (Table 2). The low LOD ensures sensitivity even in contaminated water sources, while the broad linear range allows for effective quantification across varying Hg2+ concentrations. Moreover, the raw materials of GCDs are cheap and easy to obtain. The synthesis method is facile to operate and can be completed within 5 h. The green fluorescence emission and high quantum yield of GCDs enhances visibility under UV light, making it easier for observing the results. Overall, this method provides a robust and efficient approach to Hg2+ detection, contributing significantly to environmental safety and public health.
| Materials | Raw materials | Preparation time (h) | Em (nm) | QY (%) | Detection range | LOD | Recovery (%) | RSD (%) | Ref. |
|---|---|---|---|---|---|---|---|---|---|
| CDs | Citric acid, glycine | 28 | ∼435 | — | 0.12–2.0 ppm | 38 ppb | 97–105 | 2.16–3.27 | 26 |
| NCQDs | Lemon juice, ethylenediamine dichloromethane | 4 | 452 | 31 | 0.001–1 μM | 5.3 nM | 95–100.8 | 2.5–4.3 | 27 |
| CDs | Citric acid, urea | 8 | 525 | 5 | 0.5–4 μM | 0.22 μM | 97.2–102.2 | 1.58–2.96 | 28 |
| N-CDs@Na FZ | Silica acid, Na2CO3, iron nitrate, TPABr | 41 | 435 | 91.2 | 0.1–1500 nM | 5.5 ppm | — | 1.23–2.29 | 29 |
| CDs | Ethylenediamine, methyl red | 5 | 517 | — | 0–50 μM | 0.89 μM | 94.9–203.1 | 0.27–3.59 | 30 |
| Y-CDs@ZIF-8 | o-Phenylenediamine, p-aminobenzoic, formamide, hydrogen peroxide, Zn(NO3)2·6H2O, 2-methylimidazole, methanol | 74 | 550 | 26.6 | 20–150 μM | 0.12 μM | 90.11–115.52 | 1.19–6.23 | 31 |
| CDs | Ammonium citrate, ammonium bicarbonate | 10 | 440 | 27 | 0–8 μM | 0.1 μM | — | — | 32 |
| CDs@MR-1 | S. oneidensis MR-1 cell, LB | 36 | 410 | 7 | 0–9.38 μg mL−1 | 0.43 μg mL−1 | 94.79–106.28 | 0.75–1.89 | 33 |
| GCDs | o-Phenylenediamine, ethylenediamine | 5 | 518 | 23.1 | 0–100 μM | 0.3 μM | 95.4–109.9 | 1.27–3.65 | This work |
4 Conclusions
In conclusion, we have developed a highly sensitive and accurate fluorescence probe based on GCDs for the detection of Hg2+. Our experimental results demonstrate that GCDs exhibit significant fluorescence quenching in the presence of Hg2+, with the quenching mechanism primarily attributed to static quenching. Optimal detection conditions were established using PBS buffer at pH 7, effectively minimizing the interference from other metal ions, particularly Fe3+. The probe exhibits a strong linear relationship between fluorescence intensity and Hg2+ concentration, with a detection limit of 300 nM. Furthermore, the feasibility of the probe was validated through real sample applications with recovery rates ranging from 95.40% to 109.9%. These findings confirm the practical utility of GCDs as a reliable and efficient tool for monitoring Hg2+ in environmental water samples. The advantages of the method, including its simplicity, sensitivity and broad applicability, underscore its potential for water quality assessment and environmental monitoring.Data availability
All relevant data are within the manuscript and its additional files.Author contributions
Juan Hou: methodology, data analysis, writing, investigation; Qinqin Chen: experiment conduction, investigation, data curation; Xiangzhi Meng: experiment conduction, data analysis, review; Huiling Liu: experiment conduction, investigation; Wei Feng: resources, supervision, review and editing.Conflicts of interest
There are no conflicts to declare.Acknowledgements
We gratefully acknowledge the support from the Joint Fund Project of the Natural Science Foundation of Jilin Province (YDZJ202401554ZYTS).Notes and references
- Y. K. Shan, B. Wang, H. C. Huang, D. Jiang, X. P. Wu, L. Xue and S. Y. Wang, Biosens. Bioelectron., 2019, 132, 238–247 CrossRef CAS PubMed.
- M. A. Issa, H. Zentou, Z. H. Jabbar, Z. Z. Abidin, H. Harun, N. A. A. Halim, M. M. Alkhabet and M. Y. Pudza, Environ. Sci. Pollut. Res., 2022, 29, 86859–86872 CrossRef CAS PubMed.
- X. Cheng, T. Luo, F. Y. Chu, B. Feng, S. B. Zhong, F. Chen, J. Dong and W. B. Zeng, Sci. Total Environ., 2023, 905, 167070 CrossRef CAS.
- G. Jarzynska and J. Falandysz, J. Environ. Sci. Health, Part A: Toxic/Hazard. Subst. Environ. Eng., 2011, 46(6), 569–573 CrossRef CAS PubMed.
- M. He, L. J. Huang, B. S. Zhao, B. B. Chen and B. Hu, Anal. Chim. Acta, 2017, 973, 1–24 CrossRef CAS PubMed.
- N. Kallithrakas-Kontos and S. Foteinis, Curr. Anal. Chem., 2016, 12(1), 22–36 CrossRef CAS.
- S. Q. Zhang, J. Wen, H. Y. Li and M. L. Chen, Spectrochim. Acta, Part A, 2024, 317, 124393 CrossRef CAS PubMed.
- J. Y. Shi, S. Y. Wu, Y. Xue, Q. Xie, Q. Danzeng, C. Liu and C. H. Zhou, Microchim. Acta, 2024, 191, 571 CrossRef CAS.
- Y. Wei, X. J. Li, J. Y. Hao, L. Li, C. W. Lv and Y. An, J. Mol. Liq., 2024, 394, 123664 CrossRef CAS.
- W. Z. Yin, H. J. Zhu and R. Y. Wang, Dyes Pigm., 2014, 107, 127–132 CrossRef CAS.
- M. X. Liu, F. L. Tang, Z. L. Yang, J. Xu and X. P. Yang, J. Anal. Methods Chem., 2019, 1095148 Search PubMed.
- N. Zhang, Y. J. Shen, G. Z. Pang, S. Y. Chu, W. Han, Q. Mei, X. L. Hu, F. Q. Dong, Y. X. Shen and T. T. Zhao, Microchem. J., 2020, 158, 105188 CrossRef CAS.
- M. G. Giordano, G. Seganti, M. Bartoli and A. Tagliaferro, Molecules, 2023, 28, 2772 CrossRef CAS PubMed.
- S. Li, L. Li, H. Y. Tu, H. Zhang, D. S. Silvester, C. E. Banks, G. Q. Zou, H. S. Hou and X. B. Ji, Mater. Today, 2021, 51, 188–207 CrossRef CAS.
- L. Cai, Z. Fu and F. L. Cui, J. Fluoresc., 2020, 30, 11–20 CrossRef CAS.
- F. S. Shan, L. J. Fu, X. Y. Chen, X. Y. Xie, C. S. Liao, Y. X. Zhu, H. Y. Xia, J. Zhang, L. Yan, Z. Y. Wang and X. Q. Yu, Chin. Chem. Lett., 2022, 33, 2942–2948 CrossRef CAS.
- Y. P. Hao, R. H. Li, Y. X. Liu, X. H. Zhang, L. N. Geng and S. N. Chen, J. Fluoresc., 2023, 33, 459–469 CrossRef CAS.
- H. D. Liu, H. W. Li, K. Z. Du and H. X. Xu, Mater. Today Commun., 2022, 33, 104880 CrossRef CAS.
- L. Yuan, L. Jiang, Z. Liu, Y. Y. Xiang, F. Song and Y. J. Tu, Dyes Pigm., 2023, 209, 110893 CrossRef CAS.
- Z. L. Wu, Z. X. Liu and Y. H. Yuan, J. Mater. Chem. B, 2017, 5, 3794–3809 RSC.
- Y. Xu, H. Y. Li, B. Wang, H. C. Liu, L. Zhao, T. Y. Zhou, M. T. Liu, N. Huang, Y. Li, L. Ding and Y. H. Chen, Microchim. Acta, 2018, 185, 252 CrossRef PubMed.
- F. Yan, Z. Sun, H. Zhang, X. Sun, Y. Jiang and Z. Bai, Microchim. Acta, 2019, 186, 583 CrossRef PubMed.
- M. G. Giordano, G. Seganti, M. Bartoli and A. Tagliaferro, Molecules, 2023, 28, 2772 CrossRef CAS PubMed.
- S. Y. Tang, D. Chen, G. Q. Guo, X. M. Li, C. X. Wang, T. T. Li and G. Wang, Sci. Total Environ., 2022, 825, 153913 CrossRef CAS PubMed.
- H. L. Tan, Y. Q. Zhang and Y. Chen, Sens. Actuators, B, 2011, 156(1), 120–125 CrossRef CAS.
- E. Yahyazadeh and F. Shemirani, Heliyon, 2019, 5, e01596 CrossRef.
- A. Tadesse, M. Hagos, D. RamaDevi, K. Basavaiah and N. Belachew, ACS Omega, 2020, 5, 3889–3898 CrossRef CAS PubMed.
- S. H. Nannuri, S. Singh, S. Chidangil and S. D. George, Mater. Technol., 2022, 37, 2893–2906 CrossRef CAS.
- H. O. Othman, R. Hassan, A. Faizullah and M. Ghadiri, Talanta, 2021, 234, 122646 CrossRef CAS PubMed.
- X.-L. Hao, X.-H. Pan, Y. Gao, Y. Wang, J. Guo and Y.-X. Teng, J. Nanosci. Nanotechnol., 2020, 20, 2045–2054 CrossRef CAS PubMed.
- H. Liu, H. Li, K. Du and H. Xu, Mater. Today Commun., 2022, 33, 104880 CrossRef CAS.
- D. Dai, C. Zhang, N. T. D. Thuy, G. Zhao, W. Lu and J. Fan, Diamond Relat. Mater., 2022, 126, 109076 CrossRef CAS.
- C. Shen, C. Dong, L. Cheng, X. Shi and H. Bi, J. Environ. Chem. Eng., 2022, 10, 107020 CrossRef CAS.
Footnote |
| † Electronic supplementary information (ESI) available. See DOI: https://doi.org/10.1039/d4ra06635a |
| This journal is © The Royal Society of Chemistry 2024 |