
 Open Access Article
 This Open Access Article is licensed under a Creative Commons Attribution-Non Commercial 3.0 Unported Licence
Cleome arabica L. extract as a novel green corrosion inhibitor for AISI 1045 carbon steel in 0.5 M HCl: insights from experimental and theoretical DFT analyses
Imane Ait Bouabdallah *ab,
Fatima Adjalacd,
Aida Zaabaref,
Abdelkader Benchikhf,
Djamila Guernicheg,
Chafia Ait Ramdane-Terboucheg,
Ana P. Piedadeh,
Mahmoud Z. Ibrahimijk,
Noureddine Nasrallahl and
Abderrezak Abdil
*ab,
Fatima Adjalacd,
Aida Zaabaref,
Abdelkader Benchikhf,
Djamila Guernicheg,
Chafia Ait Ramdane-Terboucheg,
Ana P. Piedadeh,
Mahmoud Z. Ibrahimijk,
Noureddine Nasrallahl and
Abderrezak Abdil
aDepartment of Industrial Chemistry, Faculty of Science and Technology, Biskra University, Biskra, 07000, Algeria
bMolecular Chemistry and Environment Laboratory, University of Biskra, Biskra, Algeria
cLaboratory of Environmental Materials, Chemical Process and Sustainable Development, Faculty of Science and Technology, University of Biskra, Biskra, 07000, Algeria
dLaboratory for the Development of Automatic and Intelligent Control Systems in Agriculture in Arid Regions, Department of Industrial Chemistry, University of Biskra, PO Box 145, 07000, Biskra, Algeria
eLaboratory of Materials and Sustainable Development (LMDD), Faculty of Applied Sciences, University of Bouira, 10000 Bouira, Algeria
fLaboratory of Electrochemistry, Corrosion, and Energy Valorization (LECVE), Faculty of Technology, University of Bejaia, 06000 Bejaia, Algeria
gCentre de Recherche Scientifique et Technique en Analyses Physico-chimiques(CRAPC), BP384, Bou-Ismail, RP 42004, Tipaza, Algeria
hUniversity of Coimbra, CEMMPRE, Department of Mechanical Engineering, 3030-788 Coimbra, Portugal
iDepartment of Mechanical Engineering, Faculty of Engineering, University of Malaya, 50603, Kuala Lumpur, Malaysia
jDepartment of Design and Production Engineering, Faculty of Engineering, Ain Shams University, Cairo 11517, Egypt
kAdvanced Manufacturing & Material Processing (AMMP) Research Centre, Department of Mechanical Engineering, Faculty of Engineering, University of Malaya, 50603 Kuala Lumpur, Malaysia
lLaboratory of Reaction Engineering, FMEPE, USTHB, BP 32, Algiers, Algeria
First published on 14th November 2024
Abstract
The search for sustainable, cost-effective and environmentally friendly corrosion inhibitors for hydrochloric acid (HCl) solution in industrial applications has garnered increasing interest in plant extracts and their refined metabolites. In this research, Cleome arabica L. (CA) extract, found in the Algerian Sahara, was considered due to its low cost compared to other studied plants and higher content of active compounds, thereby emerging as a promising candidate and offering the potential to promote a circular economy model. This study assessed the effectiveness of CA extract as a green corrosion inhibitor for AISI 1045 carbon steel in 0.5 M HCl solution and highlighted its potential to advance the field of green corrosion inhibitors. ATR-FTIR and LC-ESI-MS/MS analyses revealed the presence of significant organic compounds, including coumaric acid (74.58%), 4-methoxybenzoic acid (12.53%), and kaempferol (8.05%), which contributed to the corrosion inhibition. The inhibitory effectiveness of the CA extract was evaluated at five concentrations, ranging from 0.125 to 1 g L−1, using weight loss measurements, potentiodynamic polarization (PDP) and electrochemical impedance spectroscopy (EIS). The highest inhibition efficiency (η = 94.45%) was observed at a CA extract concentration of 1 g L−1 after 196 hours of immersion in 0.5 M HCl. Thermodynamic analysis using the Langmuir adsorption isotherm yielded a ΔGads value of −24.737 kJ mol−1, indicating the spontaneous adsorption of CA molecules onto the AISI 1045 surfaces, forming a protective layer, which was confirmed by SEM/EDX analysis. Density functional theory (DFT) calculations showed a significant correlation with the experimental data, confirming that CA extract is a highly efficient and environmentally friendly corrosion inhibitor.
1. Introduction
Carbon steel, a ubiquitous metal in industrial manufacturing due to its cost-effectiveness, strength, and widespread accessibility, faces a significant challenge of vulnerability to corrosion in acidic settings. This vulnerability presents a considerable obstacle, leading to substantial engineering complexities and financial difficulties, with costs estimated to be around 2.5 trillion USD annually, representing about 3.4% of global GDP.1 In the oil and gas sector, 15% hydrochloric acid (HCl) is highly favored for descaling carbon steel due to its cost-efficiency and ability to eliminate insoluble residue. However, the disadvantages regarding human health and the potential damage to metal surfaces caused by corrosion during the cleaning process cannot be overlooked. These challenges underscore the urgent need for effective corrosion inhibitors.2Many industries have employed several strategies to reduce corrosion. These include cathodic protection to safeguard pipelines and maritime infrastructure as well as the use of physical barriers, like coatings and advanced polymers in the automotive and construction sectors.3 Despite these efforts, the annual cost of corrosion in the oil and gas industry remains substantial, amounting to billions of dollars. According to research,4 the selection and design of appropriate materials are crucial in preventing corrosion. Regular maintenance and inspections also play a vital role in rapidly identifying and addressing the issue, thus extending the lifespan of equipment.5 However, while synthetic organic compounds have been used successfully to protect materials, they come with certain drawbacks, such as toxicity, environmental hazards, and high cost. These limitations drive the need for alternative, environmentally friendly and cost-effective corrosion inhibitors.
In recent years, there has been a growing trend toward utilizing natural products as corrosion inhibitors due to their non-toxicity and biodegradable nature. Thus, the need for ecologically and green inhibitors has become crucial. Plants are promising sources of effective corrosion inhibitors and can provide not only environmental advantages but they are also cost-effective and easily accessible.6 Several studies have investigated different plant extracts, including Gentiana olivieri, chamomile flowers,Pelargonium graveolens, Marrubium vulgare L., and coconut coir, to assess their ability to act as corrosion inhibitors in acidic environments.7–11 Every plant, including the flowers, seeds, grains, fruits, and roots, have numerous natural organic and phytochemical elements with different molecular sizes and adsorption sites, like –OH, –NH2, –COOH, –COOC2H5, –CONH2, and –NHCH3, which facilitate contact and adsorption on metal surfaces. At the same time, the sections of these plants that are resistant to water migrate away from the surface when they are in a solution that contains ions.12 However, while some of these plants demonstrate efficacy, they also have certain limits. Certain plant extracts exhibit instability in very acidic settings or need elevated concentrations for efficacy; hence limiting their large-scale use. Furthermore, some plants may be scarce, and their harvesting might be expensive or ecologically detrimental. In this situation, Cleome arabica L. presents itself as a viable option. This plant has several bioactive compounds that may form stable complexes with metal ions, providing a protective layer on metallic surfaces, and it may be particularly effective in harsh acidic environments. Furthermore, its presence in equatorial and semi-tropical locations may enable more accessible extraction compared to other rarer species. Thus, Cleome arabica L. may mitigate some limitations linked to previously examined plant extracts, making it a promising option for further investigation as a green corrosion inhibitor.
Consequently, the primary aim of this research was to investigate the efficacy of Cleome arabica L. (CA) extract as a corrosion inhibitor for AISI 1045 carbon steel in hydrochloric acid (HCl) solutions. This study aimed to demonstrate the effectiveness of CA extract as a green, natural inhibitor to reduce the corrosion rate of carbon steel in acidic environments, thereby contributing to the increasing demand for eco-friendly corrosion inhibitors in sustainable industrial practices.
2. Experimental
The reagents and chemicals used in these studies were of high purity, with a minimum grade of 99%. Double-distilled water, exhibiting a resistivity of approximately 0.8 MΩ cm, was employed throughout the investigations.2.1. Extraction protocol
The aerial part of CA was carefully collected form the region of Mekhadma Wilaya of Biskra, in the north east of Algeria. The plant was washed under running water then left to air dry in a shaded area for 15 days to prevent material degradation.13 After drying, the material was finely ground to aid preparing the ethanolic extract—the extraction process involved using a Soxhlet apparatus for 5 h, followed by cooling.14 The retrieved extracts were condensed using a reduced-pressure rotary flash evaporator at 40 °C and stored at 4 ± 0.5 °C in an airtight container.2.2. Characterization techniques
2.3. Corrosion testing methods
The study medium (0.5 M HCl) was prepared from 37% hydrochloric acid supplied by Aldrich and the CA extract was added to the acidic medium at the required concentrations (0.125, 0.25, 0.5, 0.75, and 1 g L−1) in addition to the reference solution without CA extract addition. Commercially available AISI 1045 steel was cut into rectangular samples (1 × 1 cm2) and used for the corrosion testing—the elemental composition of AISI 1045 in wt% was 0.456 C, 0.710 Mn, 0.009 P, 0.010 S, 0.190 Si, and the rest as Fe, following European standard EN10277. Before the corrosion tests, the surface of the steel working electrode underwent successive polishing with SiC emery papers with varying grit sizes, from #120 to #2500 grit, to achieve a uniform surface finish. The surface finish of the electrode in the corrosion testing was kept the same as that in the weight loss tests. Then, careful cleaning was carried out using acetone and double-distilled water, followed by hot air drying. For each test, 15 mL of 0.5 M HCl solution was used. All the tests were performed under static conditions; no stirring was employed.
 | (1) |
 | (2) |
The EIS parameters were assessed across a frequency range from 100 kHz to 10 MHz, yielding data with a 10 mV amplitude. Before collecting any data, the working electrode was given 60 min to achieve a stable state at its open-circuit voltage.
The potentiodynamic polarization studies were performed by systematically altering the voltage within the range of 0–0.8 V relative to the SCE while maintaining a scan rate of 10 mV s−1. The electrodes were submerged in hydrochloric acid solutions with concentrations of CA extract ranging from 0–1 g L−1, at a concentration of 0.5 M. To assess the efficacy of the CA extract as an inhibitor, the percentage inhibition efficiency (η) was obtained by computing the corrosion current densities from the polarization curves, using eqn (3), as given in ref. 21.
 | (3) |
The variables i0corr and icorr reflect the corrosion current densities measured in 0.5 M HCl solution in the absence and the presence of the inhibitor, respectively.
The inhibition effectiveness of the AISI 1045 steel, as evaluated by the EIS measurements, was determined using the next equation:
 | (4) |
Following immersion, Rct and Rinhct represent the charge-transfer resistances of the steel, with and without the inhibitor, correspondingly. The double-layer capacitances (Cdl) were computed by the CPE parameters in accordance with ref. 22 using eqn (5).
 | (5) |
The range of the empirical constant n was 0 ≤ n ≤ 1.
2.4. Adsorption isotherms
Analyzing the adsorption isotherms of a corrosion inhibitor can yield valuable insights into its mechanism of action. The inhibitor's adsorption onto the metallic surface is crucial for its effectiveness. Plant extracts typically enclose a diverse range of organic elements that can adhere to a metal surface using various methods.23To understand the adsorption behavior and calculate the surface coverage and free energy of adsorption, three adsorption isotherm models—Langmuir, Temkin, and Freundlich—were employed here, with the formulae given by eqn (6)–(8). The collected data were subsequently compared to the adsorption isotherms derived from the polarization and impedance curves.24
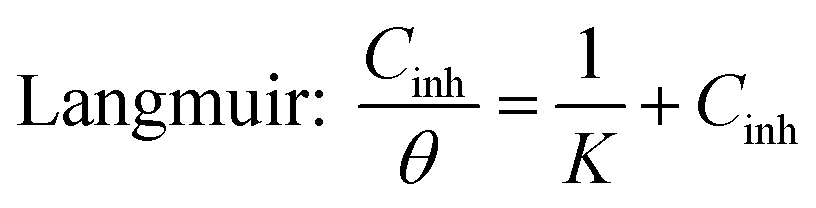 | (6) |
 | (7) |
 | (8) |
2.5. Surface analysis
The physical structure and evolution of the chemical constituents of the AISI 1045 steel samples were examined prior to and after the corrosion test. This examination was conducted utilizing a Jeol JSM-5800 LV scanning electron microscopy instrument (SEM) combined with an energy-dispersive X-ray microanalysis (EDX) system.2.6. Quantum chemical calculations
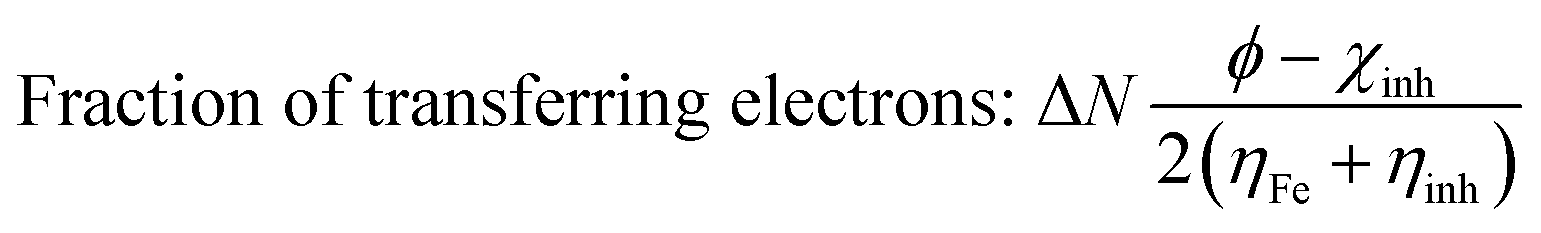
The ideal geometries and quantum chemistry calculation parameters of the major chemicals in the plant extract were determined by density functional theory (DFT). The input data for the whole geometry optimization of those molecules were generated using Gauss View® 6.0 (ref. 25) specifically for this study. The DFT operations were conducted employing Gaussian 9.5 software. The molecules were optimized using the B3LYP technique26 in the presence of water solvent, employing the conductor polarizable calculation model (CPCM) and the 6-31g(d,p) basis set. The border molecular orbitals, namely the highest occupied molecular orbital and the lowest empty molecular orbital, can be utilized to anticipate the precise sites where the inhibitor molecules will attach. For the most efficient electron transfer, adsorption should ideally happen at the specific site on the molecule where the local property softness (σ) is at its maximum value.27 Eqn (9)–(15) (ref. 28 and 29) outline the use of the EHOMO and ELUMO data for the computation of the energy gap (ΔE), absolute electronegativity (χ), global softness (σ), global hardness (η), electrophilicity (ω), nucleophilicity (ε), and number of migrated electrons (ΔN).Energy gap:
| ΔE = ELUMO − EHOMO | (9) |
The position of the lowest unoccupied molecular orbital is given by ELUMO and the highest occupied molecular orbital by EHOMO, respectively.
 | (10) |
 | (11) |
 | (12) |
 | (13) |
 | (14) |
 | (15) |
3. Results and discussion
3.1. LC-ESI-MS/MS analysis
LC-ESI-MS/MS analysis revealed that the CA extract was mainly composed of coumaric acid (74.68%), 4-methoxybenzoic acid (12.53%), kaempferol (8.05%), and 2-methoxybenzoic acid (1.20%) (Table 1). These relatively high values suggest that the CA extract contained abundant phenolic and flavonoid compounds. These compounds have the potential to adhere to the metallic surface and create an inhibitory barrier.30 Coumaric acid, as the primary constituent, plays a major role, while the other chemicals can contribute similarly by enhancing antioxidant protection and enhancing the durability of the protective layer. The combination of such elements produces a substantial drop in the corrosion rate by establishing a layer that prevents corrosive chemicals from reaching the surface of the steel. The main difficulty in using botanical extracts as corrosion inhibitors lies in the intricate task of identifying the principal active component, which is complicated by the variable composition of the extract. However, the combined efforts of several components can successfully hinder metal corrosion.31| Compound | Molecular formula | ESI charge (±) | Percentage% |
|---|---|---|---|
| Hydroxy quinoline | C9H7NO | (+) | 0.08 |
| Thymol | C10H14O | (+) | 0.09 |
| 2-Methoxybenzoic acid | C8H8O3 | (+) | 1.20 |
| 4-Methoxybenzoic acid | C8H8O3 | (+) | 12.53 |
| Coumaric acid | C9H8O3 | (+) | 74.58 |
| Kojic acid | C6H6O4 | (+) | 0.09 |
| Ferulic acid | C10H10O4 | (+) | 0.70 |
| Naringenin | C15H12O5 | (+) | 0.11 |
| Beta carotene | C40H56 | (+) | 0.24 |
| Kaempferol | C15H10O6 | (+) | 8.05 |
| Quercetin | C15H10O7 | (+) | 0.24 |
| Vanillin | C8H8O3 | (+) | 0.33 |
| Chrysin | C15H10O4 | (+) | 0.17 |
| Myricetin | C15H10O8 | (+) | 0.02 |
| Folic acid | C19H19N76 | (+) | 0.33 |
| Rutin | C27H30O16 | (+) | 0.59 |
| Sinapic acid | C11H12O5 | (−) | 0.003 |
| 4-Hydroxy coumarin | C27H30O16 | (−) | 0.004 |
| 3,5-Dihydroxybenzoic acid | C7H6O4 | (−) | 0.004 |
| Cis-p-coumaric acid | C9H8O3 | (−) | 0.004 |
| Salicylic acid | C7H6O3 | (−) | 0.030 |
| Gallic acid | C4H4O4 | (−) | 0.003 |
| Hesperetin | C16H14O6 | (−) | 0.598 |
3.2. ATR-FTIR spectroscopy
The ATR-FTIR analysis of the CA extract displayed several peaks that corresponded to different functional groups (Fig. 1). The presence of hydroxyl groups (OH−) in the phenolic compounds was indicated by a prominent peak at 3296 cm−1.32 The absorption band detected at 2920 cm−1 indicated the C–H stretching vibration in alkanes.33 This band is associated with the vibrations of CH2, CH3 groups, and flavonoid components.34 The existence of carbonyl (C![[double bond, length as m-dash]](https://www.rsc.org/images/entities/char_e001.gif) O) and aromatic benzene rings (CC) bonds was verified by peaks seen at 1737 and 1650 cm−1, respectively.35
O) and aromatic benzene rings (CC) bonds was verified by peaks seen at 1737 and 1650 cm−1, respectively.35
 | ||
| Fig. 1 FTIR (ATR) spectrum of the (CA) extract. | ||
The existence of carboxylic acids (O–H stretching) and amines/amides (N–H bending and C–N/C–O stretching) was suggested by additional peaks at 2841 and 1581–1368 cm−1, respectively. This indicates the potential presence of alkaloids and quinine in the extract.36 The vibrations seen at frequencies below 1000 cm−1 were most likely caused by C–H vibrations occurring in the benzene rings.37 In summary, the FTIR analysis provided evidence of the existence of functional groups that comprise oxygen atoms and aromatic rings, which are typical attributes of efficient corrosion inhibitors.38,39
3.3. Weight loss results
The weight loss measurements suggest that the CA molecules had strong corrosion-prevention characteristics on AISI 1045 steel in 0.5 M HCl solution. According to Fig. 2, the corrosion rate of the specimens diminished, and the inhibitor's effectiveness increased with the increase in dosage of the inhibitor. Indeed, the efficiency (η) increased proportionally with the concentration, reaching around 94.45% when 1 g L−1 was added after 196 h of immersion. In addition, the corrosion rate (CR) was significantly diminished by more than 18 times (from 0.3278 mg cm−2 h−1 in the blank to 0.0182 mg cm−2 h−1) for 1 g L−1, equal to 3.648 and 0.202 mm per year, in accordance with the ASTM standard.40 The observed outcomes could be ascribed to the heightened polarity of the plentiful phenolic and flavonoid compounds found in the CA extract, including coumaric acid, 4-methoxybenzoic acid, and kaempferol. This increased polarity facilitates stronger interaction with the recently formed reaction sites caused by the metal corrosion. Ultimately, this leads to the creation of a protective layer on the surface of the metal. According to the literature,41,42 the diminishment in the rate of metal corrosion could be ascribed to the relationship between the electronic pairs of non-bonding heteroatoms (N, S, O) in flavonoid compounds. These heteroatoms form organometallic complexes (Fe-Inh) with the newly formed Fe2+ ions, resulting in their adsorption on the metallic surface.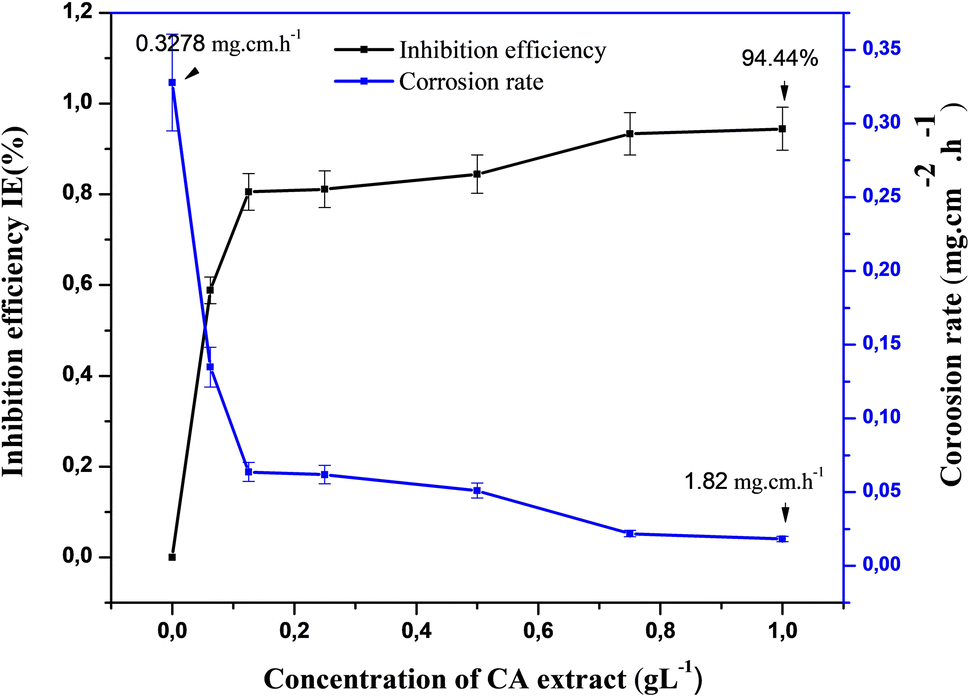 | ||
| Fig. 2 Corrosion rate and inhibition efficiency variation with the increasing concentration of CA extract. | ||
3.4. Electrochemical test results
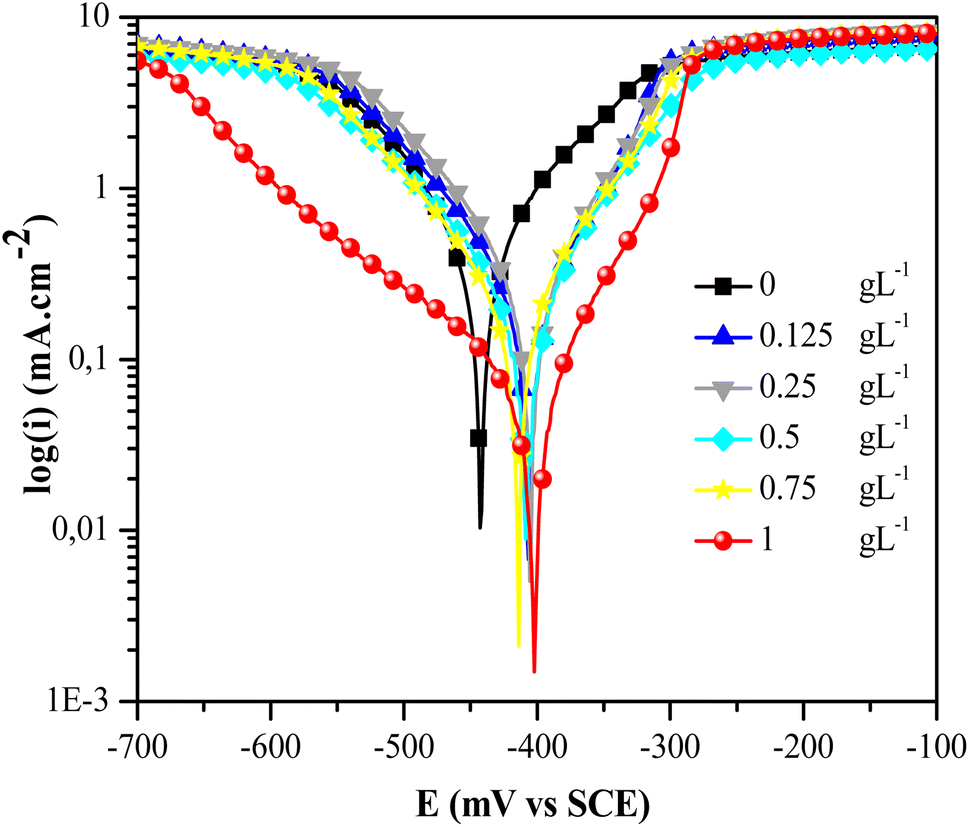 | ||
| Fig. 3 Semi-logarithmic polarization curves of the steel sample in 0.5 M HCl at various inhibitor concentrations. | ||
| Concentration (g L−1) | icorr (mA cm−2) | Ecorr (mVCSE) | −bc (mV dec−1) | ba (mV dec−1) | Rp (Ω cm2) | η (%) |
|---|---|---|---|---|---|---|
| 0 | 0.231 | −443 | 103 | 135 | 109.70 | — |
| 0.125 | 0.093 | −407 | 112 | 81 | 218.72 | 59.74 |
| 0.250 | 0.098 | −405 | 106 | 82 | 204.89 | 57.58 |
| 0.500 | 0.095 | −408 | 121 | 93 | 241.23 | 58.87 |
| 0.750 | 0.071 | −413 | 111 | 95 | 314.59 | 69.26 |
| 1 | 0.028 | −402 | 183 | 79 | 835.96 | 87.89 |
The introduction of CA extract into the acid solution at different concentrations (Cinh) significantly decreased the corrosion current density. Specifically, it fell from 0.231 to 0.028 mA cm−2 for the uninhibited solution, while the solution was inhibited at 1 g L−1. Based on the information provided in Fig. 4, the efficiency could be regarded as substantial for values of Cinh greater than 0.5. The efficiency reached 87.89% after stabilizing at about 70%.
 | ||
| Fig. 4 Inhibition efficiency (η%) as a function of the inhibitor concentration in 0.5 M HCl solution based on polarization curve measurements. | ||
The CA extract influenced the anodic and cathodic branches of the polarization curves in a distinct manner. The anodic branch, which represents the dissolution of iron (Fe → Fe2+ + 2e−) showed sensitivity to the concentration of the extract. Indeed, the increase in the concentration of CA extract led to a significant suppression of the anodic current, which suggests the adsorption of CA molecules on the steel surface and the inhibition of metal dissolution. This observation is consistent with corrosion mechanisms that generally involve oxidation on metal surfaces in the presence of oxygen and moisture.43 On the other hand, the cathodic branch, associated with hydrogen generation (2H+ + 2e− → H2) and oxygen reduction (O2 + 4H+ + 4e− → 2H2O), remained relatively stable at low concentrations of CA extract. However, at a concentration of 1 g L−1, a marked reduction in cathodic current density was observed, indicating an interference of the CA extract in the hydrogen evolution reaction and oxygen reduction, by blocking a greater number of active cathodic sites. In acidic environments, the reduction of oxygen is often negligible compared to that of hydrogen, which becomes predominant. Inhibitors such as CA extract can limit these reactions in acidic environments.44 This can be explained by the high concentration of H+ ions in the acidic solution, which favors the reduction of hydrogen over that of oxygen, making the contribution of the latter minimal. In the presence of CA, the reduction of oxygen and the release of hydrogen were mitigated, as well as the oxidation reactions responsible for corrosion.45 These results suggest a mixed-type inhibition mechanism, in which the CA extract influences both the anodic process and, at high concentrations, also inhibits the cathodic reactions. It is often difficult to define a unique mechanism for an inhibitor, as it can vary depending on certain factors, such as the concentration, the pH of the solution, and the nature of the anions present in the acid.46 In addition, the polarization resistance (Rp) as described in eqn (16) significantly rose to a value of 835.96 Ω cm2, which was about 8 times more than the polarization resistance of the uncontrolled test solution. This suggests that the components of the CA extract offer a substantial level of safeguarding to the metallic surface.
 | (16) |
According to M. Eissa et al. (2024), CA extract functions as a corrosion inhibitor that has both anodic and cathodic effects. It caused a change in the corrosion potential (Ecorr) toward higher anodic values, namely below 85 mV, in comparison with the blank sample. Nevertheless, it is necessary to highlight that a smaller Tafel slope signifies quicker electron-transfer kinetics.47 Upon close analysis of the Tafel slopes acquired in the presence of CA extract, it becomes apparent that the anodic dissolution process of the mild steel solid phase was marginally swifter than the cathodic reduction process of hydrogen ions. This was particularly evident in the inhibited solution using 1 g L−1, which exhibited the slowest charge-transfer kinetics and the highest bc parameter of 183 mV dec−1. Therefore, the corrosion process progressed gradually due to the influence of cathodic regulation.
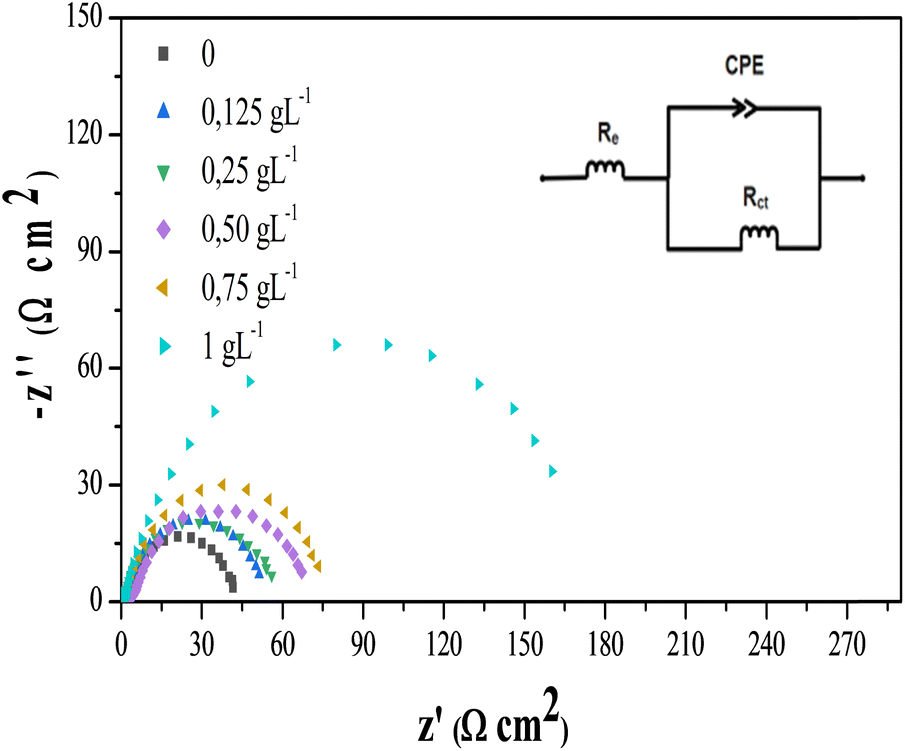 | ||
| Fig. 5 Nyquist diagrams of the steel samples in 0.5 M HCl at different concentrations of CA extract; inset shows the equivalent electrical circuit fitting the experimental data. | ||
Table 3 demonstrates that the inhibitor's presence significantly increased Rct, indicating a notable improvement in corrosion inhibition effectiveness. The most significant impact was observed when the CA extract inhibitor concentration reached 1 g L−1, resulting in a Rt value of 182.19 Ω.cm2. This improvement could be ascribed to the potential of the CA extract inhibitor to attach to the metallic surface, hence decreasing the quantity of electroactive sites that are susceptible to corrosion.50 Significantly, the capacitance of the double layer (Cdl) diminished as the concentration of the inhibitor increased, as exhibited in Table 3. This resulted in an augmentation of the thickness of the electrical double layer and a decrease in the exposed surface area, indicating the binding of the inhibitor molecules to the AISI 1045 steel surface.51
| Concentration (g L−1) | Re (Ωcm2) | Rt (Ωcm2) | Q (μF cm−2) | n | Cdl (μF cm−2) | η (%) |
|---|---|---|---|---|---|---|
| 0 | 1.747 | 41.152 | 141.1 | 0.76 | 202 | — |
| 0.125 | 1.060 | 57.052 | 123.2 | 0.82 | 145 | 26.1 |
| 0.250 | 0.629 | 62.119 | 106 | 0.86 | 115 | 32.1 |
| 0.500 | 3.082 | 72.563 | 98.6 | 0.87 | 103 | 41.9 |
| 0.750 | 0.656 | 82.652 | 87.4 | 0.88 | 88 | 49.0 |
| 1 | 0.967 | 182.190 | 73.7 | 0.90 | 67 | 77.8 |
The observed rise in n compared to the HCl solution and the concentration may be attributed to the diminution of surface heterogeneity through the process of adsorption, whereby the inhibitor attaches to the most active sites.
The impedance tests indicate that the inhibitory properties became more effective as the concentration of the CA extract increased. The greatest level of inhibition, reaching 77.86%, was seen at a concentration of 1 g L−1, as shown in Table 3. The data acquired from the polarization curves confirmed the inhibitory activity of the plant extract.
3.5. Adsorption isotherm and thermodynamic parameters
The findings indicate that the most accurate curve was obtained by plotting (C/θ) against concentration, as exhibited in Fig. 6, using the Langmuir model given by eqn (6). This yielded a correlation coefficient R2 of 0.9966, which is very near to 1. This suggests that the attachment of the CA extract inhibitor to the steel surface in 0.5 M HCl followed the Langmuir adsorption isotherm, which is consistent with earlier findings.52,53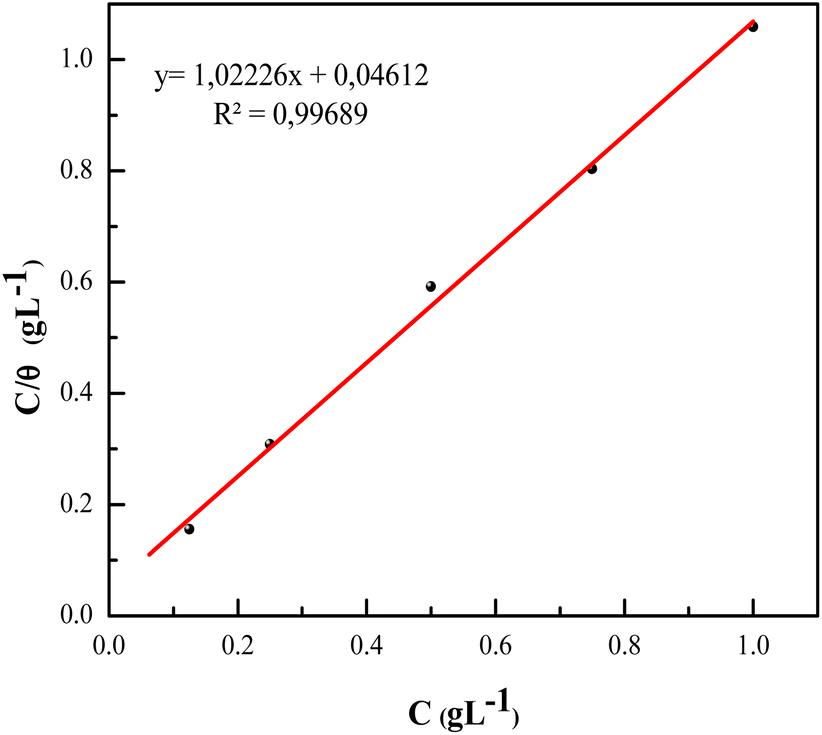 | ||
| Fig. 6 Langmuir adsorption isotherm of CA extract in 0.5 M HCl with the method polarization. | ||
However, testing with the other eqn (7) and (8) for the Temkin and Freundlich isotherms provided less satisfactory fits, with R2 values of 0.8264 and 0.7840, respectively. This is a consequence of the assumptions made by the particular models. The Langmuir isotherm assumes homogeneous adsorption sites and no molecular interactions, which fitted the data. However, the Temkin and Freundlich isotherms presuppose a heterogeneous surface and adsorbate interactions.54 These assumptions do not apply if the metal surface is reasonably uniform, and adsorption mostly leads to forming a monolayer. Therefore, the Temkin and Freundlich models could not effectively describe the adsorption process in this case.
The free energy adsorption (ΔGads) was determined using eqn (17), using the Kads value obtained from the C/θ intercept at the origin of the Langmuir isotherm plot.55
ΔGads = −RT![[thin space (1/6-em)]](https://www.rsc.org/images/entities/char_2009.gif) ln(CH2O × Kads) ln(CH2O × Kads)
| (17) |
The calculated ΔGads value (−24.737 kJ mol−1) for the investigated CA inhibitor is negative and falls within the range of −20 to −40 kJ mol−1 (Table 4). As previously mentioned,56 CA molecules are adsorbed onto the surface of AISI 1045 steel by a combination of physisorption and chemisorption processes.
| Model of isotherms | R2 | Slope | Intercept (g L−1) | Kads (L g−1) | −ΔGads (kJ mol−1) |
|---|---|---|---|---|---|
| Langmuir | 0.996 | 1.022 | 0.0461 | 21.682 | 24.737 |
| Temkin | 0.826 | 0.110 | 0.9544 | 0.937 | 38.495 |
| Freundlich | 0.784 | 0.144 | −0.0149 | 0.966 | 17.029 |
The calculated ΔGads value (−24.737 kJ mol−1) for the investigated CA inhibitor was negative and fell within the range of −20 to −40 kJ mol−1 (Table 4). As previously mentioned,56 CA molecules are adsorbed onto the surface of AISI 1045 steel by a combination of physisorption and chemisorption processes.
A negative ΔGads signifies a spontaneity adsorption process and a durable adsorbed layer on the metal surface. Physical adsorption, a phenomenon caused by electrostatic interactions among charged molecules and the metal, is often characterized by ΔGads values equal to −20 kJ mol−1 or less. On the other hand, if the ΔGads measurements are more negative, such as −40 kJ mol−1, it suggests chemisorption, which refers to the transfer of charge across organic molecules and the metal surface.
3.6. Surface morphology and elemental analysis
The SEM images in Fig. 7 display the surfaces of AISI 1045 steel before and after immersion in 0.5 M HCl, with and free of CA plant extract. They illustrate three distinct conditions of the metallic objects studied. The first micrograph in Fig. 7A depicts the morphology of the polished specimen, demonstrating a smooth surface. The second in Fig. 7B illustrates the significant damage resulting from severe corrosion of the steel surface in the highly acidic solution, leading to substantial destruction of the steel surface with the formation of numerous imperfections, such as fractures and flakes. The introduction of CA extract had a noticeable impact on the surface topography, as shown in Fig. 7C, whereby the surface became homogeneous and less damaged. This transformation was attributed to the development of a protective layer on the surface of AISI 1045 steel to prevent corrosion.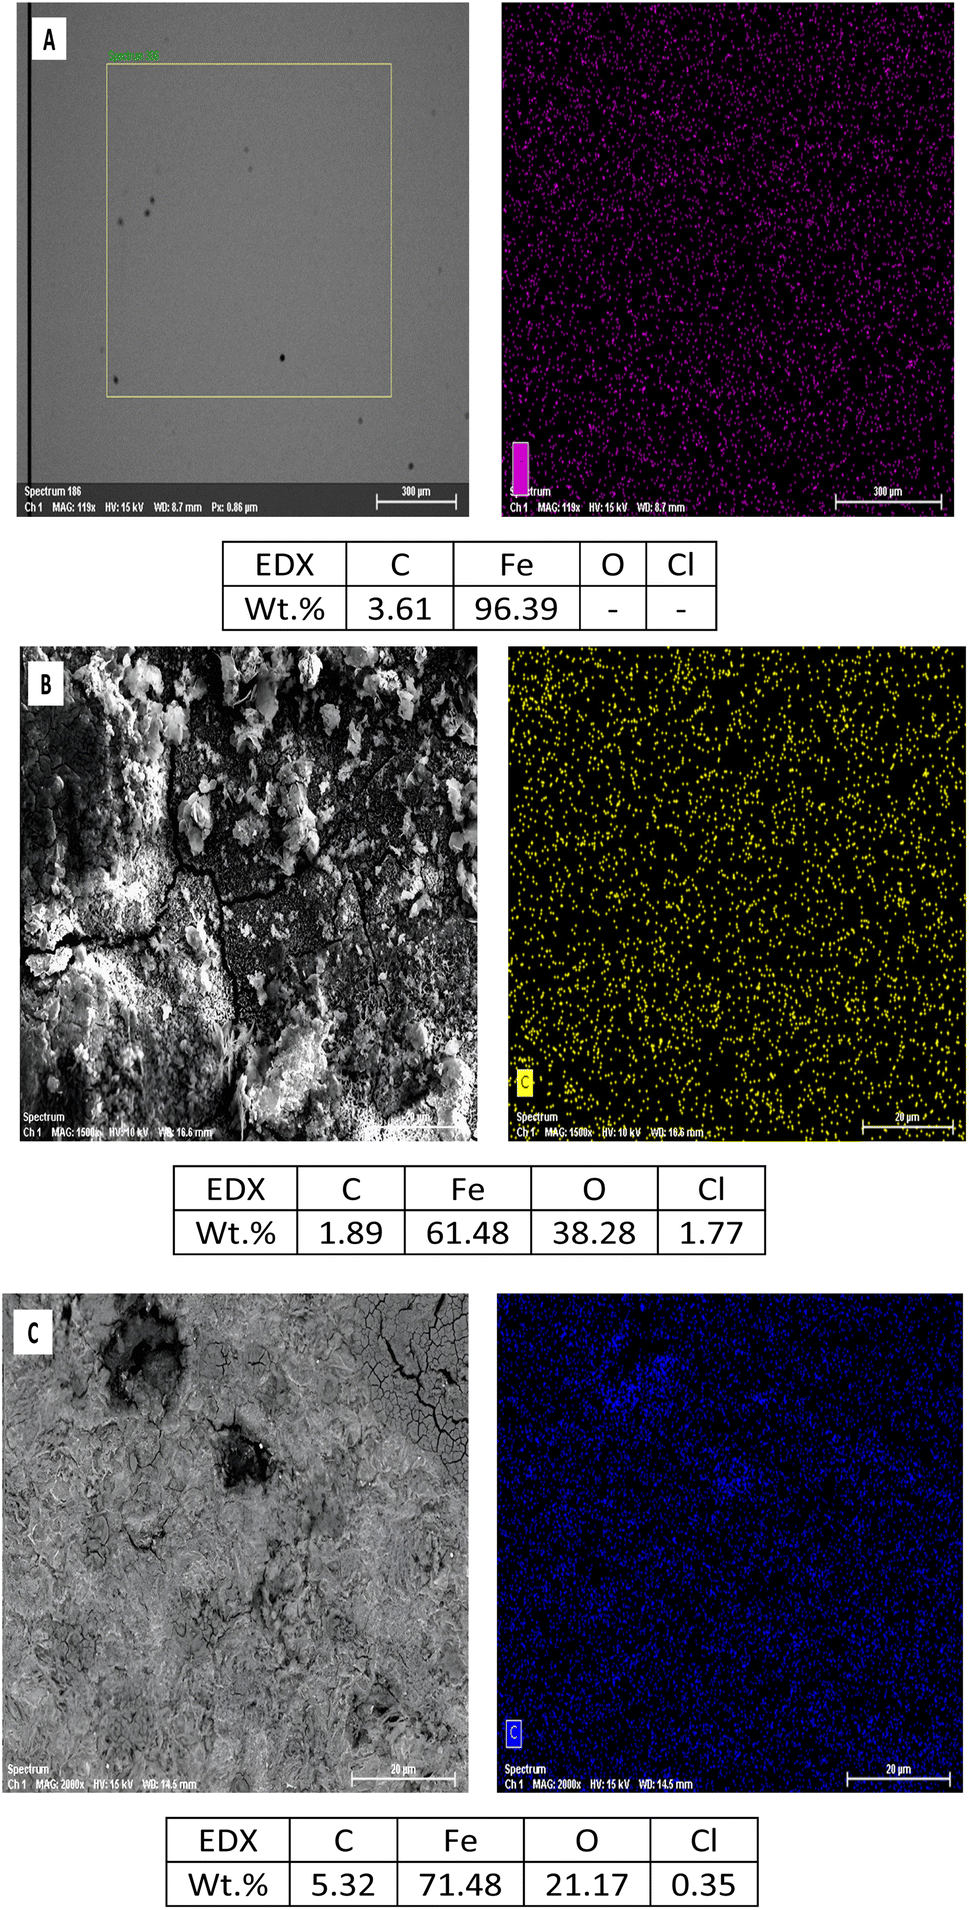 | ||
| Fig. 7 SEM and EDX data for C45 steel samples: (A) polished, (B) with 0.5 M HCl, (C) with 0.5 M HCl + 1 g L−1 of CA extract. | ||
Examination of the EDX data accompanying these figures revealed that iron was the predominant element in the surface composition. Before immersion in 0.5 M HCl, the elemental composition on the surface of AISI 1045 steel was 96.39% Fe and 3.61% C. After the immersion tests, the composition changed significantly, with a marked decrease in Fe 61.48% due to the corrosion, resulting in a lower percentage of carbon 1.86% too and an increase in other elements, like oxygen at 38.28% and chlorine at 1.77%, indicative of the creation of corrosion products.57 The incorporation of the CA extract into 0.5 M HCl solution led to an increase in the mass percentage of carbon from 1.89% to 5.32%, related to the existence of organic substances in the CA extract. Additionally, there was a reduction in chlorine from 1.77% to 0.35%, which could be attributed to the ability of CA to reduce the corrosion products resulting from the reaction between steel and HCl. The decrease in oxygen from 38.28% to 21.17% and the increase in iron from 61.48% to 71.48% suggested less oxidation occurred and less Fe ions were released from the substrate surface into the HCl solution, Fig. 7C. This demonstrates there was an enhancement in corrosion inhibition on the surface of the AISI 1045 steel.
3.7. Quantum chemical study
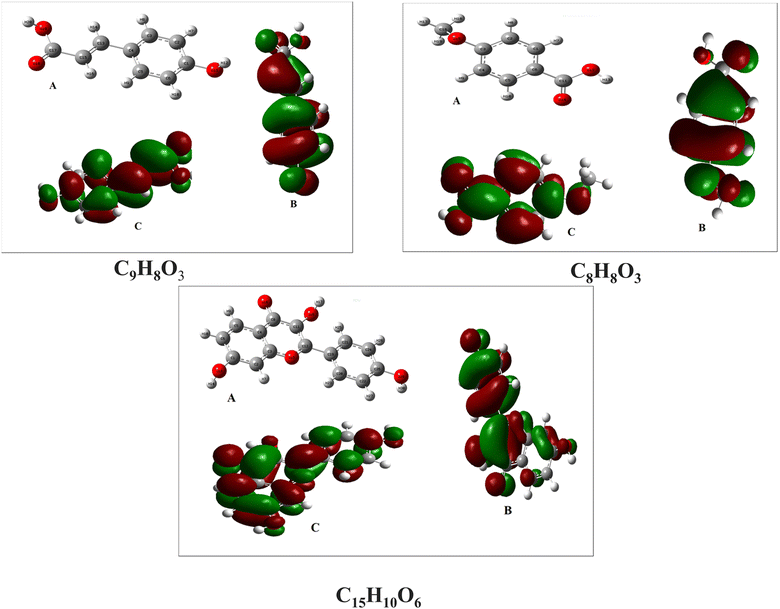
Fig. 8 illustrate the optimized molecular structure and the electrostatic potential map (ESP) for the majority of the molecules in this plant. By observing the image (Fig. 8), we can determine that the red to green sections represent electrophilic sites, which correspond to negatively charged areas. Similarly, the green to blue regions indicate nucleophilic sites, which correspond to positively charged areas. Therefore, the different colors in the image represent the active sites of the molecule. The whole molecule displayed these colors due to the existence of aromatic rings, oxygen, and carbon. | ||
| Fig. 8 Electrostatic potential maps (ESP) of the predominant molecules. C9H8O3, C8H8O3, and C15H10O6, respectively. | ||
Fig. 9a–c show the optimized molecular structures and the density distributions of the frontier molecular orbitals for these compounds. The electron-density distributions of the highest occupied molecular orbital (HOMO) (b) and lowest unoccupied molecular orbital (LUMO) (c) were mostly localized around the benzene rings and heteroatoms (O). These findings indicate that the inhibitor molecules may stick to the metal surface, enabling both the donation and reception of electrons to occur simultaneously.
 | ||
| Fig. 9 Frontier molecular orbitals (HOMO and LUMO) and the optimized structure of the predominant molecules C9H8O3, C8H8O3, and C15H10O6, respectively: (A) optimized structure, (B) HOMO, (C) LUMO. | ||
The assessment of the inhibitor's effectiveness was performed by analyzing its quantum chemical characteristics, comprising EHOMO, ELUMO, E, η, σ, χ, μ, and N, as specified in Table 5. The prevailing theory for the action of chemical inhibitors is that the molecules adhere to the metal surface by adsorption.
| Molecules | EHOMO (eV) | ELUMO (eV) | Etotal (UA) | μ (debye) | ΔE (eV) | χ (eV) | η (eV) | σ (eV−1) | ω | ε | ΔN |
|---|---|---|---|---|---|---|---|---|---|---|---|
| Acid coumaric C9H8O3 | −0.22086 | −0.06123 | −573.461143 | 3.219881 | 0.15963 | 0.53061 | 0.46939 | 2.13045 | 0.29992 | 3.33427 | 3.76668 |
| 4-Methoxybenzoic acid C8H8O3 | −0.23092 | −0.03673 | −535.362727 | 2.449355 | 0.19419 | 0.51836 | 0.48163 | 2.07626 | 0.27895 | 3.5849 | 3.69788 |
| Kaempferol C15H10O6 | −0.20008 | −0.06261 | −953.755781 | 1.715001 | 0.13747 | 0.53131 | 0.46869 | 2.13358 | 0.30114 | 3.32072 | 3.77065 |
The strength of adsorption determines whether chemical adsorption (chemisorption) or physical adsorption (physisorption) occurs. Chemisorption involves one reactant donating an electron pair while the other accepts it. The EHOMO value reflects a molecule's tendency to donate electrons, while the ELUMO value shows its capacity to accept electrons.58 The EHOMO values of −0.22086, −0.23092, and −0.20008 eV for the three dominant molecules suggest that this inhibitor can readily transfer electrons to the metal's unoccupied orbitals.
The main compounds of this inhibitor exhibited excellent electron absorption from the metal,59 as shown by their decreased ELUMO values of −0.06123, −0.03673, and −0.06261 eV. The high EHOMO and low ELUMO values show the inhibitor's great affinity for adhering to the metal surface. The inhibitor operates by both providing electrons to the metal's unoccupied d orbitals and removing electrons from the metal's d orbitals. This process leads to the creation of a feedback bond.60
The energy gap ΔE, is a significant amount that quantifies the vulnerability of a molecule as an inhibitor by measuring its capacity to stick to the metal surface as the energy gap (ΔE) is reduced.
The molecule then becomes more reactive and more effective at blocking specific processes, as observed in various studies.61
Smaller energy gap values (0.15963, 0.19419, and 0.13747 eV) are linked to increased chemical reactivity and hence a stronger inhibitory effectiveness.
A complex molecule generally has a substantial energy gap, whereas a soft molecule displays a comparatively tiny energy gap.62 Moreover, the dipole moment (μ) quantifies the extent of charge distribution in an inhibitor molecule. A high μ value indicates intense interactions inside the inhibitor molecule, resulting in the creation of durable adsorbed layers on the metal surface.63
The inhibitor and metal surface engaged in substantial dipole–dipole interactions, as evidenced by the high dipole moments of 3.219881, 2.449355, and 1.715001 debye for the dominant molecules of this inhibitor, exceeding the 1.88 debye dipole moment of H2O for the two most dominant molecules.64
Two key properties used to evaluate the stability and reactivity of molecules are the absolute hardness (η) and softness (σ). Absolute hardness refers to a molecule's capacity to withstand slight changes in a chemical process, such as deformation or polarization of its electron cloud.65 Soft molecules, which can donate electrons to an acceptor more readily than complex molecules, are generally more reactive. Adsorption tends to occur at the region of the molecule with the maximum σ value to facilitate efficient electron transfer.66
Compared to iron, the inhibitor molecules had lower electronegativity values (χ) of 0.53061, 0.51836, and 0.53131 eV. This suggests that electron transfer occurs from the inhibitor's highest occupied molecular orbital (HOMO) to the unoccupied orbitals of the metal.67 The effective inhibitory performance of the plant's principal molecules was indicated by their low electronegativity and energy gap values.68
Electrophilicity (ω) and nucleophilicity (ε) are essential factors for evaluating the corrosion inhibition capacity of molecules.
Electrophilicity examines a molecule's capacity to receive electrons, whereas nucleophilicity, sometimes represented as the reciprocal of electrophilicity (1/ω), assesses its tendency to donate electrons. These characteristics substantially affect a molecule's efficacy as a corrosion inhibitor. Molecules exhibiting elevated electrophilicity values are typically less efficacious as corrosion inhibitors, as they possess a greater propensity to receive electrons from the metal surface, hence potentially exacerbating the corrosion process. Molecules with greater nucleophilicity generally serve as more efficient corrosion inhibitors, as they can more easily donate electrons to create protective adsorption layers on metal surfaces.29,69,70 Our data indicated ω values of 0.29992, 0.27895, 0.30114 and ε values of 3.33427, 3.5849, and 3.32072, respectively, for the main molecules, confirming the inhibitory efficacy of our molecules.
At equilibrium, electrons are typically transferred from inhibitor molecules with lower electronegativity to metal atoms with higher electronegativity when the inhibitor interacts with the metal surface.71 The parameter N, representing the fraction of transferred electrons, is commonly used to indicate the direction of electron flow within the system. A positive N value signifies that metal atoms are receiving electrons from the inhibitor molecules, while a negative N value indicates the opposite effect.72 The positive value of N here highlights the inhibitor's significant electron-donating capacity to the carbon steel surface.73
Previous literature has documented that N values are correlated with the inhibitory impact due to electron donation.74,75
An augmentation in the values of N was observed to result in a corresponding rise in the inhibitory efficiency, and according to Lukovits's research,74 the inhibitor's capacity to donate electrons at the metal surface rose along with the inhibition effectiveness when N surpassed 3.6.
DFT Mulliken charge analysis, which identifies the reactive chemical centers, including nucleophilic and electrophilic sites, was used to assess this compound's inhibitory reactivity. These electrical charges operate as a quantifiable gauge of the strength of electrostatic interactions inside the molecule. Charges are crucial in physicochemical processes.76
The Mulliken charge distribution shown in Table 6 determine the location of the inhibitor's adsorption sites. Large negative values indicate their potential for absorption onto the metal surface.77 The oxygen atom possesses the most negative charge. This suggests that these atoms can establish a coordination link with the metal surface. The inhibitor chemicals prefer nucleophilic sites that include atoms with negative charges. A nucleophilic attack should take place at reactive sites that are capable of donating electrons to metals. Hence, nucleophilic attack will occur at the place where the negative charge is the most pronounced, particularly for the first molecule at oxygen (O11) and oxygen (O19), for the second at oxygen (O12) and oxygen (O15), and for the third molecule at oxygen (O13) and oxygen (O18). This property confers the effective adsorption locations on these atoms.78
| C9H8O3 | C8H8O3 | C15H10O6 | |||||
|---|---|---|---|---|---|---|---|
| Atom | Charge | Atom | Charge | Atom | Charge | Atom | Charge |
| C1 | 0.296399 | C1 | −0.112759 | C1 | 0.305213 | C21 | −0.119605 |
| C2 | −0.098068 | C2 | −0.099871 | C2 | −0.145484 | C22 | −0.102618 |
| C3 | −0.127217 | C3 | 0.308430 | C3 | 0.283235 | H23 | 0.101290 |
| C4 | 0.098852 | C4 | −0.099002 | C4 | 0.045584 | C24 | −0.115793 |
| C5 | −0.111310 | C5 | −0.107455 | C5 | −0.108143 | H25 | 0.138822 |
| C6 | −0.102917 | C6 | 0.052941 | C6 | −0.102357 | C26 | 0.301208 |
| H7 | 0.099636 | H7 | 0.119216 | H7 | 0.106683 | H27 | 0.098359 |
| H8 | 0.096300 | H8 | 0.101136 | C8 | 0.387808 | H28 | 0.098861 |
| H9 | 0.094169 | H9 | 0.103545 | H9 | 0.133243 | O29 | −0.594122 |
| H10 | 0.101182 | H10 | 0.125800 | H10 | 0.102905 | H30 | 0.321496 |
| O11 | −0.592400 | C11 | 0.547614 | C11 | 0.203633 | ||
| H12 | 0.321598 | O12 | −0.532158 | C12 | 0.262787 | ||
| C13 | −0.074125 | H13 | 0.330556 | O13 | −0.592403 | ||
| H14 | 0.124472 | O14 | −0.467601 | H14 | 0.324394 | ||
| C15 | −0.126224 | O15 | −0.536186 | O15 | −0.491941 | ||
| H16 | 0.114322 | C16 | −0.071843 | O16 | −0.571712 | ||
| C17 | 0.565649 | H17 | 0.122941 | H17 | 0.325796 | ||
| O18 | −0.473962 | H18 | 0.107098 | O18 | −0.548967 | ||
| O19 | −0.534496 | H19 | 0.107598 | C19 | 0.069406 | ||
| H20 | 0.328140 | C20 | −0.117578 | ||||
Conversely, the presence of a positive charge on the most reactive sites, which can accept electrons, indicates the probable locations for electrophilic attack. The main compounds in this inhibitor exhibited a preference for electrophilic attack at specific sites. For the first molecule, these sites were C17 and H20; for the second molecule they were C11 and H13; and for the third molecule they were C8, H17, and H30. These atoms attract electrons from the metal's unoccupied orbitals leading to the formation of feedback bonds. This interaction enhances the contact between the metal surface and the inhibitor.
These findings, obtained through theoretical simulations using DFT, clearly demonstrate that this plant exhibits significant inhibitory capacities, corroborating the results from the experimental studies.
3.8. Performance comparison with previous results
The results obtained indicate that CA (Cleome arabica L.) extract exhibits an inhibitory efficiency comparable to other corrosion inhibitors summarized in Table 7 for AISI 1045 steel and mild steel. Specifically, the CA extract demonstrated an inhibition efficiency of 94.45% for AISI 1045 steel, highlighting its effectiveness in mitigating corrosion.| Inhibitor | Metal | EI (%) | References |
|---|---|---|---|
| Tobacco extract | Mild steel | 96.09–96.25 | 79 |
| Kola leaf extract | 73.82 | ||
| Kola nut extract | 78.60 | ||
| 2-Butyl-hexahydropyrrolo[1,2-b][1,2]oxazole | Mild steel | 94 | 80 |
| Aqueous extracts of nettle plant | AISI 1045 | 97 | 21 |
| Methionine and its derivatives | AISI 1045 | 95.01 | 81 |
| Tartaric acid + 2,6-diaminopyridine | Mild steel | 92.1 | 82 |
| Indigo carmine and some cationic organic compounds | AISI 1045 | 95.0 | 83 |
| Morinda citrifolia | AISI-1045 | >86 | 84 |
| Gentiana olivieri | Mild steel | 92 | 8 |
| Brilliant cresyl blue dye ((7-amino-8-methylphenoxazin-3-ylidene)-diethylazanium dichlorozinc dichloride) | AISI 1045 | 70.90 | 85 |
| Substituted 1,3,4-oxadiazole | Mild steel | <85 | 31 |
| Cleome arabica L. extract | AISI-1045 | 94.45 | This work |
In this context, the CA extract shows considerable potential as an environmentally friendly alternative for protecting AISI 1045 steel. Its performance suggests it could be extended to other types of carbon steel, offering a sustainable solution for corrosion control across various applications.
4. Conclusion
This research successfully investigated the potential of CA extract as an environmentally friendly green corrosion inhibitor of AISI 1045 carbon steel in a highly aggressive medium of 0.5 M HCl. The following conclusions could be drawn from the study:• LC-MS analysis and ATR-FTIR spectroscopy revealed a wide range of organic components in the CA extract, mainly coumaric acid (74.58%), methoxy benzoic acid (12.53%), and kaempferol (8.05%). These compounds can adhere to the metal surface and create a protective barrier.
• The weight loss tests showed a notable inhibition efficiency of 94.45% at a concentration of 1 g L−1 after 196 h of immersion, resulting in a considerable reduction in the corrosion rate from 0.3278 mg cm−2 h−1 to 0.0182 mg cm−2 h−1.
• Potentiodynamic polarization (PDP) tests revealed a significant increase in polarization resistance (Rp), reaching 835.96 Ω cm2 with an inhibition efficiency of 87.89% at a concentration of 1 g L−1. Although the inhibitor exhibited mixed behavior, its predominant role as an anodic inhibitor was highlighted, confirming a more pronounced attenuation of the anodic dissolution of the steel.
• Electrochemical impedance spectroscopy (EIS) demonstrated that increasing the concentration of the inhibitor resulted in a substantial increase in the system's overall impedance. This increase was combined with an inhibition rate of 77.86%.
• The Langmuir adsorption isotherm indicated a significant adsorption of CA molecules on the steel surface with a negative ΔGads value of −24.737 kJ mol−1, signifying a mixed physisorption and chemisorption process.
• Scanning electron microscopy (SEM) and EDX analysis confirmed the formation of a protective layer on the steel surface, and DFT calculations demonstrated the strong electron-donating proprieties of the extract's bioactive molecules, confirming its effectiveness as a green corrosion inhibitor.
These findings strongly support the potential of Cleome arabica L. extract as an effective, sustainable, and eco-friendly corrosion inhibitor for industrial applications.
Data availability
All data obtained or evaluated during this investigation are included in this article. The corresponding author can supply additional datasets upon reasonable request to support the conclusions of this research.Conflicts of interest
The authors declare that they have no conflicts of interest.Acknowledgements
The authors express their sincere thanks to the École Nationale Supérieure Agronomique (ENSA) for providing the essential material for this study, to the Research Center for Physico-Chemical Studies (CRAPC) of Tipaza, for having provided the FTIR (ATR) studies and the Autolab equipment for the electrochemical study, as well as to the CRAPC Ouargla for having carried out the LC-ESI-MS/MS analyzes. Also, we express our gratitude to CEMMPRE (UIDB/00285/2020), Department of Mechanical Engineering, University of Coimbra, Portugal, for their assistance in carrying out the SEM-EDX study.References
- M. Liu, X. Dayu, A. Singh and Y. Lin, Processes, 2021, 9, 1642 CrossRef CAS.
- A. Zakeri, E. Bahmani and A. S. R. Aghdam, Corros. Commun., 2022, 5, 25–38 CrossRef.
- J. Jomy, D. Prabhu and P. R. Prabhu, J. Bio- Tribo-Corros., 2022, 8(44) DOI:10.1007/s40735-022-00643-7.
- L. Xu, Y. Xin, L. Ma, H. Zhang, Z. Lin and X. Li, Corros. Commun., 2021, 2, 33–40 CrossRef.
- E. Y. Salawu, O. O. Awoyemi, O. E. Akerekan, S. A. Afolalu, J. F. Kayode, S. O. Ongbali, I. Airewa and B. M. Edun, E3S Web Conf., 2023, 430, 01226 CrossRef.
- M. Sheydaei, Surfaces, 2024, 7, 380–403 CrossRef CAS.
- H. A. Abdullah, R. A. Anaee, A. A. Khadom, A. T. Abd Ali, A. H. Malik and M. M. Kadhim, Results Chem., 2023, 6, 101035 CrossRef CAS.
- E. Baran, A. Cakir and B. Yazici, Arabian J. Chem., 2019, 12, 4303–4319 CrossRef CAS.
- O. Boussalem, Y. El Bouazzaoui, A. Habsaoui, A. El Amri, D. Mhanni, G. Doumane, N. Dkhireche and M. Ebn Touhami, Chem. Data Collect., 2023, 48, 101084 CrossRef CAS.
- C. Liu, Y. Liu, Z. Xia, Z. Wang and B. Wu, J. Build. Eng., 2024, 82, 108194 CrossRef.
- S. Rached, A. Habsaoui, K. Mzioud, R. Lachhab, S. Haida, N. Errahmany, M. Galai and M. E. Touhami, Chem. Data Collect., 2023, 48, 101099 CrossRef CAS.
- K. Hjouji, E. Ech-chihbi, I. Atemni, M. Ouakki, T. Ainane, M. Taleb and Z. Rais, Sustainable Chem. Pharm., 2023, 34, 101170 CrossRef CAS.
- S. Roshanak, M. Rahimmalek and S. A. H. Goli, J. Food Sci. Technol., 2016, 53, 721–729 CrossRef CAS.
- J. Redfern, M. Kinninmonth, D. Burdass and J. Verran, J. Microbiol. Biol. Educ., 2014, 15, 45–46 CrossRef PubMed.
- Y. Wang, X. Yao and R. Parthasarathy, J. Biomed. Mater. Res., Part A, 2009, 91, 251–262 CrossRef PubMed.
- A. Bouzana, Z. Chekroud, I. Becheker, N. Sakhraoui, B. Nawal and C. Bensouici, Global NEST J., 2023, 25(7), 113–119 CAS.
- H. M. K. Bashar, A. S. Juraimi, M. S. Ahmad-Hamdani, M. K. Uddin, N. Asib, M. P. Anwar, F. Rahaman, S. R. Karim, M. A. Haque, Z. Berahim, N. A. N. Mustapha and A. Hossain, Plants, 2022, 11, 3209 CrossRef CAS PubMed.
- R. Maizia, A. Zaabar, A. Djermoune, D. Amoura, S. Martemianov, A. Thomas, A. A. Alrashdi, L. Makhloufi, H. Lgaz, A. Dib, M. Chafiq and Y. G. Ko, Arabian J. Chem., 2023, 16, 104988 CrossRef CAS.
- K. Chefira, R. Nmila, T. Benabbouha, M. Siniti, H. Rchid and H. E. Attari, J. Fail. Anal. Prev., 2021, 21, 1683–1696 CrossRef.
- L. Cui, X. Gao, M. Hang and T. Chen, Appl. Sci., 2023, 13, 4446 CrossRef CAS.
- A. Zaabar, R. Aitout, L. Makhloufi, K. Belhamel and B. Saidani, Pigm. Resin Technol., 2014, 43, 127–138 CrossRef CAS.
- M. Lebrini, G. Fontaine, L. Gengembre, M. Traisnel, O. Lerasle and N. Genet, Corros. Sci., 2009, 51, 1201–1206 CrossRef CAS.
- B. N. Subedi, K. Amgain, S. Joshi and J. Bhattarai, Int. J. Corros. Scale Inhib., 2019, 8(3), 744–759 CAS.
- A. Dehghani and B. Ramezanzadeh, Ind. Crops Prod., 2023, 193, 116183 CrossRef CAS.
- B. Tüzün, Turk. Comput. Theor. Chem., 2018, 2(1), 12–22 Search PubMed.
- N. Sait, N. Aliouane, N. Ait Ahmed, L. Toukal and M. Al-Noaimi, J. Adhes. Sci. Technol., 2022, 36, 109–133 CrossRef CAS.
- M. S. Masoud, A. E. Ali, M. A. Shaker and G. S. Elasala, Spectrochim. Acta, Part A, 2012, 90, 93–108 CrossRef CAS.
- A. Benchikh, S. Belkacemi, R. Maizia, K. Mezian, L. Makhloufi and B. Saidani, J. Mol. Struct., 2023, 1274, 134562 CrossRef CAS.
- S. P. Palanisamy, G. Maheswaran, A. G. Selvarani, C. Kamal and G. Venkatesh, J. Build. Eng., 2018, 19, 376–383 CrossRef.
- X. An, J. Dai, S. Wang and W. Zou, Int. J. Electrochem. Sci., 2024, 19, 100677 CrossRef CAS.
- E. F. Sodiya and F. A. Dawodu, Int. Rev. Appl. Sci. Eng., 2023, 32, 1–10 Search PubMed.
- A. Aberoumand and S. S. Deokule, Pak. J. Nutr., 2008, 7, 582–585 CrossRef CAS.
- L. S. Pillai and B. R. Nair, J. Pharmacogn. Phytochem., 2014, 2, 120–124 Search PubMed.
- A. J. Silva, J. R. Silva, N. C. De Souza and P. C. S. Souto, Mater. Lett., 2014, 116, 235–238 CrossRef CAS.
- A. H. Al-Moubaraki, Anti-Corros. Methods Mater., 2018, 65, 53–65 CrossRef CAS.
- B. Bazié, A. Hema, M. Koala, E. Palé, P. Duez and M. Nacro, J. Soc. Ouest-Afr. Chim., 2020, 31–40 Search PubMed.
- B. Tan, B. Xiang, S. Zhang, Y. Qiang, L. Xu, S. Chen and J. He, J. Colloid Interface Sci., 2021, 582, 918–931 CrossRef CAS PubMed.
- G. M. Al-Senani, S. I. Al-Saeedi and R. S. Al-Mufarij, J. Mater. Environ. Sci., 2016, 7(7), 2240–2251 CAS.
- M. A. Deyab, M. M. Osman, A. E. Elkholy and F. El-Taib Heakal, RSC Adv., 2017, 7, 45241–45251 RSC.
- R. Baboian, Corrosion Tests and Standards: Application and Interpretation, ASTM International, 2005 Search PubMed.
- A. Agi, R. Junin and A. Gbadamosi, Int. Nano Lett., 2018, 8, 49–77 CrossRef CAS.
- H. S. Gadow and M. Fakeeh, RSC Adv., 2022, 12, 8953–8986 RSC.
- N. Saxena, S. Kumar, M. K. Sharma and S. P. Mathur, Pol. J. Chem. Technol., 2013, 15, 61–67 CrossRef CAS.
- P. Roberge, Handbook of Corrosion Engineering, McGraw Hill Professional, 1999 Search PubMed.
- R. T. Loto, Rev. Colomb. Quim., 2017, 46, 20–32 CrossRef CAS.
- H.-M. Yang, Molecules, 2021, 26, 3473 CrossRef CAS PubMed.
- A. Raveendran, M. Chandran and R. Dhanusuraman, RSC Adv., 2023, 13, 3843–3876 RSC.
- X. Li, S. Deng and H. Fu, Corros. Sci., 2010, 52, 2786–2792 CrossRef CAS.
- L. Zhang, S. Wang, D.-I. Stroe, C. Zou, C. Fernandez and C. Yu, Energies, 2020, 13, 2057 CrossRef CAS.
- A. Sedik, D. Lerari, A. Salci, S. Athmani, K. Bachari, İ. H. Gecibesler and R. Solmaz, J. Taiwan Inst. Chem. Eng., 2020, 107, 189–200 CrossRef CAS.
- A. Fawzy, M. Abdallah, I. A. Zaafarany, S. A. Ahmed and I. I. Althagafi, J. Mol. Liq., 2018, 265, 276–291 CrossRef CAS.
- M. Boudalia, R. M. Fernández-Domene, L. Guo, S. Echihi, M. E. Belghiti, A. Zarrouk, A. Bellaouchou, A. Guenbour and J. García-Antón, Materials, 2023, 16, 678 CrossRef CAS.
- O. O. Ogunleye, A. O. Arinkoola, O. A. Eletta, O. O. Agbede, Y. A. Osho, A. F. Morakinyo and J. O. Hamed, Heliyon, 2020, 6, e03205 CrossRef CAS PubMed.
- A. I. Ndukwe, Zast. Mater., 2024, 65, 11–21 Search PubMed.
- B. Ran, Z. Wei, S. Yu, H. Zhi, S. Yan, S. Cai, L. Wen, B. Fan, J. Wang, K. Wang and X. Luo, Int. J. Electrochem. Sci., 2023, 18, 100032 CrossRef CAS.
- M. Mobin, M. Basik and J. Aslam, Measurement, 2019, 134, 595–605 CrossRef.
- N. Palaniappan, I. Cole, F. Caballero-Briones, S. Manickam, K. R. Justin Thomas and D. Santos, RSC Adv., 2020, 10, 5399–5411 RSC.
- I. Abdulazeez, M. Khaled and A. A. Al-Saadi, J. Mol. Struct., 2019, 1196, 348–355 CrossRef CAS.
- I. B. Obot and Z. M. Gasem, Corros. Sci., 2014, 83, 359–366 CrossRef CAS.
- Y. Yan, W. Li, L. Cai and B. Hou, Electrochim. Acta, 2008, 53, 5953–5960 CrossRef CAS.
- M. Raftani, T. Abram, N. Bennani and M. Bouachrine, Results Chem., 2020, 2, 100040 CrossRef CAS.
- Y. Huang, C. Rong, R. Zhang and S. Liu, J. Mol. Model., 2017, 23, 3 CrossRef PubMed.
- A. Chaouiki, M. Chafiq, A. H. Al-Moubaraki, M. Bakhouch, M. El Yazidi and Y. G. Ko, Arabian J. Chem., 2022, 15, 104323 CrossRef CAS.
- S. Kr. Saha, M. Murmu, N. C. Murmu, I. B. Obot and P. Banerjee, Surf. Interfaces, 2018, 10, 65–73 CrossRef CAS.
- A. Zarrouk, H. Zarrok, R. Salghi, B. Hammouti, F. Bentiss, R. Touir and M. Bouachrine, J. Mater. Environ. Sci., 2013, 4(2), 177–192 CAS.
- N. O. Obi-Egbedi, I. B. Obot, M. I. El-Khaiary, S. A. Umoren and E. E. Ebenso, Int. J. Electrochem. Sci., 2011, 6, 5649–5675 CrossRef CAS.
- N. Sait, N. Aliouane, L. Toukal, H. Hammache, M. Al-Noaimi, J. J. Helesbeux and O. Duval, J. Mol. Liq., 2021, 326, 115316 CrossRef CAS.
- M. Akrom, S. Rustad, A. G. Saputro and H. K. Dipojono, Comput. Theor. Chem., 2023, 1229, 114307 CrossRef CAS.
- S. P. Palanisamy, G. Maheswaran, C. Kamal and G. Venkatesh, Res. Chem. Intermed., 2016, 42, 7823–7840 CrossRef CAS.
- G. Venkatesh, C. Kamal, P. Vennila, S. Kaya, M. G. L. Annaamalai and B. E. Ibrahimi, Appl. Surf. Sci. Adv., 2022, 12, 100328 CrossRef.
- K. Gholivand, L. Sarmadi-Babaee, M. Faraghi, F. Badalkhani-Khamseh and N. Fallah, Chem. Phys. Impact, 2022, 5, 100099 CrossRef.
- B. D. Mert, M. Erman Mert, G. Kardaş and B. Yazıcı, Corros. Sci., 2011, 53, 4265–4272 CrossRef CAS.
- H. Cen, Z. Chen and X. Guo, J. Taiwan Inst. Chem. Eng., 2019, 99, 224–238 CrossRef CAS.
- I. Lukovits, E. Kálmán and F. Zucchi, Corrosion, 2001, 57, 3–8 CrossRef CAS.
- V. S. Sastri and J. R. Perumareddi, Corrosion, 1997, 53, 617–622 CrossRef CAS.
- A. H. Radhi, NeuroQuantology, 2020, 18, 37–45 Search PubMed.
- Q. A. Jawad, A. Q. Hameed, M. K. Abood, A. A. Al-Amiery, L. M. Shaker, A. A. H. Kadhum and M. S. Takriff, Int. J. Corros. Scale Inhib., 2020, 9(2), 688–705 CAS.
- L. Yang, J. Wu, J. Zou and M. Zhou, E3S Web Conf., 2019, 118, 04041 CrossRef CAS.
- C. A. Loto, R. T. Loto and A. P. I. Popoola, Int. J. Phys. Sci., 2011, 6, 3616–3623 Search PubMed.
- G. Moretti, F. Guidi and F. Fabris, Corros. Sci., 2013, 76, 206–218 CrossRef CAS.
- Z. Zhang, N. Tian, L. Zhang and L. Wu, Corros. Sci., 2015, 98, 438–449 CrossRef CAS.
- Y. Qiang, L. Guo, S. Zhang, W. Li, S. Yu and J. Tan, Sci. Rep., 2016, 6, 33305 CrossRef CAS.
- Z. Zhang, N. C. Tian, X. D. Huang, W. Shang and L. Wu, RSC Adv., 2016, 6, 22250–22268 RSC.
- M. Franco, H. Herrera-Hernández, I. García-Orozco and P. Herrasti, Rev. Metal., 2018, 54, 128 CrossRef.
- A. Berisha, F. I. Podvorica and R. Vataj, Port. Electrochim. Acta, 2021, 39, 393–401 CrossRef CAS.
| This journal is © The Royal Society of Chemistry 2024 |