DOI:
10.1039/D4RA06415A
(Paper)
RSC Adv., 2024,
14, 31057-31071
Fabrication of poly (quinine-co-itaconic acid) incorporated reduced graphene oxide nanocomposite and its application for electrochemical sensing and photocatalysis of hydroquinone†
Received
5th September 2024
, Accepted 23rd September 2024
First published on 30th September 2024
Abstract
In this work, we report the synthesis of poly (quinine-co-itaconic acid) incorporated graphene oxide composite that is electro-active and photo-active simultaneously. The poly (quinine-co-itaconic acid)@rGO composite was successfully utilized for electrochemical detection and photocatalytic degradation of hydroquinone (HQ). HQ is recognized as an environmental pollutant because of its high toxicity to human health even at low concentrations. The synthesized composite was characterized using different characterization techniques i.e. Fourier Transform Infrared Spectroscopy (FTIR), Energy Dispersive X-ray Spectroscopy (EDX), Scanning Electron Microscopy (SEM), X-ray Diffractometry (XRD), Brunauer–Emmett–Teller (BET) and zeta potential. The characterization studies revealed the net negative surface charge of −17.6 mV for poly (quinine-co-itaconic acid)@rGO composite that confirms its stability. Moreover, the XRD and FTIR studies confirmed the fabrication of poly (quinine-co-itaconic acid)@rGO composite. The electrochemical properties of synthesized composite were determined via cyclic voltammetry and electrochemical impedance spectroscopy which showed high conductivity and charge transfer kinetics. Under optimized condition, the sensor showed excellent response for hydroquinone i.e. potential window from −0.6 to 0.6 V at scan rate 50 mV s−1 and borate buffer of pH 8 as supporting electrolyte. The developed method was comprehensively validated and found linear between 0.1 to 40 μM of HQ, with limit of detection 0.03 μM and limit of quantification 0.1 μM, respectively. The real water and personal care products samples were used to check the applicability of developed sensor and good percent recovery was achieved. The synthesized poly (quinine-co-itaconic acid)@rGO composite was also utilized for photocatalytic degradation of HQ and the degradation efficiency was obtained as 99% with dosage of 0.5 g L−1 under optimized conditions such as solution pH 7, initial concentration of HQ 10 mg L−1, catalyst dosage of 5 mg and irradiation time of 40 min, respectively. The degradation efficiency of poly (quinine-co-itaconic acid)@rGO composite was also evaluated in real water samples from industry and river.
Introduction
Nanocomposites are composed of multiple phases where one of the phases has dimension of one, two or three nanometers.1 Graphene based nanocomposites are gaining attention due to their practical applications in the fields of energy and simultaneous environmental monitoring and remediation. The graphene and derivatives of graphene such as graphene oxide and reduced graphene oxide are widely used because of their, high surface area, excellent electrocatalytic activity for electro-active species and electrical properties.2 Graphene is transparent and appropriate for particular optoelectronic applications as it absorbs 2.3% of light over a wide range of wavelength per layer.3 For memory applications, graphene oxide has been known as an excellent choice for charge trapping layer. By varying the oxidation level the band gap of GO can be tuned. Partially oxidized graphene oxide can serve as a semiconductor whereas completely oxidized graphene oxide can serve as an electrical insulator. Graphene oxide can be used as photocatalytic material because of its characteristic properties such as biocompatibility, tunable band gap, swift dispersion in water, exceptional optical activity,4 etc. Even though it has great applicability, the opto-electrical properties of graphene based composites can be further enhanced via modification with functional materials such as polymers, organic and inorganic compounds and metal/metal oxide nanoparticles.5,6 Guo, et al. developed silico molybdate/graphene/poly(3,4-ethylenedioxythiophene) nanocomposites for detection of persulfate with the linear dynamic range between 1.5 to 132 μM, and limit of detection of 0.48 μM.7 Guo, et al. reported polyoxometalate/chitosan-based electrochemically active rGO composite for determination of persulfate with the linear range of 0.67 to 30.62 μM and LOD of 0.05 μM.8 Tan et al. fabricated molecular imprinted polypyrrole/graphene quantum dots for the determination of bisphenol A with linear range of 0.1 to 50 μM and LOD of 0.04 μM.9 Chen et al. also reported rGO based electrochemical sensor for the determination of sulfamethoxazole with the dynamic linear range of 0.5–50 μM and the LOD of 0.04 μM.10 A NiO–CuO–rGO photocatalyst was reported by Sree et al. for the degradation of Brilliant Green (BG). They obtained 91% degradation of BG in 60 min using NiO–CuO–rGO photocatalyst.11 Similarly, ZnO–NiO/rGO photocatalyst was reported for the degradation of methylene blue and benzimidazole under sun light and the maximum degradation of methylene blue and benzimidazole was achieved as 89% and 51%, respectively in 60 min.12 Zhao et al. synthesized ZrO2–GO–SiO2 photocatalyst for the degradation of Gallic acid using visible light and obtained maximum degradation of 66.40% in 180 min.13 The Au/TiO2/rGO photocatalyst is also reported for the degradation of hydroquinone using UV-vis light. The maximum degradation of hydroquinone was achieved as ≈77% and ≈90% in 60 min under visible light and UV light, respectively.14 Hydroquinone (1,4-benzenediol), (HQ) is broadly utilized in the manufacturing of cosmetics and pharmaceuticals.15 Generally, it is utilized for lightening of skin colour in skin whitening cosmetics and medicines. The skin hyperpigmentation disorder is also treated with HQ products as HQ slows down the tyrosinase enzyme's reaction for the formation of melanin which in turn helps in depigmentation of the skin.16 Its prolong use leads to white spots formation on the face, skin disease, redness and skin irritation. It can cause permanent changes inside the skin tissues including bluish black blemishes.17 Many researchers have revealed that HQ may harm DNA which can lead to cancer.18 For hyperpigmentation treatment such as freckles, melasma, senile lentigines and chloasma, a clinical preparation containing 2–4% HQ is recommended.16 The United States allows only 2% in cosmetics while EU has prohibited the utilization of HQ as a component in cosmetics.19 It is also used in numerous industrial products such as photo-stabilizers, antioxidants, dyes, pesticides and plastics. The HQ is recognized as environmental contaminant because it is very harmful to human beings even at very low concentration.20 Therefore, the trace level determination as well as degradation of HQ is urgently needed. The tuned functionalities of modified and reduced graphene oxide (rGO) define its electro-activity or opto-activity. To date several rGO based materials have been reported that are either electrochemically active or optically active. For instance, Liu et al. developed MnOx/rGO nanocomposites for detection of HQ with the linear range of 0.5 to 200 μM and the LOD was found as 0.049 μM.21 Similarly, Wang et al. fabricated ITO/APTES/r-GO@Au electrode for determination of HQ with linear dynamic range of 40–150 μM and LOD of 1.95 μM.22 Duekhuntod et al. also developed graphene modified carbon paste sensor for the determination of hydroquinone with linear dynamic range between 100 μM to 5000 μM and LOD of 70 μM.23 Du et al. reported 3DFG/GCE for the determination of HQ with linear dynamic range of 0.31 to 13.1 μM and LOD of 0.09 μM.24 Geng et al. has synthesized TiO2/AC composite for the photocatalytic degradation of HQ under UV light and achieved 80% degradation efficiency of the material.25 However, these sensing and catalytic materials showed low sensitivity and low photocatalytic degradation efficiency for HQ. Moreover, the reported materials were either electrochemically active or optically active and could be utilized for sensing or degradation of HQ at a time.
Keeping the extraordinary optical and electrochemical properties of GO in mind, a composite of GO with poly (quinine-co-itaconic acid) was designed in this study that could possess tuned optical and electrochemical properties simultaneously. There is desperate need to develop multi-tasking materials. When it comes to the environment, there is an urgent need to develop cost effective strategies that can monitor as well as remediate the environment at the same time. Therefore, it is worth mentioning that the synthesized material presented in this work can be effectively utilized to electrochemically sense HQ and efficiently degrade it photo catalytically. Hence, it can work as heterogeneous photocatalytic material as well as electrochemical sensing material.
Experimental
Reagents and solutions
Sodium nitrate (NaNO3), hydrogen peroxide 35% (H2O2), sodium hydroxide (NaOH), sodium phosphate monobasic dehydrate (NaH2PO4·H2O), di-sodium hydrogen phosphate anhydrous (Na2HPO4), boric acid (H3BO3), sodium tetraborate (Na2B4O7), acetic acid (CH3COOH), phosphoric acid (H3PO4), graphite flakes (<20 μm) and sodium acetate (CH3COONa) were bought from Sigma Aldrich Darmstadt, Germany; sulphuric acid (H2SO4) was bought from Scharlab S. L., Spain; potassium permanganate (KMnO4) was obtained from Merck, China; hydrochloric acid (HCl) was obtained from Duksan pure chemicals Korea; hydroquinone (C6H6O2), itaconic acid (C5H6O4), quinine (C20H24N2O2), acetonitrile (C2H3N), azobisisobutyronitrile (C8H12N4), potassium chloride (KCl), potassium hexaferrocynide (C6FeK4N6) were bought from Merck Germany. Hydroquinone 0.1 M solution was prepared in D.I water and diluted to desired concentration before electrochemical measurement. 0.1 M borate buffer of pH 8 was utilized as supporting electrolyte for electrochemical sensing. For photocatalytic degradation purpose pH of D.I water was adjusted via 0.1 M sodium hydroxide and hydrochloric acid. All glassware were washed and rinsed with D.I water before use.
Instrumentation
Functionalities of the materials were analyzed using FITR spectroscopy with Thermo Nicolet model 5700 FTIR spectrophotometer. The composition of element in the material was analyzed via energy dispersive X-ray spectroscopy. XRD (700-Shimadzu) was used to study XRD pattern of materials. Scanning electron microscopy model JSM-7800, JEOL, JAPAN was used to determine the surface morphology of synthesized materials. BET (AutosorbeiQ S/N: 14716090801station; 1) was used to analyze the surface area, porosity and pore diameter. The specific surface area was calculated by Brunauer–Emmet–Teller method whereas the pore diameter was obtained by BJH method. The net surface charge of the synthesized materials was determined by Zeta Potential analyzer (Bruker, NanoBrook Omni). Electrochemical characterization was carried using Auto-Lab CHI-760-USA in which three electrodes system was used. The electrodes system was comprised of glassy carbon electrode, Ag/AgCl and platinum wire as working, reference and counter electrode, respectively for electrochemical detection of hydroquinone. Photocatalytic degradation of hydroquinone was performed on a UV-visible spectrophotometer (Lamda-35, PerkinElmer, USA).
Synthesis of poly (quinine-co-itaconic acid)@rGO nanocomposite
Modified hummer's method was used to synthesize graphene oxide.26 Synthesized GO was intercalated with quinine. Precisely, 100 mg of graphene oxide was dispersed into 10 mL of D.I water via ultra-sonication for 30 min. The intercalation of quinine into the GO layers was performed by adding 300 mg of quinine in 25 mL of ethanol, and then quinine solution was added to the dispersion of graphene oxide. The mixture was sonicated for 4 h for proper intercalation then washed with D.I water using centrifuge machine to remove excess of quinine. The quinine intercalated graphene oxide composite was dried at ambient temperature. For copolymerization, 100 mg of quinine intercalated graphene oxide (Quinine Int. GO) was dispersed into 5 mL of acetonitrile. The copolymerization was done by mixing 130 mg of itaconic acid in 5 mL acetonitrile and 1 mg of azobisisobutyronitrile (initiator) in 1 mL ethanol into the Quinine Int. GO suspension and mixture was heated at 60 °C for 24 h under continuous stirring. The successfully synthesized poly (quinine-co-itaconic acid)@rGO was washed with (1![[thin space (1/6-em)]](https://www.rsc.org/images/entities/char_2009.gif) :
:![[thin space (1/6-em)]](https://www.rsc.org/images/entities/char_2009.gif) 3) acetic acid and methanol and then again washed using D.I water and dried at ambient temperature (Fig. 1).
3) acetic acid and methanol and then again washed using D.I water and dried at ambient temperature (Fig. 1).
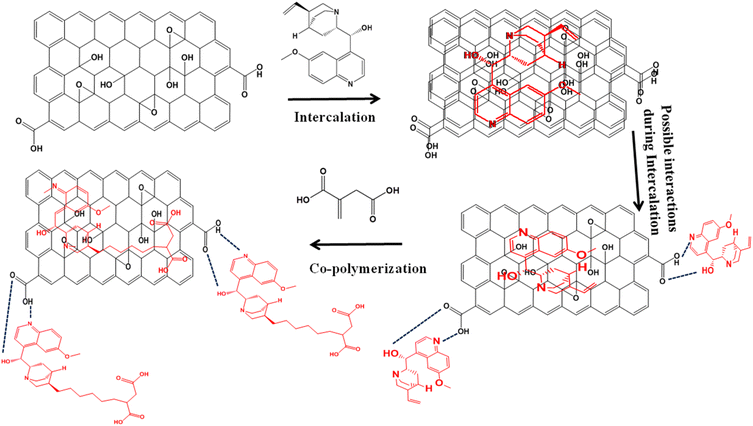 |
| | Fig. 1 Schematic diagram for the synthesis of poly (quinine-co-itaconic acid)@rGO. | |
Modification of glassy carbon electrode for the electrochemical detection of HQ
The electrode modification was carried out via drop casting method. 10 mg of poly(quinine-co-itaconic acid)@rGO composite was dispersed into 2.5 mL D.I water by adding 5 μL of 5% Nafion as binder and sonicated for 20 min. Before modification, the surface of GCE was polished with aluminum powder (0.5 μm pores), washed by D.I water and sonicated in ethanol for 20 min for the removal of impurity on the surface of electrode. Afterwards, 7 μL of prepared suspension of poly (quinine-co-itaconic acid)@rGO was dropped on the glassy carbon electrode's surface and dried at ambient temperature. The successfully fabricated poly (quinine-co-itaconic acid)@rGO/GCE was employed to conduct electrochemical test for the detection of HQ.
Preparation of real samples for electrochemical detection of HQ
Preparation of water samples. The water samples were obtained from three distinct sources. Industrial wastewater and river water were collected from industrial area of Jamshoro and River Indus Jamshoro, Sindh, Pakistan, respectively while the tap water was obtained from National Centre of Excellence in Analytical Chemistry, University of Sindh, Jamshoro, Sindh, Pakistan. The samples were filtered using Whatman filter paper. The pH of samples was adjusted using 0.1 M borate buffer before analysis.
Preparation of samples of whitening cream. The commercially available samples of whitening creams were obtained from cosmetic shops and retail stores of Hyderabad, Sindh, Pakistan. Precisely, 0.5 g of whitening cream sample was added into 100 mL of deionized water and stirred for 10 min vigorously, and then the solution was sonicated for 30 min at 50 °C using ultrasonication, and centrifuged for 20 min at 5000 rpm. The samples were then filtered by cellulose acetate filter paper (0.45 μm). The filtrate of all creams was diluted using borate buffer of pH 8 before electrochemical measurements.
Photocatalytic degradation of HQ in presence of poly (quinine-co-itaconic acid)@rGO composite photocatalyst
The photocatalytic performance of poly (quinine-co-itaconic acid)@rGO composite was investigated for catalytic degradation of HQ under UV light. Precisely, 5 mg of poly (quinine-co-itaconic acid)@rGO composite was dispersed in 2 mL D.I water via ultra-sonication for half an hour then 10 ppm solution of HQ was added and suspension was kept in dark to establish the adsorption–desorption equilibrium. Finally, the mixture was placed under UV lamp (UVA light λ 315–400 nm) for UV light irradiation. At regular intervals, a small aliquot of solution was taken and filtered using syringe filter. The filtrate was analyzed using UV-vis spectrophotometer to record spectra of standard solution before and after degradation. The percent degradation of HQ was calculated by following equation.| |
 | (1) |
where Cf is the concentration at a given interval of time and Ci is the initial concentration of HQ. Different parameters were optimized such as pH (2 to 12), degradation time (5–50 min), catalyst dosage (1 to 7 mg) and initial concentration of HQ (10 to 100 mg L−1), etc. The pH of solution was adjusted using 0.1 M NaOH and HCl.
Preparation of real samples for photocatalytic degradation of HQ
The real water samples were filtered using Whatman filter paper and spiked to obtain different concentrations of HQ (10, 30, 50 mg L−1). The samples were then subjected to UV-irradiation for photocatalytic degradation of HQ in the presence of poly (quinine-co-itaconic acid)@rGO. The initial (before degradation) and final (after degradation) concentrations of samples were analyzed via UV-vis spectrophotometer as described previously.
Results and discussion
Synthesis of poly (quinine-co-itaconic acid)@rGO composite
This study reports the novel poly (quinine-co-itaconic acid)@rGO composite that shows excellent electrochemical sensitivity, selectivity and photocatalytic degradation towards hydroquinone in real samples. For this purpose GO was first intercalated with quinine, i.e. highly fluorescent in nature. Quinine is photo-stable and highly resistant to oxygen quenching, it is used as a standard for measuring quantum yields. Numerous quinine containing polymers have been prepared mainly as supported catalysts.27 Quinine was selected as it can easily be intercalated into the layers of graphene oxide via hydrogen bonding and its vinyl functionality can easily facilitate the polymerization with the copolymer such as itaconic acid. Itaconic acid is an unsaturated dicarbonic organic acid with one carboxyl group conjugated to the methylene group. It can readily copolymerize with quinine and offer polymer chains with carboxylic side groups, which are capable of forming hydrogen bonds with corresponding groups and are highly hydrophilic.28 Therefore, poly (quinine-co-itaconic acid)@rGO composite offers high photocatalytic degradation ability with excellent electrochemical activity and fast electron transfer in electrochemical sensing with modified glassy carbon electrode due to the synergistic effects of copolymer of quinine and itaconic acid into the layers of GO resulting in the poly (quinine-co-itaconic acid)@rGO composite.
FTIR study
The functionalities of synthesize material were confirmed by FTIR study. The FTIR spectra of GO is illustrated in Fig. 2, where the broad peak appeared at 3400 cm−1 due to the –OH stretching vibrations. The –C–H stretching vibration appeared at 2900 cm−1 and C![[double bond, length as m-dash]](https://www.rsc.org/images/entities/char_e001.gif) O from carboxylic acid functionality appeared at 1700 cm−1. The –C
O from carboxylic acid functionality appeared at 1700 cm−1. The –C![[double bond, length as m-dash]](https://www.rsc.org/images/entities/char_e001.gif) C graphitic region peak was appeared at 1600 cm−1 while C–O epoxy group's bending vibration appeared at 1120 cm−1. The existence of oxygen functionalities suggested that graphene oxide had been synthesized successfully.29,30 The FTIR spectra of Quinine Int. GO composite is shown in Fig. 2, where –OH stretching vibrations appeared at 3149 cm−1 with increase in intensity and the carbonyl peak has been disappeared due to H-bonding between quinine and graphene oxide. The –C
C graphitic region peak was appeared at 1600 cm−1 while C–O epoxy group's bending vibration appeared at 1120 cm−1. The existence of oxygen functionalities suggested that graphene oxide had been synthesized successfully.29,30 The FTIR spectra of Quinine Int. GO composite is shown in Fig. 2, where –OH stretching vibrations appeared at 3149 cm−1 with increase in intensity and the carbonyl peak has been disappeared due to H-bonding between quinine and graphene oxide. The –C![[double bond, length as m-dash]](https://www.rsc.org/images/entities/char_e001.gif) C graphitic stretching vibrations appeared at 1620 cm−1 and C–O bending vibrations of epoxy group was found at 1024 cm−1. These peaks are slightly shifted with increase in intensities due to the intercalation of quinine with graphene oxide. However new peaks appeared at 1573 cm−1, 1364 cm−1 and 1239 cm−1 due to C
C graphitic stretching vibrations appeared at 1620 cm−1 and C–O bending vibrations of epoxy group was found at 1024 cm−1. These peaks are slightly shifted with increase in intensities due to the intercalation of quinine with graphene oxide. However new peaks appeared at 1573 cm−1, 1364 cm−1 and 1239 cm−1 due to C![[double bond, length as m-dash]](https://www.rsc.org/images/entities/char_e001.gif) C vinyl and C–N stretch of cyclic amine confirmed that GO has been intercalated with quinine successfully.31 Fig. 2 is the FTIR spectra of poly (quinine-co-itaconic acid)@rGO composite which shows similar peaks however, some of the peaks have been shifted with increased intensities. The carbonyl peak reappeared at 1710 cm−1 due to the presence of itaconic acid which confirmed that poly(quinine-co-itaconic acid)@rGO has been successfully synthesized.32 The detailed results and discussion of EDX studies are given in ESI.†
C vinyl and C–N stretch of cyclic amine confirmed that GO has been intercalated with quinine successfully.31 Fig. 2 is the FTIR spectra of poly (quinine-co-itaconic acid)@rGO composite which shows similar peaks however, some of the peaks have been shifted with increased intensities. The carbonyl peak reappeared at 1710 cm−1 due to the presence of itaconic acid which confirmed that poly(quinine-co-itaconic acid)@rGO has been successfully synthesized.32 The detailed results and discussion of EDX studies are given in ESI.†
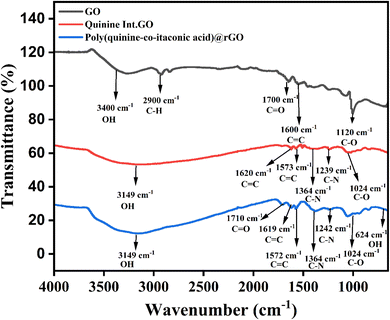 |
| | Fig. 2 FTIR spectra of GO, Quinine Int. GO composite and poly (quinine-co-itaconic acid)@rGO composite. | |
XRD analysis
The crystallographic structure of synthesized material was determined by XRD analysis. The XRD pattern of GO is shown in Fig. 3. The XRD pattern shows two diffraction peaks at 2θ 11.7° and 26° which were assigned to the reflection plane (001) and (002) with d-spacing of 0.75 nm and 0.33 nm as a result of the oxygenated and non-oxygenated sheets of graphene, respectively. These results confirmed that GO has been successfully synthesized.33 The d-spacing was calculated by Bragg's equation i.e. nλ = 2d![[thin space (1/6-em)]](https://www.rsc.org/images/entities/char_2009.gif) sin
sin![[thin space (1/6-em)]](https://www.rsc.org/images/entities/char_2009.gif) θ. The Fig. 3 is the XRD pattern of Quinine Int. GO composite in which peak at 2θ 11.7° had been disappeared and the new diffraction peaks appeared at 2θ 15°, 26°, 42°, 44° and 72° with reflection of (200), (002), (100), (101) and (104) having d-spacing of 0.56 nm, 0.34 nm, 0.21 nm, 0.2 nm and 0.13 nm indicating the intercalation of quinine with graphene oxide.34 Fig. 3 is the XRD pattern of poly (quinine-co-itaconic acid)@rGO composite which shows similar peaks at 2θ 15°, 26°, 42°, 44° and 72° with reflection of (200), (002), (100), (101) and (104) having d-spacing of 0.51 nm, 0.33 nm, 0.21 nm, 0.2 nm and 0.13 nm, however the intensities of these peaks decreases along with appearance of new peaks at 2θ 31°, 45° and 56° with reflection of (111), (012) and (210) having d-spacing 0.28 nm, 0.2 nm and 0.16 nm due to copolymerization of itaconic acid with quinine. These results confirmed the successful synthesis of poly (quinine-co-itaconic acid)@rGO composite.35 Hence, the XRD result has also confirms the interaction between itaconic acid and Quinine Int. GO nanosheets, which is in agreement with the results obtained from FTIR analysis.
θ. The Fig. 3 is the XRD pattern of Quinine Int. GO composite in which peak at 2θ 11.7° had been disappeared and the new diffraction peaks appeared at 2θ 15°, 26°, 42°, 44° and 72° with reflection of (200), (002), (100), (101) and (104) having d-spacing of 0.56 nm, 0.34 nm, 0.21 nm, 0.2 nm and 0.13 nm indicating the intercalation of quinine with graphene oxide.34 Fig. 3 is the XRD pattern of poly (quinine-co-itaconic acid)@rGO composite which shows similar peaks at 2θ 15°, 26°, 42°, 44° and 72° with reflection of (200), (002), (100), (101) and (104) having d-spacing of 0.51 nm, 0.33 nm, 0.21 nm, 0.2 nm and 0.13 nm, however the intensities of these peaks decreases along with appearance of new peaks at 2θ 31°, 45° and 56° with reflection of (111), (012) and (210) having d-spacing 0.28 nm, 0.2 nm and 0.16 nm due to copolymerization of itaconic acid with quinine. These results confirmed the successful synthesis of poly (quinine-co-itaconic acid)@rGO composite.35 Hence, the XRD result has also confirms the interaction between itaconic acid and Quinine Int. GO nanosheets, which is in agreement with the results obtained from FTIR analysis.
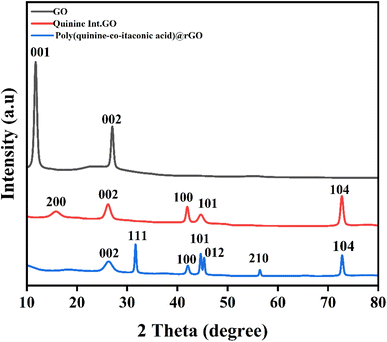 |
| | Fig. 3 XRD pattern of GO, Quinine Int. GO composite and poly (quinine-co-itaconic acid)@rGO composite. | |
Scanning electron microscopy analysis
The scanning electron microscopy analysis was utilized to determine the surface morphology of synthesize materials. The SEM image of GO is shown in Fig. 4(A and B) which shows wrinkle and dense surface with several stacked layers. The interlayer distance is markedly visible because of the oxygenated moieties.36–38 After intercalation change in morphology was observed in Quinine Int. GO (Fig. 4C and D), the resulting sheets are more exfoliated and thinner as compared to the sheets of GO which is obvious due to the intercalation of quinine. During the intercalation process the GO suspension is subjected to ultra-sonic irradiation; this rigorous process results in exfoliated GO with smaller dimensions and less number of stacked sheets.39 The Fig. 4(E and F) shows the SEM image of poly (quinine-co-itaconic acid)@rGO composite. It can be observed that the surface of poly (quinine-co-itaconic acid)@rGO composite is denser than the surface of Quinine Int. GO due to the presence of copolymer of quinine and itaconic acid on its surface.40–42
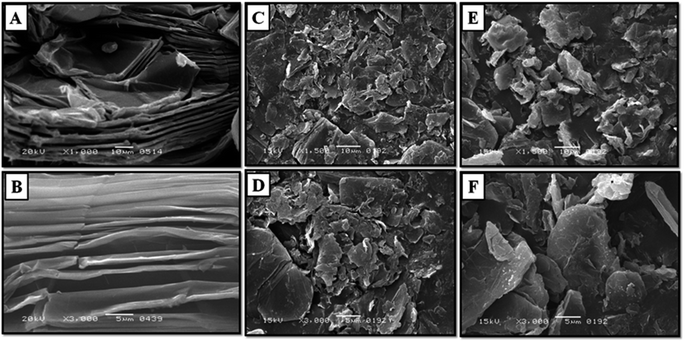 |
| | Fig. 4 High and low resolution SEM image of (A and B) GO, (C and D) Quinine Int. GO composite, (E and F) poly (quinine-co-itaconic acid)@rGO composite. | |
BET analysis
The specific surface area and porosity of the synthesize material was determined via BET. The BET and BJH adsorption isotherms of GO (Fig. S2A and A1†), Quinine Int. GO composite (Fig. S2B and B1†) and poly (quinine-co-itaconic acid)@rGO composite (C, C1) has been given in ESI Fig. S2.† The MBET specific surface area of graphene oxide was estimated as 1.5 m2 g−1 with the pore volume of 0.002 cc g−1 and pore diameter of 2 nm. Conversely, the MBET specific surface area of Quinine Int. GO composite has been increased to 8.6 m2 g−1 with pore volume of 0.064 cc g−1 and pore diameter of 2.2 nm due to the interaction of quinine with oxygen functionalities of graphene oxide. It is worth mentioning that the MBET specific surface area, pore volume and pore diameter decreased after copolymerization of itaconic acid with Quinine Int. GO i.e. 5.8 m2 g−1, 0.040 cc g−1 and 1.4 nm. The reduction in surface area gives direct evidence for grafting. Some pores of graphene sheets are blocked by grafting which make them inaccessible and creates a significant decrease of the cumulated surface area and a noticeable difference in the pore size distribution. The formation of polymer leads to decreased pore size. Moreover, all the isotherms are the type IV with H3 hysteresis loop.43,44 These pores increase the photocatalytic activity owing to the increasing photo-absorption efficiency and efficient diffusion of molecules. The detailed results and discussion of surface charge analysis and energy band gap of materials are given in ESI.†
Electrochemical detection of HQ
Electrochemical characterization of electrodes. In electrochemical characterization, cyclic voltammetry plays significant role to examine the conductive nature of electrodes. The conductive nature of bare GCE, GO/GCE and poly (quinine-co-itaconic acid)@rGO/GCE electrodes were investigated by immersing electrode into 0.1 M KCl and 5 mL solution of [K3Fe(CN)6 and K4Fe(CN)6] which were used as supporting electrolytes. In Fig. 5A, the poly (quinine-co-itaconic acid)@rGO/GCE electrode shows excellent redox peak current response as compared to bare/GCE and GO/GCE due excellent catalytic performance of fabricated sensor. The intercalation of quinine with GO removes some oxygen functionalities and copolymerizing with itaconic acid resulted in effective electrochemically active material which can be used for electrode modification to create extremely sensitive electrochemical sensor.45 Further, the conductive and resistive nature of electrode was confirmed by electrochemical impedance spectroscopy (EIS) (Fig. 5B). The electrochemical impedance spectroscopic measurement was carried out at quit time of 2 s, high frequency up to 100![[thin space (1/6-em)]](https://www.rsc.org/images/entities/char_2009.gif) 000 and low frequency upto 1 with initial potential of 1.5 V. The semicircle curve of Nyquist plot is usually monitored in electrochemical impedance spectroscopy. Narrow semicircle curve reveals the higher conductance and wide semicircle reflects the higher resistance. The broader semicircle was obtained for GO/GCE due to presence of oxygen containing functionalities on GO surface that reduce its conductivity.46 However, the smallest semicircle curve was observed at poly (quinine-co-itaconic acid)@rGO/GCE that confirmed the catalytic behavior of poly (quinine-co-itaconic acid)@rGO composite. All the Nyquist plots in EIS were circuit fitted. The Rct (charge transfer resistance) value of bare/GCE, GO/GCE and poly (quinine-co-itaconic acid)@rGO/GCE were measured as 630 Ω, 931 Ω and 473 Ω, respectively. The lowest Rct value was obtained for poly (quinine-co-itaconic acid)@rGO/GCE that signifies the lowest resistivity of modified electrode. It is worth mentioning that the copolymerization of itaconic acid with quinine on the surface of intercalated graphene oxide results in more efficient electrode materials as the resulting material is efficient and swift in electron transfer process because of electro-active properties of poly (itaconic acid). Furthermore, the polymerization process has also reduced GO into rGO which has increased the electron transfer ability of poly (quinine-co-itaconic acid)@rGO/GCE. The reduction of GO to rGO is evident from XRD studies as the peak at 2θ 11.7 due to oxidation in GO is diminished in the diffractogram of poly (quinine-co-itaconic acid)@rGO/GCE.39 The electrode active surface area was determined by Randles–Ševčík equation Ip (μA) = 2.69 × 10⁵ × n3/2AD1/2ν1/2C and the calculated values were 0.304 cm2 for poly (quinine-co-itaconic acid)@rGO/GCE, 0.213 cm2 for bare/GCE, and 0.044 cm2 for GO/GCE, respectively. The high current response, lower charge transfer resistance and more active surface area emphasizes the excellent performance of poly (quinine-co-itaconic acid)@rGO/GCE, making it a promising candidate for analyte determination in electrochemical sensing applications.47
000 and low frequency upto 1 with initial potential of 1.5 V. The semicircle curve of Nyquist plot is usually monitored in electrochemical impedance spectroscopy. Narrow semicircle curve reveals the higher conductance and wide semicircle reflects the higher resistance. The broader semicircle was obtained for GO/GCE due to presence of oxygen containing functionalities on GO surface that reduce its conductivity.46 However, the smallest semicircle curve was observed at poly (quinine-co-itaconic acid)@rGO/GCE that confirmed the catalytic behavior of poly (quinine-co-itaconic acid)@rGO composite. All the Nyquist plots in EIS were circuit fitted. The Rct (charge transfer resistance) value of bare/GCE, GO/GCE and poly (quinine-co-itaconic acid)@rGO/GCE were measured as 630 Ω, 931 Ω and 473 Ω, respectively. The lowest Rct value was obtained for poly (quinine-co-itaconic acid)@rGO/GCE that signifies the lowest resistivity of modified electrode. It is worth mentioning that the copolymerization of itaconic acid with quinine on the surface of intercalated graphene oxide results in more efficient electrode materials as the resulting material is efficient and swift in electron transfer process because of electro-active properties of poly (itaconic acid). Furthermore, the polymerization process has also reduced GO into rGO which has increased the electron transfer ability of poly (quinine-co-itaconic acid)@rGO/GCE. The reduction of GO to rGO is evident from XRD studies as the peak at 2θ 11.7 due to oxidation in GO is diminished in the diffractogram of poly (quinine-co-itaconic acid)@rGO/GCE.39 The electrode active surface area was determined by Randles–Ševčík equation Ip (μA) = 2.69 × 10⁵ × n3/2AD1/2ν1/2C and the calculated values were 0.304 cm2 for poly (quinine-co-itaconic acid)@rGO/GCE, 0.213 cm2 for bare/GCE, and 0.044 cm2 for GO/GCE, respectively. The high current response, lower charge transfer resistance and more active surface area emphasizes the excellent performance of poly (quinine-co-itaconic acid)@rGO/GCE, making it a promising candidate for analyte determination in electrochemical sensing applications.47
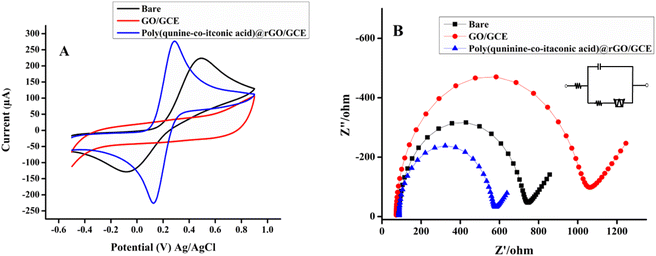 |
| | Fig. 5 (A) CV, (B) EIS response of bare/GCE, graphene oxide/GCE and poly (quinine-co-itaconic acid)@rGO/GCE. | |
Electrochemical detection of HQ at poly (quinine-co-itaconic acid)@ rGO/GCE. To investigate the efficiency of fabricated electrodes for HQ. The measurement of CV was performed in 10 μM HQ at the scan rate 50 mV s−1 in supporting electrolyte (borate buffer pH 8) under the potential window (−0.6 to 0.6 V vs. Ag/AgCl). All three electrodes displayed redox peak current response for HQ via removing the proton from HQ. However, poly (quinine-co-itaconic acid)@rGO/GCE shows highest redox peak current response than bare/GCE and GO/GCE (Fig. 6A). It clearly indicating the fast electron transfer kinetics of poly (quinine-co-itaconic acid)@rGO/GCE as the copolymerization on the surface of graphene offered a significant synergistic promotion with greater active surface area of electrode and presence of conducting graphene backbone accelerate electron transfer between HQ and electrode.48 The bare/GCE and GO/GCE shows low redox peak current response for HQ than poly(quinine-co-itaconic acid)@rGO/GCE, which reveals their limited conductive nature. The electrochemical reaction of HQ involved two protons and two electron process. The possible oxidation mechanism of HQ is given in Fig. 6B.
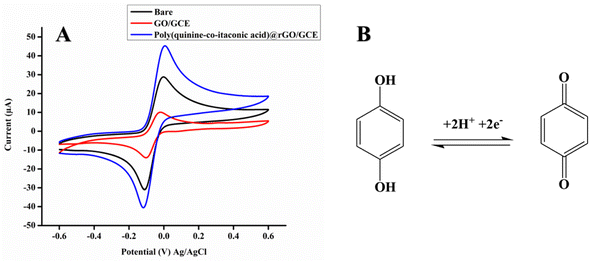 |
| | Fig. 6 (A) CV redox response of bare, GO/GCE and poly (quinine-co-itaconic acid)@rGO/GCE in 10 μM HQ at scan rate 50 mV s−1 in borate buffer of pH 8 and (B) possible mechanism for HQ at poly (quinine-co-itaconic acid)@rGO/GCE. | |
Effect of electrolyte medium and pH study
The supporting electrolytes and pH play an important role in electrochemical measurements. In the determination process of analyte, each supporting electrolyte has distinct impact. Supporting electrolytes usually offer a proper route to the analyte and the sensing probes to perform the electrochemical reactions.49 For this purpose, various supporting electrolytes have been examined such as britton robinson buffer (BRB) of pH 3, acetate buffer of pH 5, phosphate buffer saline (PBS) of pH 6 and pH 7, borate buffer of pH 8 and NaOH of pH 12 to achieve maximum redox response of HQ using poly (quinine-co-itaconic acid)@rGO/GCE. The electrolytic test of HQ was conducted in 10 μM HQ at scan rate of 50 mV s−1. The redox peak current response of HQ in various electrolytes has been given in ESI Fig. S5(A).† Among all supporting electrolytes the highest redox peak current response was obtained with borate buffer of pH 8 because it enabled the highest ions transfer at the surface of electrode. Thus, it was chosen as supporting medium and its pH was optimized in the range of 3 to 10. Fig. S5(B) has been given in ESI† shows the pH based current responses of HQ. The obtained results demonstrated that the peak potential transfers towards negative values with increasing the pH value, signifying that the protons are directly involved in the electrochemical redox process. The redox peak of HQ is continuously shifting towards negative potential with increasing pH from 3 to 10.48 The highest redox peak current response of HQ was obtained at pH 8. These results show that in the weak basic electrolytic solution HQ is able to dissociate readily into negatively charged HQ isomer; the negatively charged HQ isomer is unstable and can easily oxidize into benzoquinone hence leading to strong redox peak current response.20 The pH 8 was selected for further study.
Effect of scan rate
In the electrochemical measurement, the scan rate is used to investigate the reaction mechanism. It reveals whether the redox reaction taking place at the surface of the electrode is adsorption or diffusion-controlled process. The measurement of scan rate was performed in 10 μM HQ in borate buffer (pH 8). Fig. S6(A) has been given in ESI† shows the redox current response of HQ at various scan sweeps in the range of 10 to 100 mV s−1. The current response of analyte must be increased when scan sweeps increase. If it is not linear then it is evident that the ions from the electrolytic medium are getting attached on the electrode's surface. Generally, non-uniform and non-homogenous deposition of material on surface of electrode results in the sticking of ions.50 When the scan sweep increased the redox peak current response of HQ was increased linearly (Fig. S6B has been given in ESI†) suggesting that the movement of ions at poly (quinine-co-itaconic acid)@rGO/GCE is homogenous and uniform and the process is diffusion controlled. To examine the linearity, the redox peak current response was plotted. For both anodic and cathodic peak current responses, the regression equation was used to calculate R2 = 0.992 and the plot of regression equation of HQ is shown in (Fig. S6B has been given in ESI†).
Anti-interference behavior and stability of poly (quinine-co-itaconic acid)@rGO/GCE
The selectivity remains serious concern from several years in electrochemical sensors. The bare electrodes including carbon paste electrode, screen printed electrode and GCE usually encountered the selectivity problem. Nevertheless, this problem has been greatly resolved by the casting of recently fabricated highly sensitive, selective and conductive nanomaterials at the surface of electrodes. Here, to examine the selectivity of poly (quinine-co-itaconic acid)@rGO/GCE for HQ, various co-existing interferants such as catechol, bisphenol a, bisphenol S, arbutine, vitamin E, vitamin A, K+, Ca2+ and Mg2+ were added in 2-fold concentration of 20 μM of HQ at the scan rate of 50 mV s−1 (Fig. 7A). The interferants were selected by keeping in mind their possible presence in real samples. Ca2+, Mg2+ and K+ are major inorganic ions and presence of these ions did not show electrochemical response under the optimum conditions for the detection of HQ because these are not electrochemically active. While catechol, bisphenol A and bisphenol S due to their similar structure and chemical properties, are more probably to interfere with the electrochemical detection of hydroquinone. Under the optimized conditions for detection of HQ, the catechol, bisphenol A and bisphenol S did not show any electrochemical response. The arbutine, vitamin E, vitamin A also didn't interfere with the detection of hydroquinone. Among all the interferants, the poly (quinine-co-itaconic acid)@rGO/GCE exhibited excellent response only for HQ, signifying electrode stayed inactive for other interfering agent. The measured current responses for interferants revealed that the poly (quinine-co-itaconic acid)@rGO/GCE exhibited an excellent selectivity for HQ. However, the fabricated sensor stability is very significant issue. The proposed sensor must be stable sufficiently for prolonged use. To estimate stability, the proposed sensor was kept under examination for two weeks via monitoring the current response of HQ five times (n = 5) every day as shown in Fig. 7B. The RSD was calculated for the response of poly (quinine-co-itaconic acid)@rGO/GCE for HQ was 2.85 which is less than 5%. These results confirmed that fabricated sensor has promising stability for prolong time.
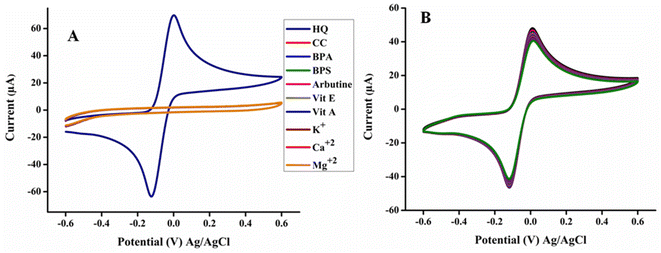 |
| | Fig. 7 (A) Anti-interference behavior of poly (quinine-co-itaconic acid)@rGO and (B) stability of poly (quinine-co-itaconic acid)@rGO. | |
Calibration measurement
For calibration measurement, the differential pulse voltammetry (DPV) mode was selected to investigate the linear range of proposed poly (quinine-co-itaconic acid)@rGO/GCE for HQ due its high sensitivity and better resolution than CV. The examination parameters of DPV were optimized as amplitude (V) 0.5, pulse width 50 m s−1, pulse period 0.5 s, quit time 2 s and sampling width of 0.0167 s, respectively. The linear dynamic range for HQ was found in the range of 0.1 to 40 μM and for all concentrations the current responses were examined carefully as revealed in Fig. 8A. By increasing concentrations of HQ the poly (quinine-co-itaconic acid)@rGO/GCE shows linear response. The regression equation was used to calculate the linearity of current responses of HQ and it was found as R2 = 0.9964 (Fig. 8B). Moreover, to examine the efficiency of poly (quinine-co-itaconic acid)@rGO/GCE for HQ, the limit of detection and limit of quantification were also determined. The limit of detection and limit of quantification for developed method were found as 0.03 μM and 0.1 μM. The limit of detection and linear dynamic range of present method was also compared with reported electro-chemical sensors. The current method was found more sensitive than reported studies in terms of sensitivity and limit of detection. These results signified the high specificity and efficiency of poly (quinine-co-itaconic acid)@rGO/GCE for HQ. The comparison of poly (quinine-co-itaconic acid)@rGO/GCE with reported sensing methods for HQ is given in Table 1.
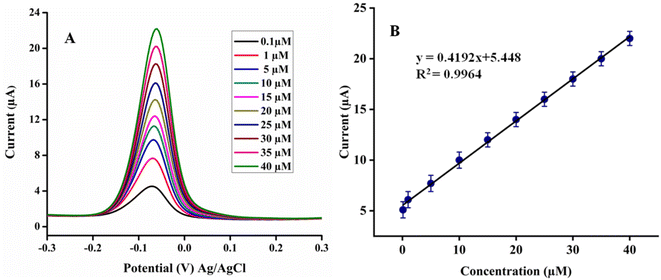 |
| | Fig. 8 (A) Calibration plot of HQ (B) plot of linear regression equation. | |
Table 1 Comparison of poly (quinine-co-itaconic acid)@rGO/GCE with reported sensors
| S.No. |
Sensors |
Techniques |
LDR (μM) |
LOD (μM) |
Reference |
| 1 |
3DFG/GCE |
CV, DPV |
0.31–13 |
0.9 |
24 |
| 2 |
AuNPs/Fe3O4–APTES–GO |
CV, DPV |
3–137 |
1.1 |
51 |
| 3 |
GR-TiO2/GCE |
CV, DPV |
0.5–100 |
0.082 |
52 |
| 4 |
Poly(RA)MGPE |
CV, DPV |
15–50 |
0.82 |
53 |
| 5 |
Ni/N–GO/GCE |
CV, DPV |
1.0–800 |
0.16 |
54 |
| 6 |
Poly (quinine-co-itaconic acid)@rGO |
CV, DPV |
0.1–40 |
0.03 |
Present work |
Analytical application
The ability of poly (quinine-co-itaconic acid)@rGO/GCE for HQ was examined in samples of water obtained from three distinct sources including river, industrial and tap water. Whitening cream samples were also collected from local market of Hyderabad. For analysis, standard addition method was applied and the samples were spiked with a known concentration of HQ. The % RSD and % recovery for all the samples were found within suitable ranges (Table 2).
Table 2 Analytical applicability of poly (quinine-co-itaconic acid)@rGO/GCE in water and personal care product samples
| Sample |
Added (μM) |
Detected (μM) |
RSD (%) |
Recovery (%) |
| Industrial water |
0 |
0 |
— |
— |
| 5 |
4.8 |
3.82 |
96 |
| 15 |
14.8 |
2.33 |
98.6 |
| 25 |
24.4 |
2.52 |
97.6 |
| River water |
0 |
0 |
— |
— |
| 5 |
4.6 |
2.85 |
92 |
| 15 |
14.3 |
2.81 |
95.3 |
| 25 |
24.1 |
3.58 |
96.4 |
| Cream 1 |
0 |
0 |
— |
— |
| 5 |
4.7 |
3.27 |
94 |
| 15 |
14.4 |
2.95 |
96 |
| 25 |
24.5 |
3.25 |
98 |
| Cream 2 |
0 |
0 |
— |
— |
| 5 |
4.9 |
3.53 |
98 |
| 15 |
14.2 |
2.31 |
94.6 |
| 25 |
24.7 |
3.23 |
98.8 |
| Cream 3 |
0 |
0 |
|
|
| 5 |
4.21 |
2.33 |
84.2 |
| 15 |
13.5 |
3.51 |
90 |
| 25 |
23 |
2.61 |
92 |
Photocatalytic degradation of HQ
Optimization of pH for photocatalytic degradation of HQ. A series of experiments were conducted by varying the pH in the range from 2 to 12 to examine the photocatalytic degradation of HQ (HQ concentration was 10 mg L−1 and catalyst dosage was 5 mg). Fig. S7(A) has been given in ESI† shows the decreased % degradation of HQ by poly (quinine-co-itaconic acid)@rGO composite in acidic medium, signifying that under acidic conditions the degradation of HQ by the photocatalyst is inhibited because it is more stable and generated p-benzoquinone can be reversed into HQ in the acidic medium.55 The % degradation also decreased when the pH values reached at strong basic conditions such as pH 12, which might be caused by the easy oxidation of HQ under strongly alkaline conditions.56 The maximum degradation (99%) of HQ was achieved at pH 7 which indicates that under neutral conditions HQ is more vulnerable to UV light in the presence of poly (quinine-co-itaconic acid)@rGO composite.
Time optimization for photocatalytic degradation of HQ. The effect of contact time on photocatalytic degradation efficiency of poly (quinine-co-itaconic acid)@rGO composite for HQ was optimized in the range of 5 to 50 min at pH 7 using 10 mg per L HQ and catalyst dosage of 5 mg. Fig. 9(A and B) clearly shows that when the reaction proceeded the photocatalytic degradation of HQ increased by increasing the contact time. The HQ absorbance demonstrates a progressive decrease at the characteristic peaks at 221 and 288 nm. The absorbance of characteristic peaks was almost zero when the reaction proceeded for about 40 min and then it attained equilibrium. The faster degradation of HQ up to 40 min is because of accessibility of numerous of actives sites in poly (quinine-co-itaconic acid)@rGO composite for photocatalytic degradation of HQ.57 The maximum % degradation of HQ obtained at 40 min was 99% so this time was selected for further study.
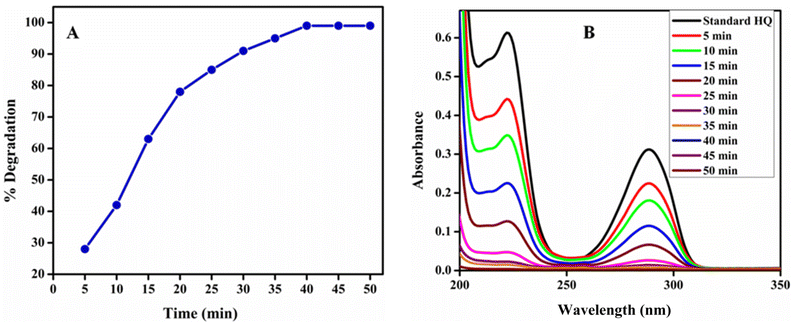 |
| | Fig. 9 (A) % Degradation of HQ at different time intervals and (B) UV-vis spectra of photocatalytic degradation of HQ at different time intervals. | |
Amount optimization of poly (quinine-co-itaconic acid)@rGO composite for photocatalytic degradation of HQ. Catalyst dose is one of important factor that influence the degradation efficiency and reflects the cost effectiveness of the method. The effect of amount of the poly (quinine-co-itaconic acid)@rGO composite material on the % degradation of HQ was investigated by adding catalyst in the range of 1 to 7 mg in HQ (10 mg L−1) at pH 7 for 40 min. Fig. 10 shows that with the increase in the catalyst amount, the photocatalytic degradation increased and then gradually reached maximum. When the amount of catalyst was 1 mg, the photocatalytic % degradation was 63%. Moreover, the maximum % degradation (99%) was achieved when the amount of catalyst reached at 5 mg. Further increase of catalyst amount did not show any significant change in degradation of HQ. The photocatalytic reaction of the catalyst shows that poly (quinine-co-itaconic acid)@rGO composite absorbs fewer photons when the amount of catalyst is less; therefore the photocatalytic activity is also less. The catalyst activity rises with amount of catalyst because more catalyst results in more active centers and photon absorption centers on the catalyst surface. However, the number of photons tends to be saturated as catalyst amount increases. Increased catalyst loading may cause a light blockage and influence the photocatalytic efficiency, and lead to catalyst waste.58 The maximum % degradation of HQ was obtained at 5 mg so it was selected for further study.
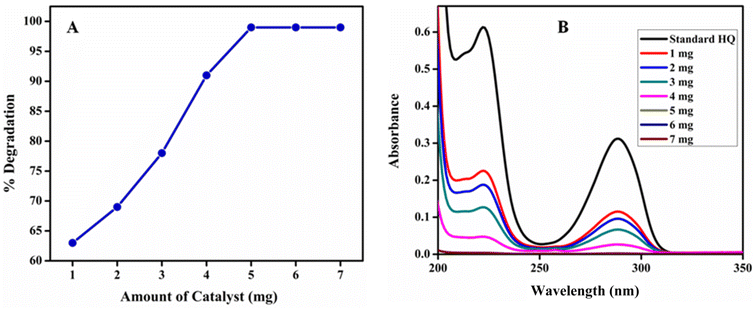 |
| | Fig. 10 (A) % Degradation of HQ at different amounts of catalyst and (B) UV-vis spectra of photocatalytic degradation of HQ at different amounts of catalyst. | |
Effect of initial concentration on photocatalytic degradation of HQ. The pollutants of HQ accessible in real wastewater are slowly rising due to the accelerated industrialization, and the HQ quantity fluctuates in various wastewaters. Thus, in the photocatalytic process, it is important to check the effect of HQ initial concentration on the photocatalytic efficiency of poly (quinine-co-itaconic acid)@rGO composite. The effects of photo degradation on various initial concentrations of HQ (10 to 100 mg L−1) were examined at pH 7, with 5 mg of poly (quinine-co-itaconic acid)@rGO composite catalyst used to carry 40 min photocatalytic reactions. Fig. 11 shows that photocatalytic efficiency of poly (quinine-co-itaconic acid)@rGO composite was gradually reduced with increasing the initial concentration of the HQ solution and maximum degradation of HQ was obtained at 10 mg L−1 i.e. 99%. When the HQ concentration was 100 mg L−1 the percent degradation was only 10%. These results can be explained as follows: (1) when the HQ initial concentration raises, the % degradation drops drastically. This is due to the substrate absorbs an excessive amount of light in the wavelength range that excites the catalyst, which may decrease the efficiency of catalyst (2) when the HQ initial concentration raises, the HQ amount adsorbed on the catalyst surface also raises, which inhibited the catalyst from absorbing photons to create electron–hole pairs, thus decreasing the % degradation; (3) the raise of the HQ concentration also improved the path length of the photons entering the HQ solution.59,60
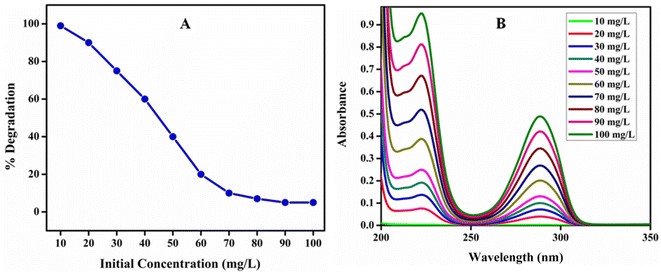 |
| | Fig. 11 (A) % Degradation at different concentration of HQ and (B) UV-vis spectra of photocatalytic degradation of HQ at different concentration. | |
Photocatalytic degradation kinetics. To carry the kinetic studies, eqn (2) was used to examine pseudo 1st order kinetic model61 while eqn (3) was used to examine pseudo 2nd order kinetic model.62| | |
log(qe − qt) = log(qe) − (k1t)/2.303
| (2) |
The amount of HQ adsorbed at equilibrium mg g−1 is qe and the amount adsorbed qt at time t, respectively, and k1 (min−1) signify the rate constant of pseudo 1st order kinetic model.
| |
 | (3) |
qe and
qt are the similar shown in
eqn (2) and
k is rate constant of pseudo 2nd order kinetic model.
The photocatalytic activity of poly (quinine-co-itaconic acid)@rGO composite for the degradation of HQ at optimum conditions was evaluated by comparing the respective rate constants from eqn (2) and (3). Fig. 12 (A and B) represents pseudo 1st order kinetics and pseudo 2nd order kinetics. Comparing the values of both R2 and K of pseudo 1st and pseudo 2nd order kinetics, the pseudo 2nd order fits well to an experimental data.63
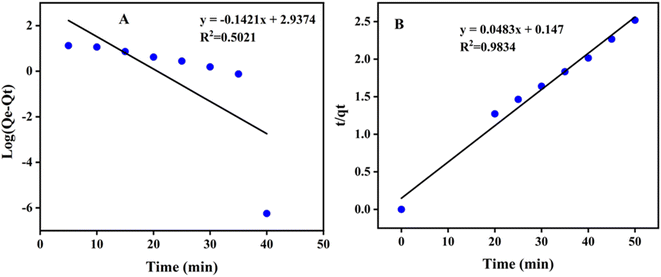 |
| | Fig. 12 (A) Pseudo first order model and (B) pseudo second order model for degradation of HQ. | |
Photocatalytic degradation mechanism. When the energy of light irradiation on poly (quinine-co-itaconic acid)@rGO is higher than the forbidden band then the electron from valence band excited to the conduction band, thus forming holes (h+) in the valence band and photogenerated electrons (e−) in the conduction band, further resulting in photogenerated electron–hole pairs. Combing with dissolved O2 superoxide anions ·O2− are formed by these electrons. The ·O2− radicals react with H2O molecules to formed ·OH reactive species. The holes can react with H2O molecules and produce hydroxyl radicals ·OH. The breakdown of HQ to the non-toxic products like CO2 and H2O is carried out by these active oxidizing species. HQ has high hydrophilicity and it an organic compound with two hydroxyl functional groups.64 The hydrogen–oxygen bond (O–H) will break when ·OH will attack the hydroxyl site of HQ. The p-hydroxyl group belongs to a double electron-absorbing group, which may increase the electron cloud density of the O–H bond.65 Therefore, the cleavage of O–H is induce by ·OH and recombines with hydrogen to form a more stable H2O. Afterward, the remaining structure reorganizes to produce a more stable compound (benzoquinone). Subsequently, due to the stability of the conjugated system, ·OH accumulates and attacks the carbonyl site, the benzene ring breaks to form a low-molecular-weight acid such as maleic acid. Finally, the fatty acid is further oxidized to H2O and CO2 under the continuous oxidation of ·OH. The schematic representation of photocatalytic degradation of HQ is given in Fig. 13.
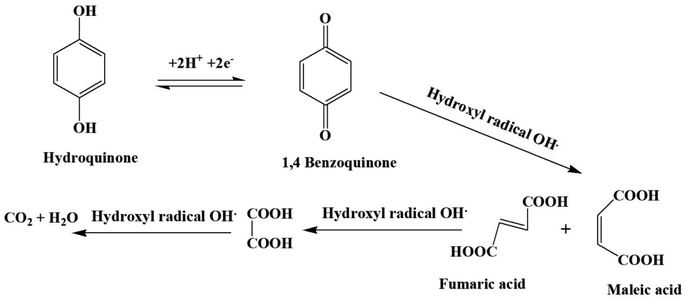 |
| | Fig. 13 Schematic representation of photocatalytic degradation of HQ. | |
Photocatalytic degradation of HQ in real water samples. The 10, 30 and 50 mg per L HQ solutions were prepared in industrial wastewater and river water samples at optimized pH and catalyst dosage. The % degradation of HQ using poly (quinine-co-itaconic acid)@rGO composite was examined. The Fig. 14 shows HQ degradation up to 92%, 73% and 67% in industrial wastewater while 95%, 83% and 72% in river water. The comparison of present work with the reported studies has been given in Table 3. The present work has high degradation efficiency as compared to the reported studies.
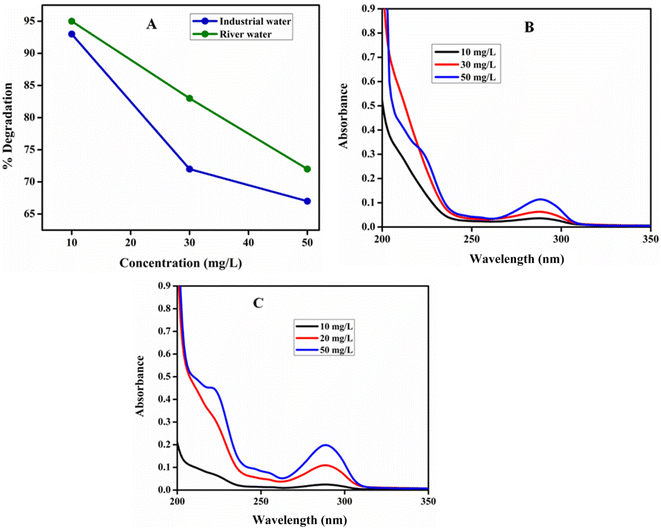 |
| | Fig. 14 (A) % Degradation HQ in water samples, (B) UV-vis spectra of photocatalytic degradation of HQ in industrial wastewater and (C) UV-vis spectra of photocatalytic degradation of HQ in river water. | |
Table 3 Comparison of degradation of HQ by poly (quinine-co-itaconic acid)@rGO composite with reported studies
| S.No. |
Catalyst |
Degradation efficiency (%) |
Conditions |
Reference |
| 1 |
Au/TiO2/RGO |
77% |
UV light source 1 h, 10 mg L−1, catalyst loading 10 mg |
14 |
| 2 |
CuS–MoS2 nanocomposite |
83% |
Sun light, 240 min, 0.01 M, pH 3, catalyst amount 500 mg L−1 |
66 |
| 3 |
Y–ZrO2–TiO2 |
96.58 |
UV lamp, 50 min, 10 mg L−1, pH 6.96, catalyst amount 1g L−1 |
56 |
| 4 |
MIP–ZrO2–TiO2 |
90.58% |
UV lamp, 30 min, 10 mg L−1, pH 6.91, catalyst amount 1 g L−1 |
67 |
| 5 |
Poly(quinine-co-itaconic acid)@rGO |
99% |
UV lamp, 40 min, 10 mg L−1, pH 7, catalyst amount 5 mg |
Present work |
Conclusion
Herein, poly (quinine-co-itaconic acid)@rGO composite was synthesized via intercalation of graphene oxide with quinine and then co-polymerization with itaconic acid. The dual responsive poly (quinine-co-itaconic acid)@rGO composite was successfully used for the selective and sensitive electrochemical detection and photocatalytic degradation of HQ. The poly (quinine-co-itaconic acid)@rGO composite was characterized by various analytical techniques, which confirmed that poly (quinine-co-itaconic acid)@rGO composite has been successfully synthesized. The fabricated composite was used as highly sensitive detection of HQ in the existence of various interferants. The limit of detection and limit of quantification of developed method for the detection of HQ were evaluated as 0.03 μM and 0.1 μM, respectively. The synthesized poly (quinine-co-itaconic acid)@rGO composite was examined in water samples including river, industrial, tap water and also in personal care products. The % recovery of real sample achieved in the acceptable range. The poly (quinine-co-itaconic acid)@rGO composite possessed outstanding photocatalytic efficiency i.e. 99% HQ degradation within 40 min was achieved under UV irradiation. The degradation efficiency of synthesized composite was checked in water samples including river and industrial wastewater. The results clearly show new possibility for the use of graphene-based heterogeneous systems for potential application of the environmental clean-up process.
Data availability
All the data related to the manuscript titled “Fabrication of poly (quinine-co-itaconic acid) incorporated graphene oxide nanocomposite and its application for electrocatalysis and photocatalysis of hydroquinone” is added in the manuscript.
Conflicts of interest
All the authors of this manuscript confirm that there is no conflict of interest.
References
- E. Omanović-Mikličanin, A. Badnjević, A. Kazlagić and M. Hajlovac, Health Technol., 2020, 10, 51–59 CrossRef.
- E.-M. Kirchner and T. Hirsch, Microchim. Acta, 2020, 187, 441 CrossRef CAS PubMed.
- H. Chang and H. Wu, Energy Environ. Sci., 2013, 6, 3483–3507 RSC.
- K. Krishnamoorthy, R. Mohan and S.-J. Kim, Appl. Phys. Lett., 2011, 98, 244101 CrossRef.
- A. T. Lawal, Biosens. Bioelectron., 2019, 141, 111384 CrossRef CAS PubMed.
- N. Zhang, Y. Zhang and Y.-J. Xu, Nanoscale, 2012, 4, 5792–5813 RSC.
- W. Guo, J. Ma, X. Cao, X. Tong, F. Liu and Y. Liu, Int. J. Electrochem. Sci., 2020, 15, 915–928 CrossRef CAS.
- W. Guo, X. Tong and S. Liu, Electrochim. Acta, 2015, 173, 540–550 CrossRef CAS.
- F. Tan, L. Cong, X. Li, Q. Zhao, H. Zhao, X. Quan and J. Chen, Sens. Actuators, B, 2016, 233, 599–606 CrossRef CAS.
- C. Chen, Y.-C. Chen, Y.-T. Hong, T.-W. Lee and J.-F. Huang, Chem. Eng. J., 2018, 352, 188–197 CrossRef CAS.
- G. S. Sree, S. M. Botsa, B. J. M. Reddy and K. V. B. Ranjitha, Arabian J. Chem., 2020, 13, 5137–5150 CrossRef CAS.
- S. Yousaf, S. Zulfiqar, M. I. Din, P. O. Agboola, M. F. A. Aboud, M. F. Warsi and I. Shakir, J. Mater. Res. Technol., 2021, 12, 999–1009 CrossRef CAS.
- J. Zhao, Z. Otgonbayar, K. N. Fatema, S. Sagadevan and W.-C. Oh, Surf. Interfaces, 2020, 20, 100613 CrossRef CAS.
- L. Zhao, H. Xu, B. Jiang and Y. Huang, Part. Part. Syst. Charact., 2017, 34, 1600323 CrossRef.
- S. Cotchim, K. Promsuwan, M. Dueramae, S. Duerama, A. Dueraning, P. Thavarungkul, P. Kanatharana and W. Limbut, J. Electrochem. Soc., 2020, 167, 155528 CrossRef.
- H. S. Elferjani, N. H. Ahmida and A. Ahmida, Int. J. Sci. Res., 2017, 6, 2219–2224 Search PubMed.
- H. Qi and C. Zhang, Electroanalysis, 2005, 17, 832–838 CrossRef CAS.
- C. Wei, Q. Huang, S. Hu, H. Zhang, W. Zhang, Z. Wang, M. Zhu, P. Dai and L. Huang, Electrochim. Acta, 2014, 149, 237–244 CrossRef CAS.
- S. Chuenjitt, A. Kongsuwan, C. H. Phua, J. Saichanapan, A. Soleh, K. Saisahas, K. Samoson, S. Wangchuk, K. Promsuwan and W. Limbut, Electrochim. Acta, 2022, 434, 141272 CrossRef CAS.
- H. Wang, R. Li and Z. Li, Electrochim. Acta, 2017, 255, 323–334 CrossRef CAS.
- G. Liu, J. Liu, P. Pan, Z. Wang, Z. Yang, J. Wei, P. Li, S. Cao, H. Shen and J. Zhou, Microchem. J., 2023, 185, 108234 CrossRef CAS.
- G. Wang, S. Zhang, Q. Wu, J. Zhu, S. Chen, Y. Lei, Y. Li, H. Yi, L. Chen and Z.-Q. Shi, RSC Adv., 2022, 12, 23762–23768 RSC.
- W. Duekhuntod, C. Karuwan, A. Tuantranont, D. Nacapricha and S. Teerasong, Int. J. Electrochem. Sci., 2019, 14, 7631–7642 CrossRef CAS.
- J. Du, L. Ma, D. Shan, Y. Fan, L. Zhang, L. Wang and X. Lu, J. Electroanal. Chem., 2014, 722, 38–45 CrossRef.
- Q. Geng, Q. Guo, C. Cao and L. Wang, Ind. Eng. Chem. Res., 2008, 47, 2561–2568 CrossRef CAS.
- L. Shahriary and A. A. Athawale, Int. J. Renew. Energy Environ. Eng., 2014, 2, 58–63 Search PubMed.
- J. A. Edward, M. K. Kiesewetter, H. Kim, J. C. Flanagan, J. L. Hedrick and R. M. Waymouth, Biomacromolecules, 2012, 13, 2483–2489 CrossRef CAS PubMed.
- N. Işıklan and F. Kurşun, Polym. Bull., 2013, 70, 1065–1084 CrossRef.
- N. Guliyeva, R. Abaszade, E. Khanmammadova and E. Azizov, J. Optoelectron. Biomed. Mater., 2023, 15, 23–30 CrossRef.
- S. Qazi, H. Shaikh, A. A. Memon and S. Memon, J. Chem. Soc. Pak., 2020, 42, 856–865 CAS.
- J. K. Virk, S. Kumar, R. Singh, A. C. Tripathi, S. K. Saraf, V. Gupta and P. Bansal, J. Adv. Pharm. Technol. Res., 2016, 7, 153–158 CrossRef CAS PubMed.
- Y. Aso, M. Sano, R. Yada, T. Tanaka, T. Aoki, H. Ohara, T. Kusukawa, K. Matsumoto and K. Wada, Materials, 2020, 13, 2707 CrossRef CAS PubMed.
- M. Ebrahimi Naghani, M. Neghabi, M. Zadsar and H. Abbastabar Ahangar, Sci. Rep., 2023, 13, 1496 CrossRef CAS PubMed.
- C. Agbo, T. Ugwuanyi, O. Eze, A. Onugwu, A. Echezona, C. Nwagwu, S. Uzondu, J. Ogbonna, L. Ugorji and P. Nnamani, Processes, 2023, 11, 1811 CrossRef CAS.
- M. Sabaa, E. Magid and R. Mohamed, Sci. Rev. Chem. Commun., 2017, 7, 1–17 Search PubMed.
- R. Ali, M. H. Aziz, S. Gao, M. I. Khan, F. Li, T. Batool, F. Shaheen and B. Qiu, Ceram. Int., 2022, 48, 10741–10750 CrossRef CAS.
- J. Huang, Y. Liu, Y. Muhammad, J. Q. Li, Y. Ye, J. Li, Z. Li and R. Pei, Constr. Build. Mater., 2022, 357, 129387 CrossRef CAS.
- X. Miao, S. Liu, L. Ma, Y. Yang, J. Zhu, Z. Li and J. Wang, Tribol. Int., 2022, 167, 107361 CrossRef CAS.
- A. N. Soomro, H. Shaikh, M. I. Malik, J. A. Buledi, S. Qazi and A. Solangi, RSC Adv., 2022, 12, 31639–31649 RSC.
- G. Z. Kyzas, P. I. Siafaka, D. A. Lambropoulou, N. K. Lazaridis and D. N. Bikiaris, Langmuir, 2014, 30, 120–131 CrossRef CAS PubMed.
- R. Sharma, S. Kalia, B. S. Kaith, A. Kumar, P. Thakur, D. Pathania and M. K. Srivastava, J. Polym. Environ., 2017, 25, 176–191 CrossRef CAS.
- A. Aldalbahi, M. Rahaman and A. El-Faham, Int. J. Polym. Sci., 2020, 2020, 9706106 Search PubMed.
- B. D. Ossonon and D. Bélanger, RSC Adv., 2017, 7, 27224–27234 RSC.
- M. Khan, F. Ali, S. Ramzan and Z. A. AlOthman, RSC Adv., 2023, 13, 16047–16066 RSC.
- M. R. Ganjali, A. R. Rahmani, R. Shokoohi, A. Farmany and M. Khazaei, Int. J. Electrochem. Sci., 2019, 14, 6420–6430 CrossRef CAS.
- M. Nawaz, H. Shaikh, J. A. Buledi, A. R. Solangi, C. Karaman, N. Erk, R. Darabi and M. B. Camarada, Carbon Lett., 2024, 34, 201–214 CrossRef.
- N. H. Khand, A. R. Solangi, H. Shaikh, Z.-u.-H. Shah, S. Bhagat, S. T. H. Sherazi and E. A. López-Maldonado, Microchim. Acta, 2024, 191, 342 CrossRef CAS PubMed.
- Z. Liu, Z. Wang, Y. Cao, Y. Jing and Y. Liu, Sens. Actuators, B, 2011, 157, 540–546 CrossRef CAS.
- H. Baksh, J. A. Buledi, N. H. Khand, A. R. Solangi, A. Mallah, S. T. Sherazi and M. I. Abro, Monatsh. Chem., 2020, 151, 1689–1696 CrossRef CAS.
- J. J. A. Buledi, A. R. Solangi, A. Hyder, M. Batool, N. Mahar, A. Mallah, H. Karimi-Maleh, O. Karaman, C. Karaman and M. Ghalkhani, Environ. Res., 2022, 212, 113372 CrossRef CAS PubMed.
- S. Erogul, S. Z. Bas, M. Ozmen and S. Yildiz, Electrochim. Acta, 2015, 186, 302–313 CrossRef CAS.
- Y. Zhang, S. Xiao, J. Xie, Z. Yang, P. Pang and Y. Gao, Sens. Actuators, B, 2014, 204, 102–108 CrossRef CAS.
- J. G. Manjunatha, Surfaces, 2020, 3, 473–483 CrossRef.
- L. Liao, P. Zhou, F. Xiao, W. Tang, M. Zhao, R. Su, P. He, D. Yang, L. Bian and B. Tang, Ionics, 2023, 29, 1605–1615 CrossRef CAS.
- H. Trabelsi, N. Bensalah and A. Gadri, J. Adv. Oxid. Technol., 2015, 18, 155–160 CAS.
- X. Tao, L. Zhu, X. Wang, X. Chen and X. Liu, Environ. Sci. Pollut. Res., 2022, 29, 40854–40864 CrossRef CAS PubMed.
- S. D. Khairnar, M. R. Patil and V. S. Shrivastava, Iran. J. Catal., 2018, 8, 143–150 CAS.
- X. Niu, H. Li and G. Liu, J. Mol. Catal. A: Chem., 2005, 232, 89–93 CrossRef CAS.
- D. Zhang, S. Lv and Z. Luo, RSC Adv., 2020, 10, 1275–1280 RSC.
- Z. Zhang, G. Yi, P. Li, X. Wang, X. Wang, C. Zhang, Y. Zhang and Q. Sun, J. Electroanal. Chem., 2021, 895, 115493 CrossRef CAS.
- S. Lagergren, Sven. Vetenskapsakad. Handingarl., 1898, 24, 1–39 Search PubMed.
- Y.-S. Ho and G. McKay, Chem. Eng. J., 1998, 70, 115–124 CrossRef CAS.
- G. Asefa, D. Negussa, G. Lemessa and T. Alemu, J. Nanomater., 2024, 2024, 5259089 Search PubMed.
- P.-W. Hsieh, I. A. Aljuffali, C.-L. Fang, S.-H. Chang and J.-Y. Fang, J. Dermatol. Sci., 2014, 76, 120–131 CrossRef CAS PubMed.
- Z. Zhang, G. Yi, P. Li, X. Wang, X. Wang, C. Zhang, Y. Zhang and Q. Sun, Colloids Surf., A, 2022, 642, 128632 CrossRef CAS.
- P. Borthakur, P. K. Boruah, P. Das and M. R. Das, New J. Chem., 2021, 45, 8714–8727 RSC.
- K. Peng, X. Liu, X. Wu, H. Yu, J. He, K. Chen, L. Zhu and X. Wang, Environ. Sci. Pollut. Res., 2023, 30, 83575–83586 CrossRef CAS PubMed.
|
| This journal is © The Royal Society of Chemistry 2024 |
Click here to see how this site uses Cookies. View our privacy policy here.  Open Access Article
 ,
Amber R. Solangi
 *,
Nadir Hussain Khand,
Shahbaz Ali Mallah and
Mehrunnisa Koondhar
![[thin space (1/6-em)]](https://www.rsc.org/images/entities/char_2009.gif) :
:![[thin space (1/6-em)]](https://www.rsc.org/images/entities/char_2009.gif) 3) acetic acid and methanol and then again washed using D.I water and dried at ambient temperature (Fig. 1).
3) acetic acid and methanol and then again washed using D.I water and dried at ambient temperature (Fig. 1).

![[double bond, length as m-dash]](https://www.rsc.org/images/entities/char_e001.gif) O from carboxylic acid functionality appeared at 1700 cm−1. The –C
O from carboxylic acid functionality appeared at 1700 cm−1. The –C![[double bond, length as m-dash]](https://www.rsc.org/images/entities/char_e001.gif) C graphitic region peak was appeared at 1600 cm−1 while C–O epoxy group's bending vibration appeared at 1120 cm−1. The existence of oxygen functionalities suggested that graphene oxide had been synthesized successfully.29,30 The FTIR spectra of Quinine Int. GO composite is shown in Fig. 2, where –OH stretching vibrations appeared at 3149 cm−1 with increase in intensity and the carbonyl peak has been disappeared due to H-bonding between quinine and graphene oxide. The –C
C graphitic region peak was appeared at 1600 cm−1 while C–O epoxy group's bending vibration appeared at 1120 cm−1. The existence of oxygen functionalities suggested that graphene oxide had been synthesized successfully.29,30 The FTIR spectra of Quinine Int. GO composite is shown in Fig. 2, where –OH stretching vibrations appeared at 3149 cm−1 with increase in intensity and the carbonyl peak has been disappeared due to H-bonding between quinine and graphene oxide. The –C![[double bond, length as m-dash]](https://www.rsc.org/images/entities/char_e001.gif) C graphitic stretching vibrations appeared at 1620 cm−1 and C–O bending vibrations of epoxy group was found at 1024 cm−1. These peaks are slightly shifted with increase in intensities due to the intercalation of quinine with graphene oxide. However new peaks appeared at 1573 cm−1, 1364 cm−1 and 1239 cm−1 due to C
C graphitic stretching vibrations appeared at 1620 cm−1 and C–O bending vibrations of epoxy group was found at 1024 cm−1. These peaks are slightly shifted with increase in intensities due to the intercalation of quinine with graphene oxide. However new peaks appeared at 1573 cm−1, 1364 cm−1 and 1239 cm−1 due to C![[double bond, length as m-dash]](https://www.rsc.org/images/entities/char_e001.gif) C vinyl and C–N stretch of cyclic amine confirmed that GO has been intercalated with quinine successfully.31 Fig. 2 is the FTIR spectra of poly (quinine-co-itaconic acid)@rGO composite which shows similar peaks however, some of the peaks have been shifted with increased intensities. The carbonyl peak reappeared at 1710 cm−1 due to the presence of itaconic acid which confirmed that poly(quinine-co-itaconic acid)@rGO has been successfully synthesized.32 The detailed results and discussion of EDX studies are given in ESI.†
C vinyl and C–N stretch of cyclic amine confirmed that GO has been intercalated with quinine successfully.31 Fig. 2 is the FTIR spectra of poly (quinine-co-itaconic acid)@rGO composite which shows similar peaks however, some of the peaks have been shifted with increased intensities. The carbonyl peak reappeared at 1710 cm−1 due to the presence of itaconic acid which confirmed that poly(quinine-co-itaconic acid)@rGO has been successfully synthesized.32 The detailed results and discussion of EDX studies are given in ESI.†

![[thin space (1/6-em)]](https://www.rsc.org/images/entities/char_2009.gif) sin
sin![[thin space (1/6-em)]](https://www.rsc.org/images/entities/char_2009.gif) θ. The Fig. 3 is the XRD pattern of Quinine Int. GO composite in which peak at 2θ 11.7° had been disappeared and the new diffraction peaks appeared at 2θ 15°, 26°, 42°, 44° and 72° with reflection of (200), (002), (100), (101) and (104) having d-spacing of 0.56 nm, 0.34 nm, 0.21 nm, 0.2 nm and 0.13 nm indicating the intercalation of quinine with graphene oxide.34 Fig. 3 is the XRD pattern of poly (quinine-co-itaconic acid)@rGO composite which shows similar peaks at 2θ 15°, 26°, 42°, 44° and 72° with reflection of (200), (002), (100), (101) and (104) having d-spacing of 0.51 nm, 0.33 nm, 0.21 nm, 0.2 nm and 0.13 nm, however the intensities of these peaks decreases along with appearance of new peaks at 2θ 31°, 45° and 56° with reflection of (111), (012) and (210) having d-spacing 0.28 nm, 0.2 nm and 0.16 nm due to copolymerization of itaconic acid with quinine. These results confirmed the successful synthesis of poly (quinine-co-itaconic acid)@rGO composite.35 Hence, the XRD result has also confirms the interaction between itaconic acid and Quinine Int. GO nanosheets, which is in agreement with the results obtained from FTIR analysis.
θ. The Fig. 3 is the XRD pattern of Quinine Int. GO composite in which peak at 2θ 11.7° had been disappeared and the new diffraction peaks appeared at 2θ 15°, 26°, 42°, 44° and 72° with reflection of (200), (002), (100), (101) and (104) having d-spacing of 0.56 nm, 0.34 nm, 0.21 nm, 0.2 nm and 0.13 nm indicating the intercalation of quinine with graphene oxide.34 Fig. 3 is the XRD pattern of poly (quinine-co-itaconic acid)@rGO composite which shows similar peaks at 2θ 15°, 26°, 42°, 44° and 72° with reflection of (200), (002), (100), (101) and (104) having d-spacing of 0.51 nm, 0.33 nm, 0.21 nm, 0.2 nm and 0.13 nm, however the intensities of these peaks decreases along with appearance of new peaks at 2θ 31°, 45° and 56° with reflection of (111), (012) and (210) having d-spacing 0.28 nm, 0.2 nm and 0.16 nm due to copolymerization of itaconic acid with quinine. These results confirmed the successful synthesis of poly (quinine-co-itaconic acid)@rGO composite.35 Hence, the XRD result has also confirms the interaction between itaconic acid and Quinine Int. GO nanosheets, which is in agreement with the results obtained from FTIR analysis.


![[thin space (1/6-em)]](https://www.rsc.org/images/entities/char_2009.gif) 000 and low frequency upto 1 with initial potential of 1.5 V. The semicircle curve of Nyquist plot is usually monitored in electrochemical impedance spectroscopy. Narrow semicircle curve reveals the higher conductance and wide semicircle reflects the higher resistance. The broader semicircle was obtained for GO/GCE due to presence of oxygen containing functionalities on GO surface that reduce its conductivity.46 However, the smallest semicircle curve was observed at poly (quinine-co-itaconic acid)@rGO/GCE that confirmed the catalytic behavior of poly (quinine-co-itaconic acid)@rGO composite. All the Nyquist plots in EIS were circuit fitted. The Rct (charge transfer resistance) value of bare/GCE, GO/GCE and poly (quinine-co-itaconic acid)@rGO/GCE were measured as 630 Ω, 931 Ω and 473 Ω, respectively. The lowest Rct value was obtained for poly (quinine-co-itaconic acid)@rGO/GCE that signifies the lowest resistivity of modified electrode. It is worth mentioning that the copolymerization of itaconic acid with quinine on the surface of intercalated graphene oxide results in more efficient electrode materials as the resulting material is efficient and swift in electron transfer process because of electro-active properties of poly (itaconic acid). Furthermore, the polymerization process has also reduced GO into rGO which has increased the electron transfer ability of poly (quinine-co-itaconic acid)@rGO/GCE. The reduction of GO to rGO is evident from XRD studies as the peak at 2θ 11.7 due to oxidation in GO is diminished in the diffractogram of poly (quinine-co-itaconic acid)@rGO/GCE.39 The electrode active surface area was determined by Randles–Ševčík equation Ip (μA) = 2.69 × 10⁵ × n3/2AD1/2ν1/2C and the calculated values were 0.304 cm2 for poly (quinine-co-itaconic acid)@rGO/GCE, 0.213 cm2 for bare/GCE, and 0.044 cm2 for GO/GCE, respectively. The high current response, lower charge transfer resistance and more active surface area emphasizes the excellent performance of poly (quinine-co-itaconic acid)@rGO/GCE, making it a promising candidate for analyte determination in electrochemical sensing applications.47
000 and low frequency upto 1 with initial potential of 1.5 V. The semicircle curve of Nyquist plot is usually monitored in electrochemical impedance spectroscopy. Narrow semicircle curve reveals the higher conductance and wide semicircle reflects the higher resistance. The broader semicircle was obtained for GO/GCE due to presence of oxygen containing functionalities on GO surface that reduce its conductivity.46 However, the smallest semicircle curve was observed at poly (quinine-co-itaconic acid)@rGO/GCE that confirmed the catalytic behavior of poly (quinine-co-itaconic acid)@rGO composite. All the Nyquist plots in EIS were circuit fitted. The Rct (charge transfer resistance) value of bare/GCE, GO/GCE and poly (quinine-co-itaconic acid)@rGO/GCE were measured as 630 Ω, 931 Ω and 473 Ω, respectively. The lowest Rct value was obtained for poly (quinine-co-itaconic acid)@rGO/GCE that signifies the lowest resistivity of modified electrode. It is worth mentioning that the copolymerization of itaconic acid with quinine on the surface of intercalated graphene oxide results in more efficient electrode materials as the resulting material is efficient and swift in electron transfer process because of electro-active properties of poly (itaconic acid). Furthermore, the polymerization process has also reduced GO into rGO which has increased the electron transfer ability of poly (quinine-co-itaconic acid)@rGO/GCE. The reduction of GO to rGO is evident from XRD studies as the peak at 2θ 11.7 due to oxidation in GO is diminished in the diffractogram of poly (quinine-co-itaconic acid)@rGO/GCE.39 The electrode active surface area was determined by Randles–Ševčík equation Ip (μA) = 2.69 × 10⁵ × n3/2AD1/2ν1/2C and the calculated values were 0.304 cm2 for poly (quinine-co-itaconic acid)@rGO/GCE, 0.213 cm2 for bare/GCE, and 0.044 cm2 for GO/GCE, respectively. The high current response, lower charge transfer resistance and more active surface area emphasizes the excellent performance of poly (quinine-co-itaconic acid)@rGO/GCE, making it a promising candidate for analyte determination in electrochemical sensing applications.47


