 Open Access Article
Studies on the synergistic effect between corn straw and Canadian oil sands bitumen during the co-pyrolysis process
Bing Wang *a,
Cuiyu Zhao
 b and
Congxiu Guo
 a
a
aSchool of Electric Power, Civil Engineering and Architecture, Shanxi University, Taiyuan 030006, China. E-mail: wangbing@sxu.edu.cn; Tel: +86 15003466330
bDepartment of Architecture and Environmental Engineering, Taiyuan University, Taiyuan 030032, China
First published on 16th September 2024
Abstract
To investigate the potential synergistic effect, the co-pyrolysis of corn straw (CS) and Canadian oil sands bitumen (CA-OB) was carried out in this work. Thermogravimetric and differential thermogravimetric curves of CA-OB, CS and their blends were recorded using a thermogravimetric analyser. The main co-pyrolysis regions of the CS/CA-OB blends partially overlapped with the individual pyrolysis curves of CS and CA-OB, and the apparent weight loss was detected between 250 °C and 500 °C. The comparison of the experimental curves with the calculated data indicated that the synergistic effect was present in the main reaction region of co-pyrolysis and was enhanced with increasing CS content. The effects of the interactions between CA-OB and CS on the distributions and yields of the pyrolyzed products were studied in a high-pressure autoclave. It can be concluded that the co-pyrolysis process promoted an increase in the coke yield, while the oil and gas yields decreased. The proportion of aromatics in the pyrolyzed oil products increased as the increasing CS content suppressed the decomposition and dehydrogenation–condensation reactions. In addition, the gasification activity of co-pyrolysis cokes was enhanced.
1. Introduction
Renewable energy has gained much attention due to the high global demand for power. The proportion of fossil fuels in the total energy sources is gradually decreasing, but the consumption is still increasing.1 Recently, crude oil has shown a trend of becoming heavy and of deteriorating quality.2 As an alternative energy supplement, oil sands generally consist of sand, clay, low water content, and bitumen, which makes it unsuitable for direct utilization as an industrial feedstock.3,4 Several technologies have been developed to separate bitumen from oil sands, including solvent extraction, pyrolysis and hot water extraction.5 Among these methods, pyrolysis is a promising process to obtain light oils.As a renewable energy source, biomass is abundant and can be harvested directly from the environment.6 It has the potential to replace fossil fuels in the future. Efficient thermal conversion of biomass, including gasification, fermentation, pyrolysis and hydrothermal liquefaction, can reduce CO2 emissions into the environment and produce valuable chemicals compared to the direct burning process.7,8 Nowadays, the pyrolysis of biomass, which is a clean conversion method to obtain biofuels, has become attractive to researchers.9–12 However, when biomass is pyrolyzed alone, the liquid products (organic acids, ketones, aldehydes, phenols, etc.) generally possess the disadvantages of high oxygen content, poor thermal stability, low calorific value and low pH, thus restricting their applications.10 The co-pyrolysis of biomass with various feedstocks (coal, plastics, waste tyres, waste newspapers, etc.) can be utilized to improve the quality and distribution of the pyrolyzed products.11–14 Co-gasification experiments of biomass (palm empty fruit bunch and almond shell) and tire were performed under CO2 conditions by Lahijani et al.13 The results showed that the char activity was improved by alkali metals in the biomass, and activated carbon was produced. Ephraim et al. investigated the effects of plastic waste (polystyrene and polyvinyl chloride) on the distribution of gaseous products, product yields and heat value as poplar wood and plastic waste were pyrolyzed together.14 The addition of polyvinyl chloride significantly increased the oil yield due to the positive synergy effect, while polystyrene benefited the formation of gaseous products (CO, CO2, CH4 and H2).
In recent years, studies on the co-pyrolysis of biomass and crude oil have been widely reported.4,10,15–17 Co-pyrolysis can effectively obtain a high quality of pyrolyzed products, provide sustainable energy and reduce production costs compared to the pyrolysis process of a single component. There are many differences in chemical compositions and physical properties between biomass and crude oil, which could have an impact on the thermal decomposition behaviours and product distributions during the co-pyrolysis process. The polycyclic aromatics in heavy oil can serve as hydrogen donors to promote the thermolysis of biomass. Benefiting from the high heating value of heavy oil, the heating value of biomass is improved during the co-pyrolysis process. Moreover, with the aid of alkali and alkaline earth metals in biomass, the co-pyrolysis of char could exhibit higher gasification activity.15 Wang et al. reported that the quality of extra-heavy oil was improved by sawdust through the aquathermolysis process.10 Sawdust provided H and O during the co-pyrolysis; thus, the viscosity of the extra-heavy oil was significantly reduced. Zhang et al. performed the pyrolysis experiments on the fixed bed reactor and observed a significant synergetic effect between Indonesian oil sands and corn straw.4 Chemical interactions within two feedstocks promoted the increase in the contents of phenols and alcohols and reduced the ratio of unstable aldehydes. The addition of biomass could improve the pyrolysis characteristics of oil sand and have effects on the product distributions.
In this work, the co-pyrolysis characteristics of corn straw (CS) and Canadian oil sands bitumen (CA-OB) were investigated. The thermolysis behavior for the CA-OB, CS and their blends was studied by a thermogravimetric analyzer to understand the interactions between CA-OB and CS preliminarily. The yields and distributions of pyrolyzed products and the synergistic effects for CA-OB/CS blends were further investigated under high-pressure in the autoclave. On comparing the experimental data with the calculated results, the synergistic effect was confirmed. In addition, with increasing ratios of CS, the coke yield was increased and the oil and gas yields showed a decline under high-pressure conditions.
2. Experiments
2.1 Materials
Corn straw (CS) was collected from Taiyuan, Shanxi Province of China. CS was dried and crushed into sizes of 48–74 μm, and the results of the corresponding proximate and ultimate analysis are listed in Table 1. Canadian oil sands bitumen (CA-OB) is typically an inferior petroleum residue, and its ultimate analysis and four-component analysis are presented in Table 2.| Ultimate analysis (wt%) | Proximate analysis (wt%) | |||||||
|---|---|---|---|---|---|---|---|---|
| C | H | N | S | O | M | A | V | FC |
| 46.20 | 6.21 | 1.44 | 0.16 | 45.99 | 5.44 | 7.22 | 70.79 | 16.57 |
| Ultimate analysis (wt%) | Four-component analysis (wt%) | |||||||
|---|---|---|---|---|---|---|---|---|
| C | H | N | S | O | Saturates | Aromatics | Resins | Asphaltenes |
| 82.89 | 10.14 | 4.91 | 0.45 | 1.61 | 14.52 | 34.83 | 38.01 | 12.64 |
2.2 Co-pyrolysis experiments and characterization
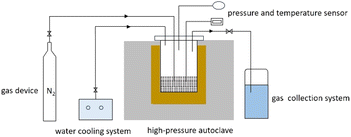
CA-OB and CS were mechanically blended with the ratios of CS ranging from 10 wt% to 40 wt% at intervals of 10 wt% for the co-pyrolysis reaction, and the corresponding samples were denoted as 10CS, 20CS, 30CS and 40CS according to the ratio of CS.The co-pyrolysis reaction of CA-OB/CS blends was conducted in a high-pressure autoclave. The schematic diagram of the co-pyrolysis system is shown in Scheme 1. 15 g of the sample was added into the autoclave. The autoclave was purged with N2 and the initial pressure was maintained at 1 MPa. Under a heating rate of 15 °C min−1, the autoclave was heated to 450 °C and held for 30 min to reach the reaction equilibrium. After that, the pyrolysis products were collected, and the mass and composition were further detected by GC-MS (Agilent 7890B gas chromatography coupled with an Agilent 5977B MSD mass spectrometer).
Thermogravimetric (TG) and differential thermogravimetric (DTG) analyses of CA-OB, CS and their blends was performed on a thermogravimetric analyzer (SETARAM LABSYS EVO, France). Approximately 5 mg of the sample was heated up to 900 °C at the rate of 10 °C min−1 with high purity N2 as the carrier gas at a flow rate of 100 mL min−1. The CO2 gasification activity of pyrolyzed cokes was also detected on this analyzer. Similarly, about 5 mg sample was heated to 1000 °C at a heating rate of 10 °C min−1 under 100 mL min−1 CO2 flow. The functional groups of the pyrolysis oils and the properties of the cokes were measured by Fourier transform infrared (FTIR) spectroscopy (Thermo Scientific Nicolet iS50, Thermo Fisher Scientific, USA).
2.3 Calculations
To verify the interactions between CA-OB and CS, the theoretical TG curves of the CA-OB/CS blends are calculated by eqn (1). The corresponding DTG curves are plotted on the basis of the calculated TG data.4| WCal = x1WCS + (1 − x1) WCA-OB | (1) |
The yields of gas, oil and coke are calculated by eqn (2).
| YE = 100% × (MS/ME) | (2) |
The calculated product yields for the co-pyrolysis of CA-OB and CS were used to investigate the synergetic effect by the following equation.
| YCal = x1YCS,E + (1 − x1)YCA-OB,E | (3) |
| ΔY = YE − YCal | (4) |
3. Results and discussion
3.1 Thermogravimetric analysis
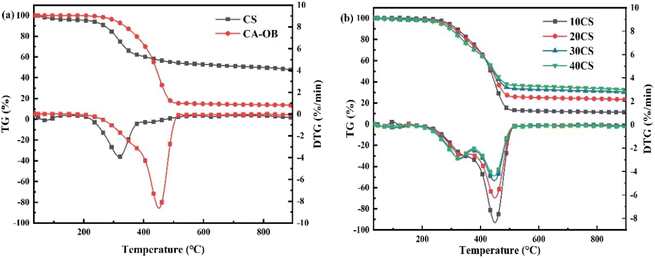
The TG and DTG curves of individual CS and CA-OB are illustrated in Fig. 1a, and the corresponding characteristic temperatures of pyrolysis are listed in Table 3. The temperature ranges of the thermal decomposition were partially overlapped for CS and CA-OB. The initial, peak and final temperatures of CS were lower than those of CA-OB, representing that CS had a higher pyrolysis reactivity. A narrow weight loss peak was observed for CS between 200 and 400 °C, whereas the weight loss of CA-OB occurred above 250 °C. When the temperature was below 428 °C, the weight loss of CA-OB was less than that of CS, and an opposite trend appeared with the temperatures above 428 °C. Compared to CS, CA-OB was more stable and required higher pyrolysis temperatures. The weight loss rate of CS and CA-OB decreased significantly after 500 °C and then both were carbonized to form coke.18 The macromolecular compounds in CS were mostly cracked and charred, thus producing more residual coke. In contrast, for CA-OB with a low condensation coking ratio, the small molecular matters were more easily formed by volatilization or decomposition.| Samples | Tinitial | Tpeak | Tfinal |
|---|---|---|---|
| CS | 148 | 318 | 509 |
| CA-OB | 198 | 451 | 537 |
The pyrolytic behaviour of the CA-OB/CS blends is shown in Fig. 1b. Pyrolysis mainly took place in the temperature range from 250 to 500 °C for all the mixed samples, which exhibited a partial overlap with the individual pyrolysis curves of CS and CA-OB. With the ratios of CS increasing, the weight loss rate of the blended samples decreased and was positively correlated with the proportion of CS. As illustrated by the DTG curves, there was an obvious peak of mass loss for the 10CS and 20CS samples. The 30CS and 40CS samples both had two peaks at about 320 °C and 445 °C, which corresponded to the decomposition of CS and CA-OB, respectively. Also, the intensity of the two peaks reduced and broadened as the addition of CS increased. The maximum mass loss rate for the mixed samples was located at about 446 °C, which was similar to that of CA-OB.
To investigate the synergistic effect that occurred during the co-pyrolysis of CS and CA-OB, the experimental and calculated TG/DTG curves of the blended samples are presented in Fig. 2. The characteristic temperatures of the co-pyrolysis samples are also shown in Table 4. The experimental curves for the samples with different ratios of CS were basically consistent with their respective calculated values, and there was a tiny difference during the decomposition stage. For 10CS, the experimental result almost overlapped with the calculated curves at a lower temperature (<450 °C) and had a higher weight loss rate above the Tpeak (449 °C). Under the CS additions of 20, 30, and 40 wt%, the weight loss rates from the experimental data were higher than the corresponding calculation results in the low-temperature range of thermal decomposition, while they gradually became the same with increasing temperature. Conversely, the experimental rates were all lower after the Tpeak; thus, the coke yield was eventually higher than that of the calculated case. This may be due to the volatile release in the low-temperature stage and the interactions between CS and CA-OB.
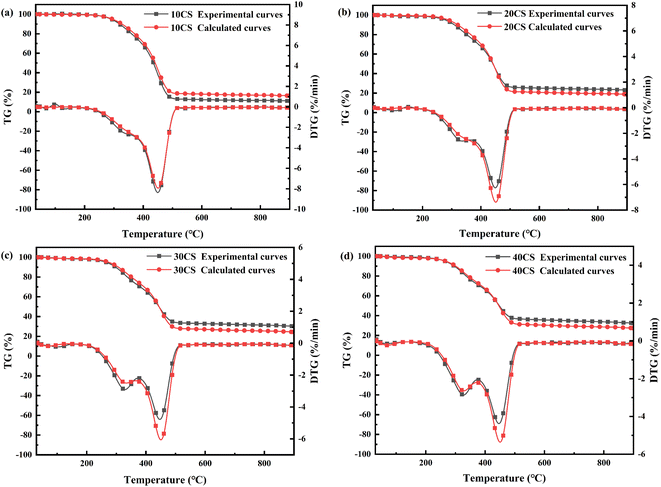 | ||
| Fig. 2 TG and DTG curves for the co-pyrolysis of the mixture of CS and CA-OB based on the experimental and calculated values: (a) 10CS, (b) 20CS, (c) 30CS and (d) 40CS. | ||
| Samples | Experimental values/°C | Theoretical values/°C | ||||
|---|---|---|---|---|---|---|
| Tinitial | Tpeak | Tfinal | Tinitial | Tpeak | Tfinal | |
| 10CS | 188 | 449 | 535 | 194 | 451 | 535 |
| 20CS | 190 | 449 | 533 | 193 | 451 | 534 |
| 30CS | 185 | 447 | 531 | 189 | 451 | 534 |
| 40CS | 169 | 446 | 526 | 184 | 450 | 532 |
In general, the above-mentioned results show that the synergistic effect did exist in the co-pyrolysis of CS and CA-OB, and it varied with the ratios of CS. CS could induce the thermal decomposition of CA-OB absorbed on the surface of CS and lower the thermal reaction temperature,7 and the pyrolysis of CA-OB was also promoted.11
3.2 Co-pyrolysis product distribution
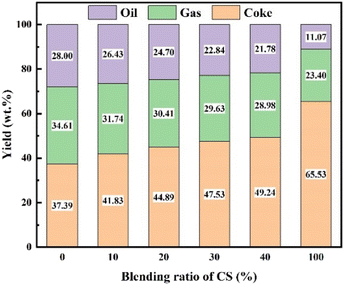
In the TG analysis, the volatile matters formed by CS pyrolysis under atmospheric pressure will be immediately removed by the carrier gas. In a high-pressure autoclave, however, the CS initially loses weight in the low-temperature region and the volatiles are still retained. This may provide more opportunities for interactions between CS and CA-OB during the co-pyrolysis process in the high-pressure autoclave. The co-pyrolysis product distributions for the blends of CA-OB with different ratios of CS under high-pressure are shown in Fig. 3. CA-OB had relatively higher yields of gas and coke products when thermally decomposed alone. The pyrolysis product of pure CS mainly consisted of coke, whose yield was obviously higher than that of CA-OB. With the content of CS ranging from 0 to 40 wt%, the coke yield increased from 37.39 wt% to 49.24 wt% during the co-pyrolysis, while the yields of gas and oil decreased from 34.61 and 28 wt% to 28.98 and 21.78 wt%, respectively.The synergistic effect of CS/CA-OB blends during the co-pyrolysis can be studied based on the differences between the experimental and theoretical product yields, as shown in Fig. 4. The coke yield was increased compared to the theoretical values, but the oil and gas products showed an opposite trend. These indicated that the co-pyrolysis of CS and CA-OB was favored the formation of coke and reduced the generation of oil and gas products, which meant a strong synergistic effect. At 40 wt% CS addition, higher differences in gas and oil yields were observed. This may be probably because the high-pressure induced the polymerization reaction of the pyrolyzed volatiles in the autoclave; therefore, the volatiles were stably retained in the coke. A similar result was also reported by Ephraim et al.14 During the co-pyrolysis of poplar wood and non-polyolefins (polystyrene and polyvinyl chloride), the secondary reactions between poplar wood volatiles and polystyrene resulted in the formation of lighter gases.
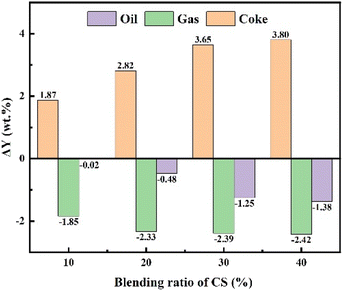 | ||
| Fig. 4 Differences between experimental and theoretical yields for the co-pyrolysis products of CS and CA-OB. | ||
3.3 Co-pyrolysis oil product
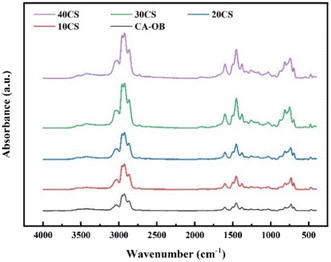
The variations in the functional groups of the pyrolysis oil for CA-OB/CS blends were investigated by FTIR spectroscopy, as displayed in Fig. 5, and all the samples possessed similar curves. The peaks at 2800–2950, 1450–1610, and 700–900 cm−1 represented the stretching vibrations of methylene and methyl in the aliphatic and aromatic hydrocarbon, the C![[double bond, length as m-dash]](https://www.rsc.org/images/entities/char_e001.gif) C vibration of the aromatic ring, and out-of-plane deformation vibrations of aromatic structures, respectively.19 The intensity of the methylene and methyl peaks were gradually enhanced with increasing CS ratios, which implied that the dealkylation was hindered by the addition of CS. The aromaticity was also increased, as evidenced by the increased intensity of peaks at 1450–1610 and 700–900 cm−1 (ref. 20) since the increasing CS content inhibited the pyrolysis and dehydrogenation of some aromatic compounds in the pyrolysis oil.
C vibration of the aromatic ring, and out-of-plane deformation vibrations of aromatic structures, respectively.19 The intensity of the methylene and methyl peaks were gradually enhanced with increasing CS ratios, which implied that the dealkylation was hindered by the addition of CS. The aromaticity was also increased, as evidenced by the increased intensity of peaks at 1450–1610 and 700–900 cm−1 (ref. 20) since the increasing CS content inhibited the pyrolysis and dehydrogenation of some aromatic compounds in the pyrolysis oil.
The aromaticity (fa) of pyrolysis oil was calculated on the basis of the follow equation:21
| fa = 0.574 P + 0.024 | (5) |
The calculated fa values for the pyrolysis oil of CA-OB/CS blends are listed in Table 5. The fa ranged from 0.3871 to 0.3955 as the ratios of CS increased from 0 to 40 wt%. The phenolics, acids and furans are the main oxygenated compounds of CS pyrolysis.22 The light olefins derived from CA-OB could react with furans to yield monoaromatics through Diels–Alder and dehydration reactions.23 These formed aromatics act as the hydrocarbon pool to efficiently promote the conversion of the pyrolyzed oxygenated compounds into aromatic compounds.24 Due to the hydrogen donation effect of aliphatic hydrocarbon from CA-OB pyrolysis, phenolics, which undergo the demethoxylation and dehydroxylation reactions, are also converted into aromatics. Meanwhile, polycyclic aromatics are one of the pyrolytic products of CA-OB. Thus, an increasing aromaticity was observed.25,26
| Samples | fa |
|---|---|
| CA-OB | 0.387 |
| 10CS | 0.389 |
| 20CS | 0.392 |
| 30CS | 0.394 |
| 40CS | 0.396 |
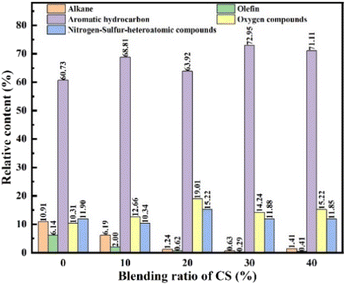
The chemical compositions of the oil products for CA-OB/CS blends were analyzed by GC/MS, and the corresponding contents were calculated by the gas chromatography peak product normalization method. The pyrolysis oil was primarily composed of alkanes, olefins, oxygen-containing compounds, aromatics, and nitrogen-sulfur-heteroatomic compounds, as displayed in Fig. 6. The components of the pyrolysis oil were almost the same under different ratios of CS, and there existed a difference in the same component. With the increasing addition of CS, the content of alkanes and olefins showed a decline while that of the aromatic hydrocarbons increased. This is probably caused by the fact that the free radicals from CS pyrolysis react with the small molecular radicals or aromatic side chains from the pyrolyzed CA-OB. The aromatic compounds formed during the pyrolysis process may further condense, thus increasing the yield of coke. Due to the oxygen-rich property of biomass, the content of oxygen-containing compounds rose under the low additions of CS. Conversely, a decreasing trend was observed with the addition of CS above 20 wt%. As the synergy effect of co-pyrolysis was enhanced with the increasing CS content, the oxygen-containing compounds were therefore transformed into aromatics or cracked into gaseous matter.
3.4 Co-pyrolysis gaseous product
The compositions of the gaseous products are shown in Fig. 7a. The gaseous products of co-pyrolysis mainly include H2, CH4, CO, CO2, and C2–C5. The dehydrogenation of hydrogenated aromatics and the condensation of aromatic cores could produce H2.27 CO and CO2 mainly from the cleavage of the oxygen-containing functional groups in CS. Consequently, the yields of CO and CO2 showed an increasing trend when the content of CS increased. The demethylation of aromatic structures, the pyrolysis of chain hydrocarbons, and the secondary cracking reactions between CA-OB and pyrolyzed oil products contributed to the production of CH4.21 Fig. 7b shows the differences between the experimental values and the theoretical values of the co-pyrolysis gas products for CA-OB/CS blends. The yields of CO and CO2 were higher than the calculated values, which was due to the decarboxylation of acids and the demethoxylation and dehydroxylation of phenolics during the co-pyrolysis process. Since CO and H2 could inhibit the thermolysis of aliphatic hydrocarbons and aromatic side chains,27 the contents of CH4 and C2–C5 were therefore lower compared to the calculations. In short, the interactions between CA-OB and CS during the co-pyrolysis process impact the compositions and the content variations of the gaseous products.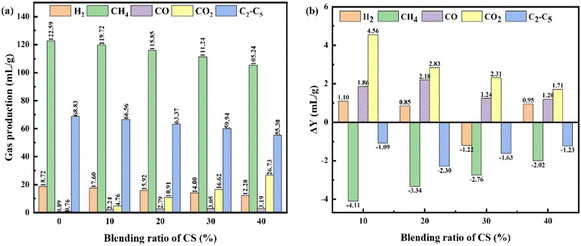 | ||
| Fig. 7 (a) Gaseous product yields; (b) differences between the experimental values and the theoretical values for the co-pyrolysis of CA-OB/CS blends. | ||
3.5 Co-pyrolysis coke product
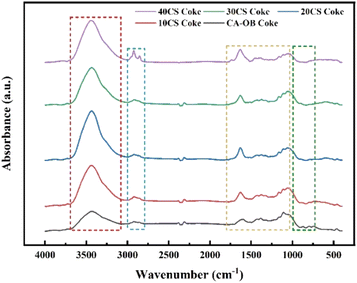
The FTIR spectra of the coke for CA-OB/CS co-pyrolysis are displayed in Fig. 8. The obtained cokes had similar functional groups and structures. The peaks at 3600–3100 cm−1 and 3100–2800 cm−1 were ascribed to the stretching vibrations of –OH and the stretching vibrations of aliphatic and aromatic hydrocarbons, respectively.28 The stretching vibrations of the C![[double bond, length as m-dash]](https://www.rsc.org/images/entities/char_e001.gif) C bond in the aromatic ring and C
C bond in the aromatic ring and C![[double bond, length as m-dash]](https://www.rsc.org/images/entities/char_e001.gif) O were observed at 1800–1400 cm −1.29 In addition, the peaks located at 1350–950 cm−1 and 900–700 cm−1 were assigned to the stretching vibrations of C–O, and out-of-plane deformation vibrations of aromatics, respectively.28,30 The FTIR spectra are divided into four bands in Fig. 8 and the curve fitting process was further performed to semiquantitatively investigate the structures of the functional groups.28 Here, the pyrolyzed coke from 10CS was chosen as an example in Fig. 9 and the parameters of the curve fitting are listed in Table 6. In this work, five infrared structural parameters (Ia, Ib, Ic, Id, Ie) represent the relative ratios of the specific peak areas for the same sample,28–31 and they are defined to investigate the coke structures and the synergistic effect during co-pyrolysis. Ia, which is calculated by dividing AC
O were observed at 1800–1400 cm −1.29 In addition, the peaks located at 1350–950 cm−1 and 900–700 cm−1 were assigned to the stretching vibrations of C–O, and out-of-plane deformation vibrations of aromatics, respectively.28,30 The FTIR spectra are divided into four bands in Fig. 8 and the curve fitting process was further performed to semiquantitatively investigate the structures of the functional groups.28 Here, the pyrolyzed coke from 10CS was chosen as an example in Fig. 9 and the parameters of the curve fitting are listed in Table 6. In this work, five infrared structural parameters (Ia, Ib, Ic, Id, Ie) represent the relative ratios of the specific peak areas for the same sample,28–31 and they are defined to investigate the coke structures and the synergistic effect during co-pyrolysis. Ia, which is calculated by dividing AC![[double bond, length as m-dash]](https://www.rsc.org/images/entities/char_e001.gif) O to the sum of AC
O to the sum of AC![[double bond, length as m-dash]](https://www.rsc.org/images/entities/char_e001.gif) O and AC
O and AC![[double bond, length as m-dash]](https://www.rsc.org/images/entities/char_e001.gif) C, is used to characterize the graphite structure of the cokes. Ib and Ic are the area ratios of C–O and aromatic hydrogen to all the functional groups, respectively, representing the contents of C–O and aliphatic hydrogen. Id(Aaliphatic hydrogen/Aaromatic hydrogen) and Ie(Amethylene/Amethyl) represent the relative content of aliphatic hydrogen to aromatic hydrogen and the degree of condensation, respectively. The values of the infrared structural parameters for the cokes of CA-OB/CS co-pyrolysis are listed in Table 7. With the CS content increasing, Ia, Ib, Ic, and Ie ranged from 0.416, 0.404, 0.216 and 0.447 to 0.576, 0.579, 0.251 and 0.582, respectively, while Id decreased from 0.079 to 0.034. This meant that the decomposition of aromatic hydrogen and methylene was suppressed by the co-pyrolysis, thus inhibiting the condensation and graphitization of cokes.
C, is used to characterize the graphite structure of the cokes. Ib and Ic are the area ratios of C–O and aromatic hydrogen to all the functional groups, respectively, representing the contents of C–O and aliphatic hydrogen. Id(Aaliphatic hydrogen/Aaromatic hydrogen) and Ie(Amethylene/Amethyl) represent the relative content of aliphatic hydrogen to aromatic hydrogen and the degree of condensation, respectively. The values of the infrared structural parameters for the cokes of CA-OB/CS co-pyrolysis are listed in Table 7. With the CS content increasing, Ia, Ib, Ic, and Ie ranged from 0.416, 0.404, 0.216 and 0.447 to 0.576, 0.579, 0.251 and 0.582, respectively, while Id decreased from 0.079 to 0.034. This meant that the decomposition of aromatic hydrogen and methylene was suppressed by the co-pyrolysis, thus inhibiting the condensation and graphitization of cokes.
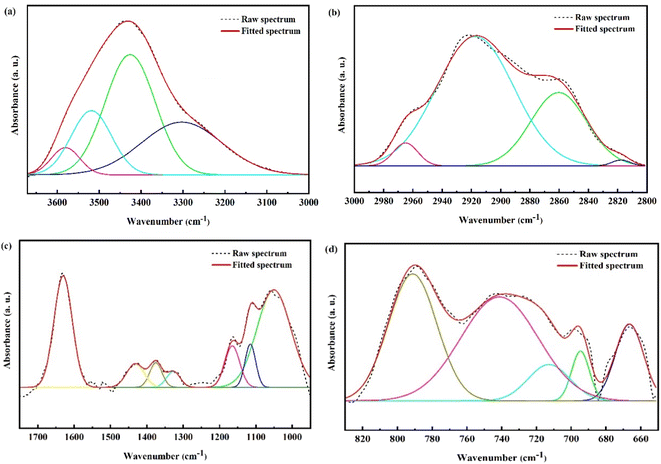 | ||
| Fig. 9 Curve fittings of FTIR for the pyrolyzed coke of 10CS: (a) 3600–3100 cm−1, (b) 3100–2800 cm−1, (c) 1700–950 cm−1, (d) 600–900 cm−1. | ||
| Peak | Center/cm−1 | Assignment | Area/A |
|---|---|---|---|
| 1 | 3580.4 | Stretching vibration of hydrogen-bond | 1.23 |
| 2 | 3518.8 | Stretching vibration of hydrogen-bond | 4.12 |
| 3 | 3426.2 | Stretching vibration of hydrogen-bond | 9.59 |
| 4 | 3303.1 | Stretching vibration of hydrogen-bond | 6.75 |
| 5 | 2965.0 | Asymmetric stretching vibration of CH3 | 0.02 |
| 6 | 2917.4 | Stretching vibration of CH in alkanes | 0.32 |
| 7 | 2860.4 | Symmetric stretching vibration of CH3 | 0.13 |
| 8 | 2817.7 | Symmetric stretching vibration of CH2 in alkanes | 0.00 |
| 9 | 1630.6 | Stretching vibration of highly conjugated C![[double bond, length as m-dash]](https://www.rsc.org/images/entities/char_e001.gif) O O |
1.12 |
| 10 | 1431.6 | Stretching vibration of C![[double bond, length as m-dash]](https://www.rsc.org/images/entities/char_e001.gif) C in aromatic ring C in aromatic ring |
0.23 |
| 11 | 1375.4 | Symmetric deformation vibration of CH3 | 0.17 |
| 12 | 1327.2 | Asymmetric deformation vibration of CH3 | 0.12 |
| 13 | 1165.1 | Stretching vibration of C–OH in phenols | 0.34 |
| 14 | 1115.4 | Stretching vibration of C–OH in phenols | 0.25 |
| 15 | 1050.8 | Stretching vibration of Si–O in aluminosilicates | 1.79 |
| 16 | 791.3 | Out-of-plane deformation vibration of ![[double bond, length as m-dash]](https://www.rsc.org/images/entities/char_e001.gif) C–H in aromatic structures with three adjacent hydrogens per ring (3H) C–H in aromatic structures with three adjacent hydrogens per ring (3H) |
0.30 |
| 17 | 741.3 | Out-of-plane deformation vibration of ![[double bond, length as m-dash]](https://www.rsc.org/images/entities/char_e001.gif) C–H in aromatic structures with three adjacent hydrogens per ring (4H) C–H in aromatic structures with three adjacent hydrogens per ring (4H) |
0.36 |
| 18 | 712.8 | Out-of-plane deformation vibration of ![[double bond, length as m-dash]](https://www.rsc.org/images/entities/char_e001.gif) C–H in aromatic structures with five adjacent hydrogens per ring (5H) C–H in aromatic structures with five adjacent hydrogens per ring (5H) |
0.07 |
| 19 | 694.7 | Out-of-plane deformation vibration of ![[double bond, length as m-dash]](https://www.rsc.org/images/entities/char_e001.gif) C–H in aromatic structures with five adjacent hydrogens per ring (5H) C–H in aromatic structures with five adjacent hydrogens per ring (5H) |
0.06 |
| Samples | Ia | Ib | Ic | Id | Ie |
|---|---|---|---|---|---|
| CA-OB coke | 0.416 | 0.404 | 0.216 | 0.079 | 0.447 |
| 10CS coke | 0.454 | 0.471 | 0.227 | 0.069 | 0.488 |
| 20CS coke | 0.494 | 0.516 | 0.236 | 0.058 | 0.523 |
| 30CS coke | 0.537 | 0.550 | 0.244 | 0.045 | 0.559 |
| 40CS coke | 0.576 | 0.579 | 0.251 | 0.034 | 0.582 |
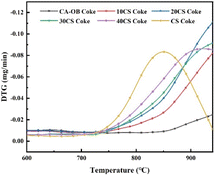
The CO2 gasification activity of the pyrolyzed cokes for the mixture of CA-OB and CS is illustrated in Fig. 10, and the initial temperatures for coke gasification are listed in Table 8. Usually, lower initial temperatures mean higher gasification activity. The huge difference in the gasification activity of the cokes for the single pyrolysis of CA-OB and CS exists because their gasification peaks show almost no overlap. For the co-pyrolysis of CA-OB/CS blends, a single gasification peak was detected, and the initial temperatures of the pyrolyzed cokes were significantly lower than that of CA-OB. Considering that alkali and alkaline earth metals in biomass could effectively catalyze the gasification reaction,32 the gasification activity of the cokes that stemmed from the co-pyrolysis of CA-OB and CS was obviously promoted by the addition of CS.
| Samples | Tinitial/°C |
|---|---|
| CA-OB coke | 809 |
| 10CS coke | 726 |
| 20CS coke | 713 |
| 30CS coke | 695 |
| 40CS coke | 673 |
| CS coke | 669 |
4. Conclusions
In this work, the pyrolysis performance and product distributions for the co-pyrolysis of Canadian oil sands bitumen (CA-OB) and corn straw (CS) with different CS ratios were investigated. The synergistic effects between CA-OB and CS on the yields and compositions of gas and oil and the gasification activity of the cokes were studied. The conclusions are listed as follows.(1) The pyrolysis temperature ranges for individual CS and CA-OB were partially overlapped under atmospheric pressure based on the TG/DTG curves. The experimental TG/DTG curves for the CA-OB/CS blends with different ratios of CS were basically consistent with their respective calculated cases and only a tiny difference existed in the decomposition stage, which meant that there was a slight interaction between CA-OB and CS and it varied with the ratios of CS.
(2) When the co-pyrolysis was performed in the high-pressure autoclave, the content of CS had impacts on the product distributions and yields. The coke yield increased with the increasing ratios of CS, while the oil and gas products declined. The synergistic effects between CS and CA-OB suppressed the formation of oil and gas products and promoted the generation of coke. The addition of CS inhibited the decomposition and dehydrogenation–condensation reactions of the aromatic compounds; thus, the content of aromatics in pyrolysis oil products increased. The gasification activity of cokes from the co-pyrolysis of CS and CA-OB was higher than that of individual CA-OB.
(3) Although CS and CA-OB had huge differences in the pyrolysis properties, the synergistic effect between them was enhanced under the closed reaction conditions in the autoclave.
Data availability
The data of this article have been included in the manuscript.Author contributions
Bing Wang: conceptualization, methodology, writing – original draft, funding acquisition. Cuiyu Zhao: formal analysis, data curation. Congxiu Guo: resources, writing – review and editing, supervision.Conflicts of interest
There are no conflicts to declare.Acknowledgements
The project was supported by Fundamental Research Program of Shanxi Province (No. 202303021222038), and Scientific and Technological Innovation Programs of Higher Education Institutions in Shanxi (No. 2021L006 and 2021L014).References
- J. J. Li, T. D. Zhou, X. D. Tang, X. D. Chen, M. Zhang, X. P. Zheng, C. S. Wang and C. L. Deng, J. Anal. Appl. Pyrolysis, 2019, 140, 444–451 CrossRef CAS.
- Z. Y. Liu, Y. H. Li, F. H. Yu, J. Zhu and L. Xu, Chem. Eng. Sci., 2019, 199, 417–425 Search PubMed.
- Y. M. Zhang, L. Huang, X. C. Zhang, G. G. Sun, S. Q. Gao and S. Zhang, Energy Fuels, 2017, 31, 7438–7444 CrossRef CAS.
- Z. S. Zhang, H. F. Bei, H. Li, X. G. Li and X. Gao, Energy Fuels, 2017, 31, 2538–2547 CrossRef CAS.
- T. Y. Xing, A. Alvarez-Majmutov, R. Gieleciak and J. W. Chen, Energy Fuels, 2019, 33, 11135–11144 CrossRef CAS.
- M. Yilgin, N. Duranay and D. Pehlivan, Energy Convers. Manage., 2010, 51, 1060–1064 CrossRef CAS.
- J. X. Yang, J. Rizkiana, W. B. Widayatno, S. Karnjanakom, M. Kaewpanha, X. G. Hao, A. Abudula and G. Q. Guan, Energy Convers. Manage., 2016, 120, 422–429 CrossRef CAS.
- S. Uçar and S. Karagöz, Fuel, 2014, 137, 85–93 CrossRef.
- T. R. Carlson, Y. T. Cheng, J. Jae and G. W. Huber, Energy Environ. Sci., 2011, 4, 145–161 RSC.
- J. W. Wang, X. D. Tang, J. J. Li, L. Dai, G. Z. Deng and Z. Q. Zhang, Fuel Process. Technol., 2022, 238, 107522 CrossRef CAS.
- W. M. Chen, S. K. Shi, J. Zhang, M. Z. Chen and X. Y. Zhou, Energy Convers. Manage., 2016, 112, 41–48 CrossRef CAS.
- X. F. Zhu, Y. M. Zhang, H. Z. Ding, L. R. Huang and X. F. Zhu, Energy Convers. Manage., 2018, 168, 178–187 CrossRef CAS.
- P. Lahijani, Z. A. Zainal, A. R. Mohamed and M. Mohammadi, Bioresour. Technol., 2013, 138, 124–130 CrossRef CAS PubMed.
- A. Ephraim, D. P. Minh, D. Lebonnois, C. Peregrina, P. Sharrock and A. Nzihou, Fuel, 2018, 231, 110–117 CrossRef CAS.
- Q. Zhang, Q. F. Li, L. X. Zhang, Z. L. Yu, X. L. Jing, Z. Q. Wang, Y. T. Fang and W. Huang, Energy, 2017, 134, 301–310 CrossRef CAS.
- Li. H. Song, Z. H. Li, D. X. Zhang, D. Liu, P. P. Wu and Q. Y. Li, Energy Convers. Manage., 2017, 148, 1225–1232 CrossRef CAS.
- I. Johannes, L. Tiikma and H. Luik, J. Anal. Appl. Pyrolysis, 2014, 104, 341–352 CrossRef.
- L. Chen, S. Z. Wang, H. Y. Meng, Z. Q. Wu and J. Zhao, Appl. Therm. Eng., 2017, 111, 834–846 CrossRef CAS.
- N. K. Akancha and R. K. Singh, J. Energy Inst., 2019, 92, 933–946 CrossRef CAS.
- X. Xie, Y. Zhao, P. H. Qiu, D. Lin, J. Qian, H. M. Hou and J. T. Pei, Fuel, 2018, 216, 521–530 CrossRef CAS.
- Q. A. Xiong, Y. M. Zhang, Y. J. Huang, J. Z. Li and W. Zhang, Fuel, 2022, 324, 124650 CrossRef CAS.
- Q. W. Qin, J. S. Zhou, L. T. Zhou and Q. H. Guo, J. Energy Inst., 2022, 100, 213–224 CrossRef CAS.
- S. Ni, C. Li, M. Y. Chai, Md. M. Rahman, Y. K. Li, M. Sarker and R. H. Liu, Renewable Energy, 2021, 175, 936–951 CrossRef.
- C. Dorado, C. A. Mullen and A. A. Boateng, Appl. Catal., B, 2015, 162, 338–345 CrossRef CAS.
- X. Y. Li, H. F. Zhang, J. Li, L. Su, J. N. Zuo, S. Komarneni and Y. J. Wang, Appl. Catal., A, 2013, 455, 114–121 CrossRef CAS.
- H. Y. Zhang, J. L. Nie, R. Xiao, B. S. Jin, C. Q. Dong and G. M. Xiao, Energy Fuels, 2014, 28, 1940–1947 CrossRef CAS.
- F. Nie, D. He, J. Guan, X. Q. Li, Y. Hong, L. F. Wang, H. A. Zheng and Q. M. Zhang, Fuel, 2018, 224, 726–739 CrossRef CAS.
- R. Gao, B. H. Dou, Q. H. Chang, J. L. Xu, Z. H. Dai, G. S. Yu and F. C. Wang, Fuel, 2020, 267, 117078 CrossRef CAS.
- Y. Zhao, L. Liu, P. H. Qiu, X. Xie, X. Y. Chen, D. Lin and S. Z. Sun, Fuel Process. Technol., 2015, 155, 144–152 CrossRef.
- X. Q. He, X. F. Liu, B. S. Nie and D. Z. Song, Fuel, 2017, 206, 555–563 CrossRef CAS.
- J. V. Ibarra, E. Muñoz and R. Moliner, Org. Geochem., 1996, 24, 725–735 CrossRef CAS.
- Y. Q. Wu, S. Y. Wu, J. Gu and J. S. Gao, Process Saf. Environ. Prot., 2009, 87, 323–330 CrossRef CAS.
| This journal is © The Royal Society of Chemistry 2024 |

