
 Open Access Article
 This Open Access Article is licensed under a Creative Commons Attribution-Non Commercial 3.0 Unported Licence
Robust and predictive 3D-QSAR models for predicting the activities of novel oxadiazole derivatives as multifunctional anti-Alzheimer agents†
Yekai Sun‡
a,
Zirou Zhang‡a,
Menghao Wena,
Fangfang Wang *a,
Xiuling Li*a,
Wei Yang*bcd and
Bo Zhoue
*a,
Xiuling Li*a,
Wei Yang*bcd and
Bo Zhoue
aSchool of Life Science, Linyi University, Linyi, 276000, China. E-mail: yu100288@163.com
bNational Clinical Research Center for Infectious Diseases, Shenzhen Third People's Hospital, 518112, Shenzhen, China
cShenzhen Clinical Research Center for Tuberculosis, Shenzhen, People's Republic of China
dWarshel Institute for Computational Biology, School of Science and Engineering, The Chinese University of Hong Kong, 518172, Shenzhen, China
eState Key Laboratory of Functions and Applications of Medicinal Plants, College of Basic Medical, Guizhou Medical University, Guizhou, 550004, China
First published on 23rd September 2024
Abstract
In recent years, Alzheimer disease (AD) as a neurodegenerative disorder has been increasing annually with the aging of the global population, therefore, development of novel anti-AD drugs is imperative. Studies have proven that glycogen synthase kinase-3β (GSK-3β) is a pivotal factor in the development of AD. Therefore, GSK-3β inhibitors would provide powerful means to treat the disorders, such as AD. To in-depth study the structure–activity relationship of a series of oxadiazole derivatives as multifunctional anti-Alzheimer agents, computational three dimensional quantitative structure–activity relationship (3D-QSAR) studies, molecular docking and molecular dynamics were conducted. The comparative molecular field analysis (CoMFA) and comparative molecular similarity indices analysis (CoMSIA) methods were conducted to build up the 3D-QSAR models, and exhibited significant results (Rcv2 = 0.692, Rpred2 = 0.6885/CoMFA, Rcv2 = 0.696, Rpred2 = 0.6887/CoMSIA). The accuracy of the 3D-QSAR models was validated by external validation and applicability domain analysis. The derived contour maps provided structural information for designing novel compounds to improve the inhibitory activities. Additionally, molecular docking and molecular dynamics were also employed to investigate the bonding interactions and stability of this series of inhibitors in the active site of GSK-3β, and the results revealed that the importance of residues Ile62, Asn64 Val70, Tyr128, Val129 and Leu182 for ligand binding to the receptor GSK-3β. All the results would be of great help for the discovery of new GSK-3β agents that can solve the problem of AD.
1 Introduction
Alzheimer disease (AD) was first described by the German psychiatrist Alois Alzheimer in 1906 with clinical symptoms such as progressive memory loss, cognitive impairment, executive dysfunction, and behavioral change.1 Evidence has proven that the annual incidence of AD appears to increase with age, from approximately 53 new cases per 1000 people between age 65 and 74 to 231 new cases per 1000 people over 85.2 Additionally, the average life expectancy is three to nine years after the diagnosis of AD, and the World Health Organization (WHO) has reported that AD was the seventh leading cause of death in 2019.3 Unfortunately, there is no cure for this disease so far.Research has proven that the etiology of AD is considered to be multifactorial, a few cases are caused by familial origin, most cases are linked to environmental factors.4 The most relevant histopathological hallmark for AD is characterized by two aberrant structures: senile plaques (SP) and neurofibrillary tangles (NFTs).5 The β-amyloid peptide (Aβ) is regarded as the most relevant factor for SP.6 The main component of NFT is the microtubule-associated protein tau, which can be aberrantly hyperphosphorylated.7 Relevant studies have shown that the glycogen synthase kinase 3β (GSK-3β) is mainly responsible for the modification of tau protein 8.
GSK-3 is a Ser/Thr kinase that is originally found in mammals, two GSK-3 isoforms GSK-3α and GSK-3β are encoded by different genes, but possess 85% homology.9 Although GSK-3β is widely expressed in all tissues, the highest levels are in the brain, neurons, and developing brains.10 Nowadays, the structure of GSK-3β co-crystallized with different inhibitors has been solved by X-ray crystallography; the crystal structure of GSK-3β shows that this protein is composed of 433 amino acids with a mass of 48![[thin space (1/6-em)]](https://www.rsc.org/images/entities/char_2009.gif) 034 Da. Furthermore, this protein is comprised by the N-terminal domain (a β-strand domain contains residues from 25 to 138 with some antiparallel strands), C-terminal domain (with α-helical domain from residue 136 to 343), and kinase domain (the ATP binding site is located at the interface between the glycine-rich loop and the hinge domain).11 Researches have validated that GSK-3β can phosphorylate 15 site on tau protein: Ser46, Thr50, Thr175, Thr181, Ser199, Ser202, Thr205, Thr212, Thr217, Thr231, Ser235, Ser396, Ser400, Ser404, and Ser413, further confirming the relationship between GSK-3β and AD.12
034 Da. Furthermore, this protein is comprised by the N-terminal domain (a β-strand domain contains residues from 25 to 138 with some antiparallel strands), C-terminal domain (with α-helical domain from residue 136 to 343), and kinase domain (the ATP binding site is located at the interface between the glycine-rich loop and the hinge domain).11 Researches have validated that GSK-3β can phosphorylate 15 site on tau protein: Ser46, Thr50, Thr175, Thr181, Ser199, Ser202, Thr205, Thr212, Thr217, Thr231, Ser235, Ser396, Ser400, Ser404, and Ser413, further confirming the relationship between GSK-3β and AD.12
In addition, a large body of evidence suggests the significant role of GSK-3β in the AD pathogenesis. The first proof was presented in 1988, the enzymatic activity from a partially purified fraction of brain extracts was demonstrated to generate paired helical filaments-like epitopes on tau protein 13. The automated high-throughput fluorescence imaging systems were also used to study GSK-3β, and the result indicated that an abnormal increase in GSK-3β activity, further led to disturbances in β-secretase localization and extensive Aβ secretion.14 Additionally, the mouse model has proven that GSK-3β could reduce Aβ, improve Aβ-induced behavioral performance, and reduce neuronal loss.15 Therefore, it is imperative to develop more efficient GSK-3β inhibitors to cure AD.
To date, different fundamental options can be employed to inhibit GSK-3β, such as competitive metal inhibitors, non-ATP competitive inhibitors, ATP-competitive inhibitors, peptide inhibition, and substrate competitive inhibitors. Some groups have been endeavoring to synthesize novel GSK-3β derivatives with improved inhibitory activities.16–32 However, it is time-consuming and material redundant for the synthesis of novel compounds. Conversely, energy will be saved when the structural information is obtained prior to in vivo experiment. Therefore, comparative molecular field analysis (CoMFA) and comparative molecular similarity indices analysis (CoMSIA) approaches were carried out upon a series of novel synthesized oxadiazole derivatives with GSK-3β inhibitory activities. Furthermore, molecular docking and molecular dynamics (MD) analyses were employed to investigate the detailed binding mode of ligand–receptor interactions. The whole analyses would provide a useful platform for the prediction of the activities of novel oxadiazole derivatives and aid the design of new chemical entities with enhanced GSK-3β inhibitory activities.
2 Experiments and methods
2.1. Dataset
In this work, the employed oxadiazole derivatives were chosen from ref. 33, and the inhibitory activity is expresses as IC50. To construct predictive 3D-QSAR models, IC50 (μM) values are converted to the corresponding pIC50 (−logIC50), and employed as dependent variable in the QSAR analyses. To develop and validate the models, the whole dataset is initially divided into training set and test set according to the usual guidelines (the test compounds should be representative of structural diversity and uniformly span over the whole range of activity). The structures and activities of the compounds are shown in Table 1.
|
|||||||
|---|---|---|---|---|---|---|---|
| Compound | A | R1 | R2 | R3 | R4 | R5 | pIC50 (μM) |
| a Test set. | |||||||
| 1 |  |
4-OCH3 | — | — | OCF3 | — | 4.8128 |
| 2 |  |
4-C(CH3)3 | — | — | OCF3 | — | 5.1158 |
| 3 |  |
5-NO2 | — | — | OCF3 | — | 5.0799 |
| 4 |  |
4-COCH3 | — | — | OCF3 | — | 5.9914 |
| 5 |  |
2-COF3 | — | — | OCF3 | — | 5.9172 |
| 6 |  |
3-CF3 | — | — | OCF3 | — | 5.5800 |
| 7* |  |
3-NHCOCH3 | — | — | OCF3 | — | 5.6635 |
| 8 |  |
4-OCF3 | — | — | OCF3 | — | 5.0585 |
| 9* |  |
4-F, 5-Cl | — | — | OCF3 | — | 4.7224 |
| 10 |  |
4-F | — | — | OCF3 | — | 5.5702 |
| 11 |  |
4-Br | — | — | OCF3 | — | 5.5058 |
| 12 |  |
— | — | — | OCF3 | — | 5.1175 |
| 13 |  |
5-COOCH3 | — | — | OCF3 | — | 5.9245 |
| 14a |  |
5-Cl | — | — | OCF3 | — | 5.5258 |
| 15a |  |
4-C(CH3)3 | — | — | F | CF3 | 5.4056 |
| 16 |  |
4-C(CH3)3 | — | — | — | Cl | 6.7212 |
| 17 |  |
4-C(CH3)3 | — | — | C(CH3)3 | — | 6.2518 |
| 18 |  |
4-C(CH3)3 | — | — | CF3 | — | 5.8268 |
| 19 |  |
4-C(CH3)3 | — | — | F | F | 5.8794 |
| 20 |  |
4-C(CH3)3 | — | — | CH2CH3 | — | 5.4895 |
| 21 |  |
4-C(CH3)3 | F | — | Cl | — | 5.5452 |
| 22a |  |
4-C(CH3)3 | — | — | OCH3 | — | 5.0048 |
| 23 |  |
4-C(CH3)3 | — | — | CH(CH3)2 | — | 5.684 |
| 24a |  |
4-C(CH3)3 | CH3 | — | — | — | 5.6402 |
| 25 |  |
4-C(CH3)3 | — | — | CH3 | — | 5.3410 |
| 26 |  |
4-C(CH3)3 | — | CH3 | — | — | 6.0269 |
2.2. Calculation of molecular descriptors
To improve the performance of the 3D-QSAR models, several molecular descriptors were calculated by dragon software. Zero-, one-, two-, three-dimensional descriptors and others can be computed, such as constitutional, topological, walk and path counts, connectivity indices, information indices, 2D autocorrelations, edge adjacency indices, Burden eigenvalues, topological charge indices, eigenvalue-based indices, Randic molecular profiles, geometrical, RDF (Radial Distribution Functions), 3D-MoRSE (3D-Molecular Representation of Structure based on Electron diffraction), WHIM (Weighted Holistic Invariant Molecular descriptors), GETAWAY (Geometry, Topology and Atoms-Weighted AssemblY), functional group counts, atom-centred fragments, charge descriptors, and molecular properties.34 In this way, the total number of calculated molecular descriptors for the whole set under analysis results in 1664 variables. However, not all the calculated descriptors would be taken into account for constructing the QSAR models, thus some descriptors would be removed according to the following criteria: (1) those with the same values; (2) descriptors containing 95% zero values.2.3. 3D-QSAR analysis
Various studies have indicated that molecular alignment and bioactive conformation selection are significant factors in developing 3D-QSAR models.35 The accuracy of the models and the reliability of the contour maps depends mainly on the result of alignment. In this work, two different alignment rules are employed: template ligand-based alignment (alignment I) and docking-based alignment (alignment II). For alignment I, the most active compound 16 is selected as template and all other molecules are aligned on the common substructures (colored as blue, listed in Fig. 1A) using the “Align database” function, and the result is shown in Fig. 1B. For alignment II, all compounds are docked into the ligand binding pocket of the receptor, and the docked conformations are used for constructing the QSAR models. The statistical results show that the models based on alignment II are not as good as alignment I, therefore, the template ligand-based models are mainly discussed in the present work.
 | ||
| Fig. 1 (A) The template compound 16, the common substructure is shown in blue. (B) The result for template ligand-based alignment. | ||
For CoMSIA,38 a distance dependent Gaussian type functional form is introduced, thus it can avoid singularities at the atomic positions and dramatic changes of potential energy. Five CoMSIA fields (steric, electrostatic, hydrophobic, hydrogen bond donor and hydrogen bond acceptor) are used to develop the CoMSIA models. The sp3 carbons with a van der Waals of 1 Å, charge +1, hydrophobicity +1, hydrogen bond donating +1, and hydrogen bond accepting +1 are used as probe atom at every lattice point of the grid box to generate different fields.39 In addition, Gaussian functions controlled by the value of attenuation factor (is set by default to 0.3) are used to determine the distance between the compound atoms and the probe atoms.40
To validate the predictive ability of the derived models, the activities of the test set are predicted, and the external predictive correlation coefficient (Rpred2) is defined by the following equation:
 | (1) |
2.4. Applicability domain (AD)
In general, the utility of a QSAR model mainly depends on the predictive ability for novel compounds. Therefore, the domain of applicability must be calculated, which is defined through the degree of similarity of the predicted molecule to those in the training set.42,43 When the compound is located within the applicability domain, the model would be regarded as reliable. Several methods can be employed to compute the AD, such as: ranges in the descriptor spaces, geometrical methods, probability density distribution, distance-based methods, range of response variable, and miscellaneous. In the present study, the AD is calculated through the following link: http://dtclab.webs.com/softwaretools or http://teqip.jdvu.ac.in/QSAR_Tools/.2.5. Molecular docking
Molecular docking is a method that can be implemented to study the interactions of compounds with the receptor at the molecular level. In this work, Autodock software was utilized for molecular docking experiments. The X-ray crystal structure of GSK-3β (PDB ID: 3F88) was retrieved from the RCSB PDB database (https://www.rcsb.org/). Initially, the crystallized ligands and water molecules were removed from the protein, polar hydrogen atoms and Kollman charges were calculated. The 3D grid was generated using the AutoGrid algorithm to evaluate ligand-receptor interactions energy.44 The grid map was created at 60 Å in all dimensions (X, Y, Z) with a default grid space size of 0.375 Å. In addition, the co-crystallized ligand was regarded as a reference inhibitor for molecular docking. After docking, the conformations with the lowest energy were collected to construct the docking-based 3D-QSAR models.To validate the performance of molecular docking, the re-docking procedure was carried out on the co-crystallized ligand. The root means square deviation (RMSD) was calculated between the crystal structure and the docked conformation. The result shows that the RMSD value is smaller than 2 Å, suggesting that the molecular docking is reliable, and the parameters can be employed to dock the oxadiazole derivatives to the active site of GSK3β.45
2.6. Molecular dynamics
Based on the docking results, the scaffold of the most potent compound 16 and the lowest compound 09 was further investigated in MD using AMBER.46 The AMBER 19SB force field was used to describe the protein, while the General Amber Force Field (GAFF) parameter and restrained electrostatic potential (RESP) charges were applied to the ligands.47 Each ligand–receptor complex was neutralized using counter ions (Na+ and Cl−) and immersed in a box of TIP3P48 water molecules with a margin distance of 16 Å.The systems were energetically minimized using a multistep process involving 10000 steps of the steepest descent method followed by 5000 steps of the conjugate gradient method. Subsequently, the systems were gradually heated from 0 to 300 K over 500 ps in the NVT ensemble to ensure that all water molecules were fully optimized. The equilibration process included 500 ps of heating, 500 ps of density equilibration with weak restraints (5 kcal mol−1), 500 ps of constant pressure (1 atm) equilibration at 300 K with a time step of 2 fs. During the MD simulation, all hydrogen atoms were constrained by SHAKE algorithm49 and the non-bonded cutoff distance was set to 16 Å. Finally, a 200 ns production run with 3 replicates was conducted, and the trajectories were sampled every 10 ps.
2.7. Binding free energy calculations
The free energy of ligands binding to the receptor GSK3β was calculated by the molecular mechanics-Poisson Boltzmann surface area (MM-PBSA) and the molecular mechanics generalized born surface region (MM-GBSA).50,51 The binding free energy (ΔGbind) is computed as follows:| ΔGbind = ΔEMM + ΔGsol − TΔS | (2) |
| ΔGNP = γSASA + β | (3) |
The SASA (represents the solvent accessible surface area) was calculated by the LCPO method,54 the parameters of γ and β are set to 0.00542 kcal mol−1·Å−2 and 0.92 kcal mol−1, respectively.55
2.8. Local principal component analysis and local free energy landscape
As a statistical technique, principal component analysis (PCA) was employed to reduce the complexity of the dynamics data and extract the stable binding pose with minimum local free energy. The PCA process was conducted on the replicates of each production phase by Gromacs v 5.11.56 In addition, the local free energy of each microstate was computed by a weighted-histogram analysis (WHAM).57 The parameters and configurations of these analyses were employed the same as in our previous published works,58–60 therefore, it is no longer described in detail here.3 Results and discussion
3.1. CoMFA and CoMSIA statistical results
To achieve a predictive model, different combinations of the fields were computed, and the results of CoMFA and the various combinations of CoMSIA fields are shown in Table S1.†According to the statistical parameters at the level of the construction phase Rcv2 and at the level of external validation Rpred2 of the model, we have selected the optimum CoMFA and CoMSIA models for analysis, as listed in Table 2. The data reveals that the Rcv2 values for CoMFA and CoMSIA models are all greater than 0.5, suggesting that the models have good internal predictive ability. The Rncv2 values are all very close to 1, indicating that the fitting degree of the models is high. In addition, the predictive correlation coefficient Rpred2 values are found to be higher than 0.5 for the test set, illustrating that the derived 3D-QSAR models are statistically significant and predictive. The correlation between actual activities and predicted activities depicted in Fig. 2, demonstrates that the predicted values are in good agreement with the experimental ones, proving that the CoMFA and CoMSIA models are reliable.
| Parameters | CoMFA | CoMSIA |
|---|---|---|
| a Rcv2 = cross-validated correlation coefficient using the leave-one-out methods; Rncv2 = non-cross-validated correlation coefficient; SEE = standard error of estimate; F = ratio of Rncv2 explained to unexplained = Rncv2/(1 − Rncv2); Rpred2 = predicted correlation coefficient for the test set of compounds; SEP = standard error of prediction; NC = optimal number of principal components; S = steric, E = electrostatic, H = hydrophobic, D = H-bond donor, A = H-bond acceptor. | ||
| Rcv2 | 0.692 | 0.696 |
| Rncv2 | 0.818 | 0.820 |
| SEE | 0.260 | 0.260 |
| F | 21.670 | 21.852 |
| Rpred2 | 0.6885 | 0.6887 |
| SEP | 0.313 | 0.312 |
| NC | 2 | 2 |
|
||
| Field contribution | ||
| S | 0.078 | — |
| E | 0.006 | 0.016 |
| H | — | 0.044 |
| D | — | 0.020 |
| A | — | — |
| RDF060p | 0.303 | 0.299 |
| Mor20e | 0.277 | 0.278 |
| Mor28m | 0.336 | 0.343 |
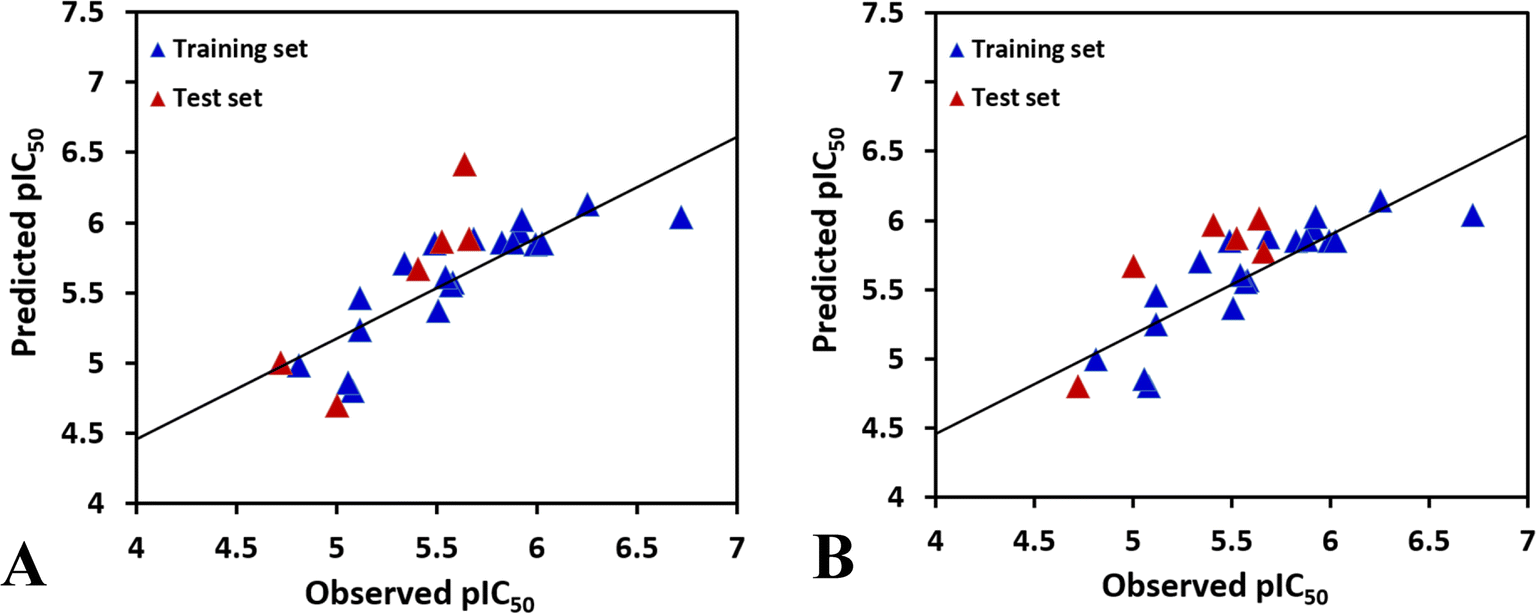 | ||
| Fig. 2 The plots of the correlations between the actual and the predicted activities. (A) CoMFA model. (B) CoMSIA model. | ||
For CoMFA model, the steric and electrostatic contributions are 7.8% and 6%, respectively, indicating that the steric field has a greater influence on the inhibitory activity. Additionally, molecular descriptors H0p (30.3%), MATS4m (27.7%), and nROH (33.6%) are introduced to improve the performance of the model.
In the CoMSIA model, the steric, electrostatic, hydrophobic, hydrogen bond donor and hydrogen bond acceptor fields interact with each other and cannot be completely independent, therefore, the five fields are randomly arranged to get different combination, as shown in Table S1.† It is obvious that the model based on electrostatic, hydrophobic and hydrogen bond donor fields gives the highest Rcv2 values of 0.696 with 2 components, relatively higher Rncv2 of 0.820, F value of 21.852, and SEE value of 0.260. The contribution of electrostatic, hydrophobic, hydrogen bond donor, RDF060p, Mor20e, and Mor28m are 1.6%, 4.4%, 2%, 29.9%, 27.8%, and 34.3%, respectively. The predictability and the reliability of the CoMSIA model is judged by external validation, the external predictive ability Rpred2 is 0.6887, indicating that this model has good predictive capacity. And the graphs of actual versus predicted inhibitory activity exhibit satisfactory linear correlation (Fig. 2B).
3.2. Contour map analysis
The contour maps of CoMFA and CoMSIA models would give the information about the favorable and unfavorable regions of the compounds. Changes in the structures according to contour map might result in the changes of the activities, therefore, the information originated from the maps can be employed to modify the compounds to improve the activity. Compound 16 with the potent activity was chosen to illustrate the contour maps using the StDev*Coeff type. or
or  at this position, and compounds 12–14 with
  group exhibit lower activity than the compound 16 with the highest activity. In addition, the R5 position is surrounded by a small yellow contour, illustrating that a minor group at this region would increase the activity. This may explain why compound 19 bearing a small group –F shows significant increased activity than compound 15 with a huge substituent –CF3.
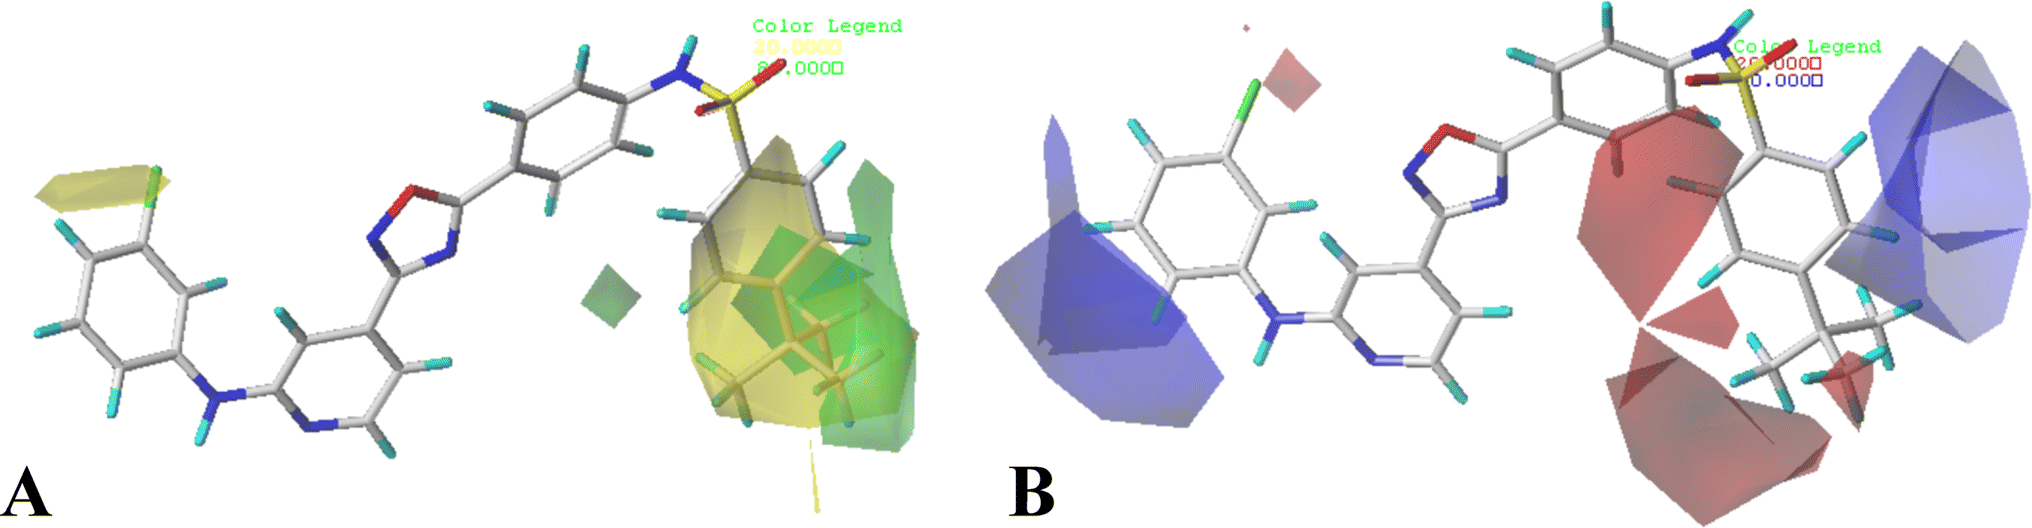 | ||
| Fig. 3 CoMFA StDev*Coeff contour plots in combination of compound 16. (A) The steric contour map, where the green and yellow contours represent 80% and 20% level contributions, respectively. (B) The electrostatic contour map, where the blue and red contours represent 80% and 20% level contributions, respectively. | ||
The CoMFA electrostatic contours indicated by blue (electropositive favored region) and red (electronegative favored region) colors are listed in Fig. 3B. A blue contour near ring A suggests that the electropositive substituent can enhance the activity. There are red and blue contours existing around R1 substituent, however, the R1 group is closer to the blue contour, further suggesting that electropositive groups are favored, and that is why the activity of compound 2 (4-C(CH3)3) is higher than that of compound 1 (4-OCH3). The presence of a blue contour around the R2 substituent also suggests electropositive group at this region would be favorable, this is in good correlation with the experimental activities. As a result of comparing the activities, the rank would be as: compound 24 (CH3) > compound 21 (F). A blue contour near the R3 position suggests the electro-donating groups on this position would benefit activity, therefore, for the most active compound, this group can be modified. In addition, a small red contour near the R5 substituent suggests that an electronegative substituent would increase the activity.
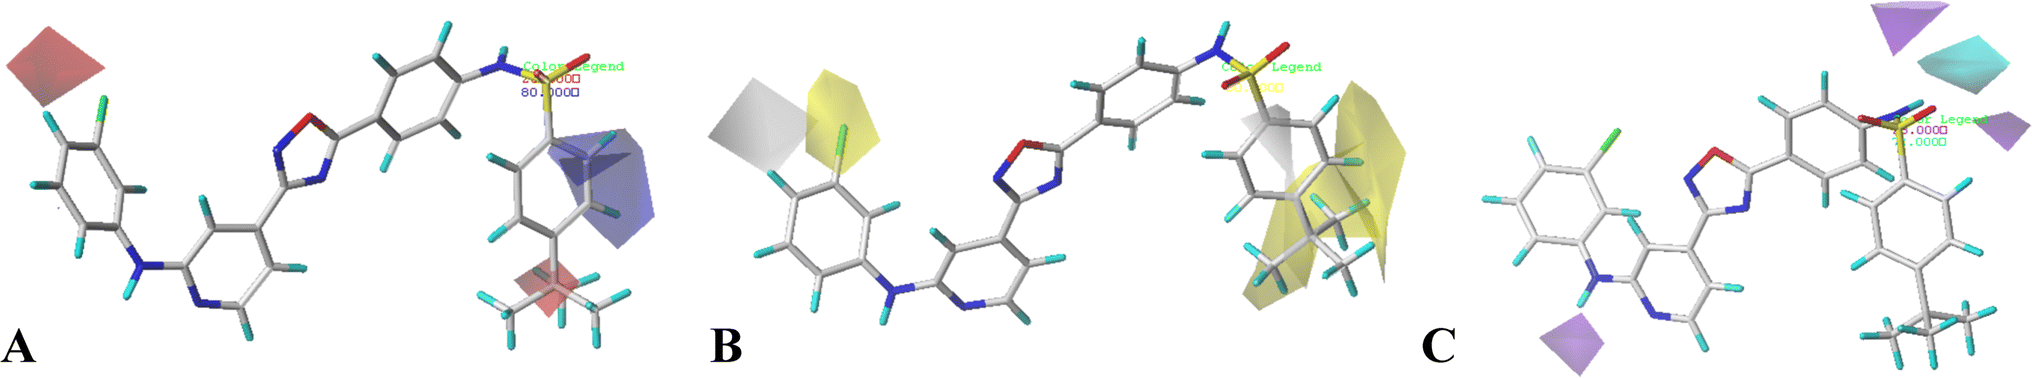 | ||
| Fig. 4 CoMSIA StDev*Coeff contour plots in combination of compound 16. (A) The electrostatic contour map, where the blue and red contours represent 80% and 20% level contributions, respectively. (B) The hydrophobic contour map, where the yellow and grey contours represent 80% and 20% level contributions, respectively. (C) The hydrogen bond donor contour map, where the cyan and purple contours represent 80% and 20% level contributions, respectively. | ||
The hydrophobic interactions are depicted by yellow and white contour maps (Fig. 4B), where the yellow and white contours represent the hydrophobic groups favored and disfavored regions. A yellow contour map is observed around R1, indicating that hydrophobic substituents are favorable for improving potency. This may explain why the activity of compound 10 with 4-F at R1 is greater than that of compound 3 with 5-NO2. Meanwhile, another yellow contour map is also located at R5 substituent, illustrating that hydrophobic groups are favorable for the activity. Additionally, a grey contour around R4 position indicates that a hydrophobic substituent would decrease the potency. This may explain why compound 4 with a relative more hydrophilic substituent –OCF3 at this position exhibits better potency than compound 18 (–CF3).
The hydrogen bond donor contour map of CoMSIA is shown in Fig. 4C, the cyan contour indicates that the activity of the compound would increase with the appearance of hydrogen bond donor group, while the purple area is the opposite. For this series of inhibitors, the substituents possess no hydrogen-bonded donor groups, thus, the contour maps are mainly distributed around the common skeleton, for example, a cyan and a purple contour are positioned at the –NH–SO2 group, and a purple contour is located at another –NH group, further illustrating that the groups at these areas can interact with the receptor to enhance the activity.
3.3. Interpretation of the molecular descriptors
It is apparent from Table 2 that the molecular descriptor RDF060p plays a significant role in affecting the inhibitory activity. This descriptor belongs to the RDF descriptors, which is weighted by atomic polarizabilities (Table 3). Studies have shown that the polarizability is connected to the chemical reactivity of a compound. Therefore, the polarizability descriptor RDF060p is significant for the inhibitory activity and allows us to assert that separation of compounds depend on the polarizability of molecules that correlated with the chemical reactivity.61| Symbol | Class | Meaning |
|---|---|---|
| RDF060p | RDF descriptors | Radial distribution function-6.0/weighted by atomic polarizabilities |
| Mor20e | 3D-MoRSE descriptors | 3D-MoRSE-signal 20/weighted by atomic Sanderson electronegativities |
| Mor28m | 3D-MoRSE descriptors | 3D-MoRSE-signal 28/weighted by atomic masses |
The next descriptor is Mor20e,62 which belong to the 3D-MoRSE descriptors (Table 3). This descriptor is defined by 3D-MoRSE-signal 20 weighted by atomic Sanderson electronegativities. Based on the compound structure interpretation, the inhibitory activity would be desirable when the atoms have higher total electronegativity, which is supported by compounds 5 and 6, the corresponding trend of inhibitory activity is: compound 5 > compound 6.
Another descriptor Mor28m belongs to the 3D-MoRSE descriptors, which is weighted by atomic masses (Table 3).63 Based on the compound structure interpretation, the inhibitory activity would be desirable when the atoms have high atomic masses, such as compound 1 (4-OCH3) and compound 2 (4-C(CH3)3) (compound 2 > compound 1). This is also in accordance with the CoMFA contour map, further validating the importance of this descriptor to the inhibitory activities.
3.4. Molecular dynamics
In the present work, all-atom molecular dynamics (MD) simulations have been conducted on the GSK3β-L09 and GSK3β-L16 systems to elucidate the binding mechanism and associated protein dynamics. Stability analyses were analyzed by calculating the root-mean-square deviation (RMSD) (Fig. 5) and root mean square fluctuation (RMSF) (Fig. 6), the curve of RMSD and RMSF confirms the reliability of the production MD trajectories. Furthermore, PCA was employed on both all heavy atoms and those proximal to the ligand binding sites to capture system dynamics and identify metastable states (Fig. 7). Fig. 7C and D illustrate the PC1 movements, indicating random fluctuations in the L12 and L21 regions for both systems. Notably, the first six beta-sheets exhibit greater rotational movements in the GSK3β-L16 system compared to GSK3β-L09. Both systems demonstrate helix 5–6 movements resembling a “Pack-man” motion. The probability-based energy landscapes reveal six metastable states (a to f, Fig. S1†). The GSK3β-L09 system exhibits more metastable states and fluctuations (Fig. S1†), suggesting less stable binding compared to GSK3β-L16, which shows only two states.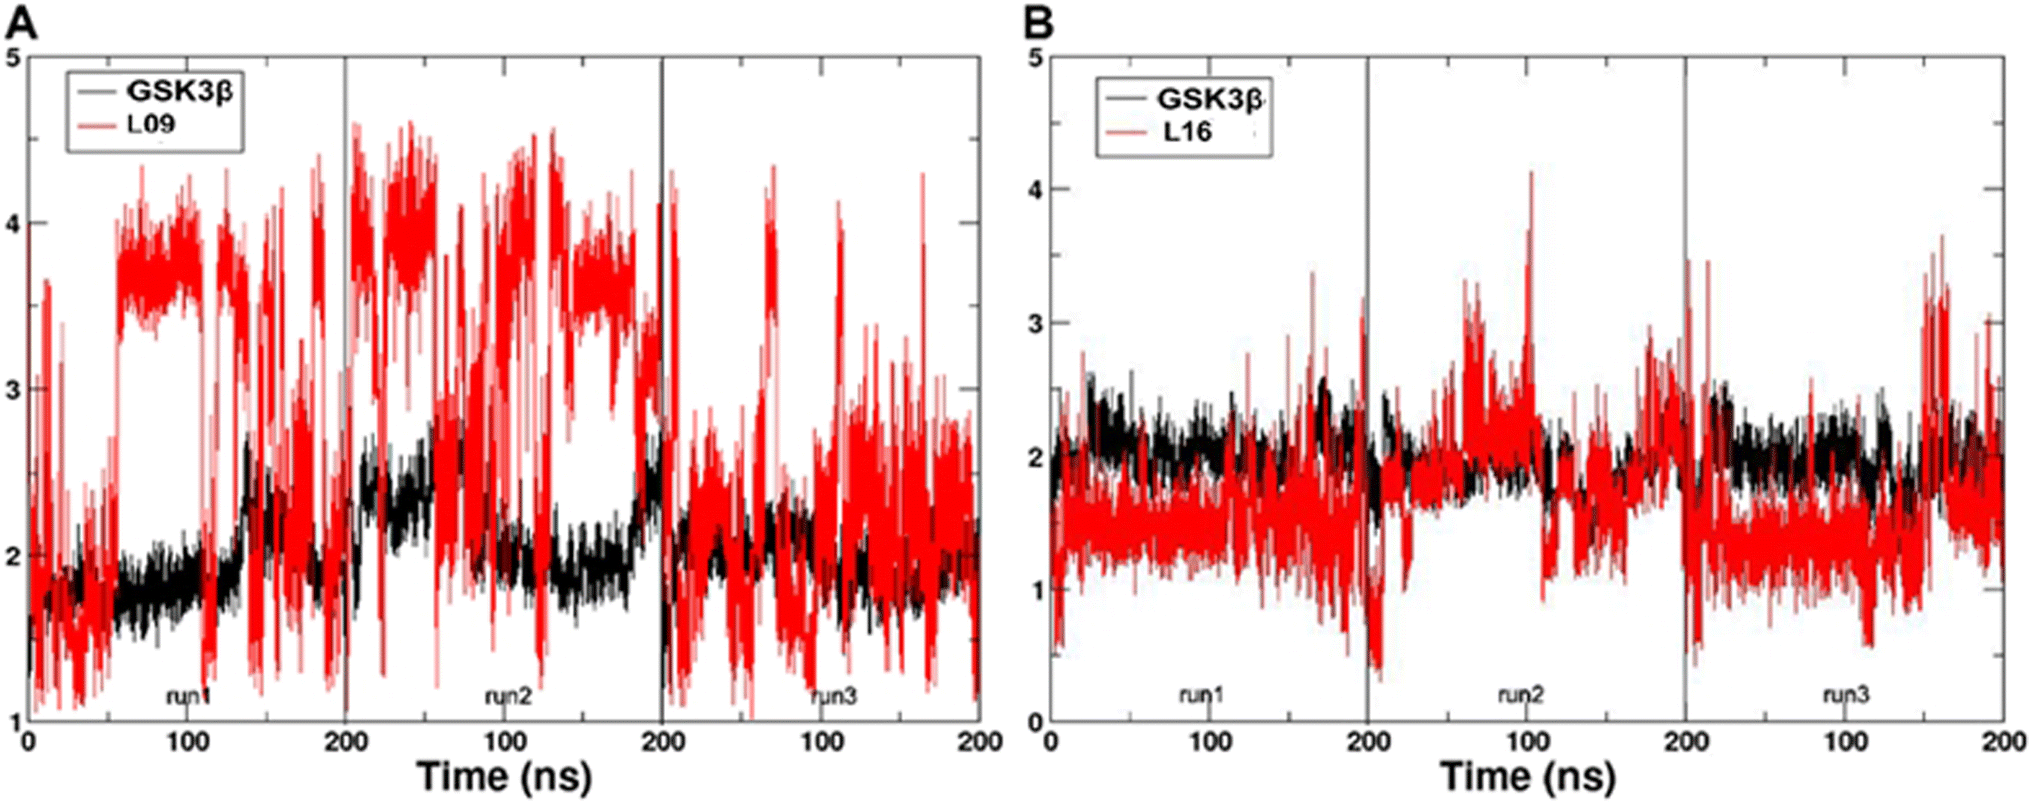 | ||
| Fig. 5 The RMSD of the backbone atoms relative to the docking structures as function of time. (A) The three replicates of GSK3β/L09. (B) The three replicates of GSK3β/L16. | ||
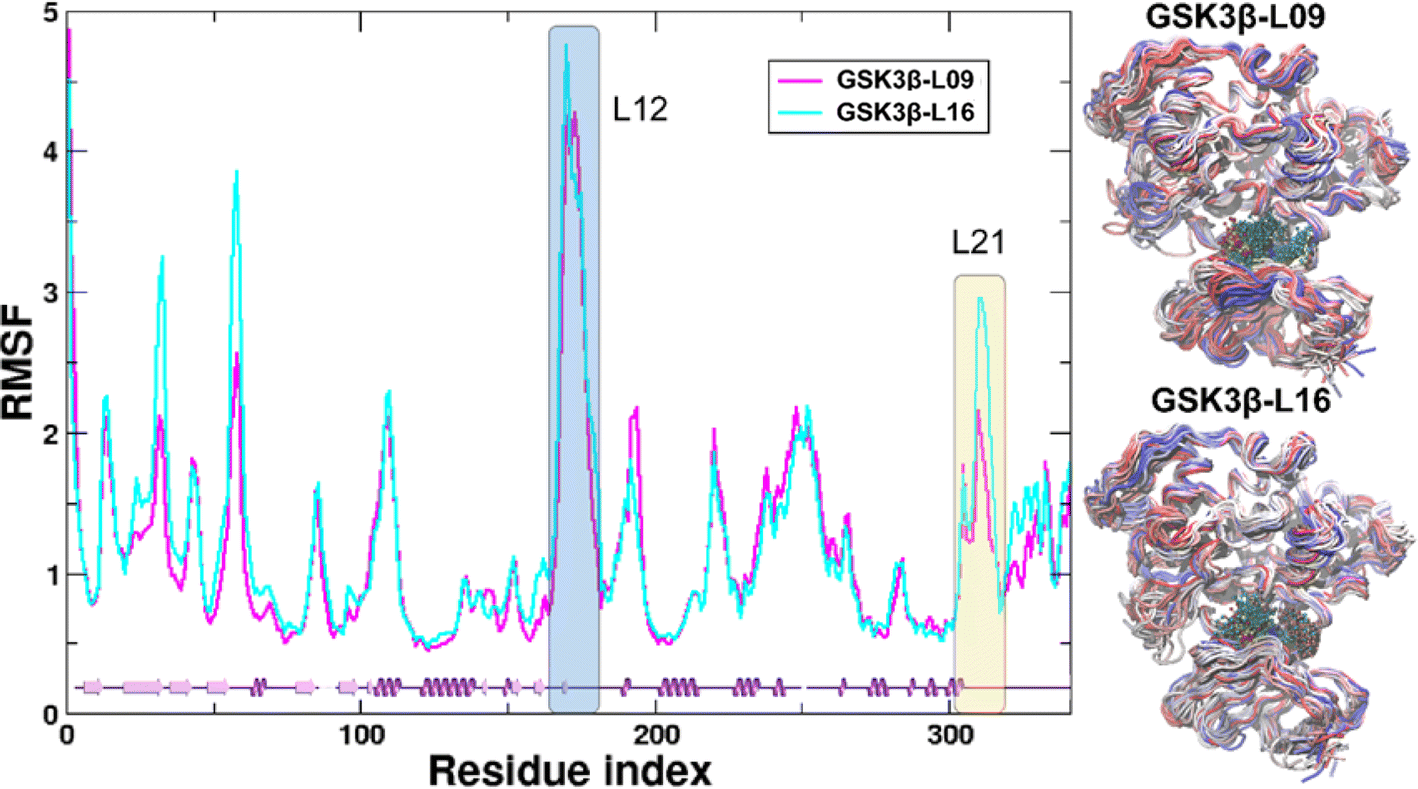 | ||
| Fig. 6 RMSF analysis of GSK3β backbone atoms. The root-mean-square fluctuation (RMSF) of the GSK3β backbone atoms in the MD systems is shown. The L12 and L21 regions are highlighted with blue and yellow shades, respectively, for clarity. The residue index starts from the first residue, Ser35. Adjacent to the RMSF panel are the overlapped structures from the MD simulation, where proteins are shown as tubes colored from red (0 ns) to blue (200 ns). Ligands are represented by balls and sticks. | ||
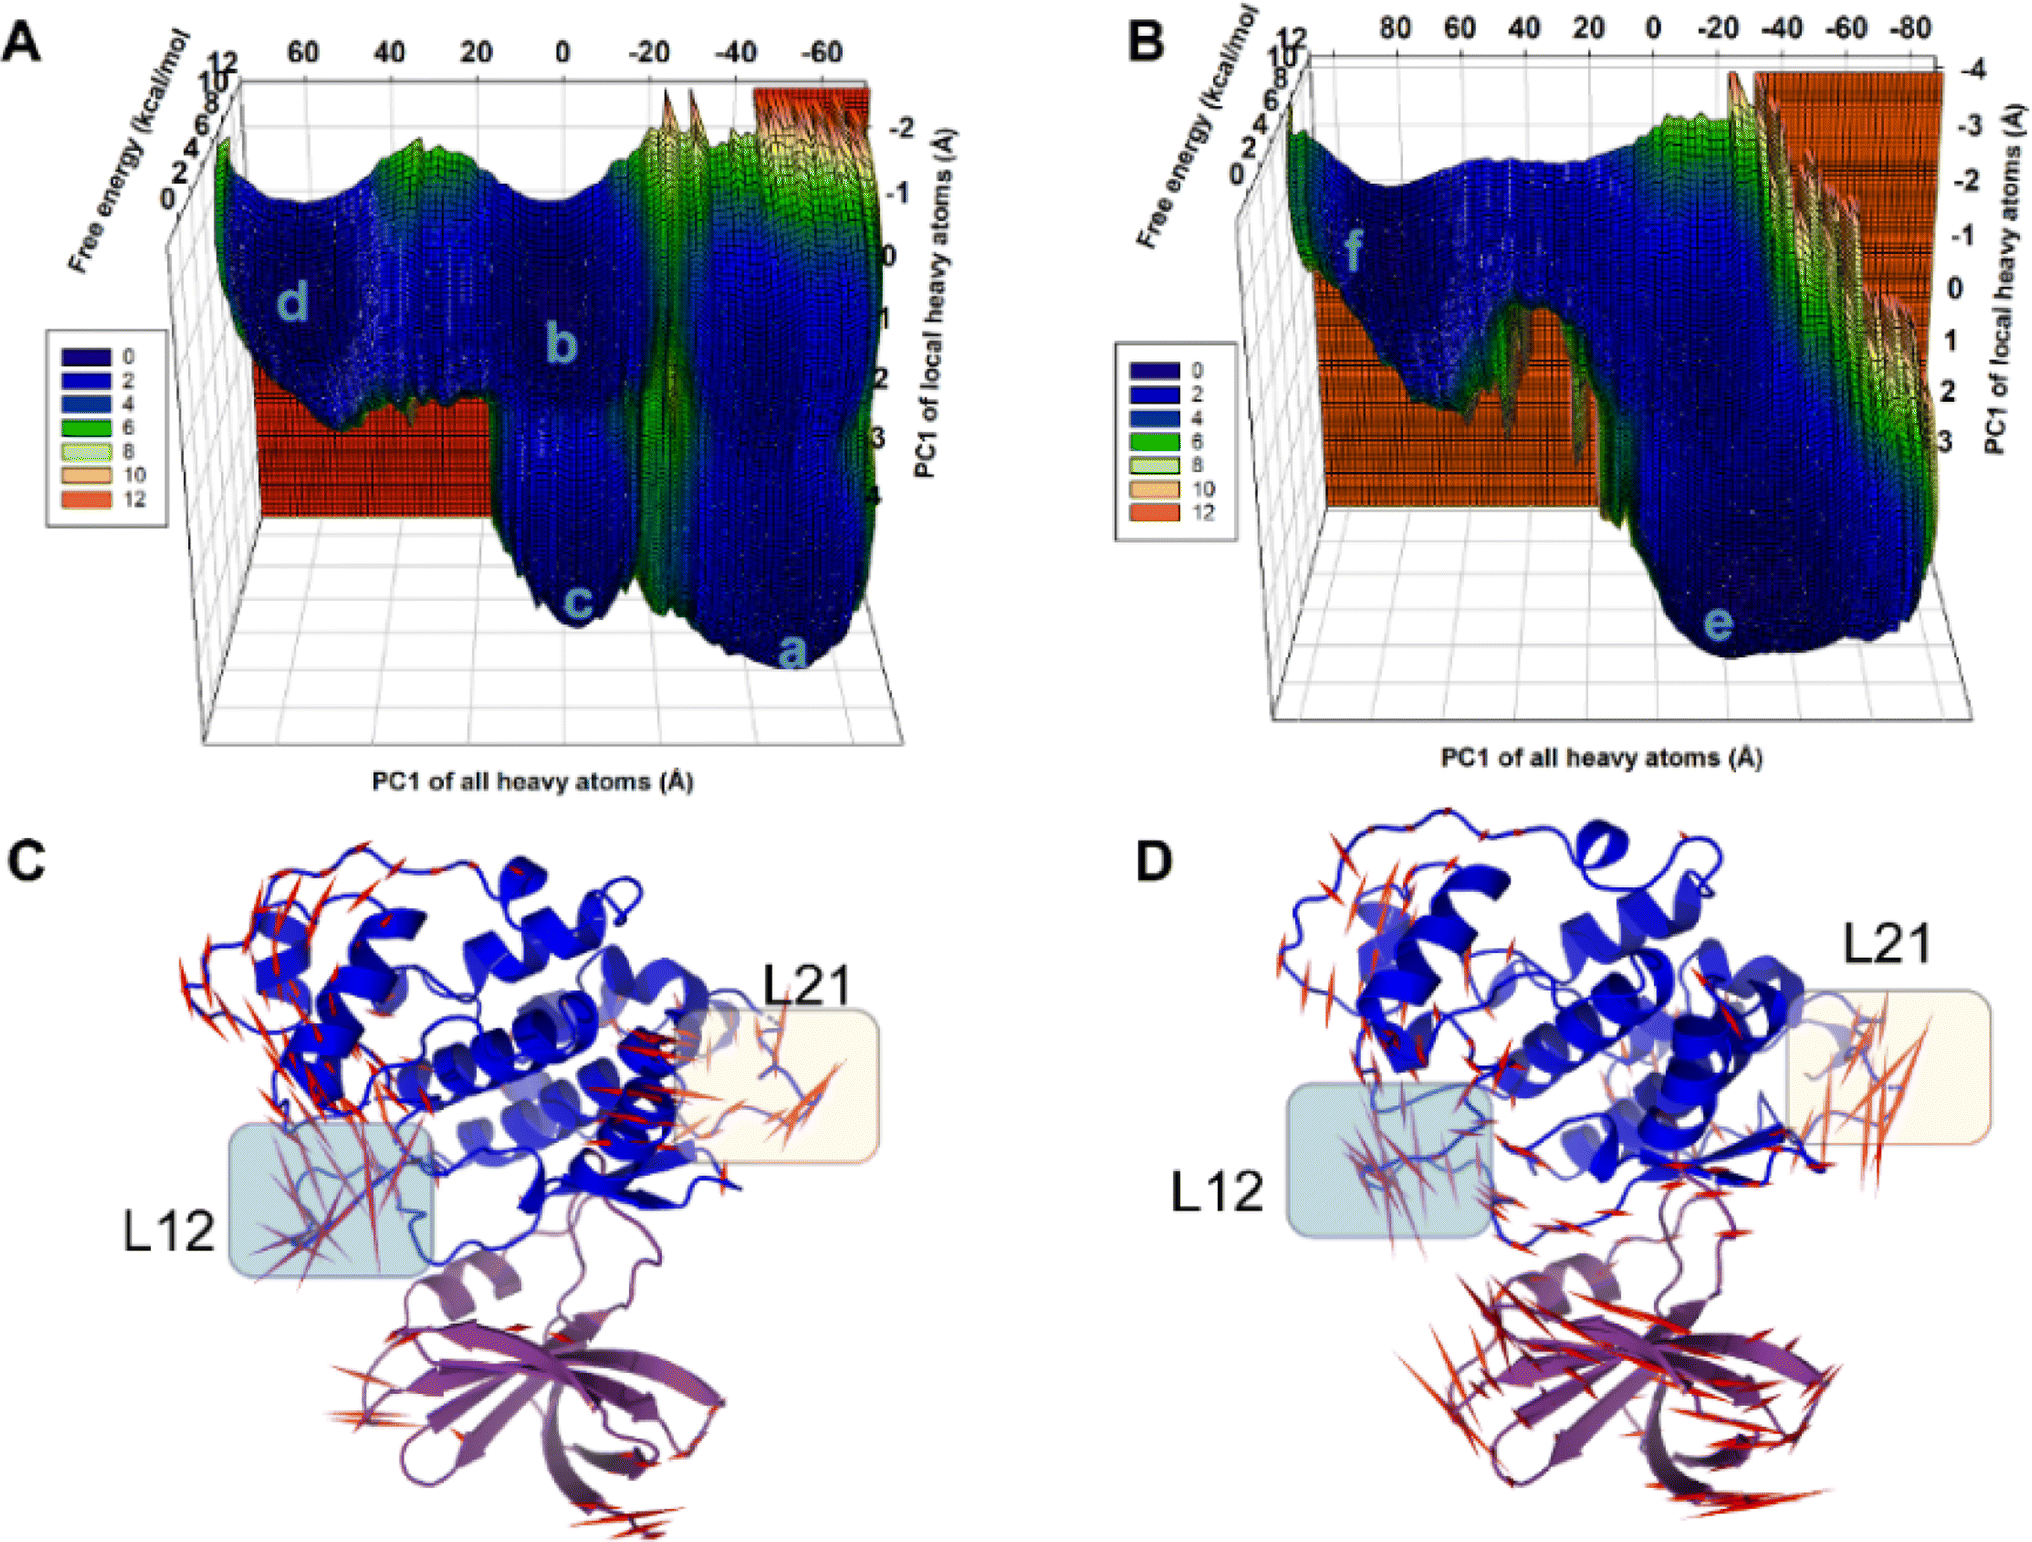 | ||
| Fig. 7 Metastable States Identified in GSK3β-L09 and GSK3β-L16 MD Systems. (A and B) Principal Component Analysis (PCA) was performed on all heavy atoms and local heavy atoms in the GSK3β-L09 and GSK3β-L16 MD simulations, identifying six metastable states. The projections of the trajectories on the same subspace reveal distinct dynamics for each system. (C and D) Porcupine plots illustrating the principal component 1 (PC1) movement in the GSK3β-L09 and GSK3β-L16 systems. Domain 1 is shown in purple, and domain 2 in blue. Red arrows indicate the scale of protein dynamics, with L12 and L21 regions highlighted for clarity. | ||
The binding analysis (Fig. 8) reveals that Region A, R1 and R4 in GSK3β-L09 displays significant movement within the binding pocket. In contrast, GSK3β-L16's Region A and R1 occupy a central position in the binding pocket, reducing fluctuations. The smaller chlorobenzene of R4 in GSK3β-L16 also remained more rigid compared to the R4 in GSK3β-L09.
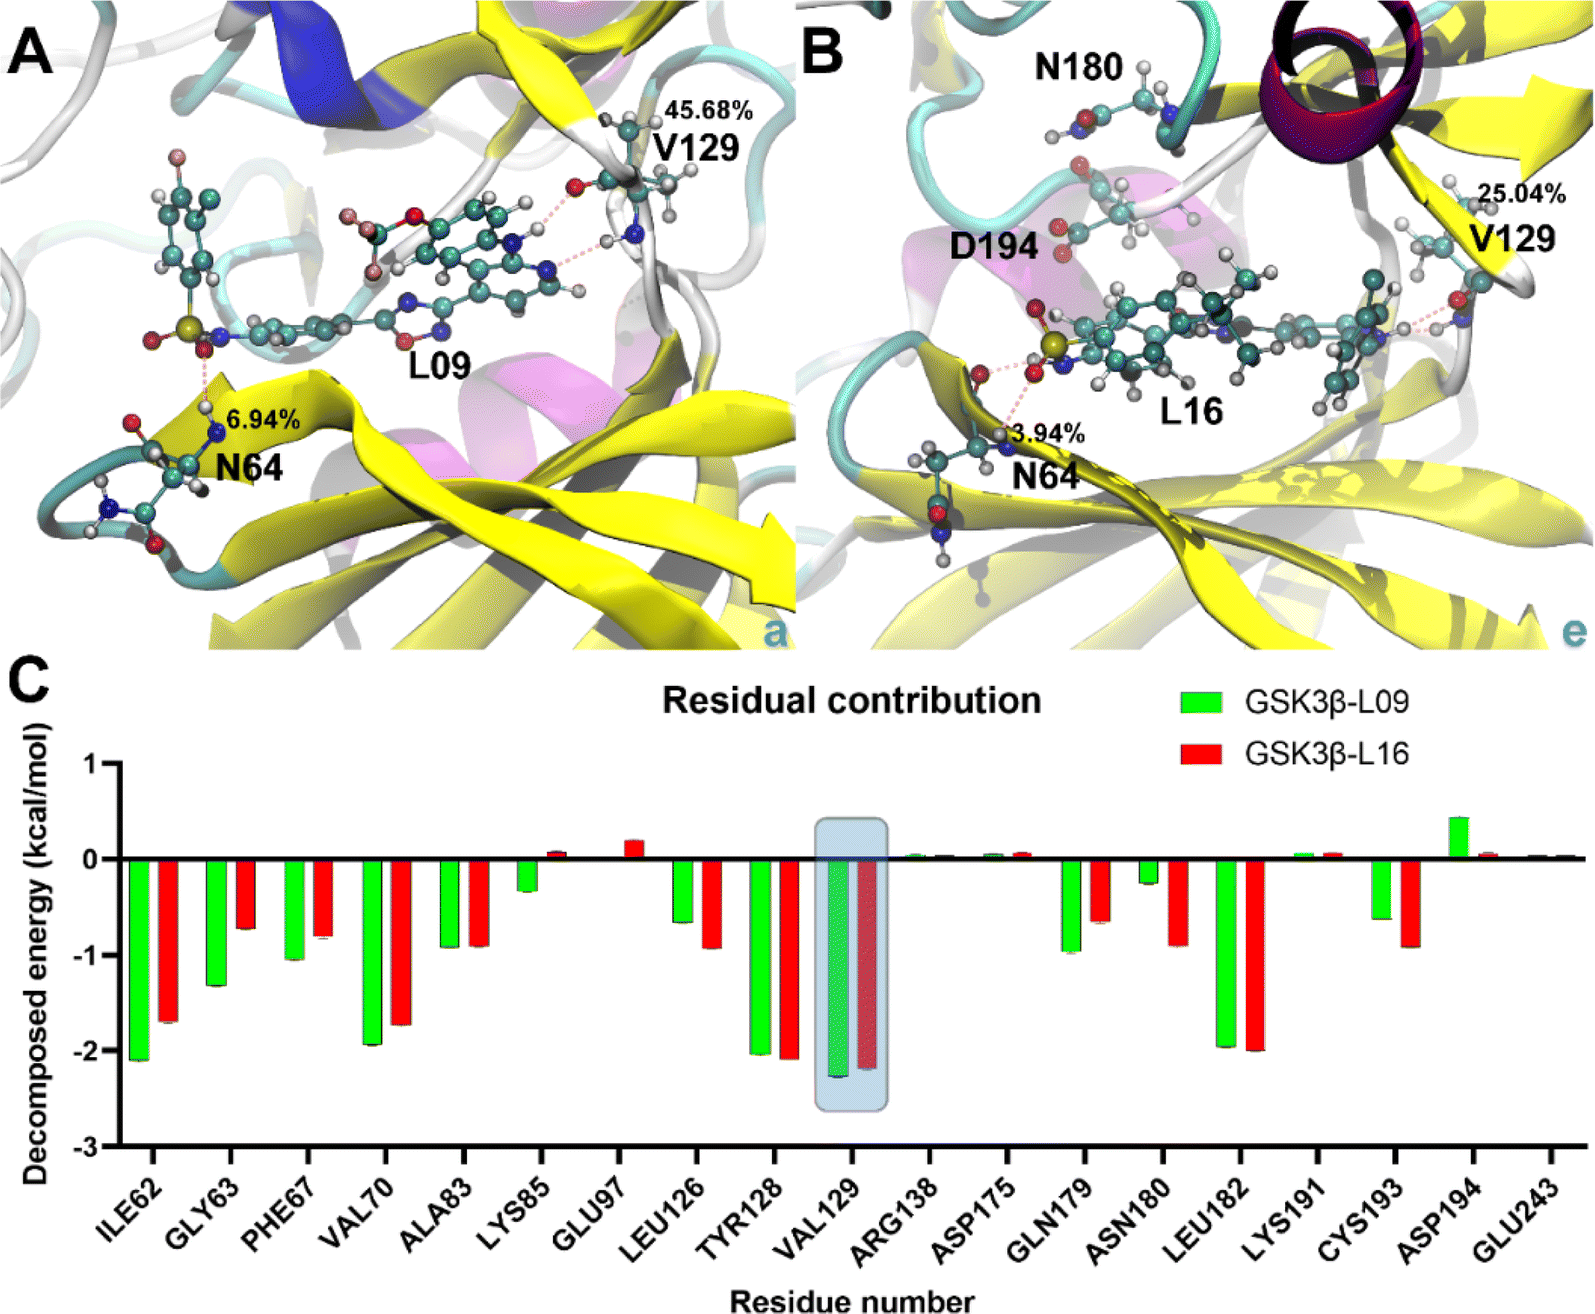 | ||
| Fig. 8 Binding poses and decomposed free energy analysis. (A and B) Binding details of the most stable states in GSK3β-L09 and GSK3β-L16 systems. Key residues and ligands are shown in ball-and-stick representation, with H-bond occupancy percentages indicated. (C) Decomposed binding free energy contributions for residues in GSK3β-L09 and GSK3β-L16 systems. The key residues refer to the top 10 positive and top 9 negative residual contributions. | ||
3.5. Binding free energy analysis
Binding energy calculations reveal that GSK3β-L16 has a tighter binding affinity (−13.44 ± 0.69 kcal mol−1 for GBSA and −7.08 ± 0.70 kcal mol−1 for PBSA) compared to GSK3β-L09 (−12.70 ± 0.54 kcal mol−1 for GBSA and −7.05 ± 0.53 kcal mol−1 for PBSA) (Table S3†), this trend is consistent with the experimental data.33 The higher fluctuations in GSK3β-L09 result in a more negative entropy contribution (−26.54 ± 0.48 kcal mol−1) compared to GSK3β-L16 (−24.77 ± 0.64 kcal mol−1).Detailed analysis of the most stable states shows similar binding patterns for both ligands. Amino acid residue Val129 consistently forms the most stable hydrogen bonds, with occupancy rates of 45.68% and 25.04% in GSK3β-L09 and GSK3β-L16, respectively (Table S4†). This residue also contributes significantly to the binding free energy (−2.26 ± 0.01 kcal mol−1 for GSK3β-L09 and −2.19 ± 0.01 kcal mol−1 for GSK3β-L16). Residues Ile62, Val70, and Leu82 also show notable contributions, particularly in the GSK3β-L09 system. The negative contribution of Cys193 in GSK3β-L09 may explain the overall lower binding free energy compared to GSK3β-L16. Additionally, the backbone hydrogen atom of Asn64 forms stable hydrogen bonds with the sulfone group in the mutual scaffold, but its energy contribution was relatively minor (−0.72 ± 0.01 kcal mol−1 for GSK3β-L09 and −0.55 ± 0.01 kcal mol−1 for GSK3β-L16).
4 Discussion and conclusion
In the present work, predictive 3D-QSAR models were constructed for novel oxadiazole derivatives targeting GSK-3β. Initially, the 3D-QSAR models were investigated by CoMFA and CoMSIA methods. Reliable CoMFA models were obtained by employing steric and electrostatic fields. In addition, when incorporating of electrostatic, hydrophobic, and hydrogen bond donor fields, better statistically meaningful CoMSIA models were constructed. On the other hand, several molecular descriptors were also employed to improve the performance of the models, results suggest that RDF descriptors and 3D-MoRSE descriptors appeared to capture sufficient structural information to correlate the inhibitory activities. The analysis of AD also shows that all the studied inhibitors fill in the defined domain for the CoMFA and CoMSIA models, further suggesting that the constructed models can be used for helping the design of novel and more potent compounds. Furthermore, the contour maps were carefully used to provide detailed structural information responsible for the inhibitory activity.Molecular docking was also performed to generate the conformations for receptor-based 3D-QSAR models and the initial conformations for subsequent MD simulations. At the same time, in order to verify the rationality of the above approaches and the findings, MD simulations and binding free energy calculations were also conducted on the potent and lowest inhibitors. Our study shows that the most active inhibitor 16 remained stable within the receptor's active pocket, with minor fluctuation in RMSD and RMSF while maintain good binding energy. Conversely, compound 09 demonstrated less stability during the MD simulation. This phenomenon is consistent with the activity of the compounds. In addition, the consistent and significant contribution of Val129 in forming stable H-bonds across both systems further underscores its critical role in ligand binding. In addition, we have observed that amino acid Val129 mainly forms hydrogen bond with atoms (–NH– and nitrogen atom) in the common skeleton, this finding is also in accordance with the hydrogen bond donor contour map (Fig. 4C), further indicating that the derived 3D-QSAR models are reliable. Furthermore, the binding analysis for the conformation derived from MD simulation also reveals that the substituents, especially Region A, R1 and R4 in compound 09 displays higher movement within the binding pocket than those in compound 16, suggesting that the binding ability of compound 16 to the receptor GSK3β is better than that of compound 09, this is in accord with the higher inhibitory activity of compound 16 when compared with compound 09. Therefore, the results obtained clearly show that the title molecule compound 16 has a great chance of becoming a template molecule for designing more active inhibitors.
To obtain more information, the residue-wise decomposed binding free energy analysis was examined using the MM-PBSA and MM-GBSA methods, the value of the free energy confirms the stability of compound 16 showing the lowest energy. And the results also reveal that amino acid residues Ile62, Val70, Tyr128, Val129 and Leu182 significantly contribute to the binding energy for GSK3β-L09 and GSK3β-L16. Furthermore, the negative contribution of Cys193 in GSK3β-L09 may account for its overall lower binding free energy compared to GSK3β-L16. Additionally, the backbone of residue Val129, serving as hydrogen bond acceptor and hydrogen bond donor, forms the main hydrogen bonds with this series of inhibitors. In addition, the hydrogen atom of Asn64, while forming stable hydrogen bonds with the sulfone group, also contributes minimally to the binding free energy in both systems. The binding free energy analysis illustrates that residues Asn64 and Val129 may be the key residues for hydrogen bonding interactions with GSK3β.
On the basis of the above results, the derived 3D-QSAR models play a significant role in understanding the relationship of physiochemical properties with structure and activity. Molecular docking, MD simulation and energy calculation confirm the binding efficiency of the employed inhibitors, and assess the conformational stability and fluctuations of receptor–inhibitor complexes. These are in good agreement with the results of the 3D-QSAR models. Overall, this generated work may provide helpful information to aid the design of novel oxadiazole derivatives with higher activity. More broadly, these studies demonstrate how present methods to enhance the inhibitory activity in novel inhibitor design.
Data availability
The datasets generated and/or analyzed during the current study are available from the corresponding author on reasonable request.Author contributions
All authors contributed to the study conception and design. Conceptualization and writing – original draft was performed by Fangfang Wang and Xiuling Li. The 3D-QSAR models were developed by Yekai Sun and Zirou Zhang. MD simulations was conducted by Wei Yang. Software and visualization was performed by Bo Zhou. All authors commented on previous versions of the manuscript. All authors read and approved the final manuscript.Conflicts of interest
The authors declare that there are no conflicts of interest.Acknowledgements
The study was supported by the National Natural Science Foundation of China (No. 32001699) and the 2024 Innovation and Entrepreneurship Training Project for College Students in Shandong Province (S202410452009).References
- D. W. Li, Z. Q. Liu, W. Chen, M. Yao and G. R. Li, Association of glycogen synthase kinase-3β with Parkinson's disease, Mol. Med. Rep., 2014, 9, 2043–2050 CrossRef CAS.
- A. s. Association, Alzheimer's disease facts and figures, Alzheimer's Dementia, 2012, 8, 131–168 CrossRef.
- WHO. World Health Organization (WHO)-The Top 10 Causes of Death, 2021 Search PubMed.
- K. Blennow, M. J. de Leon and H. Zetterberg, Alzheimer's disease, Lancet, 2006, 368, 387–403 CrossRef CAS.
- A. Alzheimer, Über eigenartige Krankheitsfälle des späteren Alters, Z. Gesamte Neurol. Psychiatr., 1911, 4, 356–385 CrossRef.
- C. L. Masters, G. Multhaup, G. Simms, J. Pottgiesser, R. Martins and K. Beyreuther, Neuronal origin of a cerebral amyloid: neurofibrillary tangles of Alzheimer's disease contain the same protein as the amyloid of plaque cores and blood vessels, EMBO J., 1985, 4, 2757–2763 CrossRef CAS PubMed.
- I. Grundke-Iqbal, K. Iqbal, Y.-C. Tung, M. Quinlan, H. M. Wisniewski and L. I. Binder, Abnormal phosphorylation of the microtubule-associated protein tau (tau) in Alzheimer cytoskeletal pathology, Proc. Natl. Acad. Sci. U. S. A., 1986, 83, 4913–4917 CrossRef CAS.
- M. Saitoh, J. Kunitomo, E. Kimura, H. Iwashita, Y. Uno and T. Onishi, et al., 2-{3-[4-(Alkylsulfinyl) phenyl]-1-benzofuran-5-yl}-5-methyl-1, 3, 4-oxadiazole derivatives as novel inhibitors of glycogen synthase kinase-3β with good brain permeability, J. Med. Chem., 2009, 52, 6270–6286 CrossRef CAS.
- J. R. Woodgett, Molecular cloning and expression of glycogen synthase kinase-3/factor A, EMBO J., 1990, 9, 2431–2438 CrossRef CAS.
- M. Takahashi, K. Tomizawa and K. Ishiguro, Distribution of tau protein kinase I/glycogen synthase kinase-3β, phosphatases 2A and 2B, and phosphorylated tau in the developing rat brain, Brain Res., 2000, 857, 193–206 CrossRef CAS.
- E. ter Haar, J. T. Coll, D. A. Austen, H.-M. Hsiao, L. Swenson and J. Jain, Structure of GSK3β reveals a primed phosphorylation mechanism, Nat. Struct. Biol., 2001, 8, 593–596 CrossRef CAS PubMed.
- A. Fuster-Matanzo, M. Llorens-Martín, J. Jurado-Arjona, J. Avila and F. Hernández, Tau protein and adult hippocampal neurogenesis, Front. Neurosci., 2012, 6, 104 CAS.
- K. Ishiguro, Y. Ihara, T. Uchida and K. Imahori, A novel tubulin-dependent protein kinase forming a paired helical filament epitope on tau, J. Biochem., 1988, 104, 319–321 CrossRef CAS.
- A. Rampa, S. Gobbi, R. M. Concetta Di Martino, F. Belluti and A. Bisi, Dual BACE-1/GSK-3β inhibitors to combat Alzheimer's disease: a focused review, Curr. Top. Med. Chem., 2017, 17, 3361–3369 CrossRef CAS.
- A. Petit-Paitel, GSK-3beta: a central kinase for neurodegenerative diseases?, Med. Sci., 2010, 26, 516–521 Search PubMed.
- W. J. Ryves and A. J. Harwood, Lithium inhibits glycogen synthase kinase-3 by competition for magnesium, Biochem. Biophys. Res. Commun., 2001, 280, 720–725 CrossRef CAS PubMed.
- W. J. Ryves, R. Dajani, L. Pearl and A. J. Harwood, Glycogen synthase kinase-3 inhibition by lithium and beryllium suggests the presence of two magnesium binding sites, Biochem. Biophys. Res. Commun., 2002, 290, 967–972 CrossRef CAS PubMed.
- A. Gómez-Ramos, J. Domínguez, D. Zafra, H. Corominola, R. Gomis and J. J. Guinovart, et al., Sodium tungstate decreases the phosphorylation of tau through GSK3 inactivation, J. Neurosci. Res., 2006, 83, 264–273 CrossRef.
- M. Arfeen, R. Patel, T. Khan and P. V. Bharatam, Molecular dynamics simulation studies of GSK-3β ATP competitive inhibitors: understanding the factors contributing to selectivity, J. Biomol. Struct. Dyn., 2015, 33, 2578–2593 CrossRef.
- M. Leost, C. Schultz, A. Link, Y. Z. Wu, J. Biernat and E. M. Mandelkow, et al., Paullones are potent inhibitors of glycogen synthase kinase-3β and cyclin-dependent kinase 5/p25, Eur. J. Biochem., 2000, 267, 5983–5994 CrossRef CAS.
- P. Sivaprakasam, X. Han, R. L. Civiello, S. Jacutin-Porte, K. Kish and M. Pokross, et al., Discovery of new acylaminopyridines as GSK-3 inhibitors by a structure guided in-depth exploration of chemical space around a pyrrolopyridinone core, Bioorg. Med. Chem. Lett., 2015, 25, 1856–1863 CrossRef CAS.
- P. Patel and J. R. Woodgett, Glycogen synthase kinase 3: a kinase for all pathways?, Curr. Top. Dev. Biol., 2017, 123, 277–302 CAS.
- E. Tolosa, I. Litvan, G. U. Höglinger, D. Burn, A. Lees and M. V. Andrés, et al., A phase 2 trial of the GSK-3 inhibitor tideglusib in progressive supranuclear palsy, Mov. Disord., 2014, 29, 470–478 CrossRef CAS PubMed.
- G. U. Höglinger, H. J. Huppertz, S. Wagenpfeil, M. V. Andrés, V. Belloch and T. León, et al., Tideglusib reduces progression of brain atrophy in progressive supranuclear palsy in a randomized trial, Mov. Disord., 2014, 29, 479–487 CrossRef CAS PubMed.
- M. Hamann, D. Alonso, E. Martín-Aparicio, A. Fuertes, M. J. Pérez-Puerto and A. Castro, et al., Glycogen synthase kinase-3 (GSK-3) inhibitory activity and structure–activity relationship (SAR) studies of the manzamine alkaloids. Potential for Alzheimer's disease, J. Nat. Prod., 2007, 70, 1397–1405 CrossRef CAS.
- G. M. Silva, M. P. Barcelos, J. G. C. Poiani, L. I. d. S. Hage-Melim and C. H. T. d. P. da Silva, Allosteric modulators of potential targets related to Alzheimer's Disease: a Review, ChemMedChem, 2019, 14, 1467–1483 CrossRef CAS PubMed.
- G.-f. Zeng, S.-h. Zong, Z.-y. Zhang, S.-w. Fu, K.-k. Li and Y. Fang, et al., The role of 6-gingerol on inhibiting amyloid β protein-induced apoptosis in PC12 cells, Rejuvenation Res., 2015, 18, 413–421 CrossRef CAS PubMed.
- E. J. Gong, H. R. Park, M. E. Kim, S. Piao, E. Lee and D.-G. Jo, et al., Morin attenuates tau hyperphosphorylation by inhibiting GSK3β, Neurobiol. Dis., 2011, 44, 223–230 CrossRef CAS PubMed.
- T.-Y. Lin, Y.-W. Lin, C.-W. Lu, S.-K. Huang and S.-J. Wang, Berberine inhibits the release of glutamate in nerve terminals from rat cerebral cortex, PLoS One, 2013, 8, e67215 CrossRef CAS.
- Z. Cai, C. Wang and W. Yang, Role of berberine in Alzheimer's disease, Neuropsychiatric Dis. Treat., 2016, 2509–2520 CrossRef CAS.
- R. Zhao, X. Liu, L. Zhang, H. Yang and Q. Zhang, Current progress of research on neurodegenerative diseases of salvianolic acid B, Oxid. Med. Cell. Longev., 2019, 2019 Search PubMed.
- C.-M. Chong, H. Su, J.-J. Lu and Y. Wang, The effects of bioactive components from the rhizome of Salvia miltiorrhiza (Danshen) on the characteristics of Alzheimer's disease, Chin. Med., 2019, 14, 19 CrossRef.
- M. Wang, T. Liu, S. Chen, M. Wu, J. Han and Z. Li, Design and synthesis of 3-(4-pyridyl)-5-(4-sulfamido-phenyl)-1, 2, 4-oxadiazole derivatives as novel GSK-3β inhibitors and evaluation of their potential as multifunctional anti-Alzheimer agents, Eur. J. Med. Chem., 2021, 209, 112874 CrossRef CAS.
- V. Consonni and R. Todeschini Molecular Descriptors for Chemoinformatics: Volume I: Alphabetical Listing/Volume II: Appendices, References, John Wiley & Sons, 2009 Search PubMed.
- S. J. Cho and A. Tropsha, Cross-validated R2-guided region selection for comparative molecular field analysis: a simple method to achieve consistent results, J. Med. Chem., 1995, 38, 1060–1066 CrossRef CAS PubMed.
- R. D. Cramer, D. E. Patterson and J. D. Bunce, Comparative molecular field analysis (CoMFA). 1. Effect of shape on binding of steroids to carrier proteins, J. Am. Chem. Soc., 1988, 110, 5959–5967 CrossRef CAS PubMed.
- M. Clark, R. D. Cramer III and N. Van Opdenbosch, Validation of the general purpose tripos 5.2 force field, J. Comput. Chem., 1989, 10, 982–1012 CrossRef CAS.
- G. Klebe, U. Abraham and T. Mietzner, Molecular similarity indices in a comparative analysis (CoMSIA) of drug molecules to correlate and predict their biological activity, J. Med. Chem., 1994, 37, 4130–4146 CrossRef CAS.
- U. Chaube, D. Chhatbar and H. Bhatt, 3D-QSAR, molecular dynamics simulations and molecular docking studies of benzoxazepine moiety as mTOR inhibitor for the treatment of lung cancer, Bioorg. Med. Chem. Lett., 2016, 26, 864–874 CrossRef CAS.
- P. K. Balasubramanian, A. Balupuri, C. G. Gadhe and S. J. Cho, 3D QSAR modeling study on 7-aminofuro [2, 3-c] pyridine derivatives as TAK1 inhibitors using CoMFA and COMSIA, Med. Chem. Res., 2015, 24, 2347–2365 CrossRef CAS.
- S. Rännar, F. Lindgren, P. Geladi and S. Wold, A PLS kernel algorithm for data sets with many variables and fewer objects. Part 1: Theory and algorithm, J. Chemom., 1994, 8, 111–125 CrossRef.
- K. Roy, S. Kar and P. Ambure, On a simple approach for determining applicability domain of QSAR models, Chemom. Intell. Lab. Syst., 2015, 145, 22–29 CrossRef CAS.
- D. Gadaleta, G. F. Mangiatordi, M. Catto, A. Carotti and O. Nicolotti, Applicability domain for QSAR models: where theory meets reality, Int. J. Quant. Struct.-Prop. Relat., 2016, 1, 45–63 Search PubMed.
- G. M. Morris, D. S. Goodsell, R. S. Halliday, R. Huey, W. E. Hart and R. K. Belew, et al., Automated docking using a Lamarckian genetic algorithm and an empirical binding free energy function, J. Comput. Chem., 1998, 19, 1639–1662 CrossRef CAS.
- A. F. Kramer, S. Hahn, N. J. Cohen, M. T. Banich, E. McAuley and C. R. Harrison, et al., Ageing, fitness and neurocognitive function, Nature, 1999, 400, 418–419 CrossRef CAS PubMed.
- D. A. Case, H. M. Aktulga, K. Belfon, I. Ben-Shalom, S. R. Brozell, D. S. Cerutti, et al., Amber 2021, University of California, San Francisco, 2021 Search PubMed.
- J. Wang, R. M. Wolf, J. W. Caldwell, P. A. Kollman and D. A. Case, Development and testing of a general amber force field, J. Comput. Chem., 2004, 25, 1157–1174 CrossRef CAS PubMed.
- W. L. Jorgensen, J. Chandrasekhar, J. D. Madura, R. W. Impey and M. L. Klein, Comparison of simple potential functions for simulating liquid water, J. Chem. Phys., 1983, 79, 926–935 CrossRef CAS.
- J.-P. Ryckaert, G. Ciccotti and H. J. Berendsen, Numerical integration of the cartesian equations of motion of a system with constraints: molecular dynamics of n-alkanes, J. Comput. Phys., 1977, 23, 327–341 CrossRef CAS.
- P. A. Kollman, I. Massova, C. Reyes, B. Kuhn, S. Huo and L. Chong, et al., Calculating structures and free energies of complex molecules: combining molecular mechanics and continuum models, Acc. Chem. Res., 2000, 33, 889–897 CrossRef CAS PubMed.
- J. Wang, W. Wang, P. A. Kollman and D. A. Case, Antechamber: an accessory software package for molecular mechanical calculations, J. Am. Chem. Soc., 2001, 222, 2001 Search PubMed.
- T. Hou, K. Chen, W. A. McLaughlin, B. Lu and W. Wang, Computational analysis and prediction of the binding motif and protein interacting partners of the Abl SH3 domain, PLoS Comput. Biol., 2006, 2, e1 CrossRef PubMed.
- A. Onufriev, D. Bashford and D. A. Case, Modification of the generalized Born model suitable for macromolecules, J. Phys. Chem. B, 2000, 104, 3712–3720 CrossRef CAS.
- J. Weiser, P. S. Shenkin and W. C. Still, Approximate atomic surfaces from linear combinations of pairwise overlaps (LCPO), J. Comput. Chem., 1999, 20, 217–230 CrossRef CAS.
- R. B. Hermann, Theory of hydrophobic bonding. II. Correlation of hydrocarbon solubility in water with solvent cavity surface area, J. Phys. Chem., 1972, 76, 2754–2759 CrossRef CAS.
- M. J. Abraham, T. Murtola, R. Schulz, S. Páll, J. C. Smith and B. Hess, et al., GROMACS: High performance molecular simulations through multi-level parallelism from laptops to supercomputers, SoftwareX, 2015, 1, 19–25 CrossRef.
- F. Marinelli, F. Pietrucci, A. Laio and S. Piana, A kinetic model of trp-cage folding from multiple biased molecular dynamics simulations, PLoS Comput. Biol., 2009, 5, e1000452 CrossRef PubMed.
- F. Wang, W. Yang, R. Li, Z. Sui, G. Cheng and B. Zhou, Molecular description of pyrimidine-based inhibitors with activity against FAK combining 3D-QSAR analysis, molecular docking and molecular dynamics, Arab. J. Chem., 2021, 14, 103144 CrossRef CAS.
- F. Wang, W. Yang and B. Zhou, Studies on the antibacterial activities and molecular mechanism of GyrB inhibitors by 3D-QSAR, molecular docking and molecular dynamics simulation, Arab. J. Chem., 2022, 15, 103872 CrossRef CAS.
- F. Wang, W. Yang, H. Liu and B. Zhou, Identification of the structural features of quinazoline derivatives as EGFR inhibitors using 3D-QSAR modeling, molecular docking, molecular dynamics simulations and free energy calculations, J. Biomol. Struct. Dyn., 2022, 40, 11125–11140 CrossRef CAS.
- C. Onişor, M. Palage and C. Sârbu, Modeling of chromatographic lipophilicity indices of quaternary ammonium and nitrone derivatives and their thiazolic salts using molecular descriptors, Anal. Lett., 2010, 43, 1132–1148 CrossRef.
- R. Todeschini and V. Consonni, Handbook of Molecular Descriptors, John Wiley & Sons, 2008 Search PubMed.
- J. Gasteiger, J. Sadowski, J. Schuur, P. Selzer, L. Steinhauer and V. Steinhauer, Chemical information in 3D space, J. Chem. Inf. Comput. Sci., 1996, 36, 1030–1037 CrossRef CAS.
Footnotes |
| † Electronic supplementary information (ESI) available. See DOI: https://doi.org/10.1039/d4ra05342g |
| ‡ These authors contributed equally to this work. |
| This journal is © The Royal Society of Chemistry 2024 |