
 Open Access Article
 This Open Access Article is licensed under a Creative Commons Attribution-Non Commercial 3.0 Unported Licence
In situ confined encapsulation of ultrafine Fe2O3 nanoclusters in N/S co-doped graphene-based membranes for continuous chemical conversion†
Yude Ke *a,
Zixuan Fanb and
Jingwen Maoa
*a,
Zixuan Fanb and
Jingwen Maoa
aInstitute of Oceanic and Environmental Chemical Engineering, State Key Lab Breeding Base of Green Chemical Synthesis Technology, Zhejiang University of Technology, Hangzhou 310014, China. E-mail: keyude7072@163.com
bKey Laboratory of Bioinorganic and Synthetic Chemistry of Ministry of Education, School of Chemistry, Sun Yat-Sen University, Guangzhou 510000, P. R. China
First published on 18th September 2024
Abstract
Membranes with catalytic function can provide an effective approach for simultaneously transforming reactants to industrial chemicals and separation. However, rational design of stable and high-quality catalytic membranes with controlled structure remains a big challenge. We report a strategy for in situ confined encapsulation of ultrafine Fe2O3 nanoclusters in nitrogen and sulfur co-doped graphene-based membranes for continuous chemical conversion. By manipulation of the active ferric catalytic center and surrounding coordination atoms in doped rGO nanosheets, multiple coordination structures were provided to achieve improved catalytic properties. Angstrom-level confined interlayer structure (∼8 Å) was constructed by external pressurization of Fe/NS-rGO nanosheets on membrane substrate, and the adsorption energy of 4-nitrophenol (4-NP) molecule between Fe/NS-rGO layers was much stronger than that in traditional nanometer-level confined space due to extra interactions, achieving the catalytic efficiency with a high Turnover Frequency (TOF) value (1596.0 h−1). The prepared ultrathin Fe/NS-rGO catalytic membrane also exhibited excellent water flux and rejection rate for small dye molecules, as well as long-term separation activity toward naphthol green B (NgB) for at least 130 h. The progress offers a viable route to the rational design of high-quality catalytic membranes with tailored structures and properties for wide applications.
Introduction
The chemical industry that produces biochemical and petrochemical products shows vital importance in the global economy. Chemical reactions and separation are two main processes in the chemical industry, however, high energy consumption becomes a major focus of attention in the chemical product design, especially the required separation processes.1–4 Catalysis on membranes, also called catalytic membrane technology, has attracted more and more attention due to their simultaneous action of catalysis and separation, which is essential in overcoming the challenge of high energy consumption in chemical industry.5,6 Some interesting explorations have been attempted for immobilization of metal-based nanocrystals on the surface and pores of the membrane matrix, which offered a specific possibility for enhancing access of reactants to catalytic sites and synchronously achieving efficient chemical transformations.7,8 However, two main issues hinder their widespread utilization and further development. One is low efficiency in catalytic conversion and separation due to the lack of control on active catalytic sites and thick active layers of membranes. Another one is the unfavorable interactions between metal nanocrystals and membrane materials, which makes synthesized nanocrystals detach from the membrane during filtration, leading to a sharp decrease in performance.9,10 Therefore, rational design and fabrication of stable and high-quality catalytic membranes with precise microstructure control is important and urgent.Recently, confinement catalysis has attracted considerable attention due to its ability to control the electronic and structural properties of active catalytic centers at nano or sub-nano precision by changing coordination surroundings.11,12 Compared with confinement catalytic reactions at the nanometer scale, confined catalysis at angstrom-level has been theoretically identified to achieve much higher catalytic activity on account of the specific spatial localization, effective diffusion, and strong electronic interactions.13 Although it's dramatic to implement angstrom-level confined catalysis for the chemical industry, some challenges including the random distribution of catalytic active centers and the formation of angstrom-scale channels, prevent angstrom-level confined catalysis practical application. For confinement catalysis, searching the suitable substrates is important to efficiently confine and fully expose the catalytic sites simultaneously.14 The substrate materials need to possess prominent electronic properties, stable structures, and highly exposed surfaces. Among numerous substrate materials, two-dimensional (2D) nanomaterials have good electron mobility, high conductivity, and ultrathin thickness. Laminar nanofilms constructed by 2D nanomaterials have multi-layered structures and can facilitate mass transport through nanochannels in the interlayer of laminar membranes.15–17 Moreover, the generated high capillary force in nanochannels will substantially promote mass transport.18,19 Therefore, the laminar membranes constructed by 2D nanomaterials are ideal substrates for catalytic reactions in confined spacing.
GO-based membranes have received much attention on account of the simultaneous action of pollutant rejection and photocatalytic degradation.20–22 However, GO-based membrane usually exhibits instability in water and low catalytic activity due to the weak interactions between GO and catalysts, the high mass density of the loaded metal oxide catalysts, and the random stacking of GO nanosheets.23,24 Atomic doping is an effective method for achieving new functions in synthesized materials. Co-doping of GO nanosheets with N or S results in positive effects in synergistic catalysis.25–27 The surface heteroatom doping can adjust the surface chemical state and reduce the value of Gibbs free energy, thus promoting the adsorption in the initial stage and increasing the catalytic activity of pristine catalysts. Inspired by the above, we put forward an idea to use co-doped GO-based nanosheets as the substrate to manipulate mass transfer and catalytic reaction through the confined environment between co-doped nanosheets and metal surface.
Herein, we developed a new and facile method of in situ confined encapsulation and external pressurization to prepare ultrathin graphene-based catalytic membranes by assembling Fe2O3 ultrafine nanoclusters channeled N and S co-doped reduced GO nanosheets (Fe/NS-rGO) for efficient and continuous chemical conversion (Fig. 1). Our method has three main concepts: (1) through co-doping and fast reduction, ultrafine Fe2O3 nanoclusters were in situ confined in 2D channels of Fe/NS-rGO composites. (2) The manipulation of active ferric catalytic center and surrounding coordination atoms in doped rGO nanosheets provided multiple coordination structures to achieve improved catalytic performance. (3) Angstrom-level confined interlayer structure was constructed by the external pressurization of Fe/NS-rGO on membrane substrate, and the adsorption energy of 4-nitrophenol (4-NP) molecule between Fe/NS-rGO layers was much stronger than that in traditional nanometer-level confined space. Our prepared graphene-based catalytic membranes can efficiently catalyze reactants in angstrom-level confined spacing (∼8 Å) and reject different small molecules of dye simultaneously. It is expected that the progress will offer a simple and effective approach to developing different ultrathin catalytic membranes with enhanced catalytic properties and mass transport for wide application.
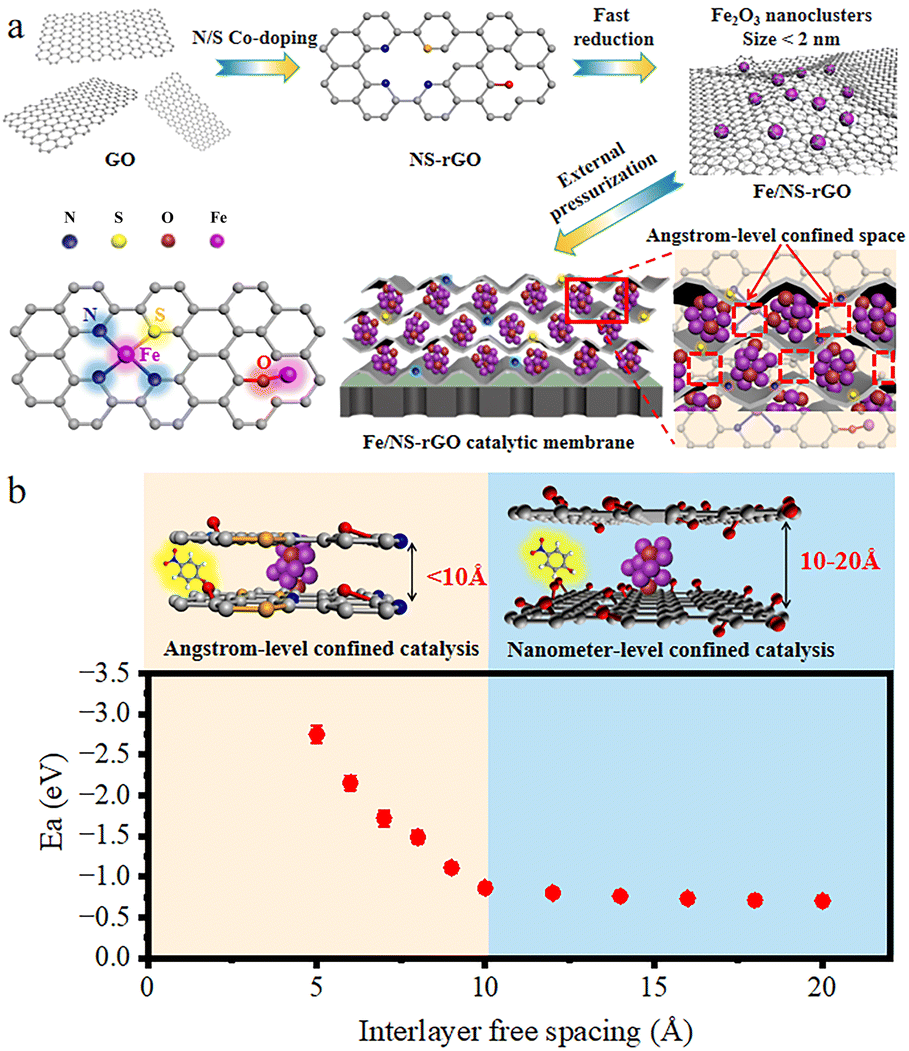 | ||
| Fig. 1 (a) Schematic diagram of the synthesized Fe/NS-rGO composite catalytic membrane via in situ confined encapsulation and external pressurization. (b) Variation of adsorption energy of 4-NP molecule between layers with different interlayer free spacing. | ||
Experimental section
Chemical materials
All chemicals and materials were used as received without further purification. NaNO3, KMnO4, H2O2, N,N-dimethylformamide (DMF), sulfuric acid (H2SO4), ammonium sulfate ((NH4)2SO4), Fe(NO3)3·9H2O, FeCl3, 4-nitrophenol (4-NP), trometamol (Tris), dopamine, sodium sulfide nonahydrate (Na2S·9H2O), sodium borohydride (NaBH4), graphite (500 mesh), polysulfone (PSF), methyl orange (MO, Mw = 327.34), reactive brilliant red (X-3B, Mw = 615.33), Congo Red (CR, Mw = 696.68), methyl blue (MB, Mw = 799.80), naphthol green B (NgB, Mw = 878.46) and Evans Blue (EB, Mw = 960.81), were purchased from the market. All the solutions used in the experiments were prepared with deionized water made by the self-made RO-EDI system. The ion concentration was monitored by IRIS Intrepid ICP and Metrohm 861 Compact IC to reach σ ≤ 0.5 μS cm−1.Synthesis of nitrogen and sulfur co-doped graphene oxide (NS-rGO) nanosheets
GO nanosheets were prepared by an improved Hummer's method.28 Firstly, 1.5 g NaNO3 and 1.5 g natural graphite flakes were dispersed into 46 mL concentrated sulfuric acid in an ice bath, and then 6 g KMnO4 was slowly put into the suspension under stirring to prevent the temperature from exceeding 20 °C and reacted for 2 h. The suspension was heated to 35 °C for 1 h. Then, 92 mL H2O was slowly added to the mixed solution drop by drop. Subsequently, the suspension was kept at 98 °C for 0.5 h to get a bright yellow solution. The mixture was treated with 6 mL 30% H2O2 solution after cooling. Finally, the product was washed and dried at 80 °C overnight.N and S co-doped graphene oxide (NS-rGO) nanosheets were prepared by a facile condensation reflow method. 0.1 g GO and 0.025 g (NH4)2SO4 were dissolved in 100 mL deionized water and heated at 60 °C for 2 h at reflux. The solution was stratified and centrifuged for further use. Sulfur-doped GO (S-rGO) nanosheets were prepared similarly by dissolving 0.1 g GO and 0.0454 g Na2SO4·9H2O and performing a reflux operation, and nitrogen-doped GO (N-rGO) were prepared similarly using different non-metallic sources.
Preparation of Fe/NS-rGO catalytic membrane
A certain volume of co-doped NS-rGO solution was introduced into 100 mL of deionized water. After sonication, 50 μL FeCl3 solution was added to the mixed solution and sonicated for another 10 min. Finally, 200 μL of 0.1 M NaBH4 solution was put in the mixed solution and sonicated for 10 min. Before preparation of the catalytic membrane, the dopamine-coated PSF substrate was fabricated as reported. Subsequently, the suspension was deposited on the dopamine-coated PSF ultrafiltration substrate via external pressurization with a pressure of 5 bar, thus forming a thin Fe/NS-rGO membrane. The external vertical force from top to bottom facilitated these Fe/NS-rGO composite nanosheets to form an ordered and compact structure. After that, the Fe/NS-rGO catalytic membrane was naturally dried.Materials characterization
Morphology and elemental mapping of the NS-rGO nanosheets were evaluated by using a transmission electron microscopy (TEM) equipped with an energy dispersive X-ray spectrometer (EDS) analyzer (Philips CM200, model JEOLJEM 2100) operating at 300 kV. Atomic force microscope (AFM, Bioscope Catalyst Nanoscope-V, Bruker, USA) was utilized to observe the thickness and structure of the NS-rGO and GO nanoflakes. The samples were fixed on a mica sheet for measurement. Scanning electronic microscopy (SEM, HITACHI SU8010, JPN) was employed to observe the surface and cross-section morphologies of the membranes. To ensure the cross-sectional morphology of the membrane is clean and flat, it was freeze-fractured in liquid nitrogen before SEM testing. All samples were subjected to gold spray treatment for better conductivity. The crystal structures of GO and prepared membranes were examined by X-ray diffraction (XRD, PANalytical, X'Pert PRO, NL) with a 2θ range from 5° to 80° at a step of 0.0167°. XRD patterns were documented with a PANalytical X'Pert PRO powder diffractometer using Cu Kα radiation (λ = 0.1541 nm). Attenuated total reflectance-Fourier transform infrared spectroscopy (ATR-FTIR, Bruker Vertex 70, Switzerland) was used to detect the surface functional groups of the catalytic layers. X-ray photoelectron spectroscopy (XPS, PHI5300, USA) was employed to characterize the chemical elemental composition of the membranes. The surface zeta potential of membranes was measured by using KCl aqueous solution in the pH range of 3 to 10. Nano measure software was used to evaluate the size of ultrafine Fe2O3 nanoclusters. The content of Fe in the Fe/NS-rGO membrane was determined by 55B type atomic absorption spectroscopy (Varian, USA). A Raman spectrometer (Witec Alpha 300) was utilized to examine the vibrational characteristics of the GO and NS-rGO nanosheets, with an excitation source of 532 nm wavelength laser.Catalytic experiments
The conversion of 4-NP determines the performance of the Fe/NS-rGO membranes. After naturally drying in the air, the membrane was put into the cross-flow filtration equipment. 1 L of mixed solution including 0.3 mmol per L 4-nitrophenol and 0.567 g sodium borohydride was prepared. The mixed solution flowed through the previously placed catalytic membrane by cross-flow filtration at 30 °C and the pressure was adjusted to 0.1 MPa. The permeate solution was taken to evaluate the absorbance every 3 min. Due to the concentration of the 4-NP solution is proportional to its absorbance at 400 nm (4-AP, at 297 nm), the degradation rate of 4-NP was detected by UV-vis spectroscopy (UV 1102).Separation experiments
The experiments were proceeded by a cross-flow device. The operating pressure was adjusted to 0.2 MPa to stabilize the membrane flux for 15 min after the prepared circular membranes (valid area = 7.065 cm2) were put into the equipment. Then the operating pressure was turned to 0.1 MPa to measure the water flux by recording the time of receiving a certain amount of deionized water. The absorbance of the dye solution before and after filtration was measured by a UV-vis spectrophotometer (UV 1102). The formula for calculating water flux and rejection is shown below: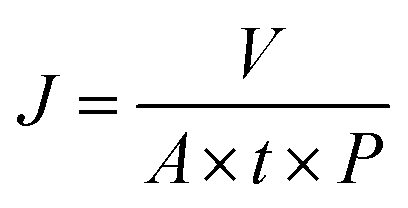
where J represents the water flux (L m−2 h−1 bar−1, abbreviated as LMH), V is the permeate volume (L), t represents the permeation time (h), A represents the valid area of the membrane under test (m2), and P is the operation pressure. R represents the dye rejection ratio (%), and Cp and C0 represent the concentration of dye in permeate (mg L−1) and feed (mg L−1), respectively. The cross-flow rate was 90 L h−1, corresponding to a flow velocity of 31.4 cm s−1 and Reynolds numbers (Re) of 1892. For the accuracy of the experiment, membranes were tested at least three times.
Molecular simulations for 4-NP reduction
Molecular simulations were proceeded by employing the Materials Studio software package from Accelrys Incorporation. The Fe2O3 force field and models were constructed with parameters derived from JCPDS 89-8103 for interaction energy calculation. All density functional theory (DFT) calculations were performed using the CASTEP (Cambridge Sequential Total Energy Package). The exchange and correlation potentials were handled using the generalized gradient approximation (GGA) with the Perdew–Burke–Ernzerhof (PBE) functional. A kinetic energy cutoff of 500 eV was set for the plane-wave expansion. The adsorption of 4-NP and 4-AP on the surfaces of Fe/NS-rGO surfaces was analyzed with the CASTEP package. For the geometrical optimization setting, the total energy and atomic displacement criteria were set at 2 × 10⁻⁵ eV and 0.002 Å, respectively. The convergence for the self-consistent field (SCF) iterations was defined with a precision of 2 × 10⁻⁶ eV per atom. The k-points were generated using the Monkhorst–Pack method, with a 3 × 3 × 1 grid.The adsorption energy (Ea) of the 4-NP molecule between the nanosheets of prepared Fe/rGO and Fe/NS-rGO membranes was calculated. The formula is listed below:
| Ea = Esystem − Esurface − E4-NP |
After the optimization of Fe/NS-rGO surface, we investigated their interactions with reactant 4-NP and product 4-AP. The electrostatic interaction energy among reactant 4-NP, product 4-AP and Fe/NS-rGO was defined as:
| E = EFe/NS-rGO+molecule − (EFe/NS-rGO + Emolecule) |
Results and discussion
The thickness of GO nanosheets with several micrometers in size is around 1.2 nm measured by AFM (Fig. 2a). Subsequently, we employed (NH4)2SO4 as the nitrogen and sulfur source to dope GO nanosheets. After N doping, the charge is induced to transfer from neighboring carbon atoms to strongly electron-withdrawing N atoms, resulting in an altering chemisorption effect. Moreover, S doping can promote spin density redistribution based on the similar electronegativities of S and C atoms, and the catalytic activity of GO can be improved.29 The co-doping of N and S can generate more active catalytic sites for catalysis than single doping due to the increased maximum spin density in carbon.30 The Raman spectra showed that the intensity ratio of D and G peaks (ID/IG) for NS-rGO (1.50) was larger than that of GO (1.19) (Fig. S1†), revealing more defects generated after doping, these defects can act as sites to trap Fe species for the formation of nanoclusters. GO nanosheets were partially reduced during the doping process, the ultrafine nanoclusters were in situ encapsulated by co-doped GO sheets by a fast reduction approach. The XRD patterns of composite membranes showed (002) diffraction peaks located around 8.0°, which revealed that the rGO-based membranes have an ordered stacking lamellar structure. The d-spacing of the NS-rGO was calculated to be 1.12 nm by using the Bragg formula (Fig. 2b). As reported, the theoretical thickness of a monolayer GO was ∼0.33 nm,31,32 the results demonstrated that the interlayer free spacing in Fe/NS-rGO membrane for predicted angstrom-level confined catalytic space was ∼0.8 nm. Therefore, the synthesized Fe/NS-rGO membrane with confined catalytic space (∼8 Å) was employed for subsequent separation and catalytic experiments.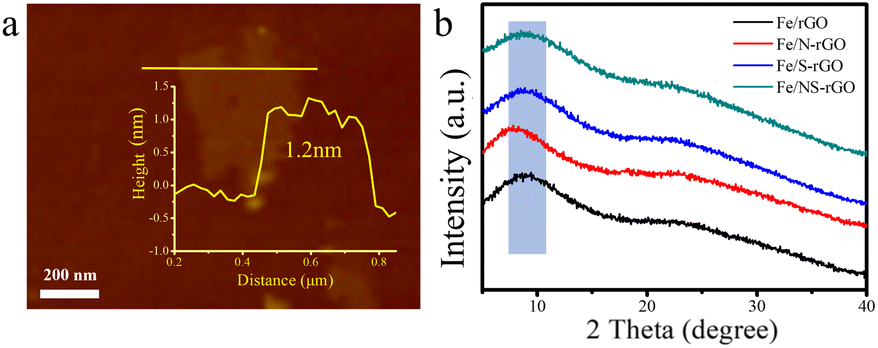 | ||
| Fig. 2 (a) AFM images of NS-rGO nanosheets and corresponding height profiles of prepared nanosheets. (b) XRD patterns of Fe/rGO, Fe/N-rGO, Fe/S-rGO and Fe/NS-rGO samples. | ||
The microstructures of Fe/NS-rGO were performed by TEM analysis. TEM images revealed that the Fe/NS-rGO composites show an interconnected porous network of rGO nanosheets with uniform deposition of iron oxide nanoclusters with an average size of 1.8 nm (Fig. 3a and b). These ultrafine Fe2O3 nanoclusters were in situ confined and encapsulated in an interconnected porous framework of Fe/NS-rGO composites. The high-resolution TEM image of the Fe/NS-rGO sample showed numerous ultrafine nanoclusters with clear lattice fringes of 0.25 nm and 0.23 nm corresponding to (020) and (112) crystal facets of Fe2O3 with orthorhombic system (JCPDS 89-8103) (Fig. 3c).33 The elemental mapping images (Fig. 3d) show the uniform distribution of iron signals throughout the reduced graphene oxide nanosheets, along with the uniform distribution of N and S elements, confirming the successful doping of N and S elements into the rGO nanosheets.
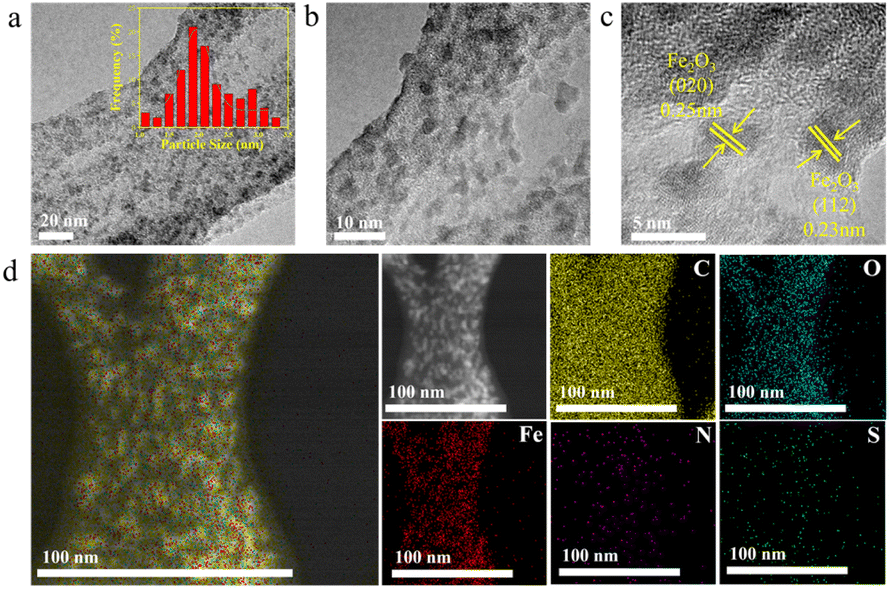 | ||
| Fig. 3 (a–c) TEM images of Fe/NS-rGO nanosheets. (d) Elemental mapping image of Fe/NS-rGO nanosheets. | ||
The thickness of the membrane can be adjusted by varying the doped atoms, the Fe/N-rGO membrane showed a thickness of 30.8 nm after mono-doping of N atoms, while a thicker separation layer (48.6 nm) was obtained after doping S atoms (Fig. 4a, d, b and e). The results demonstrated that the size of nanoclusters was enlarged after doping of S, thus increasing the thickness of the membrane, this phenomenon was also found in Fe/NS-rGO membrane (Fig. 4c and f). Based on the rules above, the thickness of active layers can be precisely controlled by adjusting the concentration of metal precursor (Fig. S2†). The ultrathin thickness of Fe/N-rGO membranes can effectively reduce the resistance of water transport through the active layer, which is beneficial for enhancing the permeance.
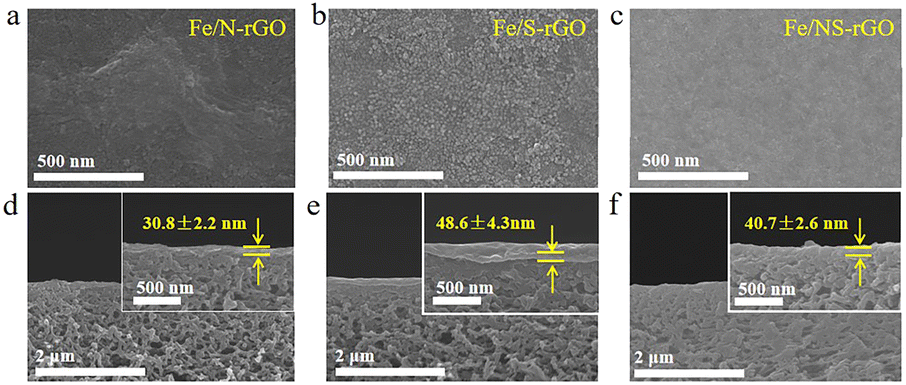 | ||
| Fig. 4 Surface and cross-section SEM images of Fe/N-rGO (a and d), Fe/S-rGO (b and e), and Fe/NS-rGO (c and f) membranes. | ||
The filtration capabilities of pure GO membranes and different heteroatom-doped rGO membranes were evaluated by cross-flow filtration. Naphthol green B (NgB) solution was used to evaluate the permeability and rejection. The permeance of the GO membrane was only 63.35 L m−2 h−1 bar−1 and the rejection rate was around 98.2% primarily due to the Donnan effect: the strong electrostatic repulsion between the charged membrane and ions, also known as the Donnan repulsion (Fig. 5a and S3†).34 After introducing iron oxide nanoclusters into the GO membrane, the value of flux increased to 108.0 L m−2 h−1 bar−1, but the retention decreased. Although the content ions that increased the layer spacing of reduced graphene oxide, more defects were introduced, which decreased the rejection rate of dye molecules. The flux of the Fe/N-rGO membrane was 67.7 L m−2 h−1 bar−1, which was similar to that of the GO membrane, but with a slight decline in rejection (95.81%). On the other hand, the permeance of Fe/S-rGO membrane was 105.7 L m−2 h−1 bar−1, while the rejection rate was only maintained at 91.53%. It is speculated that it may be attributed to the elevated membrane interfacial energy which enhanced binding ability with water after doping of S atoms. Compared with other prepared membranes, N and S co-doped reduced graphene-based (Fe/NS-rGO) membranes exhibited the optimal filtration effect. In particular, the rejection rate of Fe/NS-rGO membrane with a thickness of 40.7 nm was maintained at 97.7%, while the flux was capable of reaching 106.82 L m−2 h−1 bar−1. Meanwhile, under the same experimental conditions, four other dye molecules, methyl orange (MO), Congo Red (CR), reactive brilliant red (X-3B), and Evans Blue (EB) were then selected to test the separation performance of the Fe/NS-rGO membrane (Fig. S4†). The retention rates for EB, CR, X-3B and MO dye molecules were 100%, 96.7%, 96.3% and 62.1%, respectively.
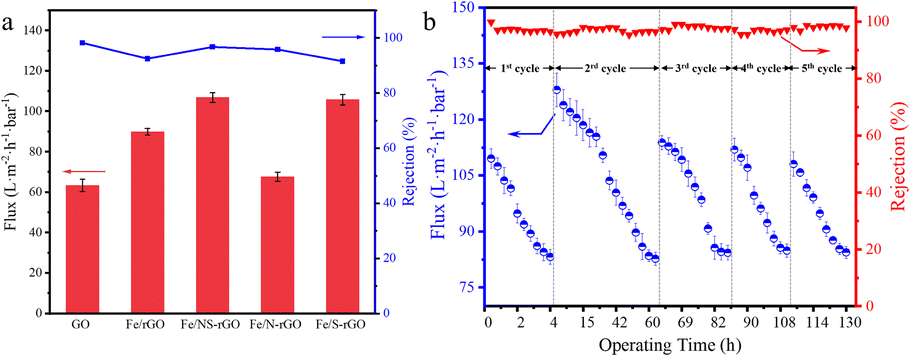 | ||
| Fig. 5 (a) Flux and dye rejection of different composite nanofilms for NgB in cross-flow filtration. (b) Performance of Fe/NS-rGO membrane in long-term continuous separation for 130 h. | ||
In particular, by comparison with those of reported catalytic membranes elsewhere, as-synthesized Fe/NS-rGO catalytic membranes exceed 3 times or more.35–38 In the experiment, the Fe/NS-rGO membrane was very stable in water and maintained the integrity of structure after one month (Fig. S5†) and the separation performance of the Fe/NS-rGO sample was evaluated under a cross-flow rate (120 L h−1) for 130 h. The results revealed that despite the permeate flux of Fe/NS-rGO membrane showed fluctuation during continuous operation of 130 h, after washing, the flux recovered quickly and the rejection rate for dye molecules remained stable as high as 97% for 130 h (Fig. 5b), indicating prominent structure stability and reuse capacity in separation operation.
4-Nitrophenol (4-NP) as a typical industrial waste has been leached out in the processing of drugs, fungicides, and leather. Nevertheless, its corresponding derivative, 4-AP, is in great demand in many industrial applications.39 In the reduction of 4-NP to 4-AP, NaBH4 was used as the reducing agent, and the conversion ability was closely determined by the performance of the catalytic membrane. The catalytic process can be described simply as follows: 4-NP and the reducing agent are adsorbed on the Fe/NS-rGO composite surface, NaBH4 produces active hydrogen on the surface, and 4-NP is reduced to 4-AP by accepting electrons. The rate of the reduction process depends mostly on the adsorption rate of 4-NP and the transfer rate of electrons. To confirm the reduction of 4-NP was not due to the surface adsorption and rejection by the Fe/NS-rGO active layer, we took the Fe/NS-rGO membrane as an example to filtrate 4-NP without adding NaBH4, the results demonstrated only 8.2% rejection to 4-NP with a flux of about 130.0 L m−2 h−1 bar−1, revealing the nanochannels in Fe/NS-rGO membrane were wider than the size of the target molecule and most of 4-NP molecules can move through Fe/NS-rGO nanosheets. Meanwhile, the adsorption experiment of 4-NP on Fe/NS-rGO and Fe/rGO membranes was conducted for 180 min, and the rejection behavior over time was recorded (Fig. S6†).
Instantaneous conversion is an important parameter for evaluating the performance of catalytic membranes under cross-flow conditions, the prepared Fe/NS-rGO catalytic membranes were carried out in a cross-flow system with NaBH4. The yellow color of permeate fast disappeared consistently with reported literature, and 4-NP was rapidly reduced to 4-AP (more than 99% in 9 minutes). As time continues to increase, the 4-AP concentration remains essentially constant. As depicted in Fig. 6a and b, the Fe/NS-rGO sample exhibited the best performance among all samples in the first 6 minutes and presented the highest rate constant of 0.5657 min−1 fitted by pseudo-first-order kinetics toward 4-NP reduction, which was competitive to reported literature (Table S1†). For a complete comparison with previous works, the turn turnover frequency (TOF) value was calculated as follows:

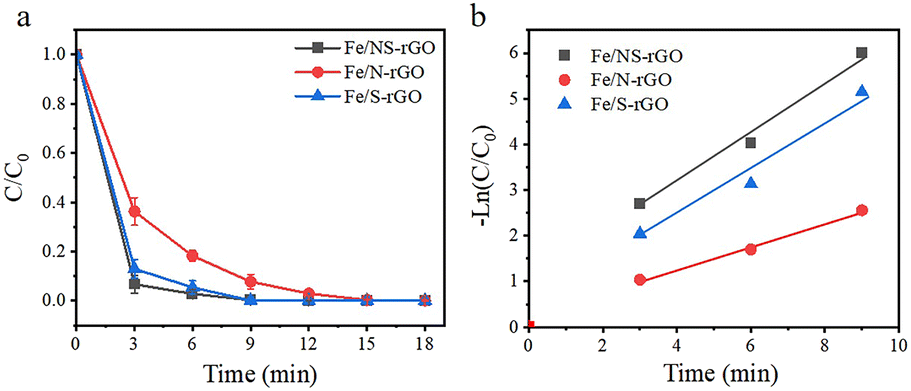 | ||
| Fig. 6 (a) Catalytic reduction of 4-NP as a function of time in the presence of prepared nanofilms. (b) The plots of −ln(C/C0) versus time for the reduction of 4-NP over different catalytic membranes. | ||
The concentration of detected Fe was 1.25 × 10⁻⁶ mol and the content of Fe2O3 nanoclusters in the Fe/NS-rGO separation layer was 30.82 wt%. The calculated TOF value for the Fe/NS-rGO membrane was 1596.0 h−1, which was at least 8 times higher than that of the reported catalytic membrane for 4-NP reduction (Table S1†),40–45 indicating the high catalytic efficiency of Fe/NS-rGO mixed matrix membranes. Further increase the loading of Fe would cause the aggregation of nanoclusters and reduce the catalytic activity, which was confirmed by SEM analysis for Fe/NS-rGO membrane (Fig. S7†). This indicates that favorable dispersibility can provide more active sites for catalytic conversion of 4-NP. Moreover, electronic effects of co-doping of rGO nanosheets can also show great importance in 4-NP reduction. Despite the content of N decreased after depositing GO nanosheets on support, the intensity of N 1s peak increased after loading Fe-based nanoclusters. The N and S co-doped rGO serve as favorable nucleation and anchor sites for coordinating with highly dispersed Fe and the multidimensional electron transport pathways provided by N and S co-doped rGO. As a comparison, the rate constants of Fe/N-rGO (0.2411 min−1) and Fe/S-rGO (0.5025 min−1) samples with single coordination structure were much less than that of Fe/NS-rGO membrane with multiple coordination structures. More importantly, to evaluate the catalytic efficiency in angstrom-level confined space and nanometer-level confined space, a Fe/rGO membrane was synthesized for comparison. As depicted in Fig. 7, the d-spacing of the Fe/rGO was calculated to be 15.4 Å by using the Bragg formula, the interlayer free spacing in Fe/rGO membrane for predicted nanometer-level confined space was ∼11.4 Å. The TOF value of the Fe/rGO membrane was 12.45 h−1, which was more than 125 times lower than that of Fe/NS-rGO sample, revealing stronger interactions existed in angstrom-level confined space.
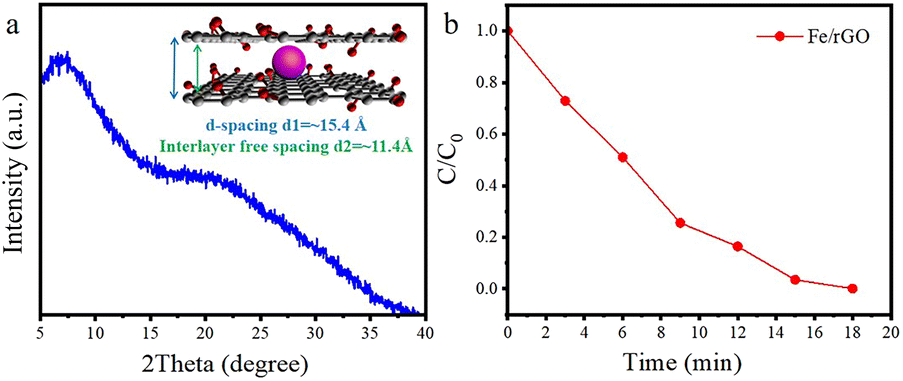 | ||
| Fig. 7 (a) XRD patterns Fe/rGO membrane and scheme of the d-spacing and interlayer free spacing between neighboring Fe/rGO nanosheets. (b) Catalytic reduction of 4-NP as a function of time in the presence of prepared Fe/rGO membrane. | ||
For catalysts with desirable catalytic efficiency, the active sites should quickly adsorb the reactant and desorb the product as well.46 Thus, the interactions among reactant 4-NP, product 4-AP and Fe/NS-rGO catalyst were of great importance to determine the catalytic activity. Among these established models, the electrostatic interaction energy between 4-NP molecules and a combination of Fe/NS-rGO (−12.87 kcal mol−1) was the strongest while the electrostatic interaction energy between 4-AP molecules and a combination of Fe/NS-rGO (−4.65 kcal mol−1) was the relatively weak (Fig. 8a–c). Moreover, the electrostatic interaction energy between 4-NP molecules and Fe/rGO sample with nanometer-level confined space was only −1.15 kcal mol−1, which was much lower than that of Fe/NS-rGO. That is to say, reactant 4-NP molecules were more quickly adsorbed and product 4-AP molecules were more easily to overcome the barriers to desorb on the surface of nanoclusters in Fe/NS-rGO. The in situ encapsulated ultrafine nanoclusters had strong interactions with NS-rGO nanosheets in angstrom-level confined space, thus forming a stable nanostructure with good electron conductivity.
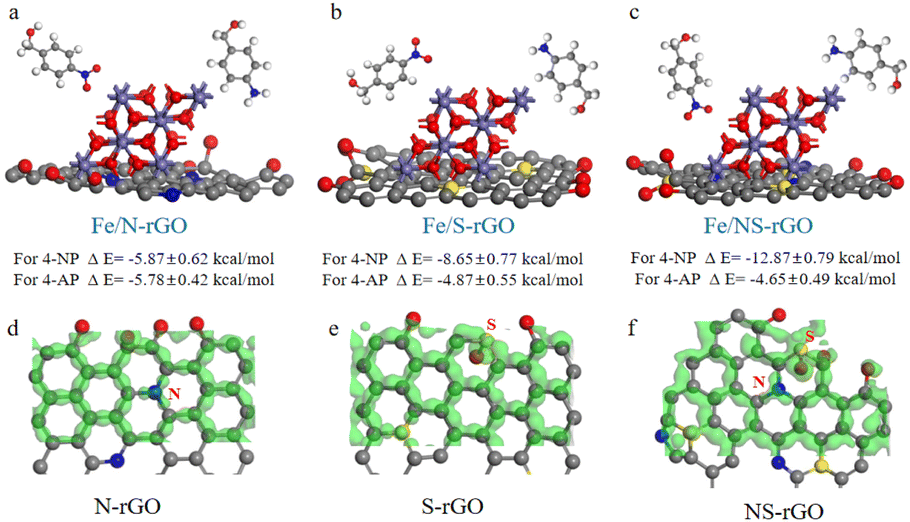 | ||
| Fig. 8 (a–c) Calculated interaction energies among reactant (4-NP), product (4-AP), Fe/N-rGO, Fe/S-rGO and Fe/NS-rGO. Charge density differences of N-GO (d), S-GO (e) and NS-rGO (f). | ||
To further undrape the catalytic mechanisms, the charge density differences were evaluated at atomic scale in Fig. 8d–f. In general, the p-block elements possess specific electronic structures with different electronegativities. These p-block elements can offer additional p-electrons to the carbon-conjugated system to produce electron-donating/accepting sites when they act as dopants into GO structures, which leads to a change in the carbon-based nanomaterials with new electrochemical properties. As depicted in Fig. 8d–f, when N and S elements were co-doped in GO nanosheets, p-electron clouds overlapped and produced abundant active sites on neighboring C atoms compared to doped GO nanosheets with mono-element. XPS analysis was also employed to investigate the chemical states of prepared membranes (Fig. S8†). Compared with Fe/rGO, the peak intensity of the oxygen-containing functional group of Fe/NS-rGO is significantly decreased and a new C–N bond appears with the doping of nitrogen atoms. The Fe 2p spectra illustrated that the peaks shifted to lower binding energy after doping, revealing the oxidation state decreased.47 Three different chemical states of nitrogen were observed, which occurred at 398.6 eV (pyridinic N), 399.5 eV (pyrrolic N), and 400.4 eV (quaternary N), respectively.48 The spectra of S 2p showed three forms of S that existed in GO matrix (S 2p1/2, S 2p3/2, and S–Fe), a part of S atoms substituted the carbon atom at the edge of the GO nanosheet, and another portion of S was originated from oxidized sulfur groups.49,50 As reported, these dopants possessed positive charges when the electronegativity of N was higher than that of S.51,52 On the contrary, when the electronegativity of N was lower than that of S, negative charges would be carried in these dopants. As a result, these co-doping parts could produce numerous negative and positive charges on neighboring carbon atoms, thus promoting intermediate adsorption in capacitor charging and catalytic processes.
Conclusions
In summary, a new and facile route for the fabrication of ultrathin graphene-based catalytic membranes was developed by assembling ultrafine Fe2O3 nanoclusters channeled N and S co-doped reduced GO nanosheets (Fe/NS-rGO) via in situ confined encapsulation and external pressurization. This strategy provides a suitable platform to rational design and fabricate high-quality catalytic membranes with tunable structure and properties on a large scale, addressing some of the limitations associated with powder-form catalysts. Through co-doping and fast reduction, ultrafine Fe2O3 nanoclusters were in situ confined and encapsulated in an interconnected porous framework of Fe/NS-rGO composites. The manipulation of active ferric catalytic centers and corresponding surrounding coordination atoms in doped rGO nanosheets provided multiple coordination structures to achieve enhanced catalytic properties. Compared to that of nanometer-level confined space by traditional methods, the angstrom-level (∼8 Å) confined interlayer structure constructed by external pressurization exhibited much stronger adsorption energy toward target molecules, significantly promoting catalytic conversion efficiency and molecular sieving capability. Moreover, the prepared catalytic membranes were highly stable in solution due to Fe3+ crosslinking and could be operated for as long as 130 h without an obvious decline in aggressive cross-flow filtration. The synthesis methodology described in this work is universal and can be further extended to many other nanostructured materials constituted by mixed dimensional composites.Data availability
The authors confirm that the data supporting this study is available within the article and its ESI.†Conflicts of interest
There are no conflicts to declare.Acknowledgements
We would like to express our deepest gratitude to Zhejiang University of Technology for providing the necessary facilities and support that made this research possible.References
- A. Thursfield, A. Murugan, R. Franca and I. S. Metcalfe, Energy Environ. Sci., 2012, 5, 7421–7459 RSC.
- W. Yue, Y. Li, W. Wei, J. Jiang, J. Caro and A. Huang, Angew. Chem., Int. Ed., 2021, 60, 18289–18294 CrossRef CAS PubMed.
- X. Huang, L. Li, S. Zhao, L. Tong, Z. Li, Z. Peng, R. Lin, L. Zhou, C. Peng, K. H. Xue, L. Chen, G. J. Cheng, Z. Xiong and L. Ye, Nano-Micro Lett., 2022, 14, 174 CrossRef CAS PubMed.
- Y. Chen, Y. Li, L. Dai, G. Qin, J. Guo, Q. Zhang, S. Li, T. A. Sherazi and S. Zhang, Chem. Commun., 2021, 57, 3131–3134 RSC.
- S. H. Morejudo, R. Zanon, S. Escolastico, I. Yuste-Tirados, H. Malerod-Fjeld, P. K. Vestre, W. G. Coors, A. Martinez, T. Norby, J. M. Serra and C. Kjolseth, Science, 2016, 353, 563–566 CrossRef CAS PubMed.
- I. F. Vankelecom, Chem. Rev., 2002, 102, 3779–3810 CrossRef CAS PubMed.
- M. F. Haase, H. Jeon, N. Hough, J. H. Kim, K. J. Stebe and D. Lee, Nat. Commun., 2017, 8, 1234 CrossRef PubMed.
- L. Jia, G. He, Y. Zhang, J. Caro and H. Jiang, Angew. Chem., Int. Ed., 2021, 60, 5204–5208 CrossRef CAS PubMed.
- D. He, L. Zhang, D. He, G. Zhou, Y. Lin, Z. Deng, X. Hong, Y. Wu, C. Chen and Y. Li, Nat. Commun., 2016, 7, 12362 CrossRef CAS PubMed.
- Y. Mao, J. Li, W. Cao, Y. Ying, P. Hu, Y. Liu, L. Sun, H. Wang, C. Jin and X. Peng, Nat. Commun., 2014, 5, 5532 CrossRef PubMed.
- J. Xiao, X. Pan, S. Guo, P. Ren and X. Bao, J. Am. Chem. Soc., 2015, 137, 477–482 CrossRef CAS PubMed.
- B. You, M. T. Tang, C. Tsai, F. Abild-Pedersen, X. Zheng and H. Li, Adv. Mater., 2019, 31, e1807001 CrossRef PubMed.
- C. Meng, B. Ding, S. Zhang, L. Cui, K. K. Ostrikov, Z. Huang, B. Yang, J. H. Kim and Z. Zhang, Nat. Commun., 2022, 13, 4010 CrossRef CAS PubMed.
- L. Tang, X. Meng, D. Deng and X. Bao, Adv. Mater., 2019, 31, e1901996 CrossRef PubMed.
- Y. Liu, Y. Huang and X. Duan, Nature, 2019, 567, 323–333 CrossRef CAS PubMed.
- N. Mounet, M. Gibertini, P. Schwaller, D. Campi, A. Merkys, A. Marrazzo, T. Sohier, I. E. Castelli, A. Cepellotti, G. Pizzi and N. Marzari, Nat. Nanotechnol., 2018, 13, 246–252 CrossRef CAS PubMed.
- Y. Zhang, Z. Xu, T. Zhang, Q. Meng, X. Zhang, C. Shen, Y. Lu, G. Zhang and C. Gao, J. Mater. Chem. A, 2020, 8, 16985–16993 RSC.
- R. K. Joshi, P. Carbone, F. C. Wang, V. G. Kravets, Y. Su, I. V. Grigorieva, H. A. Wu, A. K. Geim and R. R. Nair, Science, 2014, 343, 752–754 CrossRef CAS PubMed.
- R. R. Nair, H. A. Wu, P. N. Jayaram, I. V. Grigorieva and A. K. Geim, Science, 2012, 335, 442–444 CrossRef CAS PubMed.
- L. Qu, G. Zhu, J. Ji, T. P. Yadav, Y. Chen, G. Yang, H. Xu and H. Li, ACS Appl. Mater. Interfaces, 2018, 10, 42427–42435 CrossRef CAS PubMed.
- Q. Zhang, S. Chen, X. Fan, H. Zhang, H. Yu and X. Quan, Appl. Catal., B, 2018, 224, 204–213 CrossRef CAS.
- J. Wan, L. Huang, J. Wu, L. Xiong, Z. Hu, H. Yu, T. Li and J. Zhou, Adv. Funct. Mater., 2018, 28, 1800382 CrossRef.
- L. Ferrighi, M. Datteo, G. Fazio and C. Di Valentin, J. Am. Chem. Soc., 2016, 138, 7365–7376 CrossRef CAS PubMed.
- J. Zhu, W. Tu, H. Pan, H. Zhang, B. Liu, Y. Cheng, Z. Deng and H. Zhang, ACS Nano, 2020, 14, 5780–5787 CrossRef CAS PubMed.
- X. Wang, G. Sun, P. Routh, D. H. Kim, W. Huang and P. Chen, Chem. Soc. Rev., 2014, 43, 7067–7098 RSC.
- R. A. K. Hirani, A. H. Asif, N. Rafique, H. Wu, L. Shi, S. Zhang, X. Duan, S. Wang, M. Saunders and H. Sun, Chem. Eng. J., 2022, 446, 137042 CrossRef CAS.
- Y. Jiao, Y. Zheng, K. Davey and S.-Z. Qiao, Nat. Energy, 2016, 1, 16130 CrossRef CAS.
- W. Li, Y. Zhang, Z. Xu, A. Yang, Q. Meng and G. Zhang, Chem. Commun., 2014, 50, 15867–15869 RSC.
- L. Zhang, J. Niu, M. Li and Z. Xia, J. Phys. Chem. C, 2014, 118, 3545–3553 CrossRef CAS.
- J. Liang, Y. Jiao, M. Jaroniec and S. Z. Qiao, Angew. Chem., Int. Ed., 2012, 51, 11496–11500 CrossRef CAS PubMed.
- B. Mi, Science, 2014, 343, 740–742 CrossRef CAS PubMed.
- H. Li, Z. Song, X. Zhang, Y. Huang, S. Li, Y. Mao, H. J. Ploehn, Y. Bao and M. Yu, Science, 2013, 342, 95–98 CrossRef CAS PubMed.
- G. Shen, L. Pan, R. Zhang, S. Sun, F. Hou, X. Zhang and J. J. Zou, Adv. Mater., 2020, 32, e1905988 CrossRef PubMed.
- Y. Zhang, S. Zhang and T. S. Chung, Environ. Sci. Technol., 2015, 49, 10235 CrossRef CAS PubMed.
- L. Qu, N. Wang, H. Xu, W. Wang, Y. Liu, L. Kuo, T. P. Yadav, J. Wu, J. Joyner, Y. Song, H. Li, J. Lou, R. Vajtai and P. M. Ajayan, Adv. Funct. Mater., 2017, 27, 1701714 CrossRef.
- T. Xu, Q. Jiang, D. Ghim, K. K. Liu, H. Sun, H. G. Derami, Z. Wang, S. Tadepalli, Y. S. Jun, Q. Zhang and S. Singamaneni, Small, 2018, 14, e1704006 CrossRef PubMed.
- G. Liu, K. Han, H. Ye, C. Zhu, Y. Gao, Y. Liu and Y. Zhou, Chem. Eng. J., 2017, 320, 74–80 CrossRef CAS.
- H. Wang, S. Min, C. Ma, Z. Liu, W. Zhang, Q. Wang, D. Li, Y. Li, S. Turner, Y. Han, H. Zhu, E. Abou-Hamad, M. N. Hedhili, J. Pan, W. Yu, K. W. Huang, L. J. Li, J. Yuan, M. Antonietti and T. Wu, Nat. Commun., 2017, 8, 13592 CrossRef CAS PubMed.
- Y. Luo, S. Fan, W. Yu, Z. Wu, D. A. Cullen, C. Liang, J. Shi and C. Su, Adv. Mater., 2018, 30, 1704576 CrossRef PubMed.
- Y. He, N. Cheshomi, S. M. Lawson, A. K. Itta, F. Rezaei, S. Kapila and A. A. Rownaghi, Chem. Eng. J., 2021, 410, 128326 CrossRef CAS.
- Q. Zhang, R. J. Somerville, L. Chen, Y. Yu, Z. Fei, S. Wang, P. J. Dyson and D. Min, J. Hazard. Mater., 2023, 443, 130270 CrossRef CAS PubMed.
- Y. Chen, S. Fan, B. Qiu, J. Chen, Z. Mai, Y. Wang, K. Bai and Z. Xiao, ACS Appl. Mater. Interfaces, 2021, 13, 24795–24803 CrossRef CAS PubMed.
- Y. Mao, H. Zhang, S. Ahmed, S. Li, S. Zhang and J. Wang, Appl. Catal., B, 2022, 314, 121456 CrossRef CAS.
- N. Zhang, Y. Wu, G. Yuen and C.-F. de Lannoy, Sep. Purif. Technol., 2023, 312, 123318 CrossRef CAS.
- S. A. H. Hesaraki, O. Prymak, M. Heidelmann, M. Ulbricht and L. Fischer, ACS Appl. Mater. Interfaces, 2024, 16, 17517–17530 CrossRef CAS PubMed.
- Y. Zhong, T. Li, H. Lin, L. Zhang, Z. Xiong, Q. Fang, G. Zhang and F. Liu, Chem. Eng. J., 2018, 344, 299–310 CrossRef CAS.
- M. C. Biesinger, B. P. Payne, A. P. Grosvenor, L. W. M. Lau, A. R. Gerson and R. S. C. Smart, Appl. Surf. Sci., 2011, 257, 2717–2730 CrossRef CAS.
- F. Zheng, Y. Yang and Q. Chen, Nat. Commun., 2014, 5, 5261 CrossRef CAS PubMed.
- J. Yang, G. Zhu, Y. Liu, J. Xia, Z. Ji, X. Shen and S. Wu, Adv. Funct. Mater., 2016, 26, 4712–4721 CrossRef CAS.
- J. Zhu, W. Tu, H. Pan, H. Zhang, B. Liu, Y. Cheng, Z. Deng and H. Zhang, ACS Nano, 2020, 14, 5780–5787 CrossRef CAS PubMed.
- X. Wang, C. Yang, J. Li, X. a. Chen, K. Yang, X. Yu, D. Lin, Q. Zhang, S. Wang, J. Wang, Z. Xia and H. Jin, Adv. Funct. Mater., 2020, 31, 2009109 CrossRef.
- Z. Zhao and Z. Xia, ACS Catal., 2016, 6, 1553–1558 CrossRef CAS.
Footnote |
| † Electronic supplementary information (ESI) available: Raman spectra, TEM images, SEM images, zeta potential, XPS spectra, comparison of rate constants and TOF values for the catalytic reduction of 4-NP by different membranes. See DOI: https://doi.org/10.1039/d4ra05273k |
| This journal is © The Royal Society of Chemistry 2024 |