 Open Access Article
Enhancing extraction efficiency of carpaine in Carica papaya L. leaves: coupling acid-base extraction with surfactant-assisted micro-flotation†
Thien Quang Lama,
Anh Thi Quynh Tran a,
Thu Le Anh Phana,
Florian Zitzmanna,
Nam Van Ho Phanc and
Khoi Tan Nguyen
 *ab
*ab
aSchool of Biotechnology, International University, Vietnam National University, Ho Chi Minh City, 700000, Vietnam. E-mail: ntkhoi@hcmiu.edu.vn; Fax: +84 8 3724 4271; Tel: +84 8 3724 4270
bSchool of Chemical Engineering, The University of Queensland, Brisbane, QLD 4072, Australia
cUniversity of Medicine and Pharmacy at Ho Chi Minh City, Ho Chi Minh City, Vietnam
First published on 11th September 2024
Abstract
Carpaine, a major alkaloid in papaya leaves, has considerable cardiovascular benefits alongside its notable effects on muscle relaxation when utilized in medicine. In this study, the coupling of acid-base extraction and flotation was developed to completely remove the use of toxic solvents. This method entails the extraction of carpaine from Carica papaya L. leaves using hot water extraction alongside ultrasound-assisted extraction followed by the condensation of the species using surfactant-assisted flotation. The acid-base extraction was applied to alter the solubility of carpaine as desired at different stages of the process. The results showed that the carpaine extraction yield using all the treatments in conjunction was significantly higher compared to the control samples in which the acid-base extraction or flotation was not applied. The TLC and GC-FID results suggested that the bubbles introduced during the flotation were highly specific toward their interactions with carpaine in its hydrophobic complex form. The quantity of carpaine extracted using our method, in comparison to the amount of carpaine obtained using a different method from a previous study that utilized ethanolic extraction, exhibited a 2.32-fold greater extraction yield. This work demonstrates the importance of flexible utilization of both surface and bulk chemistry in achieving an improved solution for a technical problem.
1 Introduction
Carica papaya L. (commonly known as papaya), is one of the most widely grown crops in various parts of Asia.1,2 Traditionally, papaya leaves have been used in herbal medicine as a treatment for various diseases, namely dengue, malaria, chikungunya, and others.3 Pharmaceutically, some major beneficial components of papaya such as papain,4–8 chymopapain,1,8–11 and carpaine2,12–15 have been extracted for various medical treatments.Carpaine, the most abundant type of alkaloid present in papaya (i.e. about 63% of the total alkaloid content), has been used for the treatment of cardiovascular diseases such as high blood pressure as well as high heart rates.16 Depending on the pH of the solution, carpaine has a maximum logP value of 4.97 (computed by HyperChem). This high logP value indicates that the molecule is insoluble in water, allowing it to be quickly transferred to the lipophilic phase during contact. Moreover, as this drug is highly lipophilic, it can be absorbed easily through cell membranes and stored for longer periods in fatty tissues and organs.17 Besides carpaine, some other reported alkaloids include pseudocarpaine, dehydrocarpaine I, dehydrocarpaine II, and carposide, emetine.3 These compounds contribute to the medicinal value of papaya leaves, supporting their traditional use in treating various infectious diseases.
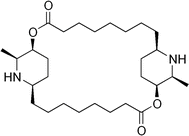
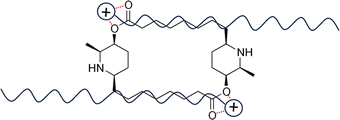
As shown in Fig. 1, carpaine is a dimer of two carpamic acids. This compound consists of two substituted piperidine rings connected through two ester linkages. The nitrogen atoms in the rings exist in the form of secondary amines, which are the main target of our pH adjustments. Carpaine is sensitive to pH causing it to exist in two primary forms, including a free base form and a salt form. Depending on the pH, this compound can either be in its most insoluble neutral form or its readily soluble salt form. This property is substantially beneficial for carpaine extraction due to the solubility of the compound being easily altered through adjustments to pH.
Some methods, including Soxhlet extraction and solvent extraction, have been proven to be efficient means of liberating basic alkaloids.18–20 However, all these methods include the use of toxic solvents, generally known for their significant hazards to both human health and the environment. Specifically, when these volatile organic compounds react with nitrogen oxides under sunlight, they form irritating ground-level ozone that can trigger damage to living cells, organs, and species including humans, animals, and plants.3,21 Generally, the removal of residual organic solvents is more challenging in comparison to water as the interaction between carpaine and these solvents are stronger. Thus, these toxic solvents may be incompletely eliminated during the drying process, followed by the probable contamination of the extracted bioactive molecules, leading to toxicity when used as drugs. In this study, a triplicate set of ethanolic extraction (E) prepared following a method of a previous work was measured for efficiency comparison.20 It is worth noting, to ensure that the difference in the carpaine extraction yield was solely derived from the extraction methods themselves, the dried C. papaya used for sample E was prepared similarly to a sample obtained using our method, sample F. As the data shown in Table 1, the carpaine extraction yield obtained by our proposed approach significantly dominated that extracted using ethanol. In comparison the conventional acid-base extraction method with an extracted carpaine quantity of 113 μg g−1,20 our method exhibited a more significant result of 195.6 ± 9.7 μg g−1. The two comparisons prove that the method explored in this study may potentially be a promising alternative for the extraction of carpaine.
| Trial | F (μg g−1) | E (μg g−1) |
|---|---|---|
| 1 | 192.9 | 90.5 |
| 2 | 180.4 | 87.0 |
| 3 | 213.5 | 75.6 |
| Mean ± SEM | 195.6 ± 9.7 | 84.4 ± 4.5 |
| % RSD | 8.5 | 9.2 |
The most common method for extracting alkaloids is acid-base extraction, which utilizes the pH-sensitive nature of the desired compounds, of which the solubility directly affects the intermolecular interactions among the to-be-extracted molecules. The solubility of these alkaloids can changed drastically across the pH scale. To be more specific, the pH adjustments flexibly alter the solubility of the compounds to either partition them into the aqueous phase or the organic solvent phase. Alkaloids with primary or secondary amine groups, for example, are prone to protonation. The acidification of these compounds can readily increase their solubility in water via amine protonation, transforming them into positively charged organic salts. This, in turn, allows the alkaloids to be efficiently solvated as single ions for extraction into the aqueous phase rather than forming hydrophobic complexes with other compounds. Subsequently, when the solutions containing these salts are basified, the alkaloids transform into their less soluble neutral states. This transformation causes the alkaloids to aggregate with other hydrophobic entities to minimize their contact with water. The hydrophobic complexes are then easily partitioned into the nonpolar phase.22
In this experiment, the solubility of carpaine was intentionally modified, specifically for the needs of each step by targeting its pH-sensitive nature, employing acid-base extraction. Hot-water extraction (HWE) and ultrasound-assisted extraction (UAE) were also incorporated in the extraction of herbal compounds from papaya leaves to support the liberation of carpaine from the solid matrix. The HWE enhances the extraction efficiency by increasing the solubilization, improving solvent diffusion and promoting cell wall disruption.23–25 Meanwhile, the UAE facilitates the extraction via the formation and collapse of cavitation bubbles, which can degrade the plant cell walls, consequentially releasing their internal contents.26,27
Flotation has widely been recognized as an eco-friendly and efficient method for the separation of colloidal particles from an aqueous solution. This approach, effective in the isolation of mineral ores,28 crude oils,29 herbal extractions,30,31 and others, utilizes the hydrophobic interactions between hydrophobic particles and the air–water interfaces of ultrafine gas bubbles. Currently, the applications of ultrafine gas bubbles are expanding, reflected by recent studies utilizing them in delivering drugs to target tissues,32 controlling bacterial proliferation,33–35 understanding their inevitable impacts on various types of cells,36 separating of herbal medicines from crude extracts,31 aiding the elucidation of other phenomena,37 and so on. During flotation, ultrafine gas bubbles collide with a hydrophobic particle, followed by the drainage of the liquid film between them, the formation of a three-phase contact line and the spreading of the three-phase contact line until stable attachment. If these processes are completed before the detachment occurs, the hydrophobic particles can be carried to the surface in the stable foam layer for collection.38,39 This technique is highly effective in enriching compounds from diluted extracts.40 However, it exhibits relatively poor selectivity as all nonpolar herbal compounds present in the mixture are prone to collection.
During flotation, surfactants can be exploited to augment the collection capacity of bubbles. At high concentrations, surfactant would facilitate the flotation process more effectively due to its capacity to stabilize smaller-sized bubbles, thus increasing the specific surface area of air–water interface.41,42 This allows hydrophobic entities, specifically carpaine, to adhere more to the bubbles due to the higher availability of interfacial area.43 Moreover, the use of surfactants has been suggested to be crucial for the interfacial adsorption of particles with opposite charges.44,45 However, the excessive use of surfactant may lead to saturation at the air–water interfaces, reducing the adsorption capacity of presenting nonpolar components.46 In addition, micelles could be formed as the concentration of a surfactant surpasses its critical micelle concentration (CMC). These micelles potentially reduce the hydrophobicity of the desired species, thereby increasing their solubility in the bulk solution and preventing them from interacting with the ultrafine gas bubbles.47,48 Moreover, excessive amounts of surfactant might impact the environment negatively in addition to its uneconomically high costs at the industrial scale.49 This justifies the use of sufficient amounts of CTAB for foam stabilization.
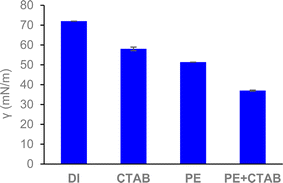
In the flotation process of carpaine, the compound was rendered hydrophobic through a pH adjustment to 10.5. As the molecule has high electron density at positions with highly electronegative atoms (O, N),50 it is probable that the free base form of carpaine interacts electrostatically with the positively charged head of CTAB, forming hydrophobic complexes. The exposed hydrophobic tail is then collected by the rising bubbles, which carries the carpaine complex to the surface for collection. At a CTAB concentration of approximately 0.075 mM, which is substantially lower than its CMC (1 mM), CTAB molecules exist as monomers.51 A small fraction of this cationic surfactant could form a complex with hydrophobic compounds or negatively charged ones. Besides CTAB, saponins, naturally occurring surfactants in papaya leaves, could also adhere to the air–water interfaces, contributing to the drop in surface tension and the stabilization of the bubbles (Fig. 2).52,53
In this study, a combination of acid-base extraction and flotation was investigated as a potential approach towards the extraction and condensation of carpaine. The contribution of a cationic and an anionic surfactant on the overall carpaine yield was also assessed.
2 Materials and methods
2.1 Materials
Auxiliary chemicals used for pH adjustment, TLC development and visualization include acetone, sodium hydroxide, hydrochloric acid, glacial acetic acid, potassium iodide and bismuth nitrate pentahydrate. These chemicals were purchased from Xilong Scientific Co Ltd.
2.2 Methods
The flotation was conducted in an in-house glass flotation column (50 cm × 10 cm × 10 cm) positioned in a heat-insulated icebox to keep the temperature stable around 12–14 °C. This controlled environment ensured consistent conditions throughout the experiment. During the flotation, the ambient air was supplied at a constant rate of 158 litre m−1 to facilitate the generation and stabilization of foam, which was collected until no more stable bubbles were observed. The resulting foam layer was allowed to drain so that the condensation efficiency of hydrophobic species could be maximized prior to foam collection. The pH of the collapsed foam was then adjusted down to 2 immediately using HCl to force the carpaine into its soluble and stable protonated form before the filtering step. Next, the filtered foam solution was evaporated and redissolved in methanol to a concentration of 0.0867 g mL−1 for further analysis. All the samples and control groups were prepared at this concentration.
![[thin space (1/6-em)]](https://www.rsc.org/images/entities/char_2009.gif) :
:![[thin space (1/6-em)]](https://www.rsc.org/images/entities/char_2009.gif) 1) solvent system. The TLC plate was then stained with DR solution. This DR reagent, used for the visualization of alkaloids, had been prepared based on a study by Sreevidya, N., and Mehrotra, S. (2003).
1) solvent system. The TLC plate was then stained with DR solution. This DR reagent, used for the visualization of alkaloids, had been prepared based on a study by Sreevidya, N., and Mehrotra, S. (2003).3 Results and discussion
3.1 Results
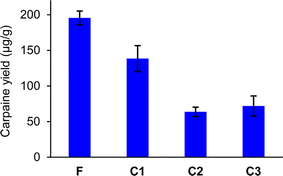
In Fig. 6, the carpaine amounts were calculated for the triplicated foam sample (F) and three controls (C1, C2, C3). The error bar for each column was constructed using standard error of the mean (SEM) of these triplicated samples. The Mann–Whitney U-test, provided in Table S1,† illustrated that there were significant differences between the carpaine yields of the foam sample (F) and each of the control samples (C1, C2, C3). Together with the higher mean and the non-overlapping error bars in Fig. 6, it can be concluded that the foam sample (F) had a significantly higher quantity of carpaine compared to the other three control groups.
3.2 Discussions
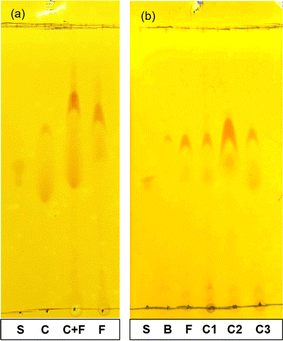
3.2.1.1. TLC results. In both Fig. 4a and b, the standard carpaine (S) only developed into a single spot, which was different from the observed pattern in the CTAB foam sample (F) and all the control samples (C1, C2, C3) where there were two separate spots. A mixture of standard carpaine–CTAB complex (C) was prepared in an attempt to imitate the complex formation phenomenon of carpaine in the extract samples. Consequently, a separation phenomenon in the complex sample (C) was observed, which was relatively similar to the extract samples. The spot with higher Rf observed in the F line might have been carpaine in a complex form. This hypothesis was supported by the similarities in the separation patterns between the complex sample and extract samples, indicating that the interaction with CTAB likely alters the migration behavior of carpaine during the analysis.
From the principle of silica gel-coated TLC, nonpolar compounds exhibit lower interaction tendencies with the polar stationary phase, thus developing with a higher Rf compared to less hydrophobic ones. When comparing the Rf of the spots in pure carpaine (S) and carpaine–CTAB complex (C) in Fig. 4a, the complex sample (C) had two distinct spots, one of which had a higher Rf, and the other one had a lower Rf relative to pure carpaine. It is worth noting that CTAB in the complex sample (C) was prepared at a concentration of roughly 1.7 mM with an assumption that the added CTAB at the initial concentration of 0.075 mM was fully recovered from the bulk into the foam fragment via flotation. At a concentration above CMC, CTAB could have formed polar micelles masking the nonpolar carpaine,55 thus resulting in a spot owning lower Rf compared to that of the pure carpaine. Meanwhile, the spot with higher Rf might be carpaine in a complex with CTAB. This complex was formed through polar interactions, owning a high hydrophobicity with a logP of 13.49 as demonstrated in Fig. 7. The computed logP values of pure carpaine and its complex may only provide a comparable insight into how the complex formation can boost flotation efficiency. It is also worth noting that, besides CTAB, the liberated carpaine can aggregate with other phytochemicals to form complexes of various conformations with different logP values. Theoretically, such a high logP of 13.49 allowed the complexes to preferably adsorb onto the ultrafine gas bubbles during flotation. The complex formation behavior of the complex sample (C) is illustrated in Fig. 8. However, due to the differences detected in the Rf of the four spots in the complex sample (C) and the foam sample (F) line, more evidence would be required to justify that the spots in the foam sample were carpaine.
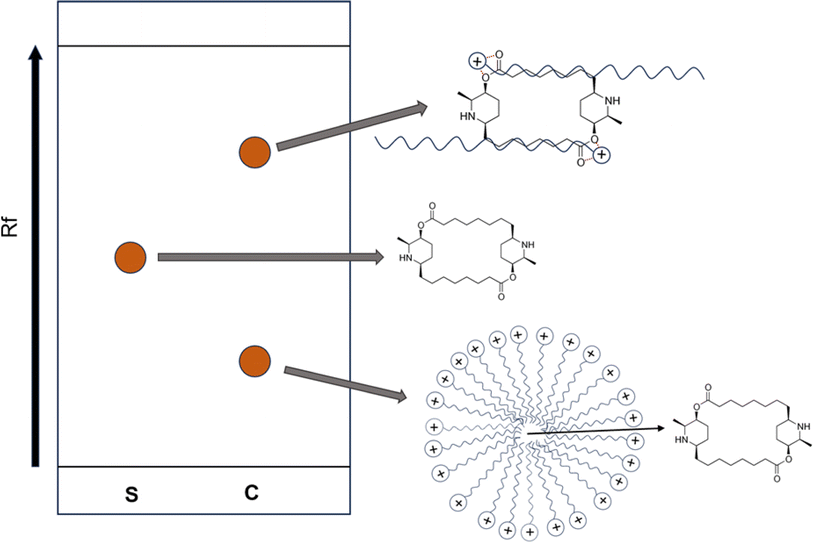 | ||
| Fig. 8 TLC illustration of carpaine and carpaine–CTAB complexes. Standard carpaine (S), carpaine–CTAB complex (C). | ||
In this case, a mixed sample consisting of the foam sample (F) and the complex control (C) were prepared. The two samples were sonicated to facilitate mass transfer for the purpose of homogenizing carpaine complexes. The principle is similar to that of the previously reported co-spotting technique,56 where a compound in two different samples can develop differently on the TLC plate due to their different chemical matrices. As the two samples are mixed, the compound with two distinct purity levels is homogenized, thus developing as a single spot. Therefore, if the mixed sample develops two spots, the observed spots in the CTAB foam line can be determined to be carpaine at various levels of complexity. Through observation, the complex sample (C) had visibly developed two major spots, confirming that both separated species in the foam sample (F) were carpaine.
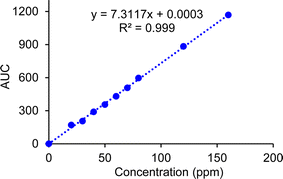
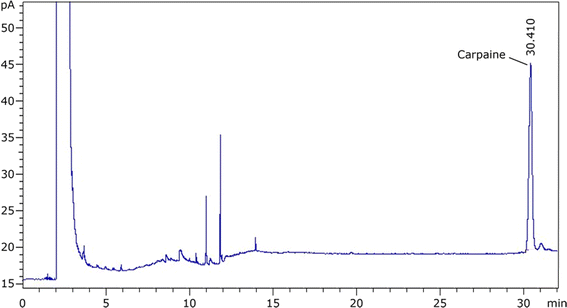
3.2.1.2. For GC-FID quantification. To confirm the identity of carpaine in the GC chromatogram, two CTAB foam samples with the same concentration of sample stock were prepared, one of which was mixed with the standard carpaine, while the other was not. In Fig. S1,† the measurements showed that, at minute 30.4, the sample including standard carpaine had an AUC of 191.54, which was significantly higher than the other sample, which had an AUC of 76.60. The increase in the AUC of the curve due to the additional standard carpaine confirmed that this species had a retention time of roughly 30.4 minutes. This retention time was also found to align well with that of our carpaine standard as well as the previously reported value (Fig. 9).54
3.2.1.3. The impact of CTAB on the quantification of carpaine. The effect of CTAB on the GC signal of carpaine was assessed by measuring the samples with the same amount of carpaine at different CTAB concentrations, as presented in Table 2. The relative standard deviation of the AUC values of carpaine peaks was calculated at 2.25%, which demonstrated that CTAB did not affect the quantification of carpaine by GC. This might be on account of CTAB being polar, and thus was not retained in the nonpolar HP-5 column. In comparison to the retention time of carpaine at minute 30.4, CTAB was eluted much sooner at minute 10.9.
| Ethanolic extract (g mL−1) | CTAB (mM) | AUC |
|---|---|---|
| 0.00867 | 0 | 149.7 |
| 1 | 157.7 | |
| 2 | 155.2 | |
| 5 | 156.1 | |
| % RSD | 2.25% | |
| Trial | F (μg g−1) | C1 (μg g−1) |
|---|---|---|
| 1 | 192.9 | 141.9 |
| 2 | 180.4 | 105.2 |
| 3 | 213.5 | 168.2 |
| Mean ± SEM | 195.6 ± 9.7 | 138.4 ± 18.3 |
| % RSD | 8.5 | 22.9 |
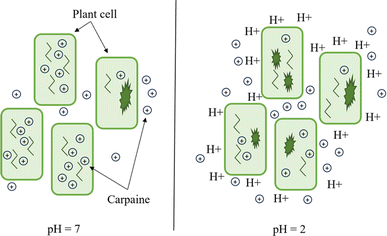
In the equation, pH, pKa, [conjugate base], and [weak acid] refer to the pH of the extract solution, the pKa of carpaine, the concentration of carpaine in its free base form and the concentration of carpaine in its protonated form, respectively. As can be inferred from the equation, as the pH of the medium decreases, the proportion of weak acid increases, meaning that carpaine shifts toward its protonated form. This form allows carpaine to be soluble in an aqueous environment for extraction. Therefore, despite the unknown pKa of carpaine, the relative solubility of this alkaloid at pH = 2 was expected to be higher compared to that at pH = 7. This might explain the greater carpaine extraction yield at pH = 2. In addition, this acidification step may have addressed another issue when it came to herbal extraction, which is the rigid cell wall barrier that locks in desired compounds.
It is widely accepted that mature plant cell walls are extremely rigid as a result of their thick layers of structuring agents, for instance, hemicellulose, lignin, etc.58 Moreover, the internal layer of the phospholipid bilayer membrane only permits small, hydrophobic species to pass through via passive diffusion.59 These protective layers might have significantly affected the extraction process by trapping their contents within the matrix, restricting the diffusion potential of phytochemicals, especially those that are large and polar. These compounds include carpaine in its protonated form. An acidic environment can thus assist cell wall hydrolysis,60 which might enhance the liberation of soluble carpaine into the solution. The mechanism is illustrated in Fig. 10.
| Trial | F (μg g−1) | C3 (μg g−1) |
|---|---|---|
| 1 | 192.9 | 99.1 |
| 2 | 180.4 | 52.4 |
| 3 | 213.5 | 64.2 |
| Mean ± SEM | 195.6 ± 9.7 | 71.9 ± 14.0 |
| % RSD | 8.5 | 33.8 |
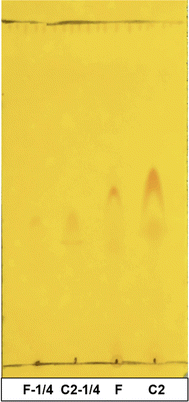
3.2.4.1. The impact of flotation on the collection yield of carpaine. In Fig. 4b, when the control sample without flotation (B) was developed on the TLC, only a small spot of carpaine could be observed. It is noted that while sample B was the extract after maceration, sample F was the foam collected after the flotation of sample B. As opposed to the samples (F, C1, C2, C3), both the intensity and the size of the spot of carpaine of sample B were significantly lower. This less significant appearance of the carpaine spot indicates that the proportion of carpaine in this sample was somewhat low compared to the flotation samples, likely due to the dilution by unwanted species. The fact that all samples that applied flotation had higher w/w concentrations of carpaine relative to the sample B has proven that the ultrafine gas bubbles introduced during this process had high selectivity toward the hydrophobic carpaine. Considering the hydrophobicity, the more significant carpaine spot in each of the extract samples has a higher Rf compared to the pure carpaine spot. Therefore, relative to the carpaine with a logP of 4.97, the carpaine complexes in all extract samples possess higher logP values, illuminating their strong affinity to ultrafine gas bubbles during flotation.61,62 It should be taken into consideration that carpaine in the complex form may contribute to the stability of the foam by reducing the drainage rate, supporting the flotation process even at a low surfactant concentration.63,64
To further prove the effectiveness of flotation, GC measurements of control sample B were conducted. In Table 5, across the concentration range from 10% to 100% of the 0.0867 g mL−1 stock sample, the signals of carpaine at different concentrations appeared to be relatively weak. Moreover, these signals were not proportional to their concentrations, which was likely due to the low signal-to-noise ratio in the sample. Hence, this phenomenon led to the insensitive quantification of the carpaine. This measurement further verifies the preference of bubbles towards carpaine complexes during the condensation process.
| Concentration (%) | AUC |
|---|---|
| 10 | 2.1 |
| 12 | 1.8 |
| 14 | 2.5 |
| 16 | 2.5 |
| 100 | 2.2 |
3.2.4.2. The vital role of surfactants in the flotation of carpaine. In Fig. 4b, despite having the boldest spot in the TLC plate, the overall carpaine extraction yield of the control lacking CTAB addition (C2) was much lower in comparison to the sample that underwent all treatments as shown in Table 6. Even though the adsorption of carpaine particles could adhere and stabilize the ultrafine gas bubbles,65–67 the synergistic effect of these slightly negatively charged particles and the positively charged CTAB can boost the adsorption capacity of carpaine at the interfaces.68,69 In addition, the deficiency in the total surface area of stable interfaces from the lack of a frother may also contribute to a poor extraction yield of carpaine of 63.7 ± 6.5 μg g−1. In this case, CTAB, as a surfactant, functioned to increase the total area of vacant interfaces, providing carpaine complexes with more adhesion sites. As previously mentioned, only a minor fraction of the surfactant was used to facilitate foam stabilization, as high concentrations of the foaming agent can hinder the bubble–particle interactions from occurring by increasing the time of the three-phase contact line formation, reducing the flotation kinetics.70,71
| Trial | F (μg g−1) | C2 (μg g−1) |
|---|---|---|
| 1 | 192.9 | 75.5 |
| 2 | 180.4 | 53.0 |
| 3 | 213.5 | 62.6 |
| Mean ± SEM | 195.6 ± 9.7 | 63.7 ± 6.5 |
| % RSD | 8.5 | 17.8 |
As observed in Fig. 4b, the control sample that lacked CTAB had two spots with marginally higher Rf in comparison with the other samples. This could be credited to the high concentration of carpaine analyte that resulted in the overload phenomenon transpiring on the TLC plate. The incident was proven by developing a TLC using a diluted foam sample (F) and a diluted control without CTAB sample (C2). In Fig. 4b and 11, the two spots of carpaine of sample C2 had significantly higher Rf compared to those of the sample F. However, when the two samples were diluted to eliminate the oversaturated effect of the analytes on the TLC plate, the Rf of both samples were comparable. Hence, the small amount of added CTAB likely had no effect on the polarity of the preformed complexes. Another plausible explanation for the lower Rf of the spots in both samples is presumably based on the increased solubility of the compounds in the complex in a less polar solvent. As the samples were diluted with methanol, the compounds that previously formed hydrophobic complexes with carpaine in water tended to detach, leaving the more polar analyte behind. This change in Rf may be because those compounds were more soluble in methanol compared to water. Therefore, when the solute concentration decreased, the increased solvation power may have led to the dissociation of the hydrophobic carpaine complexes.
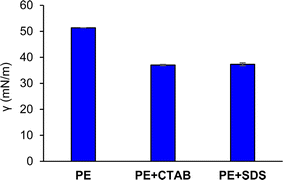
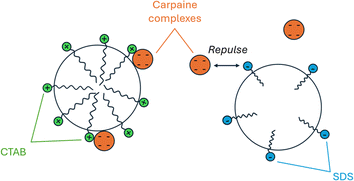
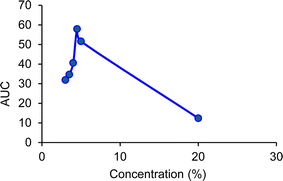
When SDS was employed instead of CTAB with a working concentration of 0.15 mM, the amount of extracted carpaine fell below the quantification range of GC-FID. As demonstrated in Fig. 13, when the SDS foam stock sample (0.0867 g mL−1) was diluted into different concentrations and measured, a large fluctuation was observed in the signal of the carpaine. This fluctuation meant that the linear range could not be established. Moreover, the AUC values of all recorded data points were lower than the standard curve. The weak signal might be attributed to the unfavorable electrostatic interactions between SDS and negatively charged sites,47 in which the negatively charged head of SDS repelled the partially negatively charged carpaine complexes. In this case, the anionic surfactant may have adsorbed at the air–water interfaces.72 As illustrated in Fig. 12, when the ultrafine gas bubbles were stabilized by the anionic surfactant, the negative carpaine complexes became prone to being repulsed by the negatively charged head group of SDS, which weakened their adhesion at these interfaces. The development, in turn, reduces the priority of carpaine selection in the flotation method.
In addition, as CTAB is more nonpolar compared to SDS,73 it is more likely that it aggregates with the nonpolar carpaine to minimize its contact with water. The combined effect of electrostatic attraction and stronger hydrophobic force may have resulted in a stable carpaine and CTAB complex. The long alkyl chain of CTAB may also contribute to the enhanced hydrophobicity of carpaine complexes for flotation. Another reason to justify the use of CTAB in this study was its common use in pharmacy74,75 and as recommended by WHO.76
4 Conclusion
The coupling of acid-base extraction and surfactant-assisted flotation significantly enhanced the collected carpaine yield compared to the amount collected by the individual use of each method. The characterization of the samples was conducted using TLC and GC-FID analyses. The TLC results showed that the carpaine in the matrix existed in two major forms, its more nonpolar complex and the more polar variant. As for the GC-FID results, the proposed procedure for extraction was confirmed to work efficiently. The carpaine yield in the foam sample was the highest among all other control samples. The coupling of bubbles and CTAB during flotation was displayed to be crucial toward the selective interaction with carpaine. This selectivity was proven by the inability to quantify carpaine in both control samples in which flotation was absent and SDS was used instead of CTAB. The low carpaine extraction yield of the control sample floated without surfactant further reinforces this explanation. The improved carpaine yield as opposed to the yields of carpaine extracted using ethanol, confirms the plausibility of this method as a highly potential candidate for carpaine extraction, devoid of the use of toxic solvents.Data availability
The data supporting this article are included in the manuscript and the ESI.†Conflicts of interest
There are no conflicts to declare.Acknowledgements
This research is funded by Vietnam National Foundation for Science and Technology Development (NAFOSTED) under grant number 106.02.2018.315.References
- M. Azarkan, A. El Moussaoui, D. van Wuytswinkel, G. Dehon and Y. Looze, J. Chromatogr. B, 2003, 790, 229–238 CrossRef CAS PubMed
.
- M. F. Mohamad Bukhari, N. Abdul Rahman, N. Khalid, A. H. Rashid and M. Mohd Diah, BJRST, 1970, 4, 35–49 CrossRef
.
- M. Hariono, J. Julianus, I. Djunarko, I. Hidayat, L. Adelya, F. Indayani, Z. Auw, G. Namba and P. Hariyono, Molecules, 2021, 26, 6922 CrossRef CAS PubMed
.
- Y.-M. Kang, H.-A. Kang, D. C. Cominguez, S.-H. Kim and H.-J. An, Int. J. Mol. Sci., 2021, 22, 9885 CrossRef CAS PubMed
.
- D. Moraes, M. A. Levenhagen, J. M. Costa-Cruz, A. P. d. Costa Netto and R. M. Rodrigues, Rev. Inst. Med. Trop. Sao Paulo, 2017, 59 Search PubMed
.
- S. A. S. H. Ajlia, F. A. A. Majid, A. Suvik, M. A. W. Effendy and H. Serati Nou, Pak. J. Biol. Sci., 2010, 13, 596–603 CrossRef CAS PubMed
.
- B. Rose, C. Herder, H. Löffler, G. Meierhoff, N. C. Schloot, M. Walz and S. Martin, Clin. Exp. Immunol., 2006, 143, 85–92 CrossRef CAS PubMed
.
- T. Mohr and L. Desser, BMC Compl. Alternative Med., 2013, 13, 231 CrossRef PubMed
.
- S. Zucker, D. J. Buttle, M. J. H. Nicklin and A. J. Barrett, Biochim.Biophys.Acta, 1985, 828, 196–204 CrossRef CAS PubMed
.
- R. A. McKee and H. Smith, Phytochemistry, 1986, 25, 2283–2287 CrossRef CAS
.
- M. BENOIST, A. DEBURGE, G. HERIPRET, J. BUSSON, J. RIGOT and J. CAUCHOIX, Spine, 1982, 7, 613–617 CrossRef CAS PubMed
.
- S. Sudi, Y.-Z. Chin, N. S. Wasli, S.-Y. Fong, S. C. Shimmi, S.-E. How and C. Sunggip, Pharmaceuticals, 2022, 15 Search PubMed
.
- T. Julianti, M. De Mieri, S. Zimmermann, S. N. Ebrahimi, M. Kaiser, M. Neuburger, M. Raith, R. Brun and M. Hamburger, J. Ethnopharmacol., 2014, 155, 426–434 CrossRef CAS PubMed
.
- K. Alagarasu, M. Punekar, P. Patil, B. Kasabe, M. Kakade, K. S. Davuluri, S. Cherian and D. Parashar, Phytother. Res., 2023, 37, 3191–3194 CrossRef CAS PubMed
.
- C. A. Hornick, L. I. Sanders and Y. C. Lin, Res. Commun. Chem. Pathol. Pharmacol., 1978, 22, 277–289 CAS
.
- D. T. H. Vien and T. V. Loc, Int. j. agric. environ. biotechnol, 2017, 2, 2394–2397 Search PubMed
.
- E. M. Burdick, Econ. Bot., 1971, 25, 363–365 CrossRef CAS
.
- F. G. KoÇAnci, S. NİĞDelİOĞLu Dolanbay and B. Aslim, Int. J. Second. Metab, 2022, 9, 43–51 CrossRef
.
- B. B. Sarikaya, N. U. Somer, G. I. Kaya, M. A. Onur, J. Bastida and S. Berkov, Z. Naturforsch., C, J. Biosci., 2013, 68, 118–124 CrossRef CAS PubMed
.
- J. Y. Yap, C. L. Hii, S. P. Ong, K. H. Lim, F. Abas and K. Y. Pin, J. Bioresour. Bioprod., 2021, 6, 350–358 CrossRef CAS
.
- N. Sreevidya and S. Mehrotra, J. AOAC Int., 2003, 86, 1124–1127 CrossRef CAS PubMed
.
- T. R. Govindachari, B. R. Pai and N. S. Narasimhan, J. Chem. Soc., 1954, 1847–1849 RSC
.
- A. C. V. Asten, H. F. M. Boelens, W. T. Kok, H. Poppe, P. S. Williams and J. C. Giddings, Sep. Sci. Technol., 2006, 29, 513–533 CrossRef
.
- L. G. Hepler, Can. J. Chem., 1969, 47, 4613–4617 CrossRef CAS
.
- M. Herrero, A. Cifuentes and E. Ibáñez, in Comprehensive Sampling and Sample Preparation, 2012, pp. 181–201, DOI:10.1016/b978-0-12-381373-2.00133-2
.
- Y. El Rayess, M. Dawra and M. El Beyrouthy, in Herbal Bioactive-Based Drug Delivery Systems, 2022, pp. 437–455, DOI:10.1016/b978-0-12-824385-5.00002-9
.
- D. Kuimov, M. Minkin, A. Yurov and A. Lukyanov, Fluids, 2023, 8, 172 CrossRef CAS
.
- Z. Huang, S. Zhang, H. Wang, R. Liu, C. Cheng, Z. Liu, Z. Guo, X. Yu, G. He, G. Ai and W. Fu, J. Agric. Food Chem., 2020, 68, 11114–11120 CrossRef CAS PubMed
.
- M. Piccioli, R. A. Gjelsten Larsen, M. Dudek, S. V. Aanesen and G. Øye, Energy Fuels, 2023, 37, 5644–5651 CrossRef CAS
.
- T. Q. Luu, P. T. Le, K. C. M. Le, A. H. T. Phan, K. Zitzmann, K. T. Nguyen, N. V. H. Phan and K. T. Nguyen, J. Food Process Eng., 2019, 42, e13284 CrossRef
.
- P. Van Hoang, T. D. U. Phan, P. V. Q. Duong, A. T. Van Tran, K. T. Nguyen and N. V. H. Phan, Langmuir, 2022, 38, 9285–9293 CrossRef CAS PubMed
.
- T. H. Le, A. H. T. Phan, K. C. M. Le, T. D. U. Phan and K. T. Nguyen, RSC Adv., 2021, 11, 34440–34448 RSC
.
- K. C. M. Le, A. T. Q. Tran, M. P. Vu, P. V. Q. Duong and K. T. Nguyen, Langmuir, 2024, 40, 1698–1706 CrossRef CAS PubMed
.
- M. P. Vu, N. Le Hanh Tran, T. Q. Lam, A. T. Quynh Tran, T. P. Anh Le and K. T. Nguyen, RSC Adv., 2024, 14, 2159–2169 RSC
.
- T. Q. Luu, P. N. Hong Truong, K. Zitzmann and K. T. Nguyen, Langmuir, 2019, 35, 13761–13768 CrossRef CAS PubMed
.
- N. L. H. Tran, T. Q. Lam, P. V. Q. Duong, L. H. Doan, M. P. Vu, K. H. P. Nguyen and K. T. Nguyen, Langmuir, 2023, 40, 984–996 CrossRef PubMed
.
- T. D. U. Phan, A. H. T. Phan, K. C. M. Le, T. H. Le and K. T. Nguyen, Langmuir, 2021, 37, 14237–14242 CrossRef CAS PubMed
.
- A. V. Nguyen and H. Stechemesser, Phys. Chem. Chem. Phys., 2004, 6, 429–433 RSC
.
- A. Beaussart, L. Parkinson, A. Mierczynska-Vasilev, J. Ralston and D. A. Beattie, Langmuir, 2009, 25, 13290–13294 CrossRef CAS PubMed
.
- M. Backleh-Sohrt, P. Ekici, G. Leupold and H. Parlar, J. Nat. Prod., 2005, 68, 1386–1389 CrossRef CAS PubMed
.
- M. Parhizkar, M. Edirisinghe and E. Stride, RSC Adv., 2015, 5, 10751–10762 RSC
.
- J. Wang, Int. J. Oil, Gas
Coal Eng., 2018, 6, 18–24 CrossRef CAS
.
- O. Paulson and R. J. Pugh, Langmuir, 1996, 12, 4808–4813 CrossRef CAS
.
- Y. Zhu, J. Jiang, Z. Cui and B. P. Binks, Soft Matter, 2014, 10, 9739–9745 RSC
.
- A. Maestro, E. Rio, W. Drenckhan, D. Langevin and A. Salonen, Soft Matter, 2014, 10, 6975–6983 RSC
.
- J. Bergfreund, S. Siegenthaler, V. Lutz-Bueno, P. Bertsch and P. Fischer, Langmuir, 2021, 37, 6722–6727 CrossRef CAS PubMed
.
- E. Weiand, F. Rodriguez-Ropero, Y. Roiter, P. H. Koenig, S. Angioletti-Uberti, D. Dini and J. P. Ewen, Phys. Chem. Chem. Phys., 2023, 25, 21916–21934 RSC
.
- Y.-H. Zhang, L. Guo, C. Ma and Q.-S. Li, Phys. Chem. Chem. Phys., 2001, 3, 583–587 RSC
.
- O. Kaczerewska, R. Martins, J. Figueiredo, S. Loureiro and J. Tedim, J. Hazard. Mater., 2020, 392, 122299 CrossRef CAS PubMed
.
- S. Racioppi and M. Rahm, Chem.–Eur. J., 2021, 27, 18156–18167 CrossRef CAS PubMed
.
- M. Schwarze, Chem. Ing. Tech., 2020, 93, 31–41 CrossRef
.
- K. Golemanov, S. Tcholakova, N. Denkov, E. Pelan and S. D. Stoyanov, Soft Matter, 2013, 9, 5738–5752 RSC
.
- S. N. Syed Amran, N. Zainal Abidin, H. Hashim and S. I. Zubairi, J. Food Qual., 2018, 2018, 1–11 CrossRef
.
- K.-Y. Khaw, N. J. Y. Chear, S. Maran, K.-Y. Yeong, Y. S. Ong and B.-H. Goh, Nat. Prod. Sci., 2020, 26, 165–170 CrossRef CAS
.
- X. Cui, S. Mao, M. Liu, H. Yuan and Y. Du, Langmuir, 2008, 24, 10771–10775 CrossRef CAS PubMed
.
- L. Cai, Curr. Protoc. Essent. Lab. Tech, 2014, 8, 6.3.1–6.3.18 Search PubMed
.
- H. N. Po and N. M. Senozan, J. Chem. Educ., 2001, 78, 1499 CrossRef CAS
.
- P. Ryden and R. R. Selvendran, Carbohydr. Res., 1990, 195, 257–272 CrossRef CAS
.
- G. M. Cooper, The Cell: A Molecular Approach, Sinauer Associates, Sunderland, Mass, 2nd edn, 2000 Search PubMed
.
- C. Hoebler, J. L. Barry, A. David and J. Delort-Laval, J. Agric. Food Chem., 2002, 37, 360–367 CrossRef
.
- S. Han, K. You, K. Kim and J. Park, Langmuir, 2019, 35, 9364–9373 CrossRef CAS PubMed
.
- L. Xie, C. Shi, J. Wang, J. Huang, Q. Lu, Q. Liu and H. Zeng, Langmuir, 2015, 31, 2438–2446 CrossRef CAS
.
- J. Wang and A. V. Nguyen, Soft Matter, 2016, 12, 3004–3012 RSC
.
- G. Bournival, S. Ata and E. J. Wanless, Langmuir, 2016, 32, 6226–6238 CrossRef CAS PubMed
.
- A. Stocco, E. Rio, B. P. Binks and D. Langevin, Soft Matter, 2011, 7, 1260–1267 RSC
.
- A. Stocco, W. Drenckhan, E. Rio, D. Langevin and B. P. Binks, Soft Matter, 2009, 5, 2215–2222 RSC
.
- A. Stocco, J. Crassous, A. Salonen, A. Saint-Jalmes and D. Langevin, Phys. Chem. Chem. Phys., 2011, 13, 3064–3072 RSC
.
- B. P. Binks, M. Kirkland and J. A. Rodrigues, Soft Matter, 2008, 4, 2373–2382 RSC
.
- S. M. Kirby, S. L. Anna and L. M. Walker, Soft Matter, 2018, 14, 112–123 RSC
.
- D. Kosior, J. Zawala, M. Krasowska and K. Malysa, Phys. Chem. Chem. Phys., 2013, 15, 2586–2595 RSC
.
- D. Kosior, J. Zawala, M. Krasowska and K. Malysa, Phys. Chem. Chem. Phys., 2013, 15, 2586–2595 RSC
.
- H. Ma, M. Luo and L. L. Dai, Phys. Chem. Chem. Phys., 2008, 10, 2207–2213 RSC
.
- J. Jin, X. Li, J. Geng and D. Jing, Phys. Chem. Chem. Phys., 2018, 20, 15223–15235 RSC
.
- Y. Pan, Y. Zhang, Q. Chen, X. Tao, J. Liu and G. G. Xiao, Front. Pharmacol, 2019, 10, 843 CrossRef CAS PubMed
.
- W. Da, L. Tao and Y. Zhu, Int. J. Oncol., 2021, 59, 42 CrossRef CAS PubMed
.
- W. H. Organization., Recommendations to Assure the Quality, Safety and Efficacy of Typhoid Conjugate Vaccines., Geneva, Switzerland., 2020 Search PubMed
.
Footnote |
| † Electronic supplementary information (ESI) available. See DOI: https://doi.org/10.1039/d4ra05132g |
| This journal is © The Royal Society of Chemistry 2024 |

