
 Open Access Article
 This Open Access Article is licensed under a Creative Commons Attribution-Non Commercial 3.0 Unported Licence
Elucidating the role of potassium addition on the surface chemistry and catalytic properties of cobalt catalysts for ammonia synthesis†
Hubert Ronduda *a,
Magdalena Zyberta,
Wojciech Patkowskia,
Andrzej Ostrowskia,
Kamil Sobczakb,
Dariusz Moszyńskic and
Wioletta Raróg-Pileckaa
*a,
Magdalena Zyberta,
Wojciech Patkowskia,
Andrzej Ostrowskia,
Kamil Sobczakb,
Dariusz Moszyńskic and
Wioletta Raróg-Pileckaa
aWarsaw University of Technology, Faculty of Chemistry, Noakowskiego 3, 00-664, Warsaw, Poland. E-mail: hubert.ronduda@pw.edu.pl; Tel: +48 22 234 7602
bUniversity of Warsaw, Biological and Chemical Research Centre, Żwirki i Wigury 101, 02-089 Warsaw, Poland
cWest Pomeranian University of Technology in Szczecin, Faculty of Chemical Technology and Engineering, Pułaskiego 10, 70-322 Szczecin, Poland
First published on 22nd July 2024
Abstract
The ammonia synthesis process produces millions of tons of ammonia annually needed for the production of fertilisers, making it the second most produced chemical worldwide. Although this process has been optimised extensively, it still consumes large amounts of energy (around 2% of global energy consumption), making it essential to improve its efficiency. To accelerate this improvement, research on catalysts is necessary. Here, we studied the role of potassium in ammonia synthesis on cobalt catalysts and found that it was detrimental to the catalytic activity. It was shown that, regardless of the amount of introduced K, the activity of the K-modified catalysts was much lower than that of the undoped catalyst. K was found to be in the form of oxide; however, it was unstable and reducible to metallic K, which easily volatilised from the catalyst surface under activation conditions. In addition, potassium doping resulted in the sintering of the catalyst, the decrease in the surface basicity, and contributed to the loss of the active sites, mainly due to the coverage of Co surface by residual K species.
1. Introduction
Ammonia is the second most produced chemical worldwide, reaching 200 million tons per year. Over 80% of ammonia is used as a fertiliser in crop production. Ammonia has recently been considered as a hydrogen carrier for renewable energy.1–3 The Haber–Bosch process has been successfully employed for industrial ammonia synthesis; however, it requires both very high temperatures (>400 °C) and pressures (>20 MPa), leading to high energy consumption (around 2% of global energy use) as well as a large amount of CO2 released into the atmosphere (420 million tons of CO2).1–3 Therefore, developing an efficient catalyst for ammonia synthesis is of major importance. The rate-determining step (RDS) of ammonia synthesis is a cleavage of the nitrogen triple bond, owing to its large energy bond (945 kJ mol−1).4 Transition metals, such as Fe, Co, or Ru, are essential to the promotion of N2 dissociation, as are the promoters that provide electrons to the transition metals. Therefore, electron donation from appropriate promoters is key to improving the performance of the ammonia synthesis catalysts.5–9 The current commercial ammonia synthesis catalyst is the Fe-based catalyst frequently promoted structurally (with Al2O3) and electronically (with K2O).4 Al2O3 plays an essential role in stabilising and preventing aggregation of Fe particles.10 K2O, in turn, accelerates the N2 chemisorption and dissociation on the surface of Fe.11,12Over the last decades, Ru-based catalysts using, e.g. carbon, rare-earth oxides, perovskites as supports and potassium, cesium, and barium as promoters have been developed and applied in ammonia synthesis.13–16 Although they can work under mild conditions compared to iron-based catalysts, the scarcity of ruthenium and its high price limits the commercial application of these catalysts. Recently, cobalt catalysts have emerged as a cost-effective alternative to ruthenium-based catalysts. Cobalt is an active metal in the ammonia synthesis reaction and, compared to ruthenium, is more abundant and less expensive.17–19 However, the activity of pure Co is low because of the low adsorption energy of N2 on Co.20 Several strategies have been employed to enhance the activity of cobalt catalysts, for example, using appropriate supports and adding alkaline earth metal promoters.9,17,19,21,22 Rare-earth oxides have been found to be good support materials as they stabilise Co particles (preventing their aggregation) and provide electrons to Co, resulting in electron-rich Co sites. Among the alkaline earth metals, barium has been found as an effective promoter of Co. Lin et al. have reported that the addition of Ba improves the activity of Co/CeO2 by increasing the number of adsorption sites for H2 and N2.17 Similar conclusions have been drawn from works on Co/C catalysts.9 However, unlike in the Fe- and Ru-based catalysts, the alkali metals have been found to be detrimental to the activity of Co catalysts.9,17 Hagen et al. have suggested that for Co catalysts, alkaline earth metals are better promoters than alkali metals.9 Lin et al., in fact, have reported that Ba is the effective promoter, while K is found to be detrimental to the cobalt catalyst performance. Specifically, the ammonia synthesis rate of the Ba-doped Co was about 1.3 times that of the undoped Co and about 4 times that of the K-doped Co catalyst.17 The poor activity of the K-doped Co catalyst was attributable to the decrease in the number of adsorption sites for H2 and N2 due to the coverage of the Co surface with K species. However, despite these efforts, the effect of K doping on Co catalysts have not been fully elucidated.
Herein, we investigate the effect of K addition on the physicochemical and catalytic properties of the cobalt ammonia synthesis catalyst. To this end, cobalt supported on mixed magnesium–lanthanum oxide was impregnated with different amounts of potassium nitrate (K content of 0–9 wt%). As already mentioned, potassium has been selected as an additive since it has been reported to be an effective promoter for iron- and ruthenium-based catalysts. However, compared to the undoped Co catalyst, the K-doped Co catalysts exhibited poorer performance, regardless of the amount of K. To clarify how K doping affected the catalyst, the detailed characterisation studies using thermogravimetry (TGA), X-ray powder diffraction (XRD), scanning transmission electron microscopy (STEM) coupled with energy dispersive X-ray spectroscopy (EDS), X-ray photoelectron spectroscopy (XPS), and temperature-programmed desorption (TPD) experiments were conducted.
2. Experimental section
2.1. Chemicals
All chemicals used were from Merck and Acros Organics, or Chempur, with the highest possible purity unless otherwise stated. Distilled water was used for the preparation of all aqueous solutions.K-doped Co catalysts with different K doping amounts were prepared by wet impregnation. The Co1 sample was used for the preparation of this series of catalysts. The K content was fixed at 0.5, 1, 3, 5, 7, and 9 wt%. Briefly, potassium nitrate was dissolved in distilled water under stirring at room temperature. Then, the powdered Co1 sample was added, and the slurry was stirred for 15 min to obtain a homogeneous slurry and then kept at room temperature overnight. The water solvent was removed using a rotary evaporator, and the obtained powder was dried overnight at 120 °C. The thus-obtained powders were denoted as xK–Co1, where x denotes the nominal K content in the final catalyst. The exact amount of K in the as-prepared catalysts was determined by XRF, and the results are shown in Table S2.† For comparison purposes, three catalysts doped with Cs, Ca, and Ba were prepared using the same procedure. The dopant concentration was set at 5 wt%. The samples obtained were denoted as 5Cs–Co1, 5Ba–Co1, and 5Ca–Co1.
The as-prepared catalysts were reduced at 600 °C in hydrogen before the catalytic reaction and characterisation studies. The activation temperature was chosen based on the TGA-TPR studies (Fig. S3†). Unless otherwise specified (e.g. as-prepared catalyst, catalyst precursor, spent catalyst), the catalysts mentioned in this paper refer to the reduced catalysts.
2.2. Catalyst characterisation
2.3. Catalytic activity tests
Ammonia synthesis activity was evaluated in a tubular flow reactor. A detailed description of the experimental setup can be found elsewhere.26 Before the catalytic test, the as-prepared catalyst (0.5 g) was activated using the following temperature program: 470 °C for 72 h, 520 °C for 24 h, 550 °C for 48 h and 600 °C for 24 h. The activation was performed by H2/N2 mixture (75/25 mol%) at a flow of 70 L h−1. Then, the system was pressurised to 6.3 MPa and heated to the target reaction temperature (400–470 °C). The resulting NH3 gas was analysed interferometrically. The ammonia synthesis rate was calculated from the mass balance for a plug-flow differential reactor.26 The ammonia synthesis rate was expressed per unit mass of the reduced catalyst. The experimental error in the determination of the reaction rate was ±1%. The TOF was calculated from the ammonia synthesis rate divided by the number of surface cobalt atoms. The number of surface cobalt atoms was estimated on the basis of H2 chemisorption value (amount of H2 desorbed from the H2-TPD analysis), assuming the stoichiometry of H/Co = 1.27A thermal stability test was performed by repeating the catalytic test at 470 °C and 6.3 MPa for 28 days. The catalysts were overheated at 600 °C at atmospheric pressure during the intervals between measurements.
3. Results and discussion
3.1. Different potassium dopant content studies
First, the effect of the K content on the performance of Co catalysts for ammonia synthesis was examined (Fig. 1). | ||
| Fig. 1 Effect of the K content on the (a) reaction rate (rNH3) and (b) TOF of the Co catalysts for ammonia synthesis at 470 °C and 6.3 MPa. | ||
The K-doped catalysts showed much poorer ammonia synthesis performance compared to the undoped Co catalyst across the examined K content range. The NH3 synthesis rate gradually decreased from 2.08 to 0.02 gNH3 g−1 h−1 when the K content in the catalysts was increased from 0 to 9 wt%. Even a small addition of K (0.5 wt%) caused a significant decrease in the ammonia synthesis rate from 2.08 to 1.23 gNH3 g−1 h−1. Next, the catalytic activity per active site was evaluated by calculating the turnover frequency (TOF). As given in Fig. 1, the TOF follows the same trend as the reaction rate, where the TOF values decreased from 0.170 to 0.015 s−1. However, the decrease in TOF values with the increasing K content in the catalysts was not as prominent as that of the ammonia synthesis rate. For example, with the increasing K doping concentration from 0 to 7 wt%, the ammonia synthesis rate decreased by about 48-fold (from 2.08 to 0.04 gNH3 g−1 h−1), whereas the TOF decreased by only about 6-fold (0.170 to 0.027 s−1). These results indicate that the activity of K-modified Co catalysts was more dependent on the availability of the active sites rather than the intrinsic activity of each cobalt site.
From the activity results, it is observed that the K doping had a detrimental effect on ammonia formation. This is in contrast to earlier studies on the Fe- and Ru-based catalysts, which showed increased activity when doped with potassium.12,13 In either case, the role of K in promoting the ammonia synthesis rate has been generally well understood; K accelerates the chemisorption and dissociation of N2, thereby enhancing ammonia synthesis efficiency. However, for the Co-based catalysts, Hagen et al. suggested that the alkali promoters are not optimal.9 When promoted with alkaline earth promoters, these kinds of catalysts have been found to have a high activity for ammonia synthesis.9 Similar observations were made when Co1, 5K–Co1, 5Ca–Co1, and 5Ba–Co1 catalyst activities were compared (Fig. S4†). The activity follows an order of 5Ba–Co1 > 5Ca–Co1 ≈ Co1 ≫ 5Cs–Co1 > 5K–Co1. Moreover, Lin et al.17 reported a deterioration of catalyst performance when doped with potassium; the K-doped Co/CeO2 catalysts showed much poorer performance compared to Co/CeO2. However, the state and effect of K doped on Co catalysts have not been elucidated fully.
Having in mind that alkali promoters, such as K, are not thermally stable (pure metallic K volatilises at around 400 °C) and are prone to separate from the catalyst in the ammonia synthesis conditions,11 the K content in the catalysts after the ammonia synthesis reaction was determined (Table 1).
The results are surprising: the K content calculated from ICP and XRF deviated significantly from the nominal values. For all the K-doped Co catalysts, the determined K content was almost the same, about 0.2 wt%. This is particularly interesting since the introduced amount of K salt varied strongly from sample to sample (Table S2†). This suggests that, although K2O is considered thermally stable in ammonia synthesis conditions,11,28 its reduction with hydrogen to metallic K with subsequent evaporation is possible at around 600 °C.29 The transformation of KNO3 salt to K2O and then to K, with subsequent K evaporation, was confirmed by the TGA-TPR study (Fig. S5†). The TGA-TPR analysis revealed that the reducibility of the as-prepared 5K–Co1 was notably more hindered compared to the as-prepared Co1 (Fig. S3†). This was caused by the potassium addition. It was revealed that the reduction of Co metal species was completed at around 600 °C, and further heating at 600 °C for 10 h made it possible to reduce the K2O to metallic K, which was subsequently evaporated. Therefore, this shows that the potassium oxide was unstable and reducible to metallic K, which was easily volatilised at high temperatures. Meanwhile, there were significant differences in the catalyst activity when varying the amount of introduced K salt (Fig. 1). H2-TPD studies were performed to shed more light on this matter (Fig. 2).
 | ||
| Fig. 2 (a) H2-TPD profiles of the Co1 and K–Co1 catalysts with different K content. (b) The dependence of the amount of desorbed H2 with respect to the K content. | ||
There were two overlapping peaks: the low-temperature (<100 °C) and medium-temperature (at 250 °C) peaks associated with the desorption of H2 that was weakly and intermediately bound to the Co surface.18,30 This shows that the addition of K did not affect the nature of active sites, but it affected the number of active sites for H2 adsorption (expressed as the amount of hydrogen desorbed). Even a small addition of K in the catalyst decreased the number of active sites (Fig. 2b). With further increasing the K content, the number of active sites decreased gradually; for the catalyst with the highest K content (9K–Co1 sample), only 8 μmol of H2 was desorbed, whereas, for the undoped catalyst (Co1 sample), it was 100 μmol of H2 desorbed (∼13-fold decrease). Also of note, the introduction of K caused the deterioration of the porous structure, as reflected in the decrease in the surface area (Table 2). A 3-fold decrease in the BET surface area was observed with increasing K content from 0 to 9 wt%. This decrease is lower than the ∼13-fold decrease in the number of adsorption sites, indicating that the sintering of the catalyst was not the main reason for the loss of the active sites. Therefore, it clearly indicates that the addition of K was detrimental to the adsorption of hydrogen onto the catalysts. Meanwhile, the loss of the active sites was reflected in the deterioration of the activity of K-doped catalysts; the trend of catalyst activity agrees well with the trend of the number of active sites (Fig. 1 and 2b).
| Catalyst | Specific surface area (m2 g−1) |
|---|---|
| Co1 | 31.5 |
| 0.5K–Co1 | 25.9 |
| 1K–Co1 | 18.8 |
| 3K–Co1 | 11.6 |
| 5K–Co1 | 9.7 |
| 7K–Co1 | 8.6 |
| 9K–Co1 | 8.4 |
To further study the potassium doping effect, the Co1 and 5K–Co1 samples were selected as representative and intensively studied.
3.2. Catalyst analysis
One important aspect to consider is the catalyst stability during the ammonia synthesis reaction. Co1 and 5K–Co1 showed rather stable activity, as demonstrated by the 28 day tests (Fig. 3). After 28 days of overheating, Co1 and 5K–Co1 showed even better performance compared to the initial activity. The NH3 formation rates increased by almost 15% in 28 days for both catalysts, which may be due to the surface rearrangement under reaction conditions. However, the activity difference between the Co1 and 5K–Co1 catalysts was the same on day 1 and day 28; Co1 reached an 11 times higher reaction rate than that for 5K–Co1. | ||
| Fig. 3 Time-on-stream performance of the Co1 and 5K–Co1 catalysts. The data points indicate the ammonia synthesis rate measured at 470 °C and 6.3 MPa. The catalysts were overheated at 600 °C during the intervals between measurements. | ||
These results are in contrast to those reported in ref. 31. It has been reported that, although the time-on-stream performance of the K–Co/Al2O3 catalysts depended on the K content, after 24 hours of the ethanol steam reforming (ESR) process, all the K–Co/Al2O3 catalysts showed the same activity, regardless of the initial K content. Within 24 hours, ethanol conversion over all the K-doped catalysts was higher (∼60%) than that measured for the undoped catalyst (∼50%). The authors indicated that at a certain K content (∼0.3 wt%), potassium does not evaporate from the surface of the Co catalyst, while at higher K contents, K segregation and evaporation occur during the ESR process. In other words, the activity of the K-doped samples with the initial K content between 0.5 and 4 wt% was the same as for the K-doped sample with the K content of 0.3 wt% after K segregation and evaporation from the surface of the Co catalysts at 500 °C. In our study, although the segregated K evaporated from the surface of the Co catalysts during the ammonia synthesis process, the activities of all K-doped Co catalysts varied strongly (Fig. 1). Moreover, even after 28 days of testing, the activity of 5K–Co1 remained almost unchanged (Fig. 3). The properties of the catalysts were then characterised.
Powder X-ray diffraction (XRD) was used first to examine the catalyst structure, and the XRD patterns are presented in Fig. 4. The XRD patterns were recorded for the catalysts at different reduction times. As shown in Fig. 4a, the diffraction peaks assigned to the metallic fcc Co phase (PDF 15-0806) were visible, indicating that the loaded Co metal species were completely reduced to the metallic Co. In addition, the peaks of the MgO (PDF 45-0946) and La2O3 (PDF 05-0602) phases were detected. Further prolonging the reduction time did not lead to any significant differences in the structural properties of the catalysts. Also, although prolonging the reduction time, the Co1 catalyst was resistant to sintering, as indicated by the similar crystallite sizes (Fig. 4a). Meanwhile, for the 5K–Co1 catalyst, the peaks assigned to the metallic fcc Co and hcp Co (PDF 01-1278) were identified. The peaks of the MgO and La2O3 phases were also detected. No diffraction peaks related to K species were found due to the low content. With the prolonging of reduction time, the strong sintering of all phases present (except MgO) was observed, as indicated by the increasing crystallite size (Fig. 4b). Most importantly, the crystallite sizes were much larger than those determined for Co1. This observation is consistent with literature reports on the effect of K-modified Co catalysts, where potassium doping leads to sintering and crystallite growth.17,32
 | ||
| Fig. 4 XRD patterns (left) and the dependence of crystallite size with respect to the catalyst reduction time (right) of the (a) Co1 and (b) 5K–Co1 catalysts reduced for different times. | ||
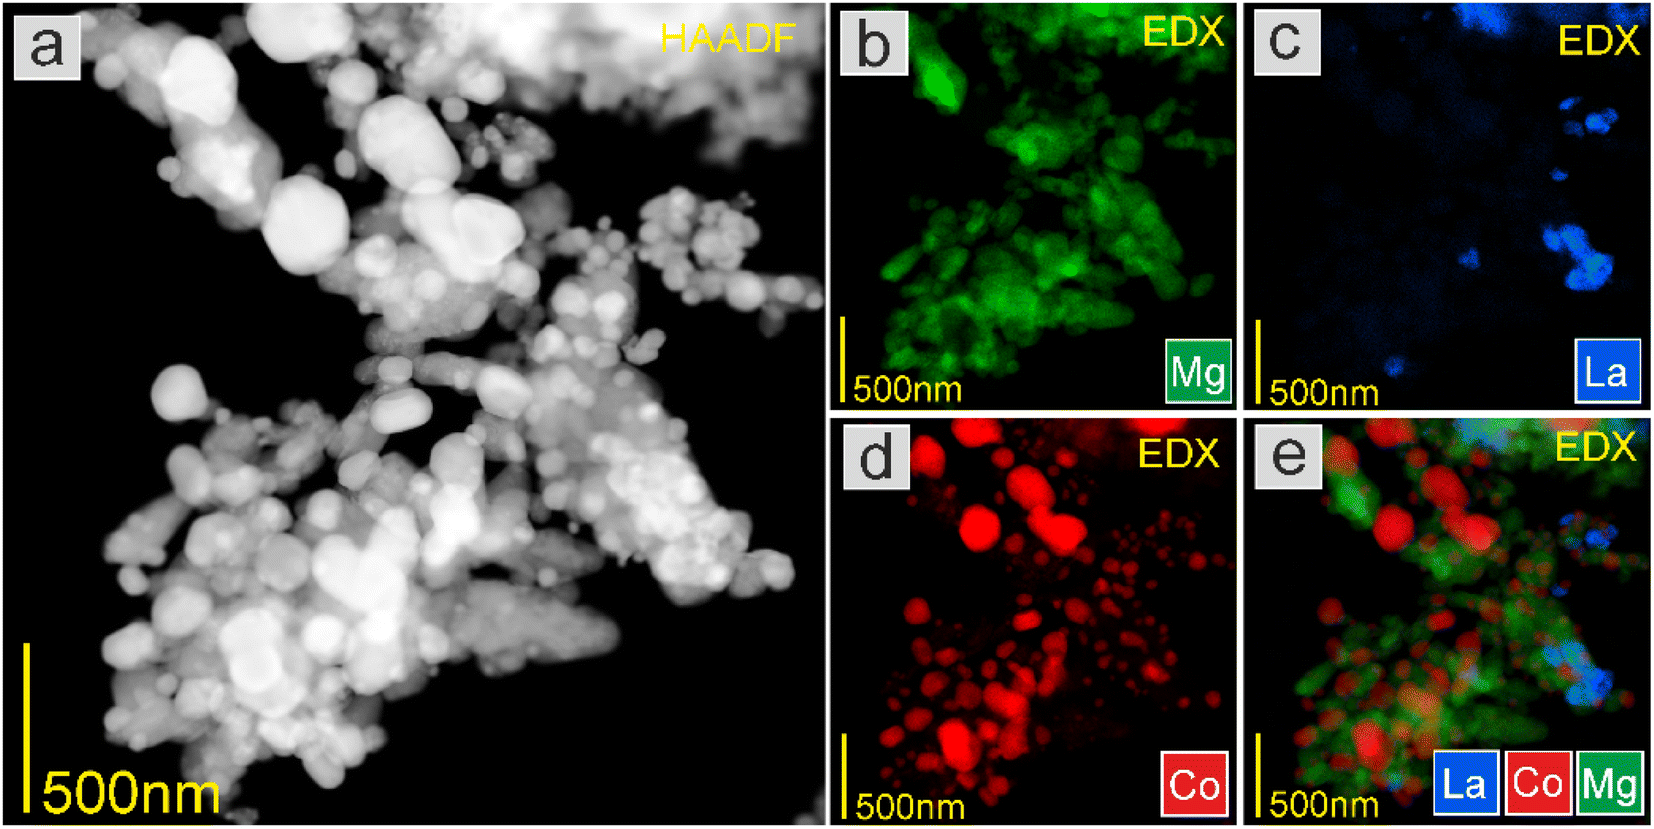
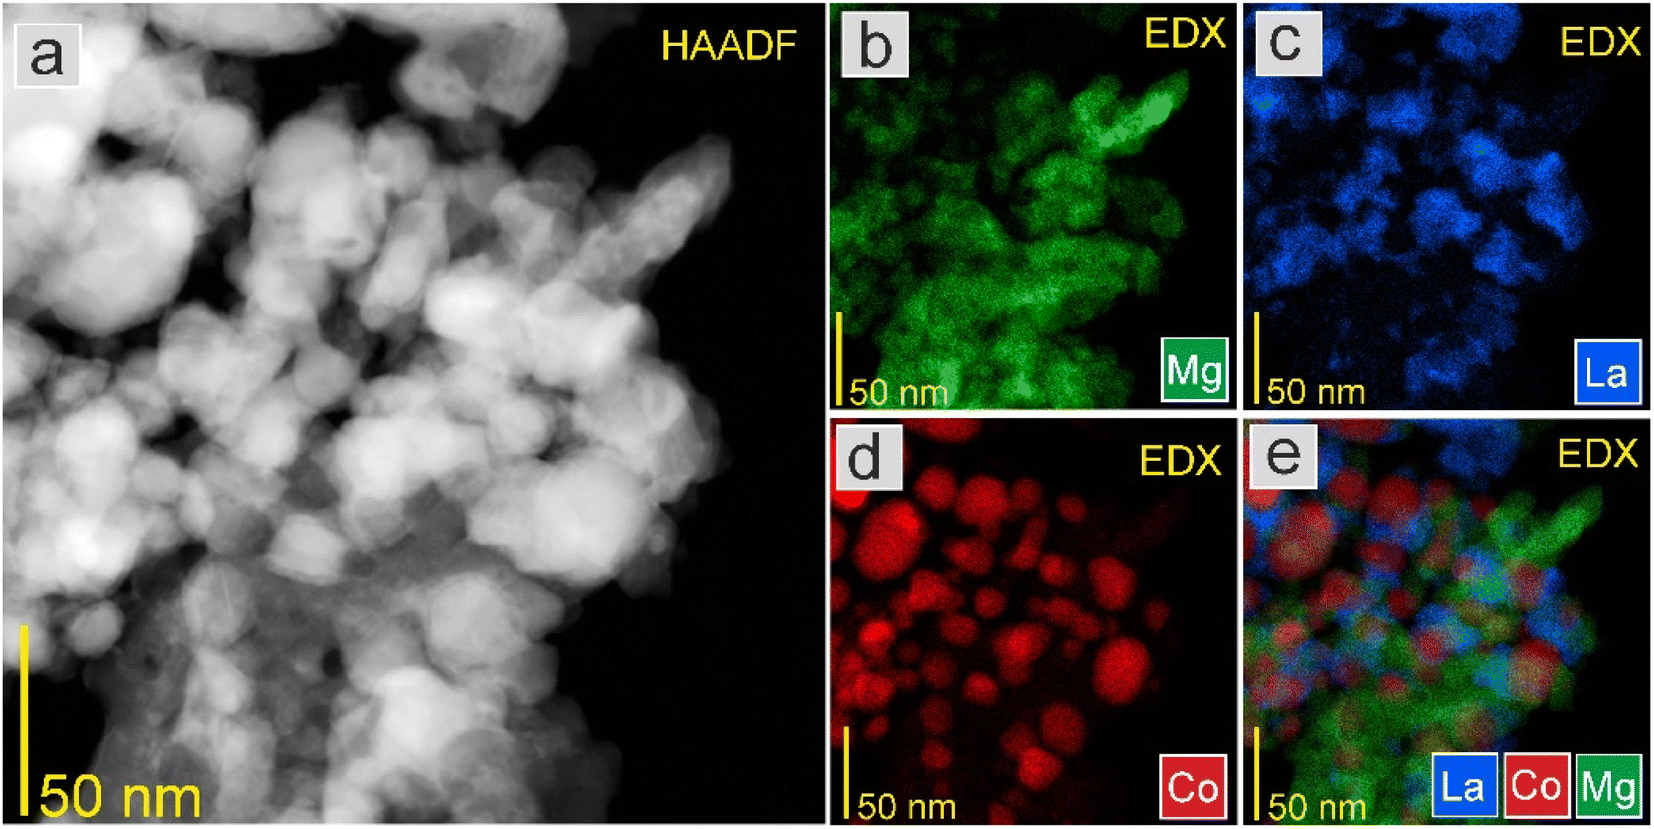
The STEM-EDS mapping was further conducted to study the element distribution in the catalysts. As displayed in Fig. 5, in Co1, the Co nanoparticles were uniformly dispersed on the support, with an average particle size of 29.4 nm. By contrast, in 5K–Co1, the Co nanoparticles were not uniformly dispersed on the support, with an average particle size of 82.5 nm. The K species were not observed due to the low content (Fig. 6). This demonstrates that the K-modification caused the sintering of Co nanoparticles (NPs), which diminished Co exposure. These observations agree well with the XRD results mentioned above.
 | ||
| Fig. 5 (a) HAADF-STEM image at low magnification and EDS elemental mapping of (b) Mg, (c) La, (d) Co, and (e) overlay of La, Co, and Mg elements of the Co1 catalyst. | ||
 | ||
| Fig. 6 (a) HAADF-STEM image at low magnification and EDS elemental mapping of (b) Mg, (c) La, (d) Co, and (e) overlay of La, Co, and Mg elements of the 5K–Co1 catalyst. | ||
The chemisorptive properties of the catalysts were studied by hydrogen TPD. Fig. 7 shows the H2-TPD profiles of Co1 and 5K–Co1 reduced for different times. Both Co1 and 5K–Co1 displayed similar profiles consisting of two overlapping peaks occurring in the low-temperature (<100 °C) and medium-temperature (at 250 °C) regions. These were associated with the desorption of H2 that was weakly and intermediately bound to the Co surface.18,30 As already observed (Fig. 2), the K addition strongly affected the surface Co adsorption properties. It was revealed that the K-modification did not affect the nature of adsorption sites, but it considerably affected (decreased by ∼5-fold) the number of active sites for H2 adsorption (Fig. 7). Meanwhile, a ∼3-fold decrease in the BET surface area and Co particle size was observed (Table 2, Fig. 5 and 6), indicating that the loss of active sites was the result of the sintering of the catalyst as well as excessive coverage of the Co surface by the K species. With the prolonging of reduction time, no significant differences in the adsorption behaviour of Co1 and 5K–Co1 were observed (Fig. 7). The good stability of 5K–Co1 implies that the catalyst surface was still rich in K, and further overheating under reductive conditions did not lead to further K evaporation from the catalyst surface and unblocking of the active sites. This strongly suggests that the layer of K species on the Co NPs was stable; thus, no further changes in the surface composition were to be expected. This is reasonable since the 5K–Co1 catalytic activity was stable for at least 28 days (Fig. 3).
 | ||
| Fig. 7 (a) H2-TPD profiles and (b) the dependence of the amount of desorbed H2 with respect to the catalyst reduction time of the Co1 and 5K–Co1 catalysts. | ||
The results derived from the hydrogen TPD studies correspond well with those obtained from the XPS. The XPS analysis indicated that the surface of 5K–Co1 was enriched with K compared to the bulk, whereas the surface was depleted from cobalt (24.9 vs. 2.7 at%). Such a low Co surface concentration prevented the access of reagents to the catalytic active sites. Most importantly, the XPS analysis indicated that K was present as an oxide on the catalyst surface. The Co surface concentration in Co1 was found to be ∼3 times higher than that of 5K–Co1, which features a higher availability of active sites. However, although the Co1 sample was not modified with K, the surface was enriched with K (6 at%) (Table 3). This is because the K2CO3 and KOH were used as precipitating agents for the support preparation, and the residual potassium ions were found to be not completely washed out (Table 1). Later, the effect of the residual K element was studied.
| Catalyst | Surface content (at%) | |
|---|---|---|
| Co | K | |
| Co1 | 18.3 | 6.0 |
| 5K–Co1 | 2.7 | 24.9 |
The carbon dioxide TPD was measured to study the surface basicity, particularly the nature and strength of basic sites.33 Since CO2 adsorption on metallic Co is rather weak,34 the CO2 desorption peaks in the TPD profiles (Fig. 8) were ascribed to the basic sites on MgO and La2O3 oxides. As seen in Fig. 8, both samples exhibited overlapping desorption peaks in the temperature ranges of 50–150 °C, 150–450 °C and 450–600 °C. The low-temperature (50–150 °C) and medium-temperature range (150–450 °C) desorption peaks were ascribed to the weak and medium basic sites, whereas the desorption peak at the high-temperature (450–600 °C) was ascribed to the strong basic sites.35,36 It has been confirmed that the medium and strong basic sites are of paramount importance in the ammonia synthesis reaction.16 The role of these basic sites is to be the electron donation to the transition metal active sites, thus promoting the activation of N2. Most importantly, the number of basic sites was much larger for Co1 than for 5K–Co1 (Table 4). However, when analysing the density of basic sites, there were no significant differences (Table 4); therefore, it could be concluded that the decreased number of basic sites observed in 5K–Co1 compared to that in Co1 was the result of the decreased surface area of 5K–Co1 (Table 2). The weak basicity and reduced number of basic sites in 5K–Co1 were deduced to be responsible for the observed decrease in the intrinsic activity of the active sites (TOF) (Fig. 1), probably due to a change in the electronic structure of active sites.
 | ||
| Fig. 8 CO2-TPD profiles of the Co1 and 5K–Co1 catalysts. | ||
| Catalyst | Basicity | |
|---|---|---|
| Number of basic sites (μmol g−1) | Density of basic sites (μmol m−2) | |
| Co1 | 153 | 4.9 |
| 5K–Co1 | 47 | 4.8 |
Based on the presented results, the mechanism of surface enrichment with K was proposed. K in the as-prepared catalysts existed in the form of KNO3. Because KNO3 has a low melting point (Tm ≈ 334 °C), it was liquefied and migrated easily across the surface, but due to the high surface energy of Co, the KNO3 salt preferably migrated to the Co surface, where it was decomposed to K2O, and then the majority of K2O was reduced to metallic K, which was subsequently evaporated.11 Meanwhile, the Co oxide was reduced to Co and Co NPs moved across the support, came into contact with each other and became sintered. The residual K2O interacted strongly with the Co surface, forming a thin layer (without many voids) that blocked and, therefore, reduced the availability of Co sites (Fig. 2); the more KNO3 salt was introduced, the more enriched in K (in the form of oxide) the surface was. The schematic representation of the proposed surface structures is presented in Scheme 1.
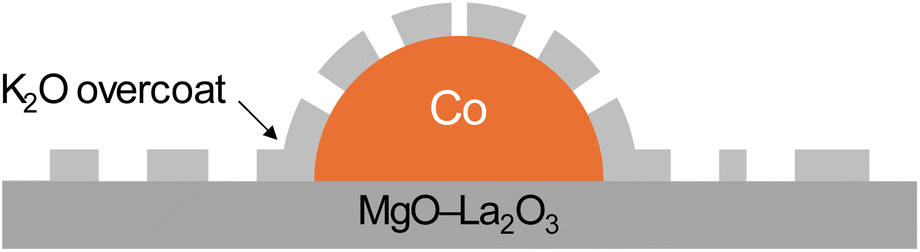 | ||
| Scheme 1 Schematic illustration of the proposed surface structures of the K–Co1 catalysts. | ||
To sum up, this part of the study revealed that potassium had a tendency to segregate on the surface of the Co nanoparticles during the high-temperature reduction, forming a thin K2O overcoat (Scheme 1). Moreover, potassium modification contributed to the sintering of the catalyst, as reflected in decreased surface area and increased Co particle size. Therefore, it can be concluded that the ammonia synthesis rate decreased due to the sintering of the catalyst and excessive coverage of the Co surface by the K2O species.
3.3. Effect of precipitating-agent
As already mentioned, potassium has a detrimental effect on ammonia formation. Keeping in mind that residual K was present in the MgLa1 support used for the preparation of the Co1 catalyst (K ions were not completely washed out), there was a necessity to investigate how the residual K affected the catalyst properties. To this aim, the mixed magnesium–lanthanum oxide support was synthesised using ammonium carbonate and ammonia mixture (MgLa2). The basic characteristics of the support addressed in the ESI† demonstrated that MgLa1 had a better-developed porous structure compared to MgLa2; the BET surface area of MgLa1 was 96.7 m2 g−1, which was almost twice that of MgLa2 (53.9 m2 g−1) (Table S1 and Fig. S1†). This clearly shows that the type of precipitating agent affected the porous structure of the solids, which correspondingly influenced the catalyst properties, including the distribution of the active sites, as shown later. The XRD patterns of the supports were recorded in their calcined state and are shown in Fig. S2.† The XRD results indicated that the supports were highly crystalline, with the characteristic peaks corresponding to MgO and La2O3. The low-intensity peaks related to La(OH)3 (PDF 36-1481) and La2O2CO3 (PDF 25-0424) were also observed, indicating that La2O3 was sensitive to moisture and CO2 content in air.37Catalyst characteristics were then evaluated, and the basic physicochemical properties are shown in Table 5.
| Catalyst | Co2 |
|---|---|
| a Co content was determined by XRF.b Co particle size was determined by STEM-EDS.c Specific surface area was determined by BET method.d Basicity was determined by CO2-TPD. | |
| Co contenta (wt%) | 38.6 |
| Co particle sizeb (nm) | 31.2 |
| Specific surface areac (m2 g−1) | 29.3 |
| Number of basic sitesd (μmol g−1) | 143 |
| Density of basic sitesd (μmol m−2) | 4.9 |
Fig. 9 shows the XRD patterns of the Co2 catalyst collected at different reduction times. The XRD patterns showed that, besides the diffraction peaks assigned to MgO and La2O3, the peaks related to the metallic fcc Co phase were observed, indicating that the loaded Co metal species were completely reduced to the metallic Co. Meanwhile, further prolonging the reduction time did not lead to any significant changes in the catalyst crystallinity. Co2 was resistant to sintering, as indicated by similar crystallite sizes for identified phases (Fig. 9, right). Compared to the counterpart Co1 (Fig. 4a), similar structural characteristics were found. Most importantly, the determined Co crystal size for Co1 and Co2 was similar (Fig. 4a and 9), indicating that the type of support did not affect the Co size and structure.
 | ||
| Fig. 9 XRD patterns (left) and the dependence of crystallite size with respect to the catalyst reduction time (right) of the Co2 catalyst reduced for different times. | ||
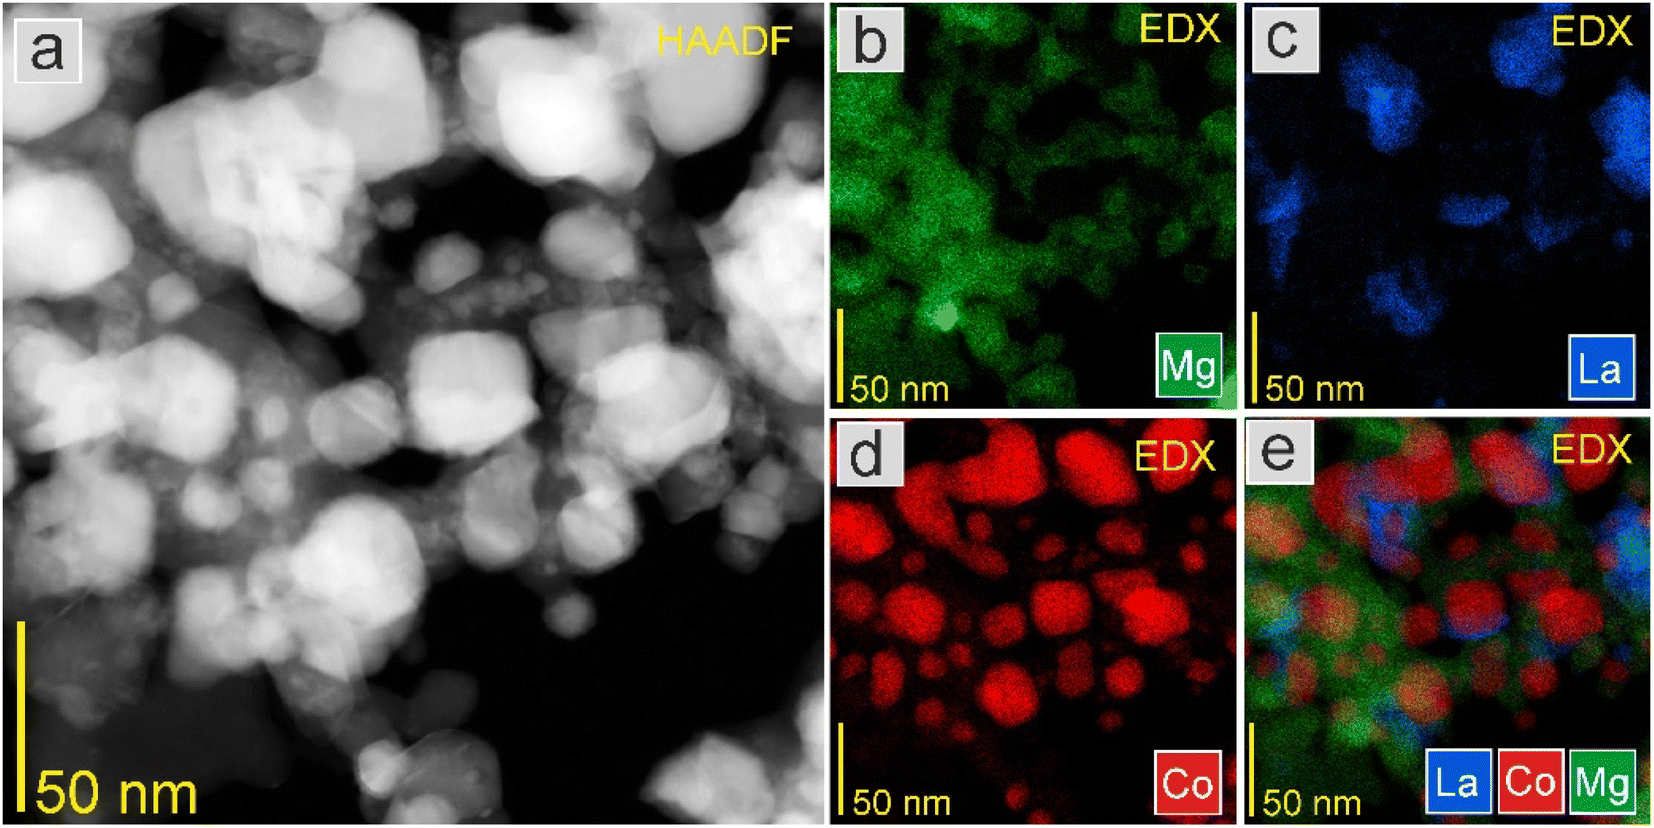
As seen in Fig. 10 and 11, the STEM-EDS mapping images revealed the uniform distribution of Co nanoparticles on the support. There were no visible changes in the morphology and most Co nanoparticles had a relatively small size distribution. The average Co particle size for Co2 was 31.2 nm, which was comparable to that of Co1 (29.4 nm). This indicates that the differences in the support surface area did not significantly affect the particle size and distribution of Co. This was supported by similar catalyst surface areas (Tables 2 and 5).
 | ||
| Fig. 10 (a) HAADF-STEM image at high magnification and EDS elemental mapping of (b) Mg, (c) La, (d) Co, and (e) overlay of La, Co, and Mg elements of the Co1 catalyst. | ||
 | ||
| Fig. 11 (a) HAADF-STEM image at high magnification and EDS elemental mapping of (b) Mg, La (c), (d) Co, and (e) overlay of La, Co, and Mg elements of the Co2 catalyst. | ||
Fig. 12 shows the hydrogen TPD profiles of the Co2 catalysts reduced for different times. There was one desorption peak in the low-temperature region (at around 115 °C) associated with the desorption of H2 that was weakly bound to the Co surface. With the prolonging of reduction time, no significant differences in the adsorption behaviour were observed, indicating that the catalyst was stable and did not lose the active sites due to particle sintering (Fig. 12). Compared to the counterpart Co1 (Fig. 7), slight differences in the hydrogen adsorption properties were found. For Co1, two types of adsorption sites (weak and medium) were present, whereas for Co2, only weak adsorption sites were present. Moreover, the Co1 catalyst possessed more adsorption sites than the Co2 catalyst; after reduction for 108 h, the total hydrogen uptake of Co1 was 100 μmol g−1, whereas, for Co2, it was 77 μmol g−1. This might suggest that the type of support modulated the electronic state of active sites, affecting their adsorption properties. This is reasonable since the loading and size of Co were similar in Co1 and Co2 (Tables 1 and 5). Indeed, it has previously been reported that the hydrogen adsorption properties are modulated by the surface basicity.38,39 Most importantly, the H2-TPD analysis revealed that the residual K in Co1 did not have a detrimental effect on the hydrogen adsorption properties. Thus, it seems that the residual K in Co1 interacted stronger with the support rather than the cobalt surface.
 | ||
| Fig. 12 (a) H2-TPD profiles and (b) the dependence of the amount of desorbed H2 with respect to the catalyst reduction time of the Co2 catalyst. | ||
Next, the basicity was evaluated, and the CO2-TPD profile is presented in Fig. 13. The CO2-TPD profile is similar to that of Co1, featuring overlapping desorption peaks belonging to the weak basic sites at 50–150 °C, medium basic sites at 150–450 °C and strong basic sites at 450–600 °C. Notably, the basic properties of Co2 are similar to that of Co1 (Tables 4 and 5). This indicates that the residual K in the support oxide did not deteriorate the surface basicity. It seems that the residual K species was even beneficial in enhancing the support basicity. Indeed, it has been reported that K-modified MgO can show increased basicity if an appropriate amount of K is introduced.40 The authors suggest that K+ can be doped into MgO to form stable K+/MgO surface species with medium basic strengths.40 The same beneficial effect of K+ doping into ZrO2 on the surface basicity was reported.41 However, when K salt was introduced to Co1, a pronounced decrease in the number of basic sites was observed; the basic sites decreased from 153 to 47 μmol g−1 (Table 4). However, as previously discussed, this effect was associated with the catalyst sintering and loss of surface area.
 | ||
| Fig. 13 CO2-TPD profile of the Co2 catalyst. | ||
Next, the ammonia synthesis activity of the Co1 and Co2 catalysts was examined. Fig. 14a shows the ammonia synthesis rate of the catalysts at 400–470 °C. The results disclose that the ammonia synthesis rates of Co1 were higher than those of Co2. For example, at 400 °C, the NH3 synthesis rate of Co1 (0.92 gNH3 g−1 h−1) was about 1.3 times higher than that of Co2 (0.73 gNH3 g−1 h−1). In addition, the ammonia synthesis rate over Co1 and Co2 remained stable for 28 days, demonstrating the long-term stability of the catalysts. Fig. S6† shows that the apparent activation energies (Ea) derived from the slopes of the Arrhenius plot are 52.0 kJ mol−1 for Co1 and 54.8 kJ mol−1 for Co2, indicating that the presence of K in Co1 did not affect the activation energy to any significant degree.
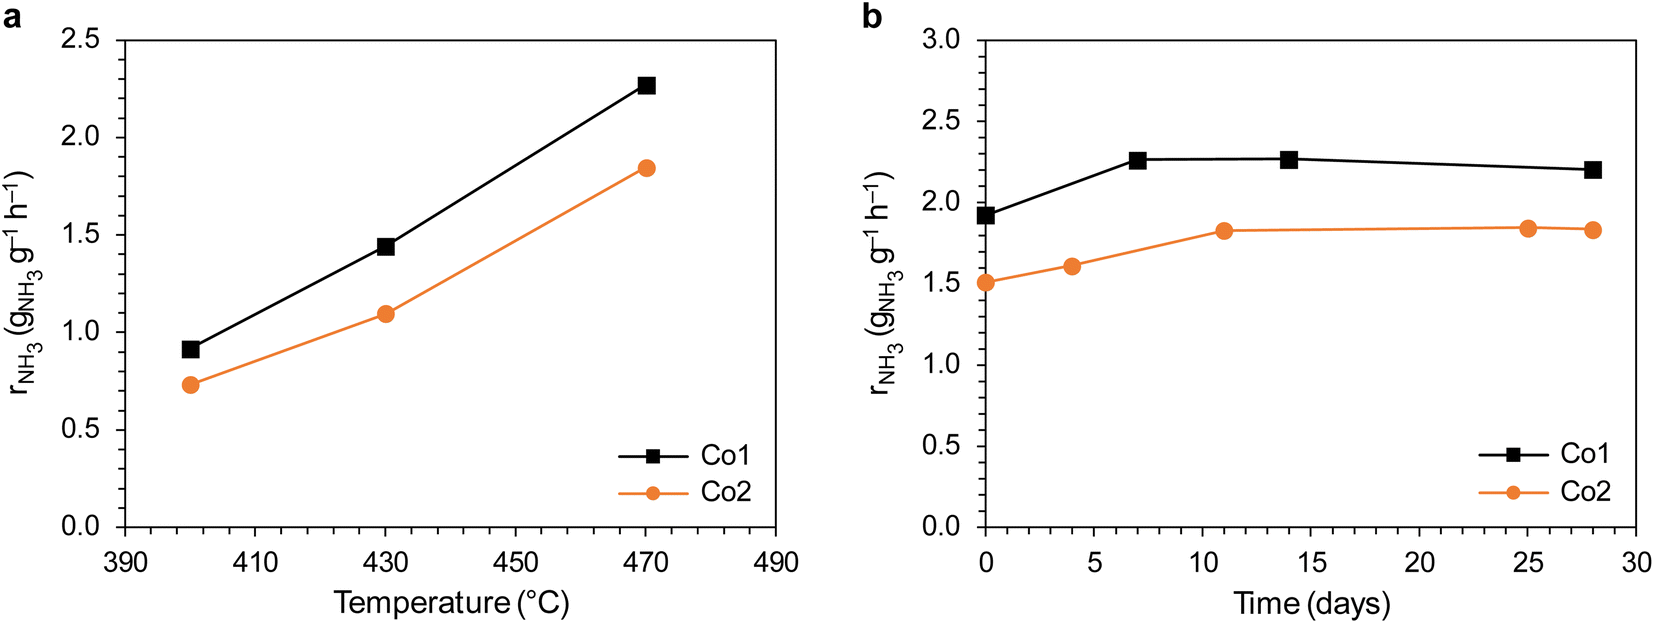 | ||
| Fig. 14 (a) Temperature dependence of NH3 synthesis rate of the Co1 and Co2 catalysts at 6.3 MPa. (b) Time-on-stream performance of the Co1 and Co2 catalysts. The data points indicate the ammonia synthesis rate measured at 470 °C and 6.3 MPa. The catalysts were overheated at 600 °C during the intervals between measurements. | ||
Based on the results, it is suggested that the enhancement of the ammonia synthesis rates over the Co1 catalyst was attributable to its increased basicity, which was proved by the TPD-CO2 analysis. The increased basicity could be explained by the presence of K+/MgO surface species, which can be formed if an appropriate amount of K is introduced.40 Thus, the main conclusion from this part of the study is that using K2CO3 and KOH as precipitating agents for the support preparation is not detrimental to the cobalt catalyst activity, even if residual K is present. It could even be beneficial, as already shown.
4. Conclusions
In summary, it was demonstrated that there was a strong correlation between the modulation by K doping and the performance of ammonia synthesis reaction for the Co catalysts. The K addition was found to be detrimental to the catalyst activity; with the increase of K content from 0 to 9 wt%, the NH3 synthesis rate decreased gradually from 2.08 to 0.02 gNH3 g−1 h−1. Through TGA-TPR, it was found that the potassium oxide was unstable and reducible to metallic K under activation conditions. K was then volatilised from the catalyst surface. ICP and XRF confirmed that all the catalysts contained ∼0.2 wt% K. The residual K, in the form of oxide, had a tendency to segregate on the surface of the Co NPs, forming a thin layer that reduced the availability of Co sites. In addition, the presence of K caused the catalyst sintering, which was reflected in the decrease in surface area and the increase in Co particle size. All these led to the irreversible loss of the active sites, which contributed to the poor performance of the K-doped catalysts. Thus, it is suggested that potassium is not a good additive for promoting ammonia synthesis rate over the cobalt-based catalysts.Data availability
The data supporting this article have been included as part of the ESI.†Author contributions
H. R. conceived the idea for this study and designed the experiments. H. R. and M. Z. prepared the samples. H. R. and M. Z. performed the gas sorption experiments. H. R., M. Z., W. P., and W. R.-P. performed the catalytic measurements. A. O. carried out the XRD measurements. K. S. conducted the STEM-EDS characterisations. D. M. carried out the XPS measurements. M. Z. and W. R.-P. provided suggestions and feedback on the study. H. R. prepared the manuscript and ESI.†Conflicts of interest
The authors declare that they have no known competing financial interests or personal relationships that could have appeared to influence the work reported in this paper.Acknowledgements
Research was funded by Warsaw University of Technology within the Excellence Initiative: Research University (IDUB) programme.References
- J. Andrews and B. Shabani, Where does Hydrogen Fit in a Sustainable Energy Economy?, Procedia Eng., 2012, 49, 15–25, DOI:10.1016/j.proeng.2012.10.107.
- L. Wang, M. Xia, H. Wang, K. Huang, C. Qian, C. T. Maravelias and G. A. Ozin, Greening Ammonia toward the Solar Ammonia Refinery, Joule, 2018, 2, 1055–1074, DOI:10.1016/j.joule.2018.04.017.
- A. Midilli and I. Dincer, Hydrogen as a renewable and sustainable solution in reducing global fossil fuel consumption, Int. J. Hydrogen Energy, 2008, 33, 4209–4222, DOI:10.1016/j.ijhydene.2008.05.024.
- J. Humphreys, R. Lan and S. Tao, Development and Recent Progress on Ammonia Synthesis Catalysts for Haber–Bosch Process, Adv. Energy Sustainability Res., 2021, 2, 2000043, DOI:10.1002/aesr.202000043.
- N. D. Spencer, R. C. Schoonmaker and G. Somorjai, Structure sensitivity in the iron single-crystal catalyzed synthesis of ammonia, Nature, 1981, 294, 643–644, DOI:10.1038/294643a0.
- K. Aika, T. Takano and S. Murata, Preparation and characterization of chlorine-free ruthenium catalysts and the promoter effect in ammonia synthesis: 3. A magnesia-supported ruthenium catalyst, J. Catal., 1992, 136, 126–140, DOI:10.1016/0021-9517(92)90112-U.
- C. J. H. Jacobsen, S. Dahl, B. S. Clausen, S. Bahn, A. Logadottir and J. K. Nørskov, Catalyst Design by Interpolation in the Periodic Table: Bimetallic Ammonia Synthesis Catalysts, J. Am. Chem. Soc., 2001, 123, 8404–8405, DOI:10.1021/ja010963d.
- M. Kitano, Y. Inoue, Y. Yamazaki, F. Hayashi, S. Kanbara, S. Matsuishi, T. Yokoyama, S.-W. Kim, M. Hara and H. Hosono, Ammonia synthesis using a stable electride as an electron donor and reversible hydrogen store, Nat. Chem., 2012, 4, 934–940, DOI:10.1038/nchem.1476.
- S. Hagen, R. Barfod, R. Fehrmann, C. J. H. Jacobsen, H. T. Teunissen and I. Chorkendorff, Ammonia synthesis with barium-promoted iron–cobalt alloys supported on carbon, J. Catal., 2003, 214, 327–335, DOI:10.1016/S0021-9517(02)00182-3.
- G. Fagherazzi, F. Galante, F. Garbassi and N. Pernicone, Structural study of the Al2O3-promoted ammonia synthesis catalyst: II. Reduced state, J. Catal., 1972, 26, 344–347, DOI:10.1016/0021-9517(72)90094-2.
- J.-H. Kim, T.-Y. Dai, M. Yang, J.-M. Seo, J. S. Lee, D. H. Kweon, X.-Y. Lang, K. Ihm, T. J. Shin, G.-F. Han, Q. Jiang and J.-B. Baek, Achieving volatile potassium promoted ammonia synthesis via mechanochemistry, Nat. Commun., 2023, 14, 2319, DOI:10.1038/s41467-023-38050-2.
- G. Ertl, M. Weiss and S. B. Lee, The role of potassium in the catalytic synthesis of ammonia, Chem. Phys. Lett., 1979, 60, 391–394, DOI:10.1016/0009-2614(79)80595-3.
- I. Rossetti, N. Pernicone and L. Forni, Promoters effect in Ru/C ammonia synthesis catalyst, Appl. Catal., A, 2001, 208, 271–278, DOI:10.1016/S0926-860X(00)00711-0.
- Z. Kowalczyk, J. Sentek, S. Jodzis, E. Mizera, J. Góralski, T. Paryjczak and R. Diduszko, An alkali-promoted ruthenium catalyst for the synthesis of ammonia, supported on thermally modified active carbon, Catal. Lett., 1997, 45, 65–72, DOI:10.1023/A:1018970318628.
- C. Li, Y. Shi, Z. Zhang, J. Ni, X. Wang, J. Lin, B. Lin and L. Jiang, Improving the ammonia synthesis activity of Ru/CeO2 through enhancement of the metal–support interaction, J. Energy Chem., 2021, 60, 403–409, DOI:10.1016/j.jechem.2021.01.031.
- W. Li, S. Wang and J. Li, Effect of rare earth elements (La, Y, Pr) in multi-element composite perovskite oxide supports for ammonia synthesis, J. Rare Earths, 2021, 39, 427–433, DOI:10.1016/j.jre.2020.06.006.
- B. Lin, Y. Liu, L. Heng, J. Ni, J. Lin and L. Jiang, Effect of barium and potassium promoter on Co/CeO2 catalysts in ammonia synthesis, J. Rare Earths, 2018, 36, 703–707, DOI:10.1016/j.jre.2018.01.017.
- X. Wang, L. Li, T. Zhang, B. Lin, J. Ni, C.-T. Au and L. Jiang, Strong metal–support interactions of Co-based catalysts facilitated by dopamine for highly efficient ammonia synthesis: in situ XPS and XAFS spectroscopy coupled with TPD studies, Chem. Commun., 2019, 55, 474–477, 10.1039/C8CC07130F.
- M. Karolewska, E. Truszkiewicz, B. Mierzwa, L. Kępiński and W. Raróg-Pilecka, Ammonia synthesis over cobalt catalysts doped with cerium and barium. Effect of the ceria loading, Appl. Catal., A, 2012, 445–446, 280–286, DOI:10.1016/j.apcata.2012.08.028.
- B.-Y. Zhang, P.-P. Chen, J.-X. Liu, H.-Y. Su and W.-X. Li, Influence of Cobalt Crystal Structures on Activation of Nitrogen Molecule: A First-Principles Study, J. Phys. Chem. C, 2019, 123, 10956–10966, DOI:10.1021/acs.jpcc.9b00590.
- W. Patkowski, M. Zybert, H. Ronduda, A. Albrecht, D. Moszyński, A. Fidler, P. Dłużewski, B. Mierzwa and W. Raróg-Pilecka, Toward green ammonia synthesis – exploring the influence of lanthanide oxides as supports on the cobalt catalysts properties, J. CO2 Util., 2024, 80, 102699, DOI:10.1016/j.jcou.2024.102699.
- A. Cao, V. J. Bukas, V. Shadravan, Z. Wang, H. Li, J. Kibsgaard, I. Chorkendorff and J. K. Nørskov, Nat. Commun., 2022, 13, 2382, DOI:10.1038/s41467-022-30034-y.
- H. Ronduda, M. Zybert, W. Patkowski, A. Ostrowski, P. Jodłowski, D. Szymański, L. Kępiński and W. Raróg-Pilecka, Development of cobalt catalyst supported on MgO–Ln2O3 (Ln = La, Nd, Eu) mixed oxide systems for ammonia synthesis, Int. J. Hydrogen Energy, 2022, 47, 6666–6678, DOI:10.1016/j.ijhydene.2021.12.022.
- H. Ronduda, M. Zybert, W. Patkowski, A. Ostrowski, P. Jodłowski, D. Szymański and W. Raróg-Pilecka, Co supported on Mg–La mixed oxides as an efficient catalyst for ammonia synthesis, Int. J. Hydrogen Energy, 2022, 47, 35689–35700, DOI:10.1016/j.ijhydene.2022.08.144.
- H. Ronduda, M. Zybert, W. Patkowski, K. Sobczak, D. Moszyński, A. Albrecht, A. Sarnecki and W. Raróg-Pilecka, On the effect of metal loading on the performance of Co catalysts supported on mixed MgO–La2O3 oxides for ammonia synthesis, RSC Adv., 2022, 12, 33876–33888, 10.1039/D2RA06053A.
- Z. Kowalczyk, S. Jodzis and J. Sentek, Studies on kinetics of ammonia synthesis over ruthenium catalyst supported on active carbon, Appl. Catal., A, 1996, 138, 83–91, DOI:10.1016/0926-860X(95)00251-0.
- R. C. Reuel and C. H. Bartholomew, The stoichiometries of H2 and CO adsorptions on cobalt: effects of support and preparation, J. Catal., 1984, 85, 63–77, DOI:10.1016/0021-9517(84)90110-6.
- S. Reichle, M. Felderhoff and F. Schüth, Mechanocatalytic Room-Temperature Synthesis of Ammonia from Its Elements Down to Atmospheric Pressure, Angew. Chem., Int. Ed., 2021, 60, 26385, DOI:10.1002/anie.202112095.
- T. Otowa, R. Tanibata and M. Itoh, Production and adsorption characteristics of MAXSORB: high-surface-area active carbon, Gas Separ. Purif., 1993, 7, 241–245, DOI:10.1016/0950-4214(93)80024-Q.
- L. Huazhang, L. Caibo, L. Xiaonian and C. Yaqing, Effect of an Iron Oxide Precursor on the H2 Desorption Performance for an Ammonia Synthesis Catalyst, Ind. Eng. Chem. Res., 2003, 42, 1347–1349, DOI:10.1021/ie0202524.
- G. Grzybek, K. Góra-Marek, P. Patulski, M. Greluk, M. Rotko, G. Słowik and A. Kotarba, Optimization of the potassium promotion of the Co|α-Al2O3 catalyst for the effective hydrogen production via ethanol steam reforming, Appl. Catal., A, 2021, 614, 118051, DOI:10.1016/j.apcata.2021.118051.
- P. Adamski, W. Czerwonko, A. Ablrecht and D. Moszyński, The Influence of Potassium Promotion on the Structural Properties of Cobalt Molybdenum Nitrides in Ammonia Synthesis, Catalysts, 2023, 13, 1158, DOI:10.3390/catal13081158.
- Z. Wang, B. Liu and J. Lin, Highly effective perovskite-type BaZrO3 supported Ru catalyst for ammonia synthesis, Appl. Catal., A, 2013, 458, 130–136, DOI:10.1016/j.apcata.2013.03.037.
- C. G. Visconti, L. Lietti, E. Tronconi, P. Forzatti, R. Zennaro and E. Finocchio, Fischer–Tropsch synthesis on a Co/Al2O3 catalyst with CO2 containing syngas, Appl. Catal., A, 2009, 355, 61–68, DOI:10.1016/j.apcata.2008.11.027.
- X. Jiang, B. M. Lis, S. C. Purdy, S. Paladugu, V. Fung, W. Quan, Z. Bao, W. Yang, Y. He, B. G. Sumpter, K. Page, I. E. Wachs and Z. Wu, CO2-Assisted Oxidative Dehydrogenation of Propane over VOx/In2O3 Catalysts: Interplay between Redox Property and Acid–Base Interactions, ACS Catal., 2022, 12, 11239–11252, DOI:10.1021/acscatal.2c02099.
- R. Ye, L. Ma, X. Hong, T. R. Reina, W. Luo, L. Kang, G. Feng, R. Zhang, M. Fan, R. Zhang and J. Liu, Boosting Low-Temperature CO2 Hydrogenation over Ni-based Catalysts by Tuning Strong Metal-Support Interactions, Angew. Chem., Int. Ed., 2024, 63, e202317669, DOI:10.1002/anie.202317669.
- S. Bernal, J. A. Díaz, R. García and J. M. Rodríguez-Izquierdo, Study of some aspects of the reactivity of La2O3 with CO2 and H2O, J. Mater. Sci., 1985, 20, 537–541, DOI:10.1007/BF01026524.
- I. Lucentini, X. Garcia, X. Vendrell and J. Llorca, Review of the decomposition of ammonia to generate hydrogen, Ind. Eng. Chem. Res., 2021, 60, 18560–18611, DOI:10.1021/acs.iecr.1c00843.
- J. Ni, S. Shi, C. Zhang, B. Fang, X. Wang, J. Lin, S. Liang, B. Lin and L. Jiang, Enhanced catalytic performance of the carbon-supported Ru ammonia synthesis catalyst by an introduction of oxygen functional groups via gas-phase oxidation, J. Catal., 2022, 409, 78–86, DOI:10.1016/j.jcat.2022.03.026.
- A. P. C. Teixeira, E. M. Santos, A. F. P. Vieira and R. M. Lago, Use of chrysotile to produce highly dispersed K-doped MgO catalyst for biodiesel synthesis, Chem. Eng. J., 2013, 232, 104–110, DOI:10.1016/j.cej.2013.07.065.
- P. Wang, J. Feng, Y. Zhao, S. Gu and J. Liu, MOF derived mesoporous K-ZrO2 with enhanced basic catalytic performance for Knoevenagel condensations, RSC Adv., 2017, 7, 55920–55926, 10.1039/C7RA12378G.
Footnote |
| † Electronic supplementary information (ESI) available. See DOI: https://doi.org/10.1039/d4ra04517c |
| This journal is © The Royal Society of Chemistry 2024 |