 Open Access Article
Synthesis and photophysical properties of novel bis-quinolin-3-yl-chalcones†
Indhu Chandrasekaran and
S. Sarveswari
 *
*
Department of Chemistry, School of Advanced Sciences, VIT University, Vellore 632014, Tamil Nadu, India. E-mail: ssarveswari@vit.ac.in
First published on 24th September 2024
Abstract
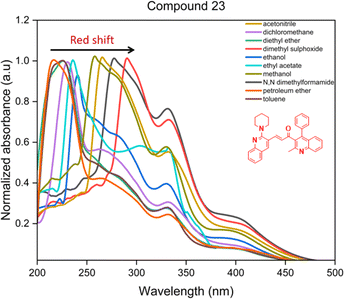
A novel series of unsymmetrical bis-quinolin-3-yl chalcones has been synthesized under visible light using a Claisen–Schmidt condensation reaction between the 2-(morpholine-piperidine-pyrrolidine-thiomorpholine) substituted quinoline-3-carbaldehyde and 1-(2-methyl-4-phenylquinolin-3-yl) ethan-1-one derivatives, conducted at room temperature in the presence of NaOH/EtOH. The structures of the synthesized compounds have been confirmed by NMR spectroscopy and high-resolution mass spectroscopy. The synthesized compounds exhibit λmax values ranging from 215 nm to 290 nm in non-polar to polar solvents, demonstrating positive solvatochromism. Compounds containing nitro group substituent exhibit a significant blue shift owing to their strong electron-withdrawing ability, which also contributes to fluorescence quenching. Geometrical optimization and the calculation of HOMO, LUMO, and energy gap are calculated by using the DFT/B3LYP/6-31G(d) method.
1. Introduction
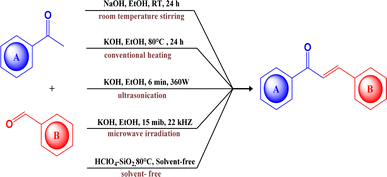
Chalcones are α,β-unsaturated ketones that are naturally distributed in a diverse range of plants, fruits, and vegetables. They serve as important precursors in flavonoid and isoflavonoid synthesis,1,2 contributing significantly to the yellow pigmentation observed in various plant organs.3 Structurally, chalcones consist of two aromatic rings interconnected by a ketoethylenic chain.4 The two aromatic rings in the chalcones often constitute a donor–acceptor–donor (D–A–D) core and generally undergo intramolecular charge transfer (ICT).5 The alteration in its photophysical activity can be achieved by modulating the electron donors or acceptors within the core structure. Beyond their extensive biological applications,6–9 they also act as photoinitiators,10 photosensitizers,11 sensors,12,13 fluorescent dyes,14 fluorescent probes,15 optoelectronic devices,16 and nonlinear optical materials.17,18 They also serve as a precursor for various heterocyclic compounds through ring closure reactions.19,20A plethora of synthetic methods have been reported for chalcone synthesis because of their simplicity of structure, ease of construction, and promising biological activities.21 Several pathways such as Claisen–Schmidt condensation, Carbonylative Heck's coupling reaction, Suzuki–Miyaura's coupling reaction, and Sonogashira's isomerization coupling22 have been employed for the process. But the Claisen–Schmidt condensation is carried out in basic or acidic media under homogeneous conditions23 remains a conventional method. Though it bears several drawbacks such as slow reaction rate, the formation of by-products, and incomplete reaction yet regardless of this it is the most common and simple procedure with enhanced yield as compared to other common methods.24 Traditional Claisen–Schmidt reaction has been performed by using aqueous NaOH or KOH or ethanolic NaOEt at 50 °C over a time of few to several hours.25 It has certain inherent limitations, such as prolonged reaction times, reported lower yield, and a requirement of high temperatures, for example, the Tiwari V.26 (Scheme 1), Desai N. C.,27 and Peerzade N.28 reported the chalcone synthesis in good yield but the reaction duration was about 24 hours. In contrast, Kachadourian R., and Cho C. (Scheme 1), were able to shorten the reaction29,30 duration by elevating the temperature (up to 80 °C), underscoring the role of temperature in accelerating chalcone synthesis and potentially facilitating faster reaction. There are numerous reports utilising microwave irradiation,31–34 sonication,35–37 and conventional reflux methods for this purpose. Although, ultrasonication38 and microwave irradiation39 (Scheme 1) have also positively impacted the reaction duration and the total yield, it requires a comparatively complex setup.
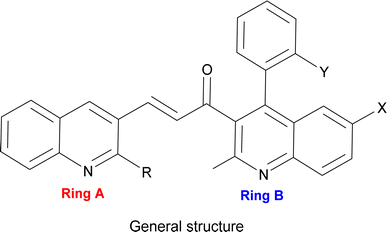
Thus, our curiosity led us to investigate visible light irradiation in the Claisen–Schmidt condensation as an alternative energy source to enhance yields at room temperature with a simpler setup. Visible light irradiation introduces an innovative aspect to the traditional Claisen–Schmidt condensation, providing a mild and sustainable energy source that facilitates the reaction through photochemical pathways. As visible light represents a renewable, clean, and abundant energy source,40 this approach harnesses enough energy to perform the reaction without the disadvantages of thermal activation, such as high temperatures or harsh reaction conditions.41 Recent advances in visible-light-driven organic reactions have attracted extensive attention from the synthetic community.42 It also offers numerous applications, such as mild reaction conditions,43 minimal side reactions,44 simple experimental setups,45 and increased product yields. Under visible light irradiation, electrons can be excited from the ground state to higher-energy orbitals when the incident light energy matches the electronic transition energies in molecules. Electron transitions can occur from the highest occupied molecular orbital (HOMO) to the lowest unoccupied molecular orbital (LUMO). The photoexcited electrons then return to the ground state through electron-vibration coupling, generating heat within the molecules.46,47 Accordingly, we endeavoured to synthesize a novel series of unsymmetrical bis-quinolin-3-yl chalcones (Fig. 1) under visible light. This synthesis involved the incorporation of two crucial groups of quinoline derivatives in terms of application, such as yield 2-(morpholine-piperidine-pyrrolidine-thiomorpholine) substituted quinoline-3-carbaldehyde (3–6) and derivatives of quinoline (12–16). Notably, while quinolinyl chalcones are frequently reported in the literature, reports on bis-quinolin-3-yl chalcones are scarce, with only a few instances documented.48,49
The utilisation of visible light has been positively reflected in both the reaction kinetics and product yield during the present synthesis of bis-quinolin-3-yl chalcones. Thus, a novel series of chalcones were synthesized with improved yield, and shorter reaction duration, without the use of any harsh conditions or reagents. The synthesised compounds were confirmed using spectral techniques, and photophysical investigations were conducted to assess the influence of solvents and substituents. Density Functional Theory (DFT) calculations were also carried out for geometry optimisation and the determination of frontier molecular orbitals. Various global parameters, including Highest Occupied Molecular Orbital (HOMO), Lowest Unoccupied Molecular Orbital (LUMO), energy gap, ionisation potential, hardness, softness, electronegativity, and electrophilicity index were also calculated to elucidate the electronic properties of the synthesised chalcones.
2. Results and discussion
2.1 Chemistry
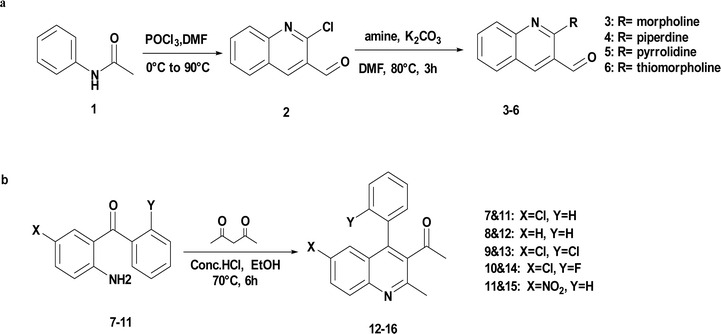
The precursor necessary for the synthesis, 2-chloro quinoline-3-carbaldehyde (2), was synthesised via Vilsmeier–Haack reaction50–53 of acetanilide. Subsequently, it underwent nucleophilic substitution with some secondary amines (R-morpholine, piperidine, pyrrolidine, or thiomorpholine) to yield 2-(morpholine-piperidine-pyrrolidine-thiomorpholine) substituted quinoline-3-carbaldehyde (3–6).54,55 The synthesis of another precursor involved Friedlander cyclization to obtain derivatives of quinoline (12–16) from the corresponding substituted 2-aminobenzophenones (7–11) (where X–Cl, H or NO2 and Y– Cl, H, and F) and acetylacetone in an acidic medium (HCl)56–58 as depicted in Scheme 2.Unsymmetrical bis-quinolin-3-yl chalcones (17–36), were synthesized through Claisen–Schimdt condensation of the aforementioned 2-(morpholine-piperidine-pyrrolidine-thiomorpholine) substituted quinoline-3-carbaldehyde (3–6), and derivatives of quinoline (12–16) with ethanol as solvent. Initially, optimisation of the reaction was performed using the model reaction of 1-(6-chloro-2-methyl-4-phenylquinolin-3-yl)ethan-1-one (12), and 2-morpholinoquinoline-3-carbaldehyde (3) under various conditions (refer to Table 1), including different bases such as NaOH, KOH, K2CO3, and pyridine, under an air atmosphere at room temperature. The progress of the reaction was monitored using Thin Layer Chromatography (TLC), demonstrating the formation of the reaction of the desired product (17), with a better yield of 65% in NaOH. The screening of different bases revealed the initially used NaOH was the best.
| Entry | Base | Light source | Time | Yieldb (%) |
|---|---|---|---|---|
| a Unless otherwise reported, reaction was performed with 3 (1 mmol), 12 (1 mmol), ethanol (10 mL), room temperature.b isolated yields. | ||||
| 1 | NaOH | — | 16 | 65 |
| 2 | KOH | — | 20 | 55 |
| 3 | K2CO3 | — | 18 | 62 |
| 4 | Pyridine | — | 17 | 60 |
| 5 | — | Dark | 24 | — |
| 6 | — | Green LED | 24 | — |
| 7 | — | Blue LED | 24 | — |
| 8 | — | Red LED | 24 | — |
| 9 | NaOH | Dark | 8 | 63 |
| 10 | NaOH | Green LED | 8 | 78 |
| 11 | NaOH | Blue LED | 8 | 92 |
| 12 | NaOH | Red LED | 8 | 70 |
Conversely, the model reaction was conducted under the absence of light and in visible light irradiation to investigate the impact of various sources of visible light on the Claisen–Schmidt condensation. Initially, without any base, no product formation was observed even after 24 hours. Following this, we reintroduced the optimized base, NaOH, into the reaction. Firstly, to optimize the role of the light in this reaction, the reaction was carried out using NaOH as the catalyst in the absence of light, the yield of the desired product was lower, similar to that of entry 1 of Table 1, achieving only 63% at the end of 8 hours. On the other hand, when the model reaction was subjected to various visible light irradiation with the same condition, the one with blue LED irradiation, showed the formation of the desired product with a yield of 92% at the end of 6 hours. This observation reveals that use of a blue LED notably improved the yield to 92%. This significant improvement suggests that visible light enhances yield and reduces the reaction duration by providing the necessary energy for the reaction, overcoming the thermal limitations of conventional heating. The role of light here is analogous to that of any thermal source, enhancing the reaction kinetics by effectively exciting the molecules.
To further validate the practicality of this methodology, a scale-up reaction was performed on a 10 mmol scale. This larger-scale reaction proceeded smoothly under optimized conditions, highlighting the synthetic advantages of this protocol. While we have aimed to achieve shorter reaction durations similar to those obtained with ultrasonication and microwave irradiation, we successfully achieved a comparatively shorter reaction duration than with conventional methods. These findings underscore the potential of visible light as an efficient alternative energy source for driving chemical reactions, offering a green and effective approach to enhancing reaction yields and reducing times.
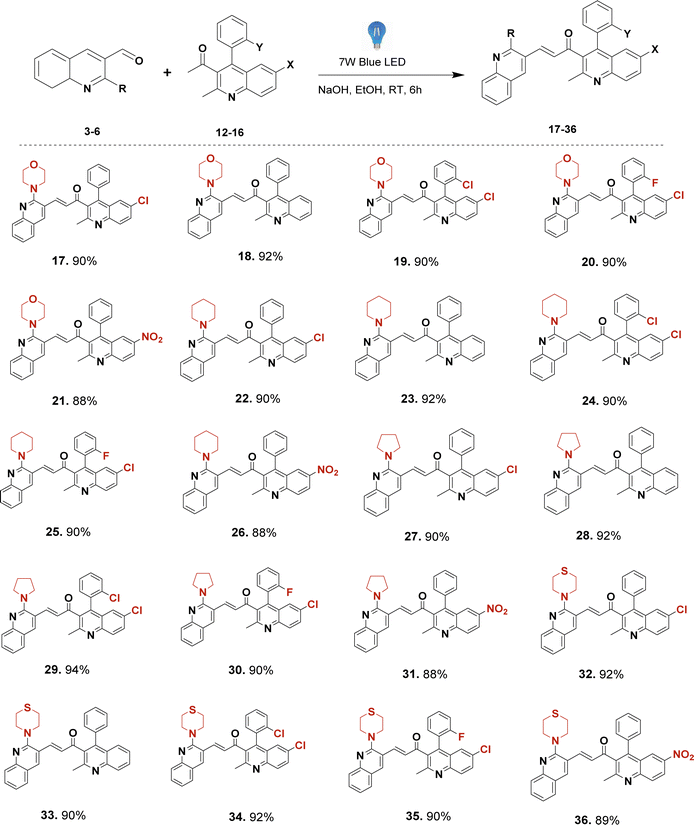
With the established optimal reaction conditions, a range of unsymmetrical bis-quinolin-3-yl chalcones (17–36) (Scheme 3) was synthesised, yielding high to excellent yields exceeding 85%. This protocol avoids the necessity for elevated temperatures, metal catalysts, ultrasound, or microwave irradiation. All the compounds involved filtration of the reaction mixture, followed by pouring into cold water. Subsequently, crude products were purified via column chromatography. Based on the obtained results and existing literature precedents, even though its specific reaction mechanism is not yet apparent, a plausible mechanism may involve promotion of reaction in the presence of visible light by exciting the electrons in the reactants. This excitation can lower the activation energy of the reaction steps, particularly the enolate formation and the nucleophilic attack. Visible light photons are absorbed by the reactants, causing the excitation of π-electrons to higher energy states. The excited state of the carbonyl compounds (both aldehyde and ketone) can have altered electronic distributions, increasing their reactivity towards nucleophilic attack and base catalysis. Then, the base (OH−) can more readily deprotonate the excited ketone, forming the enolate more efficiently. This enol form is highly reactive and readily undergoes subsequent reactions. The enol form of acetophenone reacts with 2-(morpholine-piperidine-pyrrolidine-thiomorpholine) substituted quinoline-3-carbaldehyde via an aldol condensation reaction. The enol attacks the carbonyl carbon of the aldehyde, forming an unstable intermediate. The intermediate formed undergoes dehydration, leading to the formation of a carbon–carbon double bond between the α and β carbons, resulting in the formation of the chalcone. Overall, the visible light provides the energy needed to initiate the photoenolization of acetophenone, which then undergoes subsequent reactions to form the chalcone product. This mechanism allows for the synthesis of chalcones under milder conditions compared to traditional thermal methods.
2.2 Photophysical study
| Compounds | EHOMO (eV) | ELUMO (eV) | Ionisation potential, I = −EHOMO (eV) | Electron affinity, A = −ELUMO (eV) | Hardness η = (I − E)/2 (eV) | Softness, σ = 1/2η (eV) | Electro negativity, χ= (I + E)/2 (eV) | Electrophilicity index, ω = μ2/2η (eV) | Energy band gap, ΔE = |EHOMO − ELUMO| (eV) |
|---|---|---|---|---|---|---|---|---|---|
| 17 | −5.3933 | −2.3211 | 5.3932 | 2.3211 | 1.5360 | 0.3255 | 3.8572 | 4.8428 | 3.07 |
| 18 | −5.3796 | −2.3211 | 5.3796 | 2.3211 | 1.5292 | 0.3269 | 3.8504 | 4.8472 | 3.0585 |
| 19 | −5.4722 | −2.5252 | 5.4722 | 2.5252 | 1.4734 | 0.3393 | 3.9987 | 5.4257 | 2.9469 |
| 20 | −5.4967 | −2.3565 | 5.4967 | 2.3565 | 1.5700 | 0.3184 | 3.9266 | 4.9099 | 3.1401 |
| 21 | −5.5728 | −2.3673 | 5.5728 | 2.3673 | 1.6027 | 0.3119 | 3.9701 | 4.9171 | 3.2055 |
| 22 | −5.4177 | −2.1905 | 5.4177 | 2.1905 | 1.6136 | 0.3098 | 3.8041 | 4.4841 | 3.2272 |
| 23 | −5.3660 | −2.1170 | 5.3660 | 2.1170 | 1.6245 | 0.3077 | 3.7415 | 4.3087 | 3.2490 |
| 24 | −5.4994 | −2.2585 | 5.4994 | 2.2585 | 1.6204 | 0.3085 | 3.8789 | 4.6427 | 3.2408 |
| 25 | −5.4967 | −2.3565 | 5.4967 | 2.3565 | 1.5700 | 0.3184 | 3.9266 | 4.9099 | 3.1401 |
| 26 | −5.5837 | −3.4123 | 5.5837 | 3.4123 | 1.0857 | 0.4605 | 4.4980 | 9.3173 | 2.1714 |
| 27 | −5.5239 | −2.3456 | 5.5239 | 2.3456 | 1.5891 | 0.3146 | 3.9347 | 4.8712 | 3.1782 |
| 28 | −5.4477 | −2.2204 | 5.4477 | 2.2204 | 1.6136 | 0.3098 | 3.8340 | 4.5549 | 3.2272 |
| 29 | −5.5620 | −2.4082 | 5.5620 | 2.4082 | 1.5769 | 0.3170 | 3.9851 | 5.0355 | 3.1538 |
| 30 | −5.4422 | −2.3864 | 5.4422 | 2.3864 | 1.5279 | 0.3272 | 3.9143 | 5.0140 | 3.0558 |
| 31 | −5.6137 | −3.4123 | 5.6137 | 3.4123 | 1.1007 | 0.4542 | 4.5130 | 9.2519 | 2.2014 |
| 32 | −5.6055 | −2.3946 | 5.6055 | 2.3946 | 1.6054 | 0.3114 | 4.0000 | 4.9831 | 3.2109 |
| 33 | −5.4749 | −2.4082 | 5.4749 | 2.4082 | 1.5333 | 0.3260 | 3.9415 | 5.0659 | 3.0667 |
| 34 | −5.6871 | −2.4680 | 5.6871 | 2.4680 | 1.6095 | 0.3106 | 4.0776 | 5.1651 | 3.2191 |
| 35 | −5.6708 | −2.4435 | 5.6708 | 2.4435 | 1.6136 | 0.3098 | 4.0572 | 5.1006 | 3.2272 |
| 36 | −5.7497 | −3.4395 | 5.7497 | 3.4395 | 1.1551 | 0.4328 | 4.5946 | 9.1378 | 2.3102 |
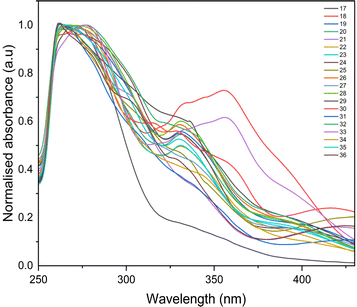
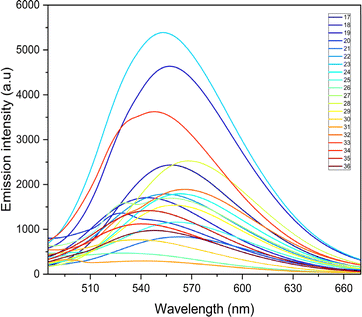
The photophysical properties such as stokes shift, molar extinction coefficient, and quantum yield are calculated and presented in Table 2. Quantum yield for compounds with nitro groups is notably low due to fluorescence quenching. Whereas compounds like 12, 23, 28, and 33 exhibit good quantum yields. Most compounds display stokes shifts exceeding 1.5 × 104 cm−1, indicating vibrational relaxation or thermal energy loss before emission. The fluorescence properties of all the synthesized compounds were measured based on the absorption maxima obtained on UV-visible spectroscopy. The broadened emission peaks suggest strong intermolecular interactions and delocalization of π-electrons among the neighbouring molecules in the solid state 53.59 All the compounds exhibit unique fluorescence in the visible region, consistent with varied quantum yields ranging from 0.1 to 0.7 in acetonitrile. The obtained emission spectra (Fig. 3) are observed in the range of 527 to 568 nm, with compounds containing nitro groups emitting at shorter wavelengths compared to those without substitution. Also, the introduction of the fluorine atom has a negative effect on the quantum yield as well as the emission intensity, indicating that both nitro groups and halide ions present in the compounds act as quenchers.60 Also, fluorescence intensities are influenced by substituents and their electron-withdrawing ability. However, bis-quinolin-3yl chalcone derivatives 18, 23, and 33 exhibit comparatively high fluorescence intensity.
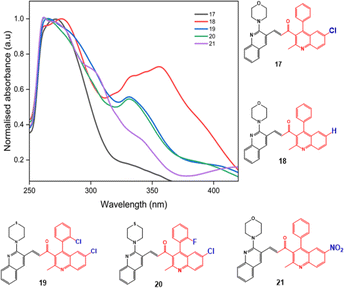
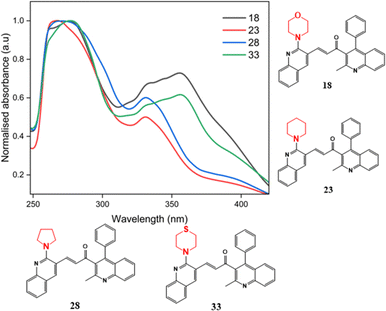
Proceeding to investigate the impact of the insertion of secondary amines morpholine, pyrrolidine, piperidine, and thiomorpholine, the absorption maxima of compounds 18, 23, 28, and 33 in acetonitrile solvent as illustrated in Fig. 6. These compounds, lacking substituents at the 6′ position of ring B, are selected to explore the influence of secondary amine substitution on resultant chalcones. From the graph, an evident shift in the λmax value was observed. The recorded values of λmax are 277 nm, 265 nm, 270 nm, and 278 nm for compounds 18, 23, 28, and 33, respectively. This shift can be attributed to the presence of lone pairs in the sulfur and oxygen atoms of thiomorpholine and morpholine, resulting in comparatively higher wavelengths. Pyrrolidine, a five-membered nitrogen-containing heterocycle, and piperidine, being a basic amine group, displays the shortest wavelength absorption due to its weaker electron-donating effects.
2.3 Computational study
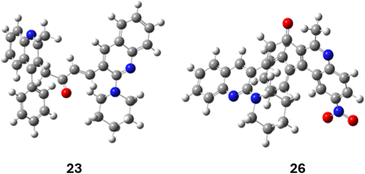
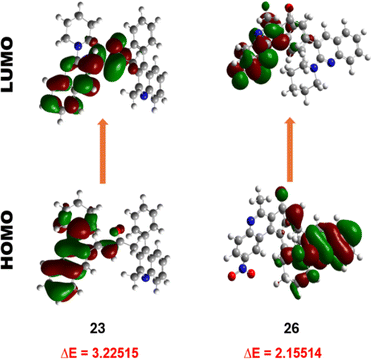
However, the LUMOs exhibit unique localisation patterns for all the compounds. In most compounds, the LUMO is located all over the molecule except for the substitution at the 2nd position of ring A as observed in compounds 17–20. However, in compound 26, the electron density was transferred from the ring A to the ring B upon excitation. This shows the significant interaction between the two quinoline rings. This behaviour is attributed to the presence of a highly electron-withdrawing nitro group substituent in the respective compound, leading to increased intramolecular charge transfer, increased charge separation, and reduced HOMO–LUMO energy band gap compared to the other compounds. The LUMOs of other compounds with nitro group substituents i.e., 21, 31, and 36 also exhibit the same localisation pattern and lower energy band gap values. This observation strengthens our interpretation.
The electron affinity, softness, electronegativity, and electrophilicity index of compound 23 exhibited the lowest values, suggesting it is less prone to undergo charge transfer, affirming its greater stability. Furthermore, compound 26 confirms its greater capacity for energy release, demonstrated by elevated softness, electronegativity, and electrophilicity index value. Compound 36, featuring a nitro substituent, displayed the highest electron affinity, underscoring the influence of electron-withdrawing groups on stability and being more prone to electron transfer. This observation aligns with the broader trend wherein compounds lacking electron-withdrawing substituents on ring B show enhanced stability. In summary, the DFT calculations provide reasonable insights into the electronic structure of the compounds, supporting the impact of structural variations on stability and reactivity.
3. Experimental
3.1 General information
All the reagents and chemicals utilised were purchased from Sigma-Aldrich and employed without further purification. Melting points were determined by employing the open capillary method. Residual moisture in organic extracts was removed using anhydrous Na2SO4. Thin Layer Chromatography (TLC) was conducted on silica gel 60F254 aluminium sheets. Visualization of spots on TLC plates was achieved through UV light irradiation, iodine exposure, or the application of staining solutions such as KMnO4 and ninhydrin. Crude products underwent purification via column chromatography using mesh sizes ranging from 230 to 400. Commercial Blue LEDs rated at 7 W from Crompton were purchased and utilized as such. NMR spectra, including 1H, 13C, and DEPT-135, were recorded on a Bruker 400 MHz spectrometer using CDCl3 as the solvent. Chemical shifts (δ) are reported in parts per million (ppm), coupling constants (J) are expressed in Hertz, and TMS serves as the internal standard. Mass-to-charge ratio (m/z) values were determined via High-Resolution Mass Spectrometry (HRMS) utilizing an Electrospray Ionization (ESI) source.A 100 mL round-bottomed flask was charged with 2-chloro quinoline-3-carbaldehyde (2) (1 mmol, 1 eq.) and dissolved in 10 mL of Dimethyl Formamide (DMF). Subsequently, appropriate secondary amine heterocycles (morpholine, thiomorpholine, piperidine, and pyrrolidine) (2 mmol, 2 eq.) were added dropwise to the reaction mixture, followed by the addition of Potassium Carbonate, K2CO3 (2 mmol, 2 eq.). The reaction mixture was then refluxed for 3 hours at 80 °C, with the progression of the reaction monitored by Thin Layer Chromatography (TLC). Upon completion of the reaction, the organic phase was extracted using ethyl acetate. The organic extract was washed with a brine solution and subsequently filtered through anhydrous Na2SO4 to remove any residual moisture. The solvent was then removed under reduced pressure using a rotary evaporator. The resulting crude product was purified via column chromatography on silica gel, eluting with a solvent mixture of ethyl acetate/hexane (EtOH/Hexane) (8![[thin space (1/6-em)]](https://www.rsc.org/images/entities/char_2009.gif) :
:![[thin space (1/6-em)]](https://www.rsc.org/images/entities/char_2009.gif) 2) to afford the pure compound (3–6).
2) to afford the pure compound (3–6).
3.2 Standard protocol for the synthesis of compounds (12–16)
In a 100 mL round-bottom flask, appropriate 2-amino benzophenone derivatives (7–11) (1 mmol, 1 eq.) were dissolved in 10 mL of ethanol. Acetylacetone (4 mmol, 4 eq.) was subsequently added dropwise to the reaction mixture. A few drops of concentrated hydrochloric acid (conc. HCl) were introduced at 0 °C. Then the reaction temperature was raised to 70 °C and refluxed for six hours. Progress of the reaction was monitored using Thin Layer Chromatography (TLC). Upon cooling, the reaction mixture was poured into cold water to precipitate yellow to off-white solids, which were then filtered under suction, dried, and subjected to recrystallization from ethanol to afford pure compounds (12–16).3.3 Standard protocol for the synthesis of bis-quinolin-3-yl chalcones (17–36)
A mixture of respective compounds (3–6) (1 mmol, 1 eq.) and compounds (12–16) (1 mmol, 1 eq.), dissolved in ethanol (10 mL), was prepared in a reaction vessel equipped with a magnetic stir bar. Then the two pellets of sodium hydroxide (NaOH) were added and subsequently, the reaction mixture was stirred for six to eight hours at room temperature under irradiation with a 7 W Blue LED light source, kept at 2.0 cm away from the reaction vessel. The progress of the reaction was monitored using Thin Layer Chromatography (TLC) throughout the reaction duration. Upon completion of the reaction, observation of a bright yellow single spot on the TLC plate confirmed the full conversion of starting materials. The reaction mixture was then poured into cooled water, resulting in the precipitation of a yellow to orange-colored precipitate. After filtration, the precipitate was washed with cold water and dried. After being filtered out, the residue was washed with cold water and dried. Then the desired bis-quinolin-3-yl chalcones (17–36) were obtained by column chromatography with the solvent mixture of EtOAc/Hexane 8![[thin space (1/6-em)]](https://www.rsc.org/images/entities/char_2009.gif) :
:![[thin space (1/6-em)]](https://www.rsc.org/images/entities/char_2009.gif) 2 and recrystallized using dichloromethane and methanol.
2 and recrystallized using dichloromethane and methanol.
3.4 Photophysical characterisation
Using a spectrophotometer (SHIMADZU, model UV-1800) and a fluorometer (HITACHI, model F-7000), the absorption and emission spectra of the synthesized compounds were recorded using quartz cells with a 1 cm path length at room temperature. All the synthesized bis-quinolin-3-yl chalcones were dissolved in spectroscopic grade solvents of varying polarity, including petroleum ether, toluene, diethyl ether, dichloromethane, ethyl acetate, methanol, ethanol, acetonitrile, dimethylformamide, and dimethyl sulfoxide at a concentration of 2 × 10⁻⁵ mol L−1. All the solutions were readily prepared at the time of the experiment, and it is seen that no aggregation formation occurs at the mentioned concentration. The resulting absorption spectra were utilised to investigate the solvatochromic effects on the compounds. By using the comparison method, the emission quantum yield (Φ) of the compounds in acetonitrile was calculated using the following eqn (1),62–64
 | (1) |
3.5 Computational methods
The computational calculations of the series of novel bis-quinolin-3-yl chalcones were performed using the Gaussian 16W package and the Gauss view 6.1 program with density functional theory, DFT. Becke's hybrid exchange functional called “B3”, combined with the LYP correlation functional, is the most widely applied of the many possible choices of exchange and correlation functionals. This is called the B3LYP method.67 Thus, the geometry of all the synthesized compounds was optimized with the use of the B3LYP functionals and the 6-31G(d) basis set.68 The basis set 631-G(d) is relatively good for energy determinations, and a heavy atom polarization term, d, was included to improve the energy output for large atoms.69 Furthermore, the frontier molecular orbital features, the highest occupied molecular orbital (HOMO), and the lowest unoccupied molecular orbital (LUMO) were computed at the same energy level. Furthermore, the ionization potential (I), electron affinity (A),70 electronegativity (χ), chemical hardness (η), chemical softness (σ), electrophilicity index (ω), nucleophilicity (ε), electron-accepting capacity (ω+), electron-donating power (ω−) are also calculated following Koopmans theorem.4. Conclusion
A new series of bis-quinolin-3-yl chalcones were synthesized successfully by a novel, simple, and straightforward strategy of Claisen–Schmidt condensation under visible light irradiation. The present protocol provides fringe benefits over the traditional method without the use of any additional thermal energy. Moreover, this research sheds light on the relationship between molecular structure and optical properties of the synthesised chalcones. Through a comprehensive investigation encompassing solvatochromism studies, UV-visible absorption spectroscopy, and fluorescence analysis, we have elucidated key factors influencing the absorption and emission behaviour of these compounds. Our findings highlight the significance of solvent polarity, substituent effects, and molecular conformation on the observed spectral shifts and intensity changes. Particularly, compounds 18, 23, 28, and 33 have good stability as well as good fluorescence intensity whereas compounds such as 21, 26, 31, and 36 have less stability owing to the presence of an electron withdrawing group. Overall, this study contributes to the fundamental understanding of all compounds, with potential implications for developing novel photonic materials and applications.Data availability
The data supporting this article have been included as part of the ESI.†Author contributions
Conceptualization: IC; data curation: IC; investigation: IC; methodology: IC; supervision: SS; writing – original: IC; writing – review & editing: SS.Conflicts of interest
There are no conflicts to declare.Acknowledgements
The authors of this paper are very much thankful to the administration, of VIT, Vellore, India for providing the facilities to conduct the research work, for the seed grant SG20230087 and they are also appreciative of SIF-Chemistry for providing the NMR facility. The HRMS facility was also provided by the Chemistry department, at VIT, Vellore, for which the authors are grateful. Also, we would like to thank Dr V. Vijaykumar, professor, of VIT Vellore, for his valuable guidance.Notes and references
- H. Baig, R. Irfan, A. Rasool, S. Z. Hussain, S. A. Siddique, J. Iqbal, M. Alazmi, N. Alshammari, A. Alazmi, A. AlGhadhban, A. M. E. Sulieman, K. B. Said, H. ur Rehman and R. S. Z. Saleem, J. Photochem. Photobiol., A, 2024, 174, 108173 Search PubMed.
- N. K. Sahu, S. S. Balbhadra, J. Choudhary and D. V. Kohli, Curr. Med. Chem., 2012, 19, 209 Search PubMed.
- Y. Xue, Y. Liu, L. An, L. Zhang, Y. Yuan, J. Mou, L. Liu and Y. Zheng, Comput. Theor. Chem., 2011, 965, 146 CrossRef.
- R. K. S. Ahmad, S. D. Kulkarni, P. Melroy Lewis, P. Bhat and N. S. Shetty, J. Photochem. Photobiol., A, 2023, 437, 114494 CrossRef.
- H. Baig, A. Iqbal, A. Rasool, S. Z. Hussain, J. Iqbal, M. Alazmi, N. Alshammari, A. Alazmi, A. AlGhadhban, A. M. E. Sulieman, K. B. Said, H. U. Rehman and R. S. Z. Saleem, ACS Omega, 2023, 8, 28499 CrossRef PubMed.
- C. Y. Yang, M. Y. Lee, Y. L. Chen, J. P. Shiau, Y. H. Tsai, C. N. Yang, H. W. Chang and C. H. Tseng, Int. J. Mol. Sci., 2023, 24(7), 6034 CrossRef PubMed.
- J. Aucamp and D. D. N'Da, Exp. Parasitol., 2022, 236–237, 108249 CrossRef CAS PubMed.
- M. Sharma, V. Chaturvedi, Y. K. Manju, S. Bhatnagar, K. Srivastava, S. K. Puri and P. M. S. Chauhan, Eur. J. Med. Chem., 2009, 44, 2081 CrossRef CAS PubMed.
- R. Abonia, D. Insuasty, J. Castillo, B. Insuasty, J. Quiroga, M. Nogueras and J. Cobo, Eur. J. Med. Chem., 2012, 57, 29 CrossRef CAS PubMed.
- M. Ibrahim-Ouali and F. Dumur, Eur. Polym. J., 2021, 158, 110688 CrossRef CAS.
- M. M. Makhlouf, A. S. Radwan and B. Ghazal, Appl. Surf. Sci., 2018, 452, 337 CrossRef.
- H. Karaca and S. Kazancı, J. Mol. Struct., 2022, 1248, 131454 CrossRef.
- P. Mahesha, N. S. Shetty and S. D. Kulkarni, J. Fluoresc., 2022, 32, 835 CrossRef PubMed.
- S. Wangngae, K. Chansaenpak, J. Nootem, U. Ngivprom, S. Aryamueang, R. Y. Lai and A. Kamkaew, Molecules, 2021, 26, 2979 CrossRef PubMed.
- H. Liu, C. Guo, S. Guo, J. Fan, L. Wang and D. Shi, Talanta, 2019, 201, 301 CrossRef PubMed.
- M. Shkir, P. S. Patil, M. Arora, S. AlFaify and H. Algarni, Spectrochim. Acta, Part A, 2017, 173, 445 CrossRef PubMed.
- N. A. M. Daud, Q. A. Wong, B. S. Ooi, C. K. Quah, F. D. Ramzi, Y.-F. Win and P. S. Patil, Chem. Phys. Impact, 2024, 8, 100565 CrossRef.
- S. Prabu, R. Nagalakshmi and P. Srinivasan, Spectrochim. Acta, Part A, 2013, 103, 45 CrossRef PubMed.
- S. L. Gaonkar and U. N. Vignesh, Res. Chem. Intermed., 2017, 43, 6043 CrossRef.
- A. Rammohan, J. S. Reddy, G. Sravya, C. N. Rao and G. V. Zyryanov, Environ. Chem. Lett., 2020, 18, 433 CrossRef.
- N. A. A. Elkanzi, H. Hrichi, R. A. Alolayan, W. Derafa, F. M. Zahou and R. B. Bakr, ACS Omega, 2022, 7, 27769 CrossRef PubMed.
- S. S. Mukhtar, N. M. Morsy, A. S. Hassan, T. S. Hafez, H. M. Hassaneen and F. M. Saleh, Egypt. J. Chem., 2022, 65(8), 379 Search PubMed.
- G. Rajendran, D. Bhanu, B. Aruchamy, P. Ramani, N. Pandurangan, K. N. Bobba, E. J. Oh, H. Y. Chung, P. Gangadaran and B. C. Ahn, Pharmaceuticals, 2022, 15, 1250 CrossRef PubMed.
- M. A. Shalaby, S. A. Rizk and A. M. Fahim, Org. Biomol. Chem., 2023, 21, 5317 RSC.
- A. Sharma and A. Saraswat, J. Indian Chem. Soc., 2021, 98, 100028 CrossRef.
- V. Tiwari, J. Meshram, P. Ali, J. Sheikh and U. Tripathi, J. Enzyme Inhib. Med. Chem., 2011, 26, 569 CrossRef PubMed.
- N. C. Desai, B. Y. Patel and B. P. Dave, Med. Chem. Res., 2017, 26, 109 CrossRef.
- N. A. Peerzade, S. Y. Jadhav and R. B. Bhosale, Asian J. Chem., 2020, 32, 959 Search PubMed.
- R. Kachadourian, B. J. Day, S. Pugazhenti, C. C. Franklin, E. Genoux-Bastide, G. Mahaffey, C. Gauthier, A. Di Pietro and A. Boumendjel, J. Med. Chem., 2012, 55, 1382 CrossRef.
- C. S. Cho, N. Y. Lee, T.-J. Kim and S. C. Shim, J. Heterocycl. Chem., 2004, 41, 409 CrossRef.
- Y. Hemasri, Heterocycl. Commun., 2009, 15(6), 423 Search PubMed.
- M. Pradeep, M. Vishnuvardhan and T. Gangadhar, Chem. Data Collect., 2023, 46, 101020 CrossRef.
- S. J. Deshpande, P. R. Leger and S. R. Sieck, Tetrahedron Lett., 2012, 53, 1772 CrossRef.
- M. Rayees Ahmad, V. Girija Sastry, N. Bano and S. Anwar, Arabian J. Chem., 2016, 9, S931 CrossRef.
- R. Prasath, P. Bhavana, S. Sarveswari, S. W. Ng and E. R. T. Tiekink, J. Mol. Struct., 2015, 1081, 201 CrossRef.
- R. Prasath, P. Bhavana, S. W. Ng and E. R. T. Tiekink, J. Organomet. Chem., 2013, 726, 62 CrossRef.
- E. Polo, N. Ibarra-Arellano, L. Prent-Peñaloza, A. Morales-Bayuelo, J. Henao, A. Galdámez and M. Gutiérrez, Bioorg. Chem., 2019, 90, 103034 CrossRef PubMed.
- R. Prasath, P. Bhavana, S. Sarveswari, S. W. Ng and E. R. T. Tiekink, J. Mol. Struct., 2015, 1081, 201 CrossRef.
- M. Pradeep, M. Vishnuvardhan and G. Thalari, Chem. Data Collect., 2023, 46, 101020 CrossRef.
- K. Sun, Q. Y. Lv, X. L. Chen, L. B. Qu and B. Yu, Green Chem., 2021, 23, 232 RSC.
- M. Tavakolian and M. Hosseini-Sarvari, ACS Sustainable Chem. Eng., 2021, 9, 4296 CrossRef.
- J. R. Chen, X. Q. Hu, L. Q. Lu and W. J. Xiao, Acc. Chem. Res., 2016, 49, 1911 CrossRef PubMed.
- M. H. Muhammad, X. L. Chen, Y. Liu, T. Shi, Y. Peng, L. Qu and B. Yu, ACS Sustain. Chem. Eng., 2020, 8, 2682 CrossRef.
- P. Kumar, C. Joshi, A. K. Srivastava, P. Gupta, R. Boukherroub and S. L. Jain, ACS Sustain. Chem. Eng., 2016, 4, 69 CrossRef.
- X. Ma, X. Chen, L. Ying, Y. Pang, Q. Zhong, D. Li and W. Sun, Mol. Catal., 2023, 546, 113276 CrossRef CAS.
- S. Fang and Y. H. Hu, Chem. Soc. Rev., 2022, 51, 3609 RSC.
- D. Mateo, J. L. Cerrillo, S. Durini and J. Gascon, Chem. Soc. Rev., 2021, 50(3), 2173 RSC.
- S. M. Ghouse, Y. S. Kumar, J. S. Jin, J. P. Kim, J. S. Bae, E. H. Chung, D. Y. Kim, E. K. Jang, F. R. Nawaz Khan and E. D. Jeong, RSC Adv., 2014, 4, 44408 RSC.
- R. Prasath, S. Sarveswari, S. W. Ng and E. R. T. Tiekink, Acta Crystallogr., Sect. E: Struct. Rep. Online, 2013, 69, o1414–o1415 CrossRef CAS PubMed.
- M. M. M. El-Miligy, M. E. Abdelaziz, S. M. Fahmy, T. M. Ibrahim, M. M. Abu-Serie, M. A. Mahran and A. A. Hazzaa, J. Enzyme Inhib. Med. Chem., 2023, 38(1), 2152810 CrossRef PubMed.
- E. Srihari, G. S. Kumar, C. N. S. S. P. Kumar, R. K. Seth, S. Biswas, B. Sridhar and V. J. Rao, Heterocycl. Commun., 2011, 17, 111 CAS.
- S. Pal, S. Durgadas, S. B. Nallapati, K. Mukkanti, R. Kapavarapu, C. L. T. Meda, K. V. L. Meda and M. Pal, Bioorg. Med. Chem. Lett., 2011, 21, 6573 CrossRef PubMed.
- M. Gupta, Bioorg. Med. Chem. Lett., 2011, 21, 4919 CrossRef PubMed.
- R. Ramesh, S. Ramesh, J. G. Malecki and A. Lalitha, J. Iran. Chem. Soc., 2019, 16, 1197 CrossRef.
- D. Subhash and K. Bhaskar, Russ. J. Org. Chem., 2020, 56, 498 CrossRef.
- G. C. Muscia, M. Bollini, J. P. Carnevale, A. M. Bruno and S. E. Asís, Tetrahedron Lett., 2006, 47, 8811 CrossRef.
- N. D. Chavan and V. Vijayakumar, RSC Adv., 2024, 14, 21089 RSC.
- S. Khopkar, M. Jachak and G. Shankarling, Dyes Pigm., 2019, 161, 1 CrossRef.
- T. Zhang, Y. Xiao, H. Wang, S. Kong, R. Huang, V. Ka-Man Au, T. Yu and W. Huang, Angew. Chem., Int. Ed., 2023, 62, e202301896 CrossRef PubMed.
- S. Sinha and D. Seth, J. Mol. Liq., 2023, 388, 122812 CrossRef.
- M. Homocianu, Microchem. J., 2024, 198, 110166 CrossRef.
- G. C. dos Santos, A. de Andrade Bartolomeu, V. F. Ximenes and L. C. da Silva-Filho, J. Fluoresc., 2017, 27, 271 CrossRef PubMed.
- A. I. Martiryan, G. A. Shahinyan, I. L. Aleksanyan and L. P. Hambardzumyan, J. Fluoresc., 2023 DOI:10.1007/s10895-023-03519-2.
- R. Kumar, S. S. Acharya, P. Bhaumick, T. Parvin and L. H. Choudhury, Tetrahedron, 2023, 132, 133250 CrossRef CAS.
- S. Khopkar, M. Jachak and G. Shankarling, Spectrochim. Acta, Part A, 2019, 211, 114 CrossRef CAS PubMed.
- W. Li, L. Li, H. Xiao, R. Qi, Y. Huang, Z. Xie, X. Jing and H. Zhang, RSC Adv., 2013, 3, 13417 RSC.
- Advanced Organic Chemistry FIFTH EDITION Part A: Structure and Mechanisms Search PubMed.
- E. Polo, N. Ibarra-Arellano, L. Prent-Peñaloza, A. Morales-Bayuelo, J. Henao, A. Galdámez and M. Gutiérrez, Bioorg. Chem., 2019, 90, 103034 CrossRef CAS.
- O. C. Enudi, H. Louis, M. M. Edim, J. A. Agwupuye, F. O. Ekpen, E. A. Bisong and P. M. Utsu, Heliyon, 2021, 7, e07531 CrossRef CAS PubMed.
- K. E. Roys and M. S L, Opt. Mater., 2023, 145, 114391 CrossRef CAS.
Footnote |
| † Electronic supplementary information (ESI) available. See DOI: https://doi.org/10.1039/d4ra04335a |
| This journal is © The Royal Society of Chemistry 2024 |

