
 Open Access Article
 This Open Access Article is licensed under a Creative Commons Attribution-Non Commercial 3.0 Unported Licence
Ultra-fast green synthesis of a defective TiO2 photocatalyst towards hydrogen production
Naphaphan Kunthakudeea,
Tarawipa Puangpetchb,
Prakorn Ramakulb,
Karn Serivalsatitcd,
Chatchai Ponchio e and
Mali Hunsom*afg
e and
Mali Hunsom*afg
aDepartment of Chemical Engineering, Faculty of Engineering, Mahidol University, Phuttamonthon 4 Road, Nakhon Pathom, 73170, Thailand. E-mail: mali.hun@mahidol.edu
bDepartment of Chemical Engineering, Faculty of Engineering and Industrial Technology, Silpakorn University, Nakhon Pathom 73000, Thailand
cDepartment of Materials Science, Faculty of Science, Chulalongkorn University, Phayathai Road, Pathumwan, Bangkok 10330, Thailand
dPhotocatalysts for Clean Environment and Energy Research Unit, Faculty of Science, Chulalongkorn University, Bangkok, 10330, Thailand
eDepartment of Chemistry, Faculty of Science and Technology, Rajamangala University of Technology Thanyaburi, Pathumthani 12110, Thailand
fAssociate Fellow of Royal Society of Thailand (AFRST), Bangkok 10300, Thailand
gAdvanced Microfabrication and Biomaterial for Organ-on-chip Research Unit (AMBiO), Faculty of Engineering, Mahidol University, Nakhon Pathom, 73170, Thailand
First published on 2nd August 2024
Abstract
An ultra-fast green synthesis of defective titanium dioxide (TiO2) photocatalysts was conducted by the microwave-assisted method using L-ascorbic acid (L-As) as a reducing agent. Effect of L-As concentrations on the chemical-, optical- and photoelectrochemical properties as well as the photocatalytic performance towards the hydrogen (H2) production was explored. The obtained TiO2 nanoparticles (NPs) illustrated the brown fine powders with different brownness levels depending on the concentrations of L-As. A high L-As concentration provided a high brownness of TiO2 NPs with a high generation of Ti3+ defects and oxygen vacancies (Ov), which can extend the light absorption towards the visible and near-infrared regions, suppress the recombination rate of electron–hole pairs, promote the photocurrent response and minimize the interface charge transfer resistance. An appropriate quantity of generated defects and good porous properties played a crucial role in photocatalytic H2 production. Under fluorescence illumination, the sample synthesized with a TiO2 and L-As weight ratio of 1![[thin space (1/6-em)]](https://www.rsc.org/images/entities/char_2009.gif) :0.25 (PAs0.25) exhibited the highest H2 production rate (∼162 μmol g−1 h−1 in the presence of 1 wt% Au co-catalyst) with a slight drop (∼8.2%) after the 5th use (15 h). The synthesis method proposed in this work provides a new insight to an ultra-fast synthesis of defective TiO2 NPs using an eco-friendly chemical precursor under non-severe conditions.
:0.25 (PAs0.25) exhibited the highest H2 production rate (∼162 μmol g−1 h−1 in the presence of 1 wt% Au co-catalyst) with a slight drop (∼8.2%) after the 5th use (15 h). The synthesis method proposed in this work provides a new insight to an ultra-fast synthesis of defective TiO2 NPs using an eco-friendly chemical precursor under non-severe conditions.
1. Introduction
Based on the specific properties of TiO2 (e.g. high chemical/thermal stability, low cost, eco-friendly and high UV light absorption capacity),1,2 it has been extensively applied in the paint/plastic industry, cosmetic/hygiene industry, food industry, energy storage systems, gas sensing systems, medical devices, etc.3,4 Besides, it is widely used as a photocatalyst for H2 production,5,6 pollutant degradation,2,3,7,8 antibacterial,9–11 air purification,12 and medical application.11,13,14 However, the photocatalytic application of TiO2 is still limited to the UV region (<5% of full sunlight) due to its relatively wide bandgap (∼3.2 eV) and fast recombination of electron–hole pairs.15 To overcome these shortcomings, various strategies have been conducted to improve the photocatalytic performance of TiO2 NPs including the introduction of some defects (Ti3+/Ov) or metal/non-metal elements and coupling with other conductive materials or semiconductors.15,16 The deposited metals can serve as the co-catalysts to facilitate the kinetic of surface reaction by suppressing the recombination of charge carriers through the Schottky junction.17–19 However, the utilization of inappropriate contents/metal species may decrease the TiO2 crystallinity, reduce the thermal stability and sometimes act as the charge recombination center which in turn diminishes the photocatalytic performance.16,20,21 The non-metal dopants can extend the visible light response of TiO2 from 400 to 600 nm due to the generation of an intermediate energy level which can elevate the oxygen 2p state's valence band (VB).22 Nevertheless, they were unable to absorb light in the infrared region.23 The coupling of TiO2 with other conductive materials or semiconductors can reduce the recombination opportunity of charge carriers and furnish the band alignment to fit to the redox potential of adsorbed molecules.24 However, the synthesis process is quite complicated, requires several elementary steps and sometimes demands extreme synthesis conditions.Currently, the defect engineering of TiO2 conducted by the introduction of crystal and/or surface defects (e.g. Ti3+ species, Ov sites, or disordered atomic rearrangement) is considered as a reasonable strategy to improve the crystal morphology, textural property, electronic structure, charge transport property and eventually the photocatalytic activity of the pristine TiO2 NPs. That is, the surface defects play and essential role on the geometric, electronic, and chemical properties of photocatalysts, while the bulk defects play a vital role on the energy density of states, bond length, bond energy, position of Fermi level, electrical affinity as well as the shift of conduction band (CB).25–28 Therefore, many procedures have been conducted to synthesize the defective TiO2 NPs (e.g. chemical reduction/oxidation, thermal treatment, anodization, or laser/plasma irradiations) for various applications (e.g. energy storage, solar cells/fuel cells, chemical production, waste remediation and medical therapy).29
Hydrogen (H2) is now recognized as a prominent sustainable energy carrier to support the global energy consumption because of its high energy density, storability and environmental friendliness.29 Recently, it was reported that the presence of surface Ti3+ and bulk Ti3+ species at optimum content can maximize the photocatalytic H2 evolution rate.30 During the formation of Ti3+ defects, the Ov sites were concurrently created to maintain the charge balance.31 The defective TiO2 synthesized from the pristine macro/mesoporous TiO2 framework via the microwave irradiation using vitamin C as a reducing agent exhibited an increased surface area and improved visible light response due to the presence of Ti3+/Ov defects, which then promoted the H2 production (23.2 μmol g−1 h−1) and the RhB degradation (26.7 × 10⁻³ min−1), approximately 3.3- and 10.68-fold higher than the pristine TiO2 NPs.32 The rational introduction of Ti3+/Ov defects through the chemical reaction with L-ascorbic acid gave the brown TiO2 with a square/rectangular shape structure.31 A high H2 production rate of 8.1 mmol g−1 h−1 under natural solar light was achieved due to its high visible light response, resulting from the presence of Ov that allowed the electron migration from the filled Ov defects to the CB. The existence of surface defects accelerated the ethanol reforming to H2 and acetaldehyde due to a weaken chemical adsorption of intermediate species on the surface defects.33 Nevertheless, excessive surface defects induced the negative effect on the photocatalytic activity because it can migrate into bulk structure and acts as the charge recombination center,33 which diminished the photocatalytic activity for H2 production. The black TiO2 nanosheet-assembled microspheres synthesized by thermal treatment under H2 environment in the presence of protective agent (e.g. ethylenediamine, EN) exhibited high surface area (140.5 m2 g−1) and H2 production rate (6.54 mmol g−1 h−1 with 1 wt% Pt co-catalyst) under the Xenon lamp irradiation.34 This is because the added EN can reduce the aggregation of TiO2 nanosheets, mitigate the phase transformation and prevent the reaction of Ov sites with surrounding air. The defective nano-TiO2 photocatalysts synthesized by the C–H group-assisted method in aerobic-annealing atmosphere illustrated a considerable photocatalytic H2 production (5.47 mmol g−1 h−1 under visible light) causing by the oxidation of C–H groups, which can preserve the nanotube structure, delay the TiO2 crystallization, prevent the oxygen migration to the TiO2 lattice and also promote the formation of Ov sites.35 The addition of Ni on the MIL-125(Ti) derived pure TiO2 (t-TiO2) enhanced the photocatalytic activity of the resultant xNi/t-TiO2 catalysts. Approximately 4.28 mmol g−1 h−1 was produced under the full-spectrum light in the presence of 1 wt% Ni, attributing to the synergetic effect of Schottky barrier and Oν sites which can enhance the charge separation and migration.36 The nano-Cu/TiO2 synthesized by the microwave-assisted hydrothermal with oxalic acid possessed a high H2 production rate (6.8 mmol g−1 h−1) under 365 nm UV LED array due to the formation of the mid-gap energy state associated from the surface Ov defects and the effective charge separation efficiency and light absorption ability associated from the employed Cu co-catalyst.37
Although various procedures have been meticulously developed to synthesize the defective TiO2 NPs as reviewed above, they still consisted of various elementary steps, including (i) the synthesis of TiO2 based material and (ii) the introduction of defects into the TiO2 structure. In this work, the microwave-assisted method was conducted to synthesize defective TiO2 NPs because this method (i) possesses a high energy transmission efficiency, thus accelerating the reaction rate and shortening the synthesis time and (ii) distributes the homogeneous heating power, thus providing the sample with better crystallinity.38–41 The L-As was used as a reducing agent due to its green chemical. This proposed procedure is clean and consumes a short time to synthesize the defective TiO2 NPs in non-severe condition. The preliminary results demonstrated that both optical and photoelectrochemical properties as well as the number of created defects in the resultant photocatalysts could be controlled by the added quantity of reducing agent. Good porous property and appropriate content of defects promoted the on par photocatalytic H2 production under fluorescence irradiation.
2. Experimental
2.1 Synthesis and characterization
A set of defective TiO2 photocatalysts was facile synthesized from the commercial TiO2 powders via the microwave-assisted method using L-As as a reducing agent. In a typical process, 1 g of TiO2 (≥99.5% TiO2 (P25); Sigma-Aldrich) was dispersed in 30 mL of ethylene glycol (99.9% C2H6O2; KemAus) under the constant stirring rate at 400 rpm at 25 °C for 5 min. Meanwhile, 0.1 g L-As (99% C6H8O6; KemAus) was dissolved in 20 mL of deionized (DI) water. Then, both solutions were mixed together under the gentle stirring for 10 min. The mixture was then transferred to a 100 mL Teflon-sealed vessel and continuously sonicated for 60 min. Then, the vessel was placed in the microwave reactor (Multiwave PRO, Anton Paar, Austria) and treated at the power output of 600 W for 15 min using the ramp rate of 300 W min−1. After the reaction time was proceeded, the solid portion was separated from the solution by centrifugation at 8000 rpm (5804R, 136 Eppendorf) for 10 min and washed for 4 times by distilled water. The ready-to-use defective TiO2 sample, denoted as PAs0.10 was obtained after drying overnight at 80 °C. A similar procedure was repeated with increasing amounts of L-As to 0.25 g, 0.50 g, and 0.75 g, respectively denoted as PAs0.25, PAs0.50, and PAs0.75.The morphology of all synthesized defective TiO2 samples together with the parental TiO2 NPs (P25) was analyzed as follows. The microstructure was monitored by a field emission scanning electron microscopy (FE-SEM, JSM7610FPlus, JEOL) and a high-resolution transmission electron microscopy (TEM, JEM-3100F, JEOL) with an applied voltage of 300 kV. The crystal structure and lattice disorder were observed by an X-ray diffraction (XRD) equipped with a Bruker D2 Phaser diffractometer using Cu Kα X-ray and the Raman spectroscopy (XploRA PLUS, Horriba) with the laser excitation wavelength of 532 nm. The carbon content in all samples was quantified from the results of thermogravimetric (TGA) analysis (TA Instruments, TGA55). The surface area and porous property were taken at 77 K via the N2 adsorption/desorption isotherms by a Multipoint Surface Area Analyzer (Tristar II3020, Micromeritics) using the Brunauer–Emmett–Teller (BET) method. The micropore volume was estimated from the t-plot method, while the mesopore and macropore volumes were determined from the BJH desorption method. The qualitative recombination rate of charge carriers was determined by the photoluminescence (PL) emission detected by a luminescence spectrometer (PerkinElmer LS-55) using the excitation wavelength of 310 nm. The unpaired electrons and defects were qualitatively examined by an electron paramagnetic resonance spectroscopy (EPR, model, EMXmicro, Bruker) at 298 K. The light absorption capacity was examined over the wavelength of 200–800 nm using a UV-vis spectrometer (UV-2600, Shimadzu). Lastly, the chemical composition and valence state were detected by an X-ray photoelectron spectroscopy (XPS, Kratos Axis Supra+) with a monochromatic Al Kα (hv = 1486.6 eV) and the C 1s peak at 285.0 eV was used as a reference.
2.2 Photoelectrochemical property
The photoelectrochemical property of respective TiO2 samples including the photocurrent response and the charge transfer resistance was examined by a three-electrode system in 0.1 M NaCl using Pt wire and Ag/AgCl as counter and reference electrodes, respectively. In each experiment, a certain quantity of TiO2 NPs was dispersed in 0.50 mL of DI water and sonicated at room temperature for 30 min (GT Sonic-D3). Then, 0.50 mL of isopropanol (i-C3H8O, QRec) was added and continuously sonicated for 30 min. Then, 0.22 mL of Nafion solution (Aldrich) was added and again sonicated for 30 min. Then, the photocatalyst ink was coated on the surface of fluorine-doped tin oxide (FTO) conducting glass via the painting method to get an effective area of 4 cm2. The photocatalyst-coated FTO was dried at 60 °C for 60 min to eliminate the free moisture and solvent. Then, it was incorporated into a three-electrode system as working electrode and connected with the voltammetry analyzer (Princeton Applied Research, Versa STAT3) equipped with the LED lamp (113.6 mW cm−2) as the excitation light source. The charge transfer resistance was measured by the electrochemical impedance spectroscopy (EIS) using the AC amplitude of 10 mV during a wide frequency in the range of 100 mHz to 100 kHz.2.3 Photocatalytic activity
The photocatalytic activity of all synthesized defective TiO2 samples was examined for the H2 production via the water splitting process at ambient temperature and pressure. In each experiment, approximately 0.4 g of respective defective TiO2 samples decorated by 1 wt% Au was dispersed in 200 mL of distilled water with 20 vol% methanol (CH3OH, QReC). The obtained mixture was then transferred into a well-sealed Pyrex cylindrical reactor and gently stirred in the absence of irradiated light under the continuous supply of argon gas (99.999% Ar, SI Tech) at constant flow rate of 100 mL min−1 for 30 min to eliminate dissolved oxygen in the solution. Subsequently, the mixture was irradiated by a set of fluorescence lamps (Philips PL-s 11W/865/2p) at the light intensity of 90 mW cm−2 at 545 nm under Ar flow rate of 30 mL min−1. The generated H2 was collected at particular times and analyzed the concentration by the gas chromatography (GC-14B, Shimadzu) equipped with the thermal conductivity detector (TCD) and a Porapak Q column. The GC was operated at injector/detector temperatures of 150 °C, column temperature of 42 °C using Ar as the carrier gas. For the whole experiment, the temperature of the photoreactor was precisely controlled at 18 °C using an internal water-cooling system (Rotary compressor, Carrier). The apparent quantum efficiency (AQE) of all explored samples for the photocatalytic H2 production was calculated by eqn (1).42–45
 | (1) |
3. Results and discussion
3.1 Morphology of brown TiO2 NPs
The digital pictures of all TiO2 samples were illustrated in Fig. 1 (upper row). It is noteworthy that the microwave treatment with L-As induced the color change of the pristine P25 from the white to the brown color, indicating the formation of disordered structures or defects in TiO2 NPs.31,46 The degree of brownness increased as the increase of L-As concentration, roughly indicating a linear increase of defects. Regarding the morphology, the original P25 sample illustrated the sphere-like structure with the agglomeration status (Fig. 1 (lower row)). No noticeable change of size and shape of PAsx samples was observed after the microwave treatment. By the HR-TEM analysis, the pristine P25 exhibited the sharp and clear lattice fringes (Fig. 2(a)). However, the PAsx samples represented a blurring lattice at the outer layer of TiO2 NPs (black arrow in Fig. 2(b) and (c)), indicating the presence of surface defects.47 | ||
| Fig. 1 Color (upper row) and FE-SEM images (lower row) at magnification 100000× of pristine P25 and synthesized PAsx photocatalysts. | ||
 | ||
| Fig. 2 HR-TEM images of (a) P25 and defective TiO2 samples; (b) PAs0.25 and (c) PAs0.75 synthesized by microwave-assisted method. | ||
The crystallite structures of all samples were examined by the XRD analysis. As displayed in Fig. 3, the P25 samples exhibited the characteristic diffraction peaks of both anatase and rutile phases. That is, it displayed the diffraction peaks of anatase phase at 2θ of 25.3°, 37.8°, and 48.0°, corresponding to the crystal planes of (101), (004) and (200), respectively (PDF 01-070-7348) and displayed the diffraction peaks of rutile phase at 2θ crystallite sizes of all TiO2 samples were respectively computed by Spurr and Myers equation48 and Debye–Scherrer equation.49 As tabulated in Table 1, the anatase fraction and crystallite size of all PAsx samples were around 0.84–0.85 and 22.09–22.68 nm, closing to those of the pristine P25 sample. This indicates that the microwave-assisted method using L-As as a reducing agent negligibly altered the phase and crystallite size of TiO2 NPs.
 | ||
| Fig. 3 Representative XRD spectra of P25 and PAsx photocatalysts. | ||
| Samples | P25: L-As (weight ratio) | Anatase fractiona | Crystallite size of TiO2b (nm) | BET area (m2 g−1) | Vmicroc (cm3 g−1) | Vmeso + Vmacrod (cm3 g−1) | Vtotal (cm3 g−1) | Average pore size (nm) | Bandgap energy (eV) |
|---|---|---|---|---|---|---|---|---|---|
| a Estimated from XRD analysis using Spurr and Myers equation.b Estimated from XRD analysis using Debye–Scherrer equation.c Estimated from t-plot method.d Estimated from BJH desorption method. | |||||||||
| P25 | 0.85 | 21.27 | 54 | 0.0001 | 0.1525 | 0.1526 | 12.45 | 3.22 | |
| PAs0.10 | 1:0.10 |
0.84 | 22.09 | 53 | 0.0000 | 0.3791 | 0.3791 | 27.18 | 2.98 |
| PAs0.25 | 1:0.25 |
0.84 | 22.68 | 55 | 0.0000 | 0.3915 | 0.3915 | 28.33 | 2.96 |
| PAs0.50 | 1:0.50 |
0.85 | 22.09 | 53 | 0.0000 | 0.3558 | 0.3558 | 26.40 | 2.94 |
| PAs0.75 | 1:0.75 |
0.84 | 22.09 | 54 | 0.0000 | 0.3601 | 0.3601 | 26.61 | 2.90 |
To elucidate the lattice disorder, the Raman study was conducted. As shown in Fig. 4(a), the P25 sample demonstrated the Raman-active modes of Eg (141.3, 192.1, 636.3 cm−1), B1g (392.4 cm−1) and A1g (512.2 cm−1), indexing the presence of tetragonal anatase as the principal species.33 All PAsx samples also illustrated these five Raman peaks (3 Eg, 1B1g and 1A1g) of anatase dominate phase with a slight blueshift (inset of Fig. 4(a)). This phenomenon highlighted the presence of asymmetric O–Ti–O bonds in the TiO2 structure, owing to the formation of surface Ov sites.31,33,50 The degree of Raman shift increased as the increase of L-As concentrations, suggesting the increase in surface Ov sites. As reported by literature, the microwave-assisted method can convert L-As into carbonaceous substances such as carbon nanodot51,52 or carbon microsphere.38 In this work, a trace of generated carbonaceous substances was obviously detected in Raman spectra of all PAsx samples. As shown in Fig. 4(b), the Raman spectra was significantly pronounced during 1400–1690 cm−1 and 1700–2740 cm−1, accompanied by the presence of low sp3 amorphous carbon.53 The Raman intensity increased as the increase of L-As concentrations, indexing the increased amount of generated carbonaceous materials. By thermogravimetric (TGA) analysis, weight contents of carbonaceous materials were found to be 1.29, 1.57, 1.84 and 2.01 wt% for PAs0.10, PAs0.25, PAs0.50 and PAs0.75, respectively.
 | ||
| Fig. 4 Representative Raman spectra at (a) low and (b) high Raman shifts of pristine P25 and synthesized PAsx photocatalysts. | ||
To examine the surface area and porous property of all samples, the N2 adsorption/desorption analysis was conducted. As illustrated in Fig. 5(a), all samples possessed the type IV isotherm with H2-type hysteresis loop based on the IUPAC classification, signifying the presence of mesopores in their structures.54 High adsorption/desorption volumes were evidenced at high relative pressures (P/P0) for all samples, indicating the presence of large mesopores,32 obviously evidenced by the inset of Fig. 5(a). Besides, the isotherms of all PAsx samples shifted upward compared with that of P25, indicating their better BET surface area, pore size and pore volume. As summarized in Table 1, all explored samples possessed a non-microporous structure. All PAsx samples exhibited the comparable BET surface area compared with the P25 sample, while they possessed the noticeably large pore sizes and high pore volumes. That is, increasing the L-As quantity from 0.1 g to 0.25 g increased both pore sizes and pore volumes. However, further rising the L-As quantity from 0.25 g to 0.75 g abated both properties. This can be speculated that an excessive L-As contents may induce the pore thinning and then pore collapse, leading to the decrease of pore sizes and pore volumes but still maintaining the overall BET surface area.
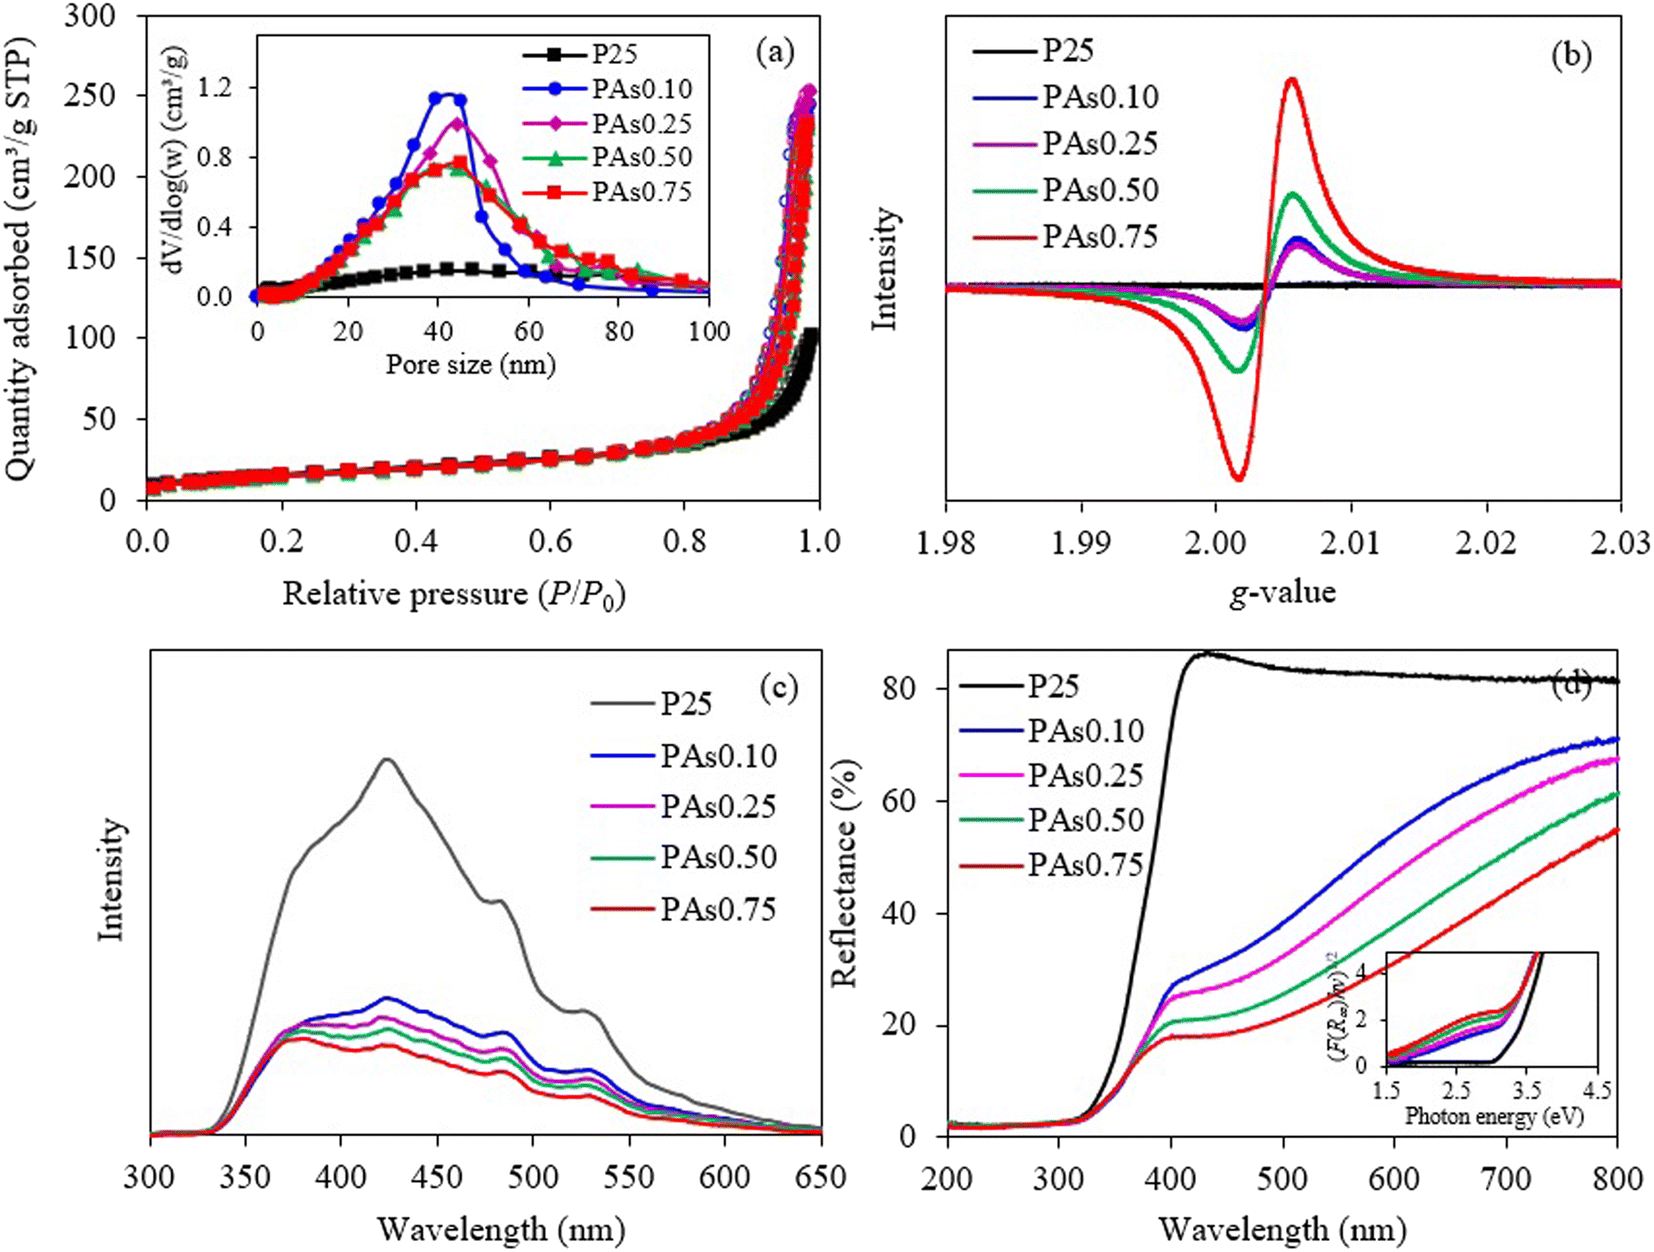 | ||
| Fig. 5 Representative (a) N2 adsorption/desorption isotherms, (b) EPR spectra, (c) PL spectra and (d) UV-vis diffused reflectance spectra of pristine P25 and synthesized PAsx photocatalysts. | ||
To verify the presence of unpaired electrons, the EPR study was conducted. As illustrated in Fig. 5(b), no virtual EPR signal was observed for the P25 sample, suggesting the absence of unpaired electrons or bulk defects.31 The obvious EPR signals were emerged for all synthesized PAsx samples with the g-value of ∼2.004, indicating the presence of bulk Ov sites in their structures.50,55 The EPR signal substantially increased as the increase of L-As concentrations. This suggested that the quantity of generated Ov sites can be virtually controlled by the quantity of L-As. Interestingly, no EPR signals were observed at the g-value of ∼1.94–1.96, indicating the absence of Ti3+ defects.33,50 However, as mentioned above, the rhombic Ti3+ defects are naturally generated with the coincidence of generated Ov sites to maintain the charge balance.31
To explore the behavior of electron–hole recombination, the PL analysis was conducted at 25 °C with the excitation wavelength of 310 nm. As depicted in Fig. 5(c), the P25 sample exhibited the strongest PL emission spectra, indicating its highest recombination rate of charge carriers.56 All PAsx samples illustrated a low pronounce of PL spectra compared with that of P25 sample, indicating their low recombination rate of charge carriers. For all synthesized PAsx samples, the intensity of PL emission decreased as the increase of L-As concentrations, mirroring the increased trend of the charge separation efficiency. The PAs0.75 sample illustrated the lowest intensity of PL emission might be due to the presence of highest content of generated defects observed from EPR analysis, which can serve as the charge trapping sites and eventually hinder the recombination of charge carriers.57,58
Fig. 5(d) illustrated the diffuse reflectance UV-vis-NIR spectra of all samples during the wavelength of 200–800 nm. The P25 sample illustrated a strong decrease in reflectance at 400 nm, indicating its strong UV light absorption and visible light inertness. However, all PAsx samples displayed a low pronounce of reflectance spectra during 400–800 nm, indicating their ability to absorb visible light. The extend of visible light response at wavelength longer than 400 nm could be attributed to the presence of defects which can initiate the mid-gap state energy level for electron transfer from VB to this mid-gap state level and then to the CB59 and/or the generation of band tail which can shift the position of VB and/or CB bands and eventually shortening the bandgap values.60 Thus, the light with low photon energy (or the light with long wavelength) is able to drive the migration of generated electrons from VB to CB. The corresponding bandgap values of all explored samples were then calculated according to the Kubelka–Munk relation (eqn (2)).61 As summarized in Table 1, all synthesized samples illustrated the narrow bandgap values compared with those of pristine P25 sample (3.22 eV). The bandgap values of all synthesized samples decreased as the increase of L-As concentrations, probably attributing to increase of defect concentrations.
 | (2) |
To examine the chemical composition and valence state in all explored samples, the XPS analysis was conducted. Via the XPS survey spectra, three elements including Ti 2p, O 1s and C 1s were detected for all samples (Fig. 6(a)). The Ti 2p and O 1s elements were the main compositions of all PAsx samples, while C 1s elements in P25 and synthesized PAsx samples were contributed to the adventitious carbon62 and adventitious carbon/formed carbonaceous substances, respectively. High-resolution Ti 2p XPS spectra of the P25 sample showed two symmetric peaks at 464.6 and 458.8 eV (Fig. 6(b)), assigning to the Ti 2p1/2 and Ti 2p3/2 of Ti4+ species, respectively.63 However, the synthesized PAsx samples showed two asymmetric Ti 2p peaks with tails towards the low binding energy, indexing the presence of low valence state of Ti 2p species.64 After deconvolution, the main peaks located at ∼464.6 and ∼458.8 eV were belonged to the Ti 2p1/2 and Ti 2p3/2 peaks of Ti4+ species, whilst small peaks located at ∼463.7 and ∼457.4 eV were corresponded to the Ti 2p1/2 and Ti 2p3/2 peaks of Ti3+ species.65 These Ti3+ species were created by the reduction of Ti4+ species under the microwave irradiation in the presence of L-As.32 Regarding the O species, high-resolution O 1s XPS spectra of all samples revealed two dominated peaks centered at ∼531.7 and ∼530.1 eV (Fig. 6(c)), relating to the OH− ions and lattice oxygens (O2−) in the crystallite framework,66,67 thus indicating its high crystallinity.68 However, two additional O 1s XPS peak were observed for all PAsx samples at ∼527 eV (orange line) and ∼528 eV (gray line), contributing to the double charge effect.69 The virtual presence of surface Ov is difficult to identify from the O 1s spectra (Fig. 6(c)), due to the overlapping of the XPS spectra of OH− ions and surface Ov sites.31 Nevertheless, the presence of Ov sites were clearly detected by EPR analysis. For the C species, high-resolution C 1s spectra of the P25 sample associated from adventitious carbon depicted four principal peaks at 288.9, 286.0, 285.0 and 282.9 eV (Fig. 6(d)), belonging to the C![[double bond, length as m-dash]](https://www.rsc.org/images/entities/char_e001.gif) O bonds, O–C–O bonds, C–C bonds and CC bonds, respectively.70 For the PAsx samples, apart from these four XPS peaks, an additional peak was emerged centered at ∼281.4 eV, corresponding to the Ti–C bonds,71 confirming the presence of carbonaceous substances in PAsx samples. The portion of XPS spectra related to CC and Ti–C bonds increased as the increased of L-As concentrations, underlining an increased content of carbonaceous substances, reasonably consistent with the Raman and TGA analysis. Although decreased intensities of CO were observed for the PAsx samples, they were not related to L-As concentrations because they depended on the quantity of adsorbed adventitious carbon. The fitting parameters of XPS data including the peak position and full width at half maximum (FWHM) of each element are summarized in Table 2.
O bonds, O–C–O bonds, C–C bonds and CC bonds, respectively.70 For the PAsx samples, apart from these four XPS peaks, an additional peak was emerged centered at ∼281.4 eV, corresponding to the Ti–C bonds,71 confirming the presence of carbonaceous substances in PAsx samples. The portion of XPS spectra related to CC and Ti–C bonds increased as the increased of L-As concentrations, underlining an increased content of carbonaceous substances, reasonably consistent with the Raman and TGA analysis. Although decreased intensities of CO were observed for the PAsx samples, they were not related to L-As concentrations because they depended on the quantity of adsorbed adventitious carbon. The fitting parameters of XPS data including the peak position and full width at half maximum (FWHM) of each element are summarized in Table 2.
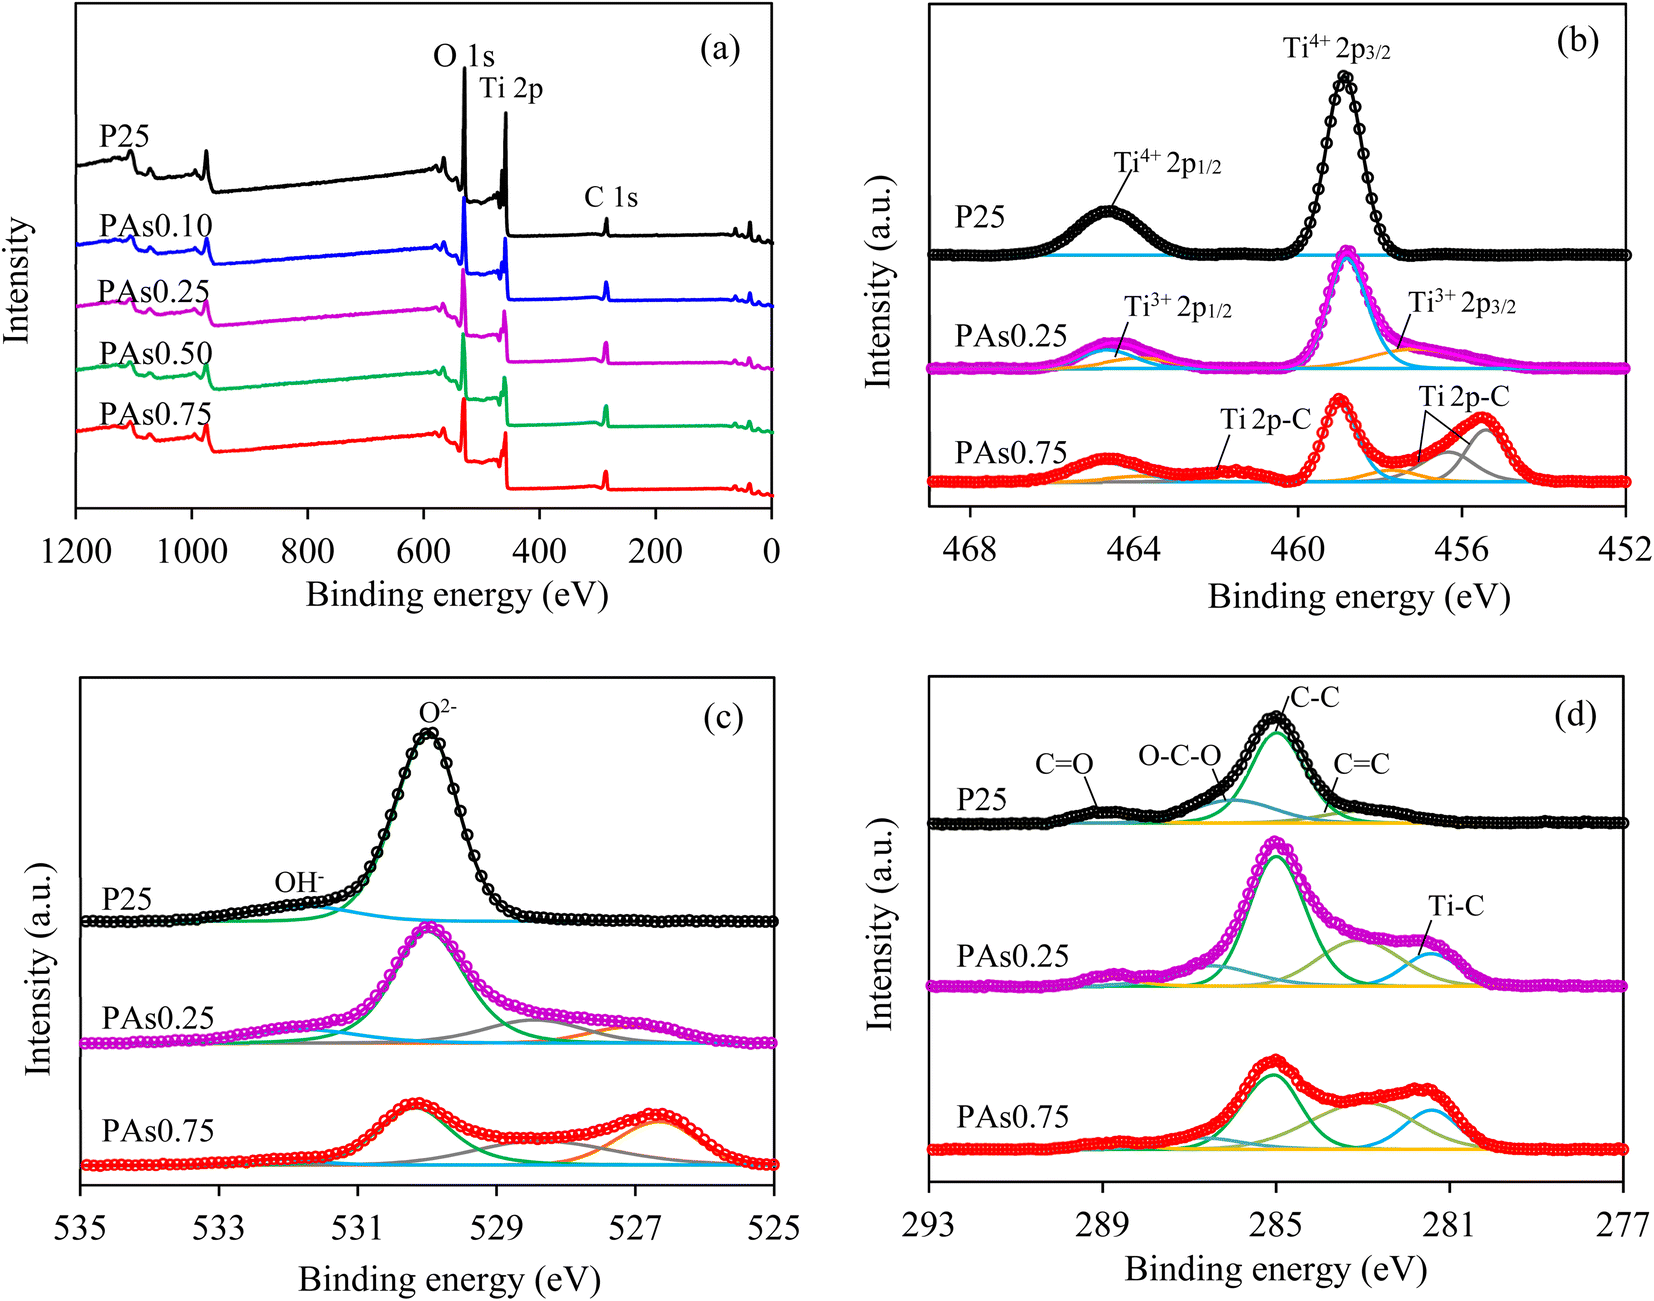 | ||
| Fig. 6 Representative (a) XPS survey scan and HR-XPS spectra of (b) Ti 2p, (c) O 1s and (d) C 1s of pristine P25 and synthesized PAsx photocatalysts. | ||
| States | XPS peak position (FWHM) | ||
|---|---|---|---|
| P25 | PAs0.25 | PAs0.75 | |
| Ti 2p-C | — | — | 455.42 (1.15515) |
| 456.34 (1.30160) | |||
| 461.6 (1.67403) | |||
| Ti3+ 2p3/2 | — | 457.46 (2.82959) | 457.73 (1.46951) |
| Ti4+ 2p3/2 | 458.89 (1.06357) | 458.82 (1.09567) | 459.01 (0.94919) |
| Ti3+ 2p1/2 | — | 463.87 (1.46912) | 463.76 (1.37962) |
| Ti4+ 2p1/2 | 464.62 (1.81105) | 464.67 (1.58326) | 464.74 (1.79558) |
| Double charge effect (orange line) | — | 527.09 (1.58396) | 526.65 (1.47817) |
| Double charge effect (gray line) | — | 528.45 (1.83283) | 528.39 (2.24335) |
| Ti–O | 529.98 (1.10494) | 530.00 (1.26645) | 530.17 (1.35471) |
| Ti–OH | 531.78 (1.60944) | 531.82 (2.07110) | 532.10 (2.44560) |
| Ti–C | — | 281.44 (1.36637) | 281.41 (1.44900) |
| CC |
282.98 (1.90696) | 283.11 (2.86555) | 282.94 (2.80595) |
| C–C | 285.00 (1.47382) | 285.00 (1.52141) | 285.09 (1.54858) |
| O–C–O | 286.00 (1.79120) | 286.54 (2.66324) | 286.70 (1.87323) |
| CO |
288.93 (1.61701) | 288.86 (1.10000) | 288.91 (1.39404) |
To understand the bandgap shortening phenomena, the density of states (DOS) was then computed from the obtained bandgap values and the valence band XPS spectra.60,72,73 From Fig. 7(a)–(e), the tops of VB can be estimated by a linear extrapolation to the x-axis60 (black dashed line), which were 2.80, 2.40, 2.10, 1.00 and 0.90 eV for P25, PAs0.10, PAs0.25, PAs0.5 and PAs0.75, respectively. Besides, the band tails were observed for all PAsx samples (pink dashed line). Based on the obtained bandgap values of all samples (Table 1), the bottoms of CB were then computed which were equal to −0.42, −0.58, −0.86, −1.94 and −2.00 eV for P25, PAs0.10, PAs0.25, PAs0.5 and PAs0.75, respectively. As illustrated in Fig. 7(f), the bandgap shortening was induced by the upshift of VB maximum and the presence of VB tail. As mentioned elsewhere, the presence of Ti3+ may induce the shift of CB edge.74 However, the different effects of Ti3+ on the band position of defective TiO2 NPs were observed. For instance, the Ti3+ defects induced the upshift of VB edge and the arising of CB tail75,76 or formed the inter-stage energy levels.77,78 In addition, it has been reported that the generated Ti3+ defects did not alter the band position of defective TiO2, but acted as the charge trapping center.31 A distinct effect of defects (Ti3+/Ov) on the band position of this work compared with literature might be attributed to the utilization of different synthesis method as well as the quantity of generated defect.
 | ||
| Fig. 7 Representative (a)–(e) XPS valence band spectra of pristine P25 and synthesized PAsx photocatalysts and (f) schematic diagram of their DOS. | ||
3.2 Photoelectrochemical measurement
To indirectly inspect the separation efficiency of electron–hole pairs and interfacial charge migration rate, the transient photocurrent response and EIS experiment were conducted. As depicted in Fig. 8(a), the P25 sample illustrated an extremely low photocurrent current density, probably due to its low visible light response79 and low charge separation efficiency. As expected, a high pronounce of current response was observed for all PAsx samples, indicating a high generation of active charges and an improved separation efficiency of charge carriers.80,81 The photocurrent response tended to increase as the increase of L-As concentrations, indicating a direct trend of charge separation efficiency. This is because the generated defects can act as the charge tripping sites and then accelerate the separation of electron–hole pairs.32,65 For the EIS measurement, the P25 sample illustrated a larger size of high-frequency semicircle of Nyquist plot than those of PAsx samples (Fig. 8(b)), indicating its higher charge transfer resistance and lower interface migration of charge carriers.65 For all PAsx samples, the sizes of EIS semicircles trended to decrease as the increase of L-As concentrations, indexing a decreased trend of charge transfer resistance. This might be attributed to the presence of a trace of carbonaceous substances that can promote the electron transfer along their surface. Based on obtained results of the photoelectrochemical measurement, it can be noted that the quantity of generated defects and carbonaceous substances on the PAsx samples, which importantly affected the charge separation efficiency and charge migration, can be controlled by the added quantity of L-As. | ||
| Fig. 8 Representative (a) photocurrent response and (b) Nyquist plot of pristine P25 and synthesized PAsx photocatalysts. | ||
3.3 Photocatalytic activity
The photocatalytic performances of all explored samples were evaluated via the photocatalytic H2 production under the fluorescence irradiation. The quantity of H2 production increased as the increase of reaction time (Fig. 9(a)). As the blank experiment, two tests were conducted for comparison including (i) the test without the photocatalyst (photolysis) and (ii) the test with the photocatalyst without methanol. It was found that no H2 was produced from both tests (Fig. 9(b)). This confirmed that the generated H2 in our system was originated from the photocatalytic reaction. Among all explored samples, the highest H2 production rate of 162 ± 6.6 μmol g−1 h−1 was achieved via the PAs0.25 sample, which was about 1.15 times higher than P25 sample (Fig. 9(c)). The values of AQE at 545 nm calculated from eqn (1) can be ranked as the order of PAs0.25 > PAs0.10 > P25 > PAs0.50 > PAs0.75 (Fig. 9(d)). This suggested that the PAs0.25 sample exhibited the highest utilization of the photo-induced charge carriers in the system,23 thus providing the highest photocatalytic performance. Considering the properties of all explored samples, it can be diagnosed that the anatase fraction, crystallite size and BET surface area affected insignificantly the photocatalytic performance for H2 production. Although the PAs0.50 and PAs0.75 samples exhibited a high charge separation efficiency, a high light absorption capacity and a low charge transfer resistance, they possessed a low quantity of H2 production compared with that of the PAs0.25 sample. A high photocatalytic H2 production of the PAs0.25 sample could be caused by several factors. That is, a high number of large pore size and high pore volume may induce a sufficient wettability of mesoporous photocatalysts,82 which in turn promote the H+ adsorption and the photocatalytic reaction. Another possible reason is probably due to the presence of appropriate defect quantity in the PAs0.25 sample which can improve the light harvesting, slow down the recombination rate of charge carriers, improve the charge separation efficiency and also charges mobility. A small number of defects results in a high recombination of charge carriers, while overabundant defects can act as the deep traps to arrest charge carriers and eventually lessen the photocatalytic performance.25,83–85 Thus, it can be said that an appropriate defect content in defective TiO2 NPs affected positively their photocatalytic performance, while too low or too high quantities contributed the negative effect. Interestingly, although the pristine TiO2 had low porous property and no structural defects, it provided the H2 production rate similar to that of the PAs0.10 sample. This might be attributed to its lighter color than the PAs0.1 sample, thus allowing a higher light penetration to undergo the reaction which was sufficient for overriding the effect of defects in the PAs0.1 sample. | ||
| Fig. 9 (a) H2 production, (b) blank experiments (c) H2 production rate under fluorescence irradiation and (d) AQE at wavelength of 545 nm of pristine P25 and synthesized PAsx photocatalysts. | ||
The stability of PAs0.25 sample was finally tested by the repetitive H2 production. As depicted in Fig. 10(a), the decline of H2 production rate of less than 8.2% was observed after the 5th use (15 h), indexing a high stability of PAs0.25 sample under the operating condition. A decline photocatalytic activity for H2 production was probably attributed to a decrease of defect quantity after the repetitive utilizations (Fig. 10(b)).
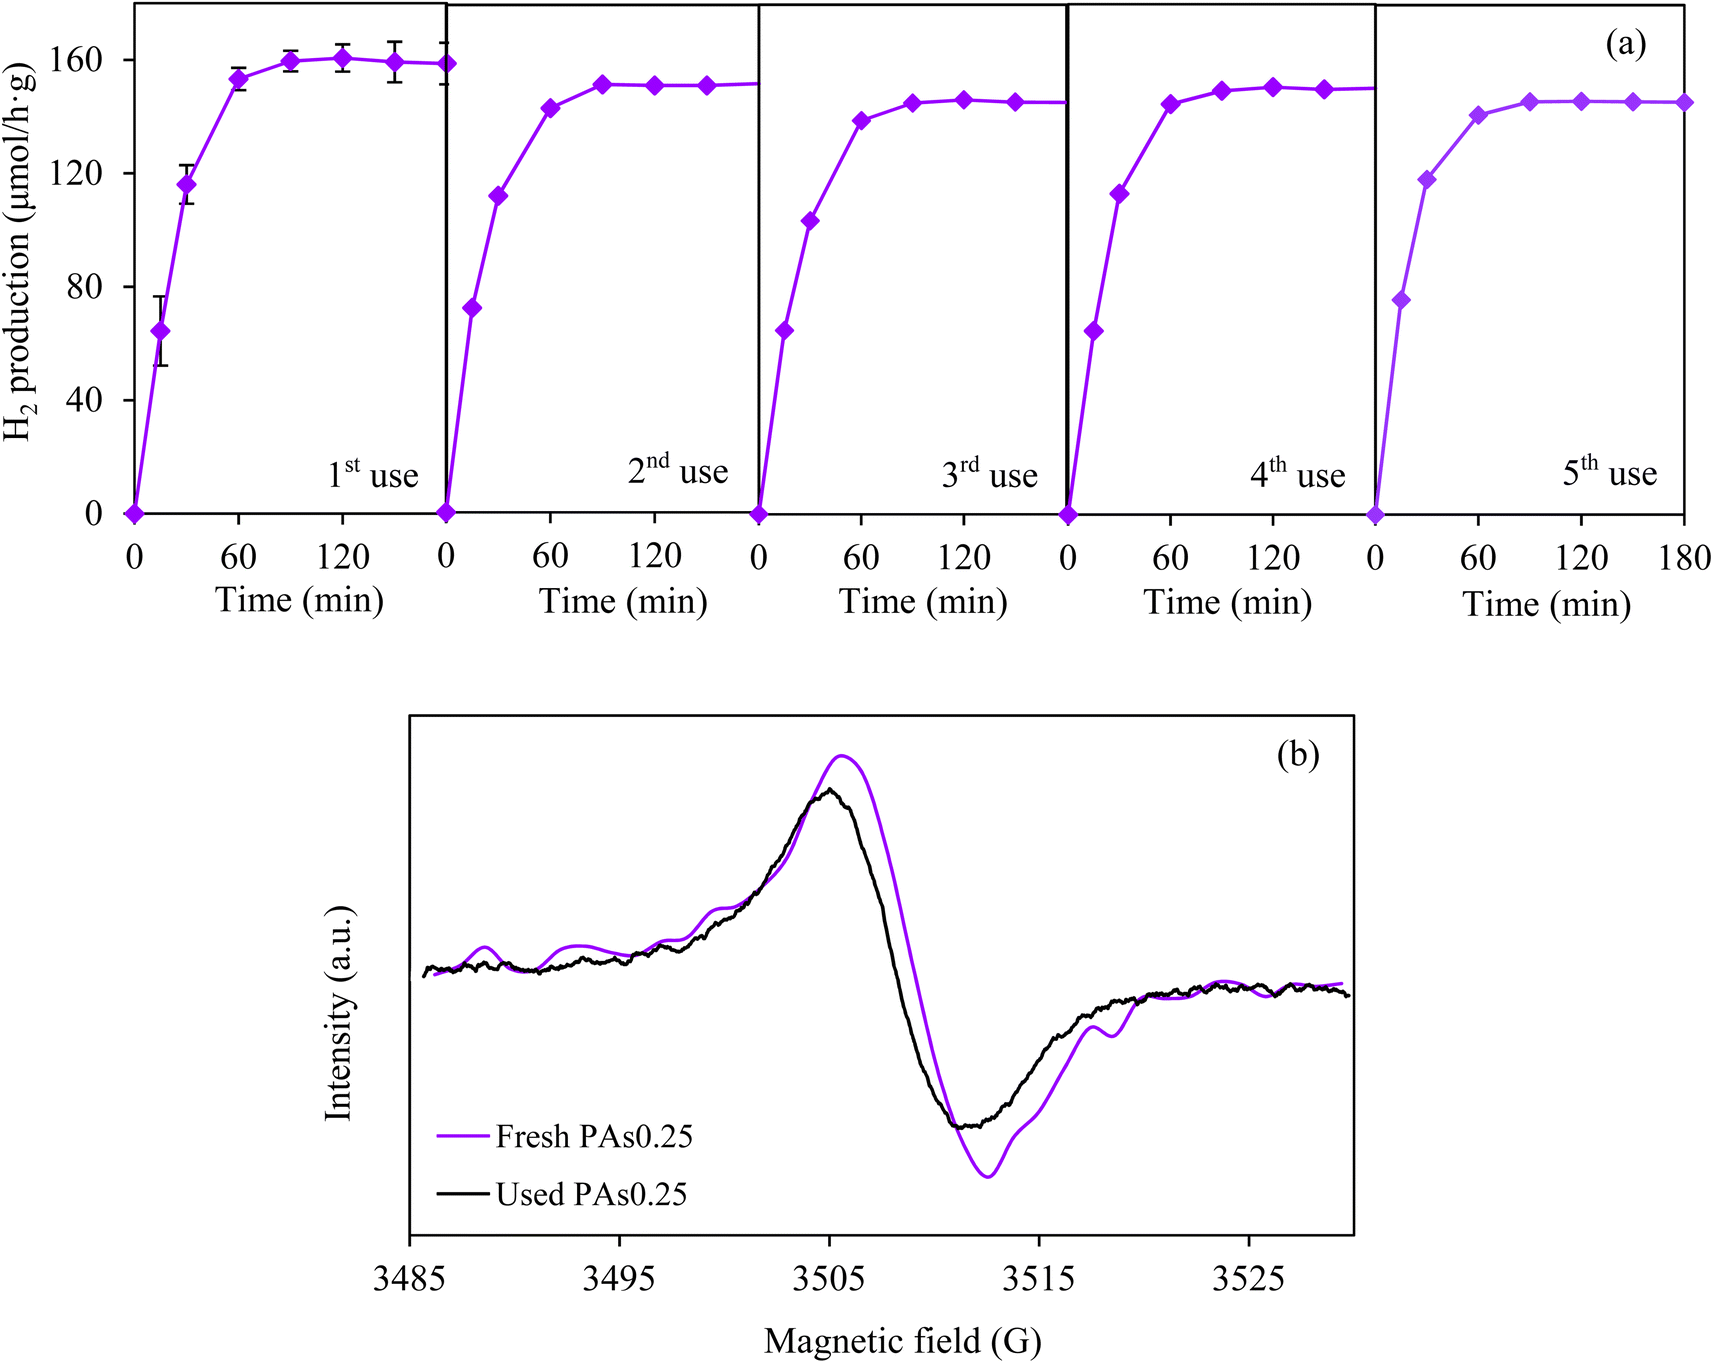 | ||
| Fig. 10 Repetitive (a) photocatalytic H2 production under fluorescence irradiation by of synthesized PAs0.25 photocatalyst and (b) EPR spectra of fresh and 5th used PAs0.25 samples with 1 wt% Au co-catalysts. | ||
The photocatalytic activity of the PAs0.25 sample for the H2 production was lastly compared with other selected works. As summarized in Table 3, a wide range of H2 production rate was observed for several defective TiO2 NPs, probably attributed to the utilization of different synthesis methods and H2 production conditions. Also, based on the published review article, a wide range of H2 production via defective TiO2 NPs was observed (0.58–56700 μmol g−1 h−1).29 This indicates that the quantity of H2 production from this work was on par with those reported by literature. To increase the H2 production rate of defective TiO2 NPs synthesized by the microwave-assisted method, other parameters have to be explored and optimized such as the use of protecting agent (e.g. ethylenediamine) to increase the surface area and active site of resultant samples.
| Photocatalyst | Synthesis method | Operating condition | H2 production | |||
|---|---|---|---|---|---|---|
| Light source | Matrix/Hole scavenger | Catalyst dosage (g L−1) | Co-catalyst | |||
| Meso-TiO2 (ref. 86) | Hydrogenation | Sunlight simulator with AM 1.5G filter | 33 vol% CH3OH | 1.7 g L−1 | 1 wt% Pt | 188 μmol h−1 |
| TiO2−x (ref. 87) | Chemical reduction | Mid-pressure Hg lamp (>420 nm) | 10 vol% CH3OH | 0.01 g L−1 | 0.03 wt% Rh | 0.58 μmol g−1 h−1 |
| Defective P25 (ref. 88) | Photoactivation | Xenon lamp (300 W, 125 mW cm−2) | 20 vol% CH3OH | 0.4 g L−1 | 1 wt% Pt | 1900 μmol g−1 h−1 |
| T3 (ref. 35) | Organic group-assisted method | Xenon lamp (300 W with 400 nm cut-off filter) | 10 vol% C6H15NO3 | 0.5 g L−1 | 1 wt% Pt | 5470 μmol g−1 h−1 |
| B–TiO2 (ref. 89) | Sol–gel hydrothermal method | Xenon lamp with AM 1.5G filter | 10 vol% CH3OH | 0.5 g L−1 | 0.5 wt% Rh | 17500 μmol g−1 h−1 |
| TiO2−x(R) (ref. 90) | Hydrogen-spillover-assisted formation | Xenon lamp (500 W, 320 mW cm−2, λ > 420 nm) | 50 vol% CH3OH | 2.0 g L−1 | 1 wt% Pt | ∼110 μmol g−1 at 24 h |
| PAs0.25 (this work) | Microwave-assisted method | Fluorescence lamp (545 nm, 90 mW cm−2) | 20 vol% CH3OH | 2.0 g L−1 | 1 wt% Au | ∼162 μmol g−1 h−1 |
4. Conclusion
A set of defective TiO2 photocatalysts was one-pot synthesized from the commercial P25 NPs by the microwave-assisted method using L-As as a reducing agent. The obtained samples illustrated the brown fine powders. Different concentrations of L-As insignificantly affected the crystallite size, crystallite phase, and BET surface area, but remarkably affected the degree of brownness, porous property and the quantity of generated Ti3+/Ov defects. The higher the L-As concentrations, the higher the generated defects, which can (i) extend a strong light absorption during the visible and NIR regions, (ii) slow down the recombination rate of electron–hole pairs, (iii) accelerate the photocurrent response and (iv) subside the interface charge transfer resistance. In summary, the presence of appropriate defect contents and good porous property plays the role on the photocatalytic H2 production via the synthesized defective TiO2 photocatalysts. The synthesis method proposed in this work provides a new insight to an ultra-fast green synthesis of defective TiO2 NPs using the environmentally friendly chemical precursor under a non-extreme condition, which may applicable for the large-scale production.Data availability
All data generated or analyzed during this study are included in this published article.Conflicts of interest
The authors declare no conflicts of interest for this submission.Acknowledgements
The author would like to thank the Mahidol University for postdoctoral fellowship program (Grant No. MU-PD_2023_10) for the research budget and the Department of Chemical Engineering, Faculty of Engineering, Mahidol University for facilities and equipment support. The author also thanks the Mahidol University Frontier Research Facility (MU-FRF) for instrument support and the MU-FRF scientists, Mr Nawapol Udpuay, Dr Suwilai Chaveanghong and Mr Chawalit Takoon, for their kind assistance in instrument operation and technical supports for XRD, Raman microscope and FE-SEM.References
- M. Ahmadlouydarab, S. Javadi and F. A. A. Darab, Adv. J. Chem., Sect. A, 2023, 6, 352–365 CAS.
- C.-Y. Hsu, Z. H. Mahmoud, S. Abdullaev, F. K. Ali, Y. A. Naeem, R. M. Mizher, M. M. Karim, A. S. Abdulwahid, Z. Ahmadi and S. Habibzadeh, Case Stud. Chem. Environ. Eng., 2024, 100626 CrossRef CAS.
- G. Krishna, P. M. Sidhharth and L. Gangadhar, Turk. J. Comput. Math. Educ., 2021, 12, 3707–3717 Search PubMed.
- M. S. Waghmode, A. B. Gunjal, J. A. Mulla, N. N. Patil and N. N. Nawani, SN Appl. Sci., 2019, 1, 310 CrossRef CAS.
- M. Rafique, S. Hajra, M. Irshad, M. Usman, M. Imran, M. A. Assiri and W. M. Ashraf, ACS Omega, 2023, 8, 25640–25648 CrossRef CAS PubMed.
- S. S. Mani, R. Sivaraj, T. Mathew and G. S. Chinnakonda, Energy Adv., 2024, 3, 1472 RSC.
- M. A. Hassaan, M. A. El-Nemr, M. R. Elkatory, S. Ragab, V.-C. Niculescu and A. El Nemr, Top. Curr. Chem., 2023, 381, 31 CrossRef CAS PubMed.
- M. Mhadhbi, H. Abderazzak and B. Avar, Synthesis and Properties of Titanium Dioxide Nanoparticles, IntechOpen, 2023 Search PubMed.
- N. Thakur, N. Thakur, A. Kumar, V. K. Thakur, S. Kalia, V. Arya, A. Kumar, S. Kumar and G. Z. Kyzas, Sci. Total Environ., 2024, 169815 CrossRef CAS PubMed.
- M. R. Amiri, M. Alavi, M. Taran and D. Kahrizi, J. Public Health Res., 2022, 11, 22799036221104151 Search PubMed.
- J. Shi, J. Li, Y. Wang and C. Y. Zhang, Chem. Eng. J., 2022, 431, 133714 CrossRef CAS.
- S. Verma, N. Kumar, K.-H. Kim and J. Park, Chem. Eng. J., 2024, 486, 150269 CrossRef CAS.
- A. Badoni, R. Sharma and J. Prakash, in Antibacterial and Antiviral Functional Materials, ACS Publications, 2024, vol. 2, pp. 257–280 Search PubMed.
- S. Suvathi, K. Ravichandran, M. Karunakaran, P. Praseetha, M. Ayyanar and S. Gobalakrishnan, Appl. Mater. Today, 2024, 36, 102024 CrossRef.
- Y. Liang, G. Huang, X. Xin, Y. Yao, Y. Li, J. Yin, X. Li, Y. Wu and S. Gao, J. Mater. Sci. Technol., 2022, 112, 239–262 CrossRef CAS.
- S. G. Ullattil, S. B. Narendranath, S. C. Pillai and P. Periyat, Chem. Eng. J., 2018, 343, 708–736 CrossRef CAS.
- F. Yang, D. Liu, Y. Li, S. Ning, L. Cheng and J. Ye, Chem. Eng. J., 2021, 406, 126838 CrossRef CAS.
- B. Mei, K. Han and G. Mul, ACS Catal., 2018, 8, 9154–9164 CrossRef CAS PubMed.
- W. Fu, Z. Li, Y. Wang, Y. Sun and Y. Dai, Chem. Eng. J., 2020, 401, 126013 CrossRef CAS.
- Z. Li, S. Wang, J. Wu and W. Zhou, Renewable Sustainable Energy Rev., 2022, 156, 111980 CrossRef.
- X. Liu, Z. Xing, Y. Zhang, Z. Li, X. Wu, S. Tan, X. Yu, Q. Zhu and W. Zhou, Appl. Catal., B, 2017, 201, 119–127 CrossRef CAS.
- Z. Jiang, W. Wei, D. Mao, C. Chen, Y. Shi, X. Lv and J. Xie, Nanoscale, 2015, 7, 784–797 RSC.
- Y. Cao, Z. Xing, M. Hu, Z. Li, X. Wu, T. Zhao, Z. Xiu, S. Yang and W. Zhou, J. Catal., 2017, 356, 246–254 CrossRef CAS.
- X. Jiang and M. Fuji, Catal. Lett., 2022, 152, 3272–3283 CrossRef CAS.
- X. Yan, Y. Li and T. Xia, Int. J. Photoenergy, 2017, 2017, 8529851 CrossRef.
- F. Wang, W. Ge, T. Shen, B. Ye, Z. Fu and Y. Lu, Appl. Surf. Sci., 2017, 410, 513–518 CrossRef CAS.
- M. Janczarek and E. Kowalska, Catalysts, 2021, 11, 978 CrossRef CAS.
- W. Zhou and H. Fu, Inorg. Chem. Front., 2018, 5, 1240–1254 RSC.
- S. Tuntithavornwat, C. Saisawangc, T. Ratvijitvech, A. Watthanaphanit, M. Hunsom and A. M. Kannan, Int. J. Hydrogen Energy, 2024, 15, 1559–1593 CrossRef.
- S. Mohajernia, P. Andryskova, G. Zoppellaro, S. Hejazi, S. Kment, R. Zboril, J. Schmidt and P. Schmuki, J. Mater. Chem. A, 2020, 8, 1432–1442 RSC.
- S. J. Babu, V. N. Rao, D. H. Murthy, M. Shastri, M. Murthy, M. Shetty, K. A. Raju, P. D. Shivaramu, C. A. Kumar and M. Shankar, Ceram. Int., 2021, 47, 14821–14828 CrossRef CAS.
- L. Lu, G. Wang, Z. Xiong, Z. Hu, Y. Liao, J. Wang and J. Li, Ceram. Int., 2020, 46, 10667–10677 CrossRef CAS.
- J. Zhang, C. Y. Toe, P. Kumar, J. Scott and R. Amal, Appl. Catal., B, 2023, 333, 122765 CrossRef CAS.
- C. Wang, X. Kang, J. Liu, D. Wang, N. Wang, J. Chen, J. Wang, C. Tian and H. Fu, Inorg. Chem. Front., 2023, 10, 1153–1163 RSC.
- X. Jia, D. Zhong, Y. Fang, Z. Zhang, X. Zhang, J. Zhao and D. Wang, ACS Appl. Nano Mater., 2023, 6, 6076–6085 CrossRef CAS.
- J. Cao, B. Luo, Y. Zhang, J. Li, L. Ma and D. Jing, Sep. Purif. Technol., 2023, 327, 124965 CrossRef CAS.
- L. Liccardo, P. Moras, P. M. Sheverdyaeva, A. Vomiero, A. Caballero, G. Colón and E. Moretti, Adv. Sustainable Syst., 2024, 8, 2300418 CrossRef CAS.
- N. Abdulwali, J. van der Zalm, A. R. Thiruppathi, A. Khaleel and A. Chen, Appl. Surf. Sci., 2024, 642, 158579 CrossRef CAS.
- L. Li, X. Qin, G. Wang, L. Qi, G. Du and Z. Hu, Appl. Surf. Sci., 2011, 257, 8006–8012 CrossRef CAS.
- G. Tai and W. Guo, Ultrason. Sonochem., 2008, 15, 350–356 CrossRef CAS PubMed.
- X. Wang and H. Wang, ChemistrySelect, 2020, 5, 9022–9029 CrossRef CAS.
- Z. Jin, X. Zhang, Y. Li, S. Li and G. Lu, Catal. Commun., 2007, 8, 1267–1273 CrossRef CAS.
- M. A. Nadeem, M. A. Khan, A. A. Ziani and H. Idriss, Catalysts, 2021, 11, 60 CrossRef CAS.
- P. Lianos, J. Hazard. Mater., 2011, 185, 575–590 CrossRef CAS PubMed.
- Y. Zhang, J. Zhao, H. Wang, B. Xiao, W. Zhang, X. Zhao, T. Lv, M. Thangamuthu, J. Zhang and Y. Guo, Nat. Commun., 2022, 13, 58 CrossRef CAS PubMed.
- T. Rajaraman, S. P. Parikh and V. G. Gandhi, Chem. Eng. J., 2020, 389, 123918 CrossRef CAS.
- Q. Chen, H. Wang, C. Wang, R. Guan, R. Duan, Y. Fang and X. Hu, Appl. Catal., B, 2020, 262, 118258 CrossRef CAS.
- R. A. Spurr and H. Myers, Anal. Chem., 1957, 29, 760–762 CrossRef CAS.
- U. Holzwarth and N. Gibson, Nat. Nanotechnol., 2011, 6, 534 CrossRef CAS PubMed.
- M. Wajid Shah, Y. Zhu, X. Fan, J. Zhao, Y. Li, S. Asim and C. Wang, Sci. Rep., 2015, 5, 15804 CrossRef CAS PubMed.
- H. Haryadi, M. Hulupi, F. Abdillah, N. Sofiyani and R. A. Nuriana, AIP Conf. Proc., 2023, 2694, 070003 CrossRef.
- T. N. J. I. Edison, R. Atchudan, M. G. Sethuraman, J.-J. Shim and Y. R. Lee, J. Photochem. Photobiol., B, 2016, 161, 154–161 CrossRef CAS PubMed.
- A. C. Ferrari, Solid State Commun., 2007, 143, 47–57 CrossRef CAS.
- M. Thommes, K. Kaneko, A. V. Neimark, J. P. Olivier, F. Rodriguez-Reinoso, J. Rouquerol and K. S. Sing, Pure Appl. Chem., 2015, 87, 1051–1069 CrossRef CAS.
- X. Liu, H. Xu, L. R. Grabstanowicz, S. Gao, Z. Lou, W. Wang, Y. Dai and T. Xu, Catal. Today, 2014, 225, 80–89 CrossRef CAS.
- S. P. Lim, A. Pandikumar, H. N. Lim, R. Ramaraj and N. M. Huang, Sci. Rep., 2015, 5, 11922 CrossRef PubMed.
- A. Ziarati, A. Badiei and R. Luque, Appl. Catal., B, 2018, 238, 177–183 CrossRef CAS.
- H. Gao, M. Jia, S. Chen, X. Zhang and X. Tan, New J. Chem., 2020, 44, 17229–17235 RSC.
- Y. Hu, L. Hao, Y. Zhang, X. Ping, T. Liu, Q. Zhao, S. Guan and Y. Lu, J. Mater. Sci.: Mater. Electron., 2021, 32, 9412–9423 CrossRef CAS.
- S. A. Ansari and M. H. Cho, Sci. Rep., 2016, 6, 25405 CrossRef CAS PubMed.
- P. Makuła, M. Pacia and W. Macyk, J. Phys. Chem. Lett., 2018, 9, 6814–6817 CrossRef PubMed.
- M. Biesinger, X-Ray Photoelectron Spectroscopy (XPS) Reference Pages, 2015 Search PubMed.
- Z. Si, X. Zhang, Y. Liu, H. Zhou, X. Chen, X. Yang, H. Chen and J. Zhan, J. Mater. Sci., 2020, 55, 565–576 CrossRef CAS.
- L. Yang, Y. Peng, Y. Yang, J. Liu, Z. Li, Y. Ma, Z. Zhang, Y. Wei, S. Li and Z. Huang, ACS Appl. Nano Mater., 2018, 1, 4516–4527 CrossRef CAS.
- H. Li, S. Wu, Z. D. Hood, J. Sun, B. Hu, C. Liang, S. Yang, Y. Xu and B. Jiang, Appl. Surf. Sci., 2020, 513, 145723 CrossRef CAS.
- T. Jedsukontorn, N. Saito and M. Hunsom, Mol. Catal., 2017, 432, 160–171 CrossRef CAS.
- P. M. Leukkunen, E. Rani, A. A. S. Devi, H. Singh, G. King, M. Alatalo, W. Cao and M. Huttula, RSC Adv., 2020, 10, 36930–36940 RSC.
- S. Rahimnejad, J. H. He, F. Pan, W. Chen, K. Wu and G. Q. Xu, Mater. Res. Express, 2014, 1, 045044 CrossRef.
- A. Fetisov, G. Kozhina, S. K. Estemirova, V. Fetisov and R. Gulyaeva, Phys. C, 2015, 508, 62–68 CrossRef CAS.
- C. Kumar and A. Pattammattel, Introduction to Graphene, ed. CV Kumar and A. Pattammattel, 2017, 45–74 Search PubMed.
- X.-H. Gao, Z.-M. Guo, Q.-F. Geng, P.-J. Ma, A.-Q. Wang and G. Liu, RSC Adv., 2016, 6, 63867–63873 RSC.
- M. Hussain, Z. H. Ibupoto, M. A. Abbassi, A. Khan, G. Pozina, O. Nur and M. Willander, J. Nanoelectron. Optoelectron., 2014, 9, 348–356 CrossRef CAS.
- M. Gansukh, Z. Li, M. E. Rodriguez, S. Engberg, F. M. A. Martinho, S. L. Mariño, E. Stamate, J. Schou, O. Hansen and S. Canulescu, Sci. Rep., 2020, 10, 18388 CrossRef CAS PubMed.
- A. Naldoni, M. Allieta, S. Santangelo, M. Marelli, F. Fabbri, S. Cappelli, C. L. Bianchi, R. Psaro and V. Dal Santo, J. Am. Chem. Soc., 2012, 134, 7600–7603 CrossRef CAS PubMed.
- X. Chen, L. Liu, P. Y. Yu and S. S. Mao, Science, 2011, 331, 746–750 CrossRef CAS PubMed.
- X. Chen, L. Liu, Z. Liu, M. A. Marcus, W.-C. Wang, N. A. Oyler, M. E. Grass, B. Mao, P.-A. Glans and P. Y. Yu, Sci. Rep., 2013, 3, 1–7 Search PubMed.
- G. Zhou, L. Shen, Z. Xing, X. Kou, S. Duan, L. Fan, H. Meng, Q. Xu, X. Zhang and L. Li, J. Colloid Interface Sci., 2017, 505, 1031–1038 CrossRef CAS PubMed.
- Q. Zhu, Y. Peng, L. Lin, C.-M. Fan, G.-Q. Gao, R.-X. Wang and A.-W. Xu, J. Mater. Chem. A, 2014, 2, 4429–4437 RSC.
- G. Liu, G. Wang, Z. Hu, Y. Su and L. Zhao, Appl. Surf. Sci., 2019, 465, 902–910 CrossRef CAS.
- Y. Zhang, Z. Xing, X. Liu, Z. Li, X. Wu, J. Jiang, M. Li, Q. Zhu and W. Zhou, ACS Appl. Mater. Interfaces, 2016, 8, 26851–26859 CrossRef CAS PubMed.
- Q. Li, Y. Liu, Z. Wan, H. Cao, S. Zhang, Y. Zhou, X. Ye, X. Liu and D. Zhang, Chin. Chem. Lett., 2022, 33, 3835–3841 CrossRef CAS.
- J. Di, L. Li, Q. Wang and J. Yu, CCS Chem., 2021, 3, 2280–2297 CrossRef CAS.
- T. Leshuk, R. Parviz, P. Everett, H. Krishnakumar, R. A. Varin and F. Gu, ACS Appl. Mater. Interfaces, 2013, 5, 1892–1895 CrossRef CAS PubMed.
- L. Hou, Z. Guan, T. Liu, C. He, Q. Li and J. Yang, Int. J. Hydrogen Energy, 2019, 44, 8109–8120 CrossRef CAS.
- F. Amano, M. Nakata, A. Yamamoto and T. Tanaka, J. Phys. Chem. C, 2016, 120, 6467–6474 CrossRef CAS.
- Y. Xiong, D. Gu, X. Deng, H. Tüysüz, M. van Gastel, F. Schüth and F. Marlow, Microporous Mesoporous Mater., 2018, 268, 162–169 CrossRef CAS.
- O. Elbanna, M. Fujitsuka, S. Kim and T. Majima, J. Phys. Chem. C, 2018, 122, 15163–15170 CrossRef CAS.
- Z. Jiang, R. Qi, Z. Huang, W. Shangguan, R. J. Wong and A. Lee, Energy Environ. Mater., 2020, 3, 202–208 CrossRef CAS.
- J. Yan, L. Dai, P. Shi, J. Fan, Y. Min and Q. Xu, CrystEngComm, 2020, 22, 4030–4038 RSC.
- Y. Yamazaki, K. Mori, Y. Kuwahara, H. Kobayashi and H. Yamashita, ACS Appl. Mater. Interfaces, 2021, 13, 48669–48678 CrossRef CAS PubMed.
| This journal is © The Royal Society of Chemistry 2024 |