DOI:
10.1039/D4RA03961K
(Paper)
RSC Adv., 2024,
14, 21089-21101
Synthesis, DFT studies on a series of tunable quinoline derivatives†
Received
29th May 2024
, Accepted 25th June 2024
First published on 4th July 2024
Abstract
The synthesis, Density Functional Theory (DFT) calculations, and photo physical characteristics of a range of quinoline derivatives have been described in the present work. Initially, the innovative derivatives are synthesized through the cyclization of 2-amino-5-nitrobenzophenone with either acetyl acetone or ethyl acetoacetate, followed by reducing the nitro group to an amine. Subsequently, these compounds undergo an acid-amine cross-coupling reaction. The investigation shows the DFT and photo physical properties of these substances. It is noteworthy that compound 6z exhibits the most remarkable Stokes shift among the fluorophores investigated. Furthermore, the research also provides insights into the electrophilicity index, Electronegativity, chemical potential, chemical hardness and softness properties. These properties are determined by utilizing Density Functional Theory (DFT) calculations and evaluating electron potential efficiency and using computational methods Time-Dependent Density Functional Theory (TD-DFT) to predict absorption spectra in molecules at the B3LYP/6-31G′(d,p) level/basis.
1 Introduction
A range of naturally occurring compounds and chemically significant molecules contain a quinoline-amide moiety exhibiting diverse biological activities. Quinoline derivatives have been used in various biological applications including antibacterial,1 antimalarial,2 anticancer (specifically against breast cancer), antiproliferative, and anti-epidermal growth factor receptor (EGFR)3 activities. They also have properties as antimicrobial,4 anti-inflammatory,5 antioxidant,6 antitubercular,7 antimalarial, antiplasmodial,8 and antiprotozoal drugs.9 In addition, quinoline aryl amides have been evaluated for their antidiabetic activity, specifically their inhibition of α-glucosidase and α-amylase enzymes,10 as well as their antioxidant, antifungal, and antibacterial properties.11 The development of an amide bond through the coupling of an amine and a carboxylic acid is a widely utilized chemical reaction in drug development.12 This reaction is of considerable significance due to the abundance of carboxylic acids and amine derivatives facilitating the synthesis of novel medicinal compounds typically this reaction proceeds in the presence of an acid-activating reagent or catalyst.13 Numerous reagents and protocols have been documented for this transformation including the use of acyl chlorides and various N-acylation techniques such as mixed anhydride methods,14–16 carbodiimides (with or without additives),17,18 polymer-supported coupling agents,19 native chemical ligations,20 and more researchers have employed various reagents with suitable bases for this coupling process, including POCl3, DCC/DMAP, SOCl2, T3P, EDC.HCl, HATU, and other coupling agents.21,22 Particularly the most favourable results were obtained using HATU/DIPEA, with minimal side effects.
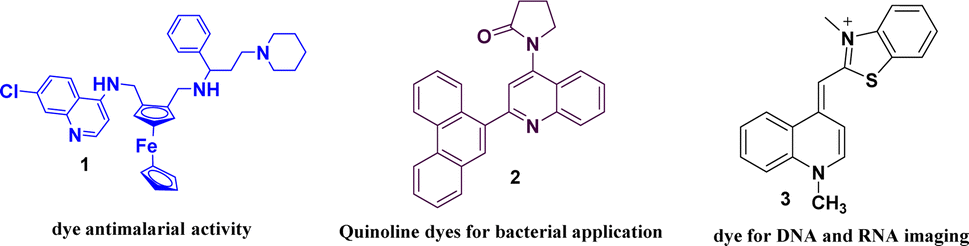
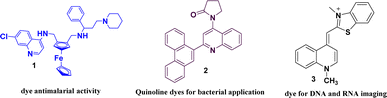
Organic fluorophores with rapid response times enabling real-time event monitoring with high spatial resolution, have gained significant popularity in research.23 In physiological research, the use of fluorescent dyes that are easy to functionalize and demonstrate efficacy in biological investigations is a critical consideration.24,25 Fluorescent probes particularly those based on quinoline structures are crucial for bio-imaging investigations.26,27 Fluorescence-based assays are key for studying DNA structure, hybridization and interactions with molecules, the dyes are used in DNA labelling for cell imaging, gel analysis, and PCR quantification shown in Fig. 1.28–34 Quinoline moieties are important in fluorescent sensors for their rapid modification of water solubility, chemical stability and biocompatibility.35 Quinoline constitutes the core structure of quinine an initial and well-characterized small-molecule fluorophore36,37 and has been examined as a compelling molecular probe due to the nitrogen atom serving as a locus for tracking interactions with target analytes via alterations in fluorescence emission.38–40 Quinoline derivatives have electron donation and intense. π–π* transitions making them useful in selective fluorophores.41 These derivatives have been observed to effectively detect hydrazine42 effectively and have recently been used to detect various anions and cations.43–47 Selecting an optimal fluorescence probe requires consideration of quantum yield, absorption/emission wavelengths, photo stability, chemical stability, and Stokes shift. New probes are continually being developed.48 Fluorescent quinolines are effective in identifying bacteria and metal ions in chemo-sensing.49,50 They exhibit intramolecular charge transfer (ICT) due to their electron-accepting properties and a distinct dipole moment.51,52 The use of quinoline derivatives, such as 8-hydroxyquinolines, as chelators is common. These compounds are widely employed as Zn2+ sensors due to their excellent properties.53–56 In 1968, 8-hydroxyquinoline was the first fluorescent zinc ion indicator used to detect zinc in human plasma.57 When these compounds are excited by light, their electronic properties change, resulting in fluorescence with a significant shift in the emitted light's wavelength.58 This substantial shift is advantageous in biological applications such as fluorescence microscopy as it helps minimize colour distortion and enhance resolution.59 Compounds with large spectral shifts are also useful in Förster resonance energy transfer (FRET) microscopy, allowing direct excitation of acceptor molecules by neighbouring donor molecules.60 These compounds have gained significant interest due to their potential applications in photo-electronic systems, as non-linear optical materials, light emitters, or in organic light-emitting diodes (OLED).61–63 They are sensitive to external factors such as solvent polarity or viscosity and are commonly used as chemical detectors.64,65 While Schiff bases are not commonly known for their fluorescent properties, they are often recognized for their antifungal, antibacterial, antiproliferative, anti-inflammatory, antimalarial, and antiviral properties.66–68 Additionally, Schiff bases are employed as sensors for metal ions or pH levels.69,70 Computational chemistry, driven by advancements in technology and algorithms, highlights the use of Density Functional Theory (DFT) for understanding electronic structures and reactivity in molecular systems and predicting molecular characteristics.71,72 DFT uses reactivity descriptors such as electronegativity and hardness to better understand and predict molecular behaviour and attributes in chemistry and materials science.73,74
 |
| | Fig. 1 Some examples of quinoline-based dyes. | |
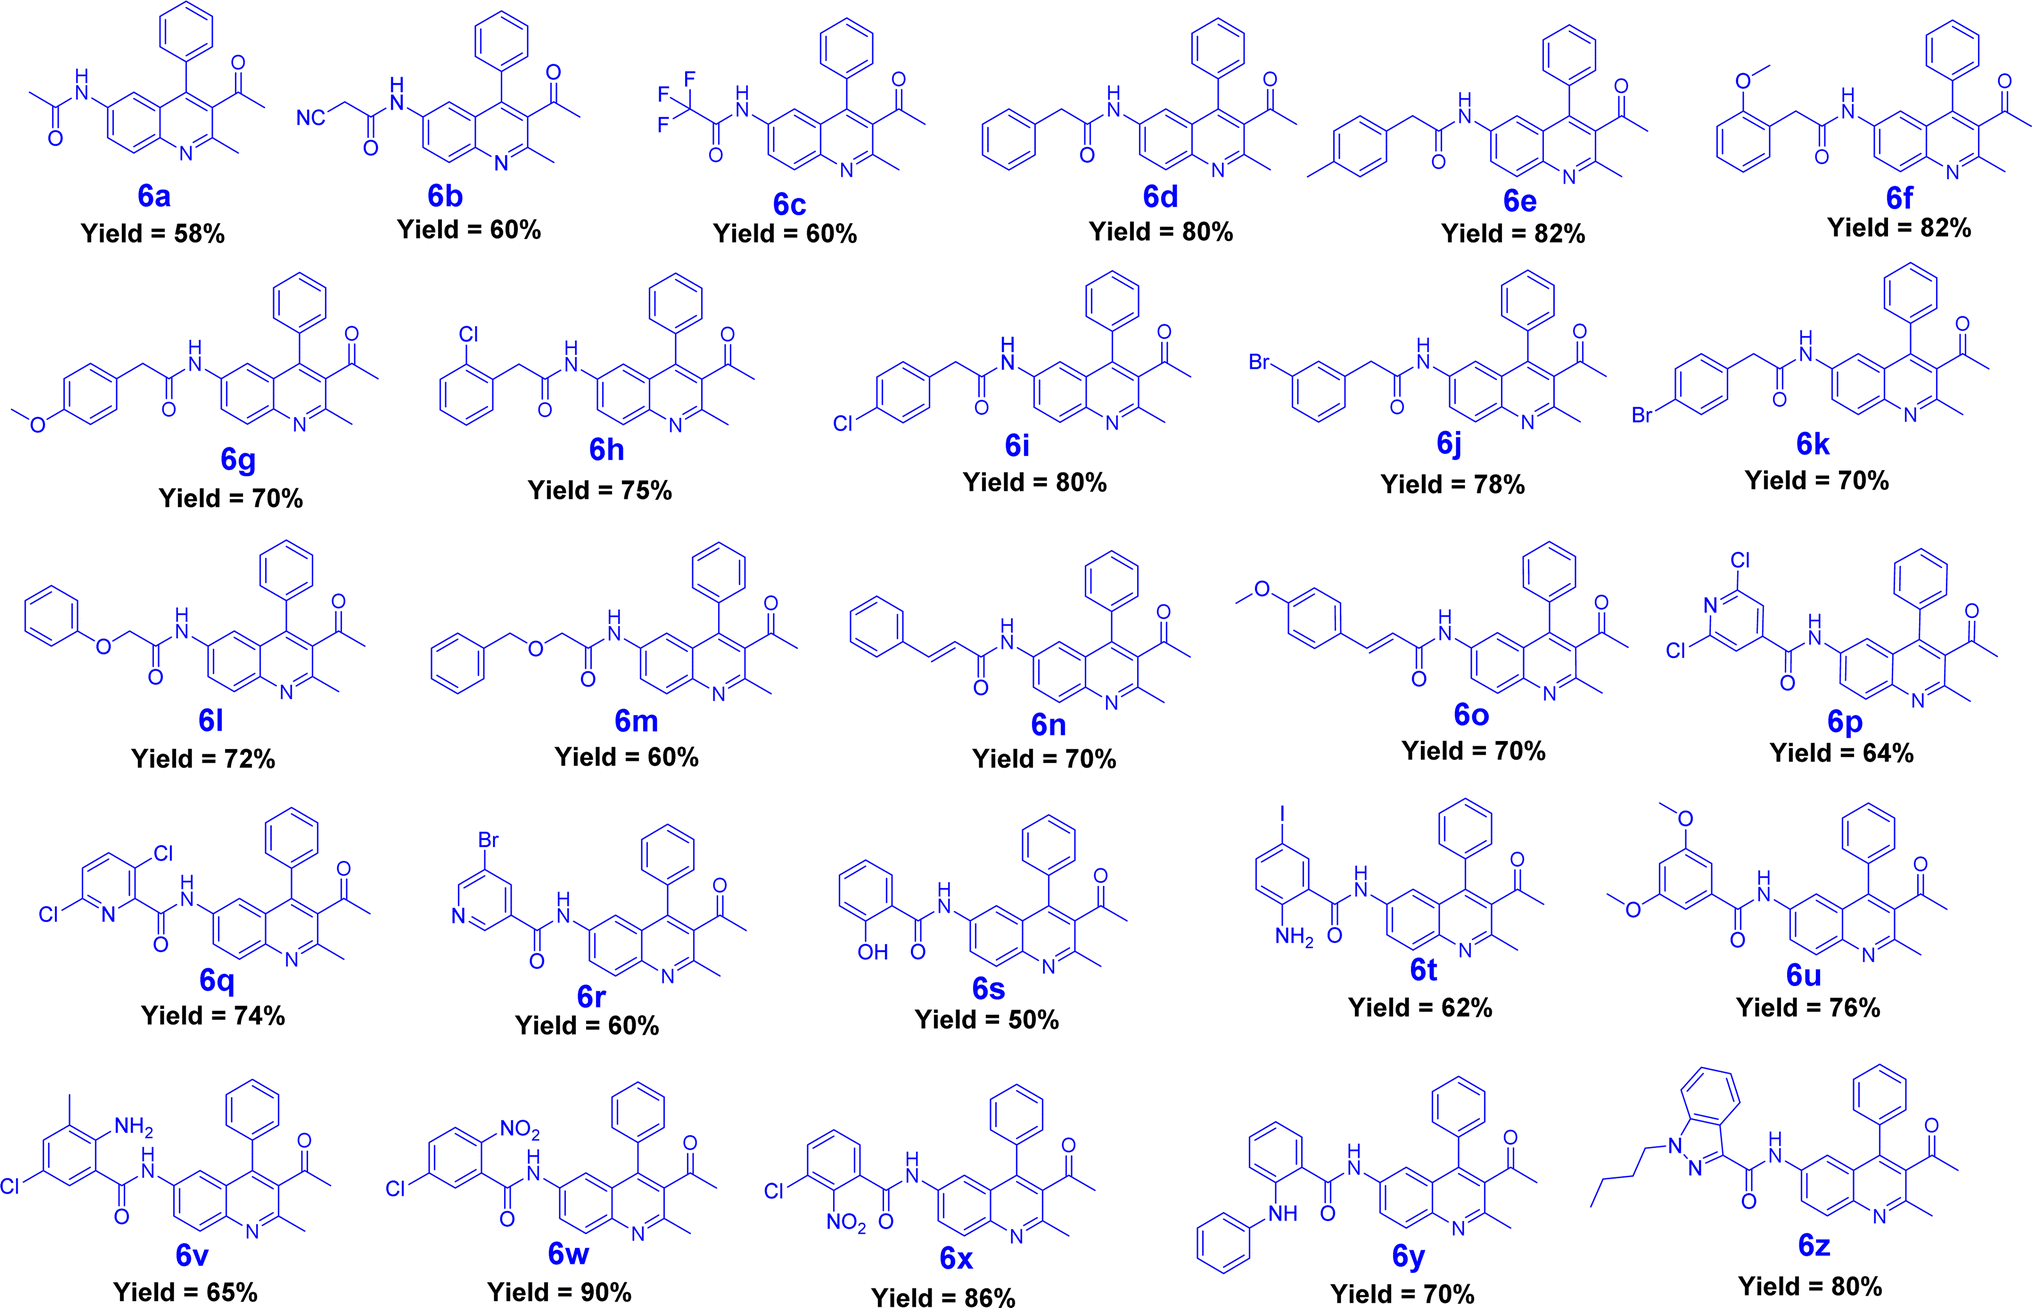
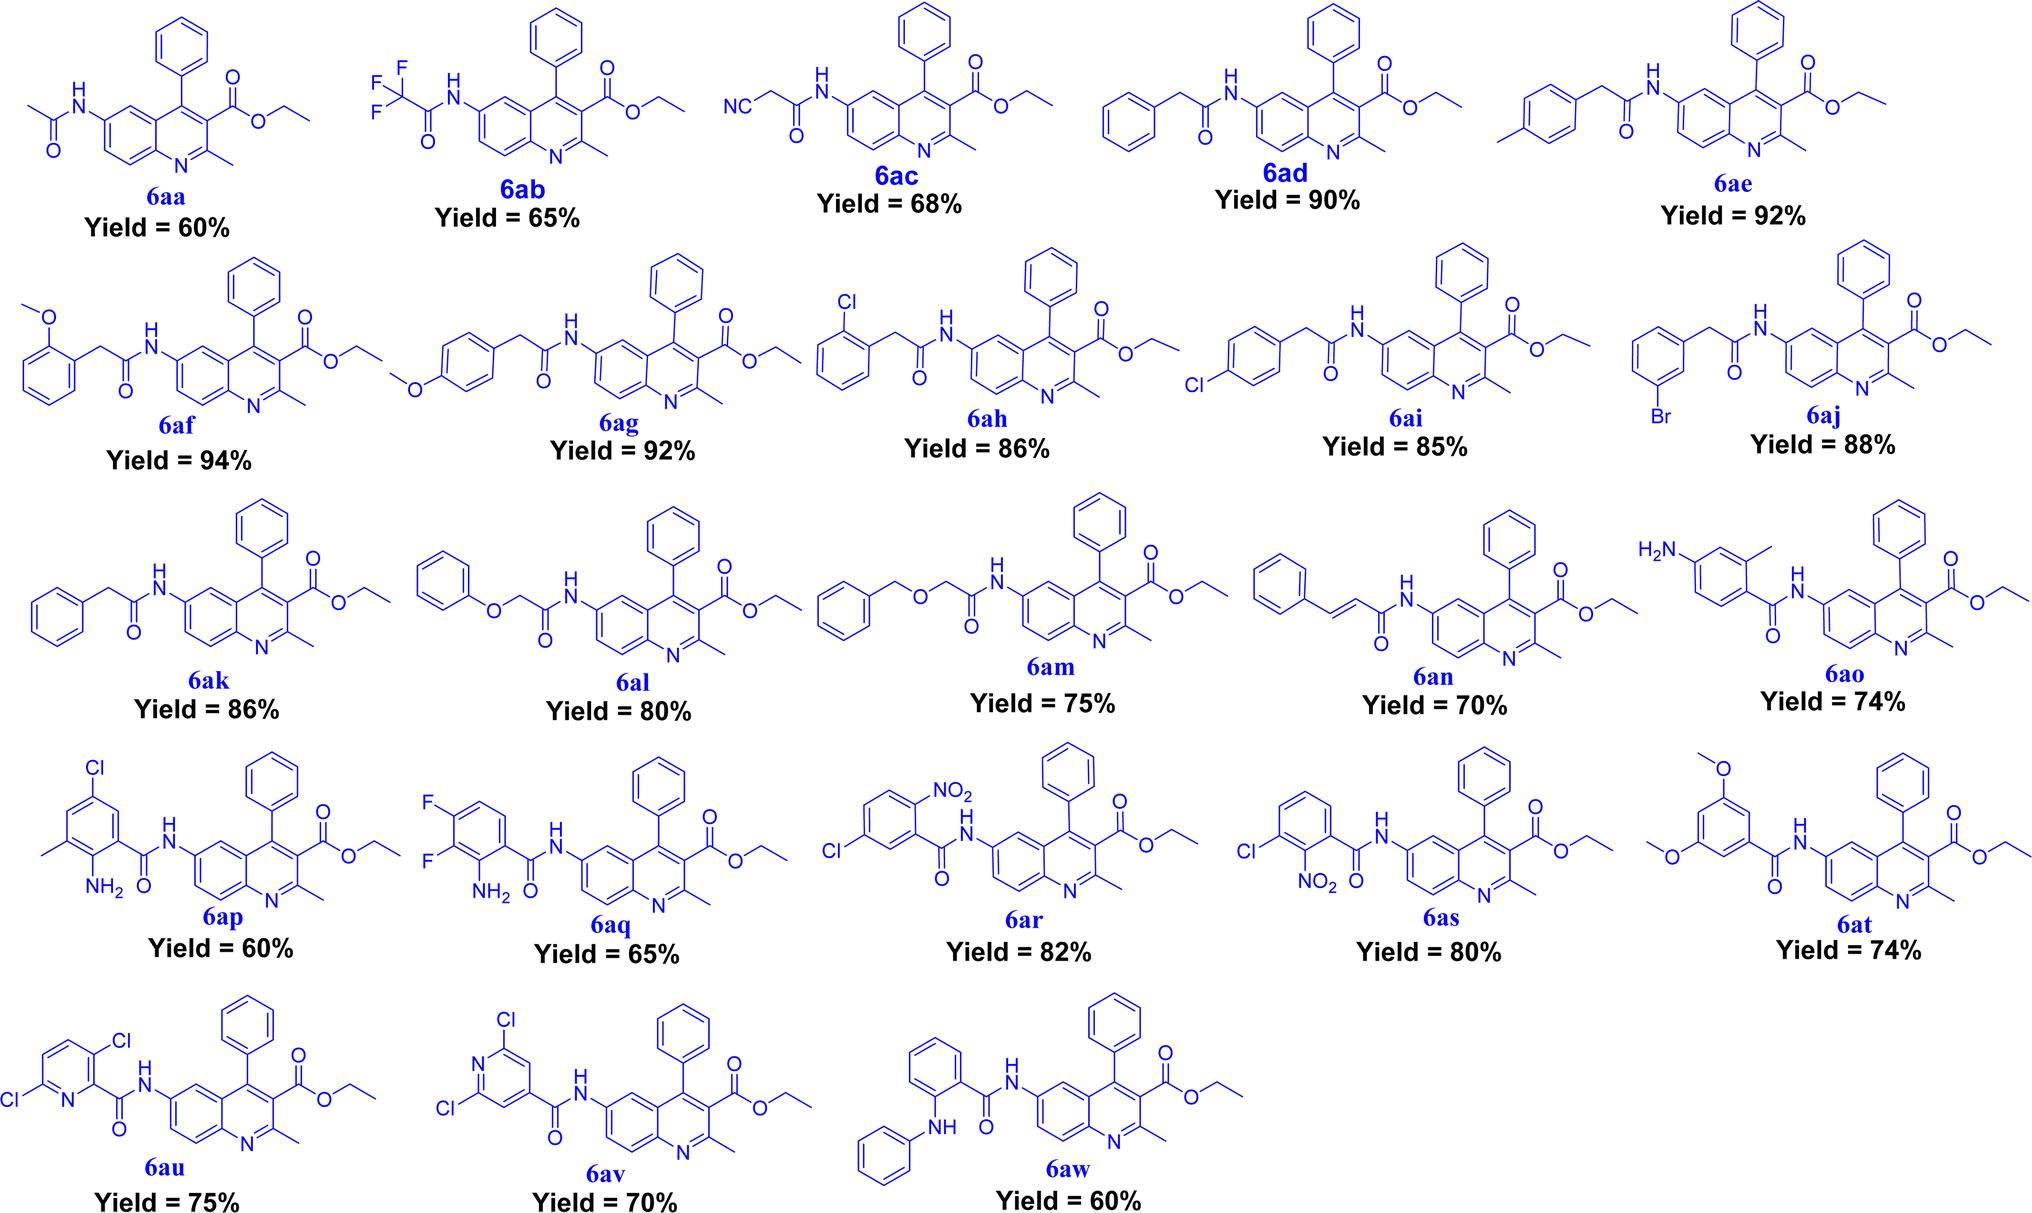
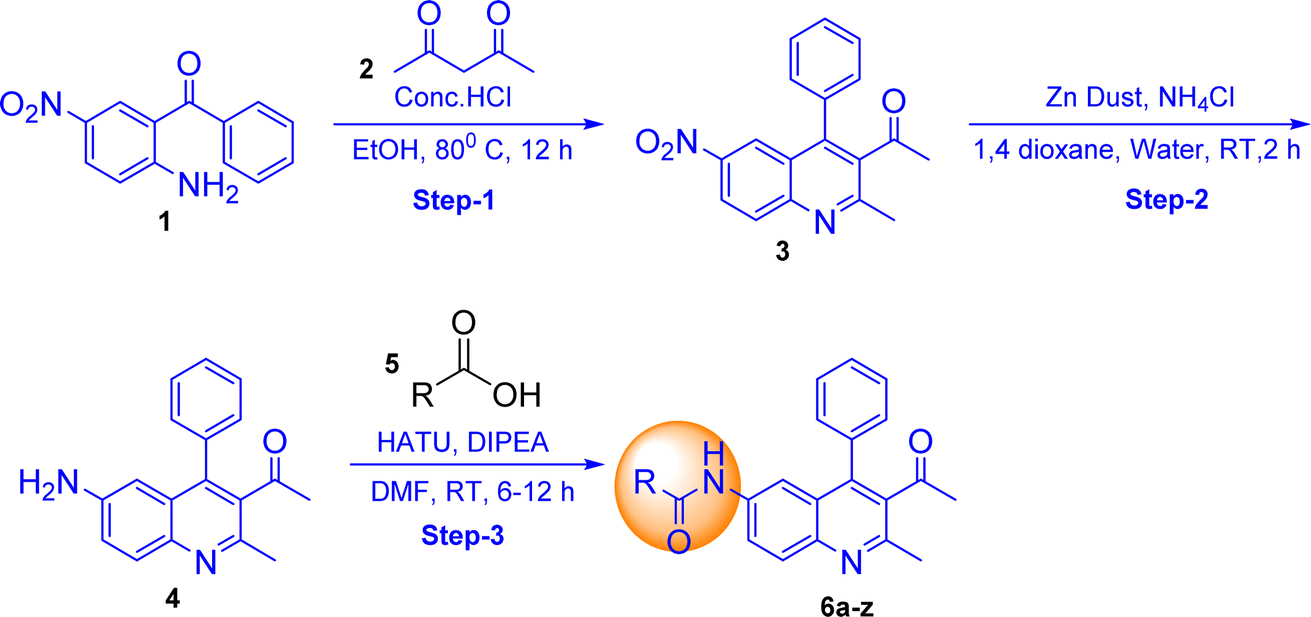
In this present work a new series of quinoline derivatives have been synthesized by cyclizing 2-amino-5-nitrobenzophenone with acetyl acetone or ethyl acetoacetate, followed by reducing the nitro group to an amine (Schemes 1 and 2) and then subjecting it to an acid-amine cross-coupling reaction. Using different types of carboxylic acid and coupling reagents such as HATU and DIPEA, 49 derivatives were synthesized, with yields ranging from 50–90%. All compounds were confirmed through various analytical techniques such as 1H NMR, 13C NMR, DEPT-135, HRMS, and IR, in addition to examining the structural properties, chemical stability, and reactivity of target molecule.31 compound recorded UV-vis and FL spectra and calculated stokes shift, molar extinction coefficient and quantum yield. All compounds were optimized by density functional theory (DFT) and investigated to understand the stability of the most active derivatives. We performed DFT calculations, frontier molecular orbital analysis (FMO), molecular electrostatic potential and TD DFT recorded theoretical absorbance UV-vis spectra.
2 Results and discussion
2.1. Chemistry
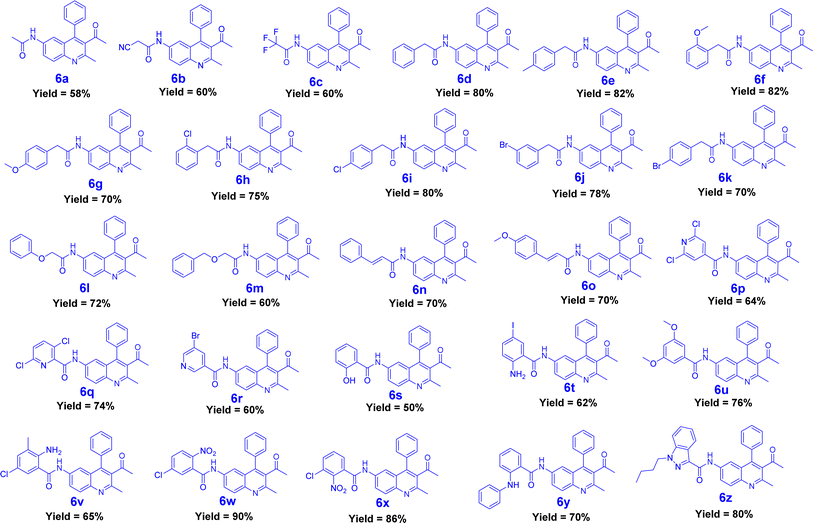
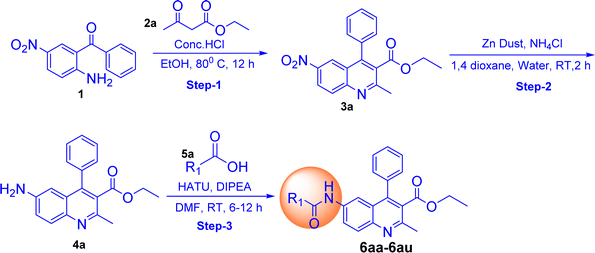
The synthesis of quinoline-amide derivatives 6a–6z and 6aa–6aw shown in Fig. 2 and 3 proceeds through several steps as outlined in Schemes 1 and 2. Initially, the reaction of (2-amino-5-nitrophenyl)(phenyl)methanone (1) with pentane-2,4-dione (2) and ethyl 3-oxobutanoate (2a) yields intermediates 1-(2-methyl-6-nitro-4-phenylquinolin-3-yl)ethan-1-one (3) and ethyl 2-methyl-6-nitro-4-phenylquinoline-3-carboxylate (3a). Subsequent reduction of the nitro group in compound 3 affords 1-(6-amino-2-methyl-4-phenylquinolin-3-yl)ethan-1-one (4). The target quinoline-amide derivatives (6a–6z and 6aa–6aw) are then synthesized by reacting compound 4 and ethyl 6-amino-2-methyl-4-phenylquinoline-3-carboxylate (4a) with various carboxylic acids. This multi-step process involves condensation reactions, nitro group reduction, and coupling reactions to yield the desired products. The chemical structures of all compounds (6a–6z and 6aa–6aw) were thoroughly analyzed using various spectroscopic techniques including 1H NMR, 13C NMR, DEPT-135, IR, and HRMS. Additionally, for compounds 6a, 6b, 6c, 6d, 6l, 6m, 6p, and 6t, 2D NMR techniques such as HSQC (Heteronuclear Single Quantum Coherence) and H, H–COSY (Correlation Spectroscopy) were employed to further elucidate their structures. The IR spectral analysis of compounds 6a–6z and 6aa–6aw revealed distinct features. Specifically, two bands in the range of 3583–3489 cm−1 and 3394–3209 cm−1 were identified, corresponding to the –NH stretching vibrations. Additionally, characteristic bands of carbonyl (C![[double bond, length as m-dash]](https://www.rsc.org/images/entities/char_e001.gif) O) groups were observed in the spectra, appearing in the range of 1710–1702 cm−1 and 1691–1678 cm−1. Furthermore, the presence of CC bonds was evidenced by bands in the region of 1555–1541 cm−1 and 1537–1526 cm−1. The 1H NMR spectral analysis of compounds 6a–6w and 6aa–6aw revealed several key signals indicative of their structural features. Signals corresponding to the NH (amide) groups of the quinoline moiety were observed in the region of δ 11.15–10.33 ppm, highlighting their presence in the molecules. Additionally, the methyl group at the 2nd position of the quinoline exhibited a singlet signal in the range of δ 2.55–2.59 ppm. Notably, signals for the 5th, 7th, and 8th positions of the quinoline ring were detected at specific chemical shift regions: 7.85–7.80 ppm (d, J = 1.60 Hz), 8.01–7.97 ppm (dd, J = 2.00 and 8.80 Hz), and 7.98–7.95 ppm (d, J = 9.20 Hz), respectively. Moreover, in compounds 6n and 6m, the presence of trans protons was confirmed by the coupling constant (J) value, with one proton appearing as a doublet in the region of 6.82–6.63 ppm and another proton displaying signals at 7.55–7.51 ppm with J = 15.6 Hz. This trans proton confirmation was further supported by 2D NMR H, H– COSY analysis. The confirmation of quinoline amide carbon formation was further substantiated through 13C NMR studies. Specifically, the signal corresponding to the H2N–CO carbon in compounds 6a–6z and 6aa–6aw was detected in the range of 175–182 ppm, consistent with the expected chemical shift for this functional group. In DEPT-135 spectra, all carbon signals observed were found to be by the expected chemical shifts for the respective carbon environments within compounds 6a–6z and 6aa–6aw. Detailed reaction procedures and spectral data for the target compounds are provided in the Experimental and ESI† sections, respectively. Based on the yield of the compounds we selected two representative samples; one with a higher yield and the other one with a lower yield from out of the two schemes (Schemes 1 and 2) and did optimization in different bases and solvents. The optimization process for the reactions of compounds 6a and 6af was carried out by introducing variations in the solvents and bases utilized. It is worth mentioning that employing the base DIPEA and the solvent DMF resulted in favourable outcomes, as evidenced by the satisfactory yield of 58% achieved for compound 6a and the high yield of 94% demonstrated by compound 6af. In addition to these positive results, alternative bases such as triethylamine and pyridine, as well as solvents including chloroform, and dichloromethane, also exhibited promising results for compound 6af. However, it is important to note that these alternatives failed to yield satisfactory results for compound 6a. The selection of the appropriate base and solvent is of utmost importance in determining the efficacy of the reaction, and in this case, it is evident that DIPEA and DMF emerged as the preferred combination for both compounds. However, THF did not support successful reactions when utilized with the aforementioned bases (Table 1).
O) groups were observed in the spectra, appearing in the range of 1710–1702 cm−1 and 1691–1678 cm−1. Furthermore, the presence of CC bonds was evidenced by bands in the region of 1555–1541 cm−1 and 1537–1526 cm−1. The 1H NMR spectral analysis of compounds 6a–6w and 6aa–6aw revealed several key signals indicative of their structural features. Signals corresponding to the NH (amide) groups of the quinoline moiety were observed in the region of δ 11.15–10.33 ppm, highlighting their presence in the molecules. Additionally, the methyl group at the 2nd position of the quinoline exhibited a singlet signal in the range of δ 2.55–2.59 ppm. Notably, signals for the 5th, 7th, and 8th positions of the quinoline ring were detected at specific chemical shift regions: 7.85–7.80 ppm (d, J = 1.60 Hz), 8.01–7.97 ppm (dd, J = 2.00 and 8.80 Hz), and 7.98–7.95 ppm (d, J = 9.20 Hz), respectively. Moreover, in compounds 6n and 6m, the presence of trans protons was confirmed by the coupling constant (J) value, with one proton appearing as a doublet in the region of 6.82–6.63 ppm and another proton displaying signals at 7.55–7.51 ppm with J = 15.6 Hz. This trans proton confirmation was further supported by 2D NMR H, H– COSY analysis. The confirmation of quinoline amide carbon formation was further substantiated through 13C NMR studies. Specifically, the signal corresponding to the H2N–CO carbon in compounds 6a–6z and 6aa–6aw was detected in the range of 175–182 ppm, consistent with the expected chemical shift for this functional group. In DEPT-135 spectra, all carbon signals observed were found to be by the expected chemical shifts for the respective carbon environments within compounds 6a–6z and 6aa–6aw. Detailed reaction procedures and spectral data for the target compounds are provided in the Experimental and ESI† sections, respectively. Based on the yield of the compounds we selected two representative samples; one with a higher yield and the other one with a lower yield from out of the two schemes (Schemes 1 and 2) and did optimization in different bases and solvents. The optimization process for the reactions of compounds 6a and 6af was carried out by introducing variations in the solvents and bases utilized. It is worth mentioning that employing the base DIPEA and the solvent DMF resulted in favourable outcomes, as evidenced by the satisfactory yield of 58% achieved for compound 6a and the high yield of 94% demonstrated by compound 6af. In addition to these positive results, alternative bases such as triethylamine and pyridine, as well as solvents including chloroform, and dichloromethane, also exhibited promising results for compound 6af. However, it is important to note that these alternatives failed to yield satisfactory results for compound 6a. The selection of the appropriate base and solvent is of utmost importance in determining the efficacy of the reaction, and in this case, it is evident that DIPEA and DMF emerged as the preferred combination for both compounds. However, THF did not support successful reactions when utilized with the aforementioned bases (Table 1).
 |
| | Fig. 2 Synthesized derivatives (6a–6z). | |
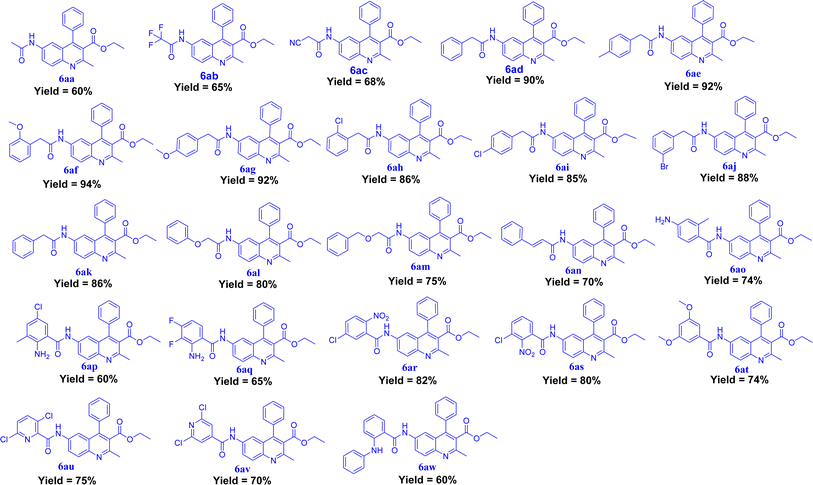 |
| | Fig. 3 Synthesized derivatives (6aa–6aw). | |
 |
| | Scheme 1 (R = substituted group of carboxylic acid). | |
 |
| | Scheme 2 (R1 = substituted group of carboxylic acid). | |
Table 1 Optimization of scheme compound 6a and 6af different base and solvent. (Qui-amine = quinoline amine, 4 = 1-(6-amino-2-methyl-4-phenylquinolin-3-yl)ethan-1-one, 4a = ethyl 6-amino-2-methyl-4-phenylquinoline-3-carboxylate, acid = substituted carboxylic acid.)
| Sr. no |
Compounds |
Base |
HATU |
Qui-amine |
Acid |
Solvents |
Yield (%) |
| 1 |
6a |
DIPEA |
1.5–2.0 equiv. |
4 |
CH3–COOH |
DMF |
58 |
| 2 |
6a |
DIPEA |
1.5–2.0 equiv. |
4 |
CH3–COOH |
CHCl3 |
45 |
| 3 |
6a |
DIPEA |
1.5–2.0 equiv. |
4 |
CH3–COOH |
DCM |
48 |
| 4 |
6a |
DIPEA |
1.5–2.0 equiv. |
4 |
CH3–COOH |
THF |
— |
| 5 |
6a |
Et3N |
1.5–2.0 equiv. |
4 |
CH3–COOH |
DMF |
46 |
| 6 |
6a |
Et3N |
1.5–2.0 equiv. |
4 |
CH3–COOH |
CHCl3 |
40 |
| 7 |
6a |
Et3N |
1.5–2.0 equiv. |
4 |
CH3–COOH |
DCM |
32 |
| 8 |
6a |
Et3N |
1.5–2.0 equiv. |
4 |
CH3–COOH |
THF |
— |
| 9 |
6a |
Pyridine |
1.5–2.0 equiv. |
4 |
CH3–COOH |
DMF |
56 |
| 10 |
6a |
Pyridine |
1.5–2.0 equiv. |
4 |
CH3–COOH |
CHCl3 |
44 |
| 11 |
6a |
Pyridine |
1.5–2.0 equiv. |
4 |
CH3–COOH |
DCM |
50 |
| 12 |
6a |
Pyridine |
1.5–2.0 equiv. |
4 |
CH3–COOH |
THF |
— |
| 13 |
6af |
DIPEA |
1.5–2.0 equiv. |
4a |
4-OMe–Ph–CH2–COOH |
DMF |
94 |
| 14 |
6af |
DIPEA |
1.5–2.0 equiv. |
4a |
4-OMe–Ph–CH2–COOH |
CHCl3 |
75 |
| 15 |
6af |
DIPEA |
1.5–2.0 equiv. |
4a |
4-OMe–Ph–CH2–COOH |
DCM |
78 |
| 16 |
6af |
DIPEA |
1.5–2.0 equiv. |
4a |
4-OMe–Ph–CH2–COOH |
THF |
— |
| 17 |
6af |
Et3N |
1.5–2.0 equiv. |
4a |
4-OMe–Ph–CH2–COOH |
DMF |
80 |
| 18 |
6af |
Et3N |
1.5–2.0 equiv. |
4a |
4-OMe–Ph–CH2–COOH |
CHCl3 |
72 |
| 19 |
6af |
Et3N |
1.5–2.0 equiv. |
4a |
4-OMe–Ph–CH2–COOH |
DCM |
66 |
| 20 |
6af |
Et3N |
1.5–2.0 equiv. |
4a |
4-OMe–Ph–CH2–COOH |
THF |
— |
| 21 |
6af |
Pyridine |
1.5–2.0 equiv. |
4a |
4-OMe–Ph–CH2–COOH |
DMF |
70 |
| 22 |
6af |
Pyridine |
1.5–2.0 equiv. |
4a |
4-OMe–Ph–CH2–COOH |
CHCl3 |
78 |
| 23 |
6af |
Pyridine |
1.5–2.0 equiv. |
4a |
4-OMe–Ph–CH2–COOH |
DCM |
66 |
| 24 |
6af |
Pyridine |
1.5–2.0 equiv. |
4a |
4-OMe–Ph–CH2–COOH |
THF |
— |
2.2. Density functional theory (DFT)
Density Functional Theory (DFT) is a highly effective theoretical approach with many applications. It can be used to determine compound's kinetic and thermodynamic stability, perform structural calculations, gain insights into mechanisms, analyze molecular interactions, and evaluate the optical and electronic properties of atoms and molecules. All theoretical calculations were carried out for this study using the Gaussian 09 software program.75 The compound's geometry was optimized using DFT at the B3LYP/6–31 G′(d,p) basic level set, and visualization was facilitated with the assistance of GaussView 5.0.76
2.3. Frontier molecular orbital (FMO)
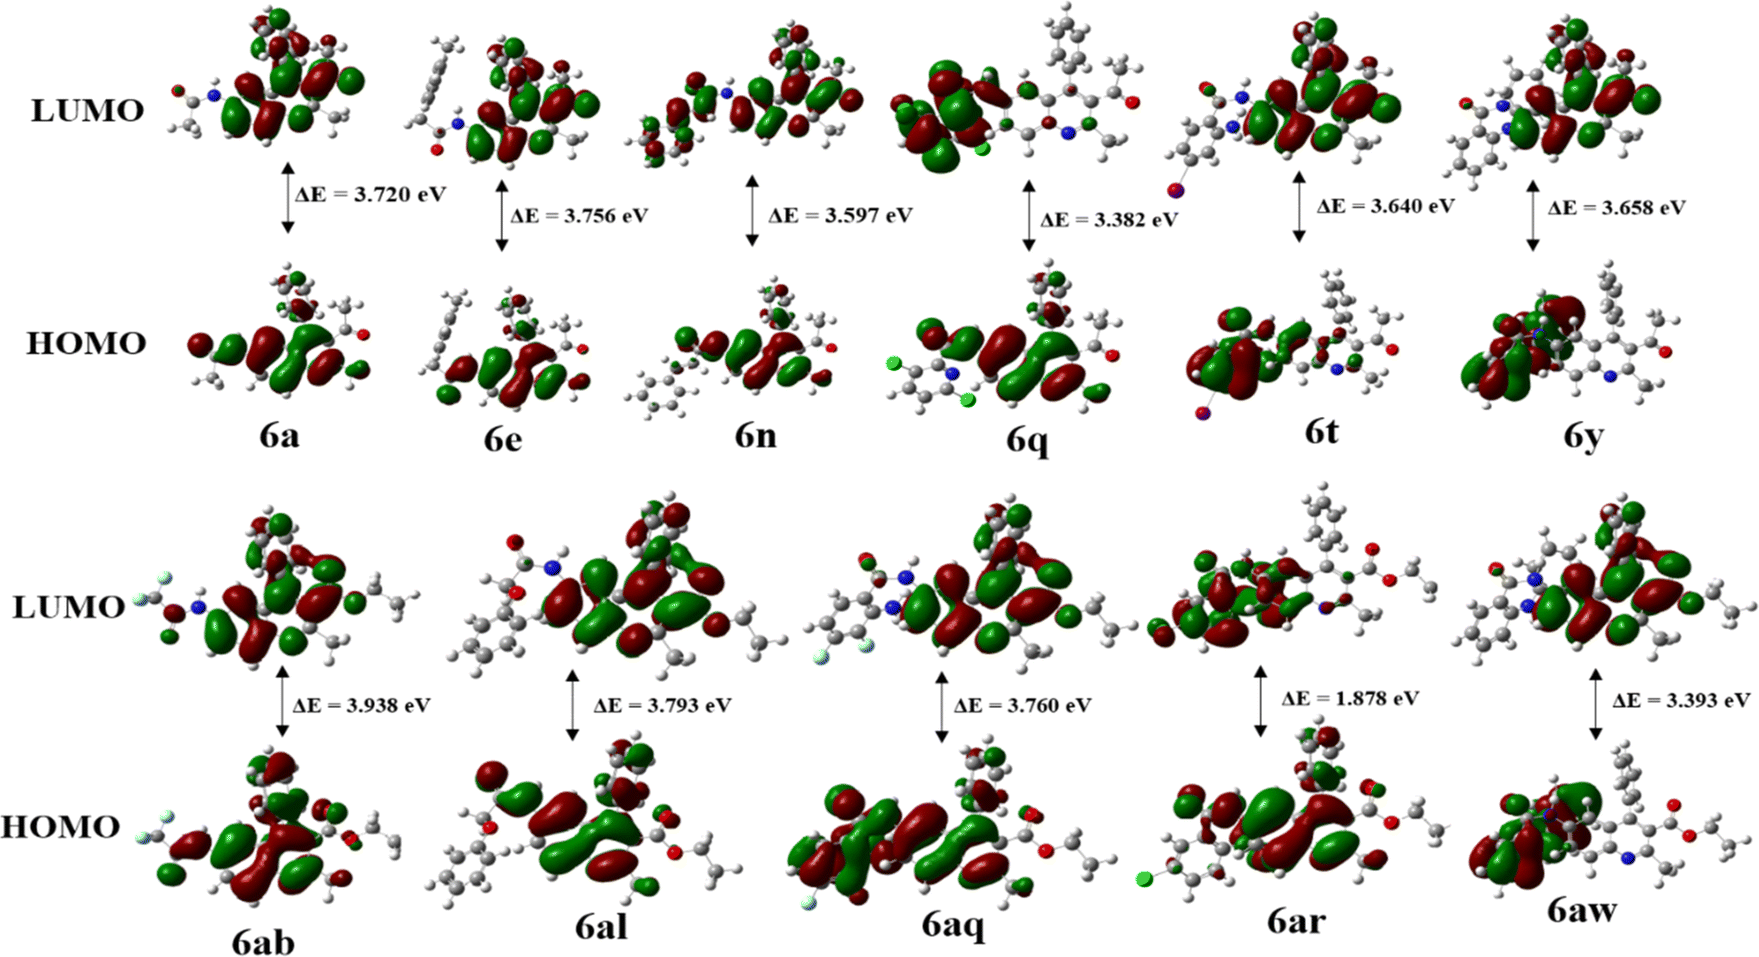
Frontier Molecular Orbital (FMO) analysis plays an essential role in analyzing the chemical stability of molecules by studying the energy Levels of their frontier molecular orbitals. In this study, the molecular geometry of all the synthesized quinoline derivatives 6a–6z and 6aa–6aw was successfully optimized, resulting in local minima for these compounds. The energy gap (ΔE) between the HOMO and LUMO determines chemical reactivity and kinetic stability. A large ΔE indicates low reactivity and high stability, whereas a smaller gap promotes electronic charge transfer, making the molecule more polarized and reactive, also known as a “soft” molecule. A high ΔE indicates a “hard” molecule with lower reactivity and greater stability. Fig. 4 shows the frontier diagram and calculated energy gaps for compounds 6a, 6e, 6n, 6q, 6t, 6ab, 6al, 6aq, 6ar, and 6aw: 3.720, 3.756, 3.597, 3.382, 3.640, 3.658, 3.938, 3.793, 3.760, and 1.878 eV, respectively. In the case of HOMO, while the charge density for 6a and 6ab is accumulated in the quinoline ring, amide group and to a lesser extent on the aryl ring at 4th position, for 6e and 6al, the charge density is accumulated in the quinoline group along with the aryl ring also. However, in the case of LUMO, the charge densities for 6a, 6ab,6e and 6al are spread out only on the quinoline ring. In the LUMO the charge density for 6n is accumulated in the quinoline moiety but in the case of 6a and 6ab LUMO, charge density is accumulated in the quinoline moiety and also on the carbonyl group at the 3rd position to a lesser extent. For 6q the HOMO revealed that the charge density is accumulated in the quinoline moiety and amide group but in the LUMO the charge density accumulated on the amide group and substituted pyridine ring with Cl group because charge density is spread from the quinoline through the amide bond towards the pyridine ring. For 6t the HOMO illustrated that the charge density is accumulated on the amide, aryl ring since aryl carries electron withdrawing –NH2 while its LUMO shows that the charge density accumulated on the quinoline ring. In the case of 6y and 6aw, the HOMO shows that the charge density is accumulated on amide and diphenyl amine moiety also while their LUMO indicates that charge density accumulated on the quinoline ring itself. The HOMO of 6aq shows that the charge density is accumulated on amide, substituted aryl ring and also on quinoline ring to a lesser extent; the LUMO shows that the charge density accumulated on quinoline ring only. HOMO–LUMO visualizations and energy values for 6a–6z and 6aa–6aw are given in the ESI in Fig. S7.1–S7.49 † (FMO diagrams) and Table 2 (calculation), respectively. Excitation energy is the energy required to move an electron from its ground state to an excited state. Excitation energies are often calculated in the context of DFT calculations to understand electronic transitions, optical absorption spectra, and other electron-related phenomena. Molecules with smaller energy gaps are more easily “activated” and can readily participate in chemical reactions. The reactivity of molecules depends on their energy gap. Molecules with a smaller energy gap require less energy to cross the energy barrier and are therefore more reactive than those with a larger energy gap.The comparison of energy gaps in Table 2 indicates that electron-donating functional groups, including –NH2, –OH, 2-OMe, –CH3, pyridine present in various positions on the molecules such as 6t (3.640 eV), 6v (3.402 eV), 6s (3.809 eV), 6f (3.696 eV), 6ao (3.610 eV), 6ap (3.474 eV), 6aq (3.761 eV), and 6aw (3.395 eV), can effectively reduce the energy gap. These groups exert their influence by altering the electronic structure of the molecules, thereby increasing electron density and stabilizing energy levels. Alternatively, electron-withdrawing groups such as the CN group in positions 6b (3.832 eV) and 6ac (3.842 eV), CF3 groups in positions 6c (3.940 eV) and 6ab (3.939), and NO2 groups in positions 6w (1.936 eV), 6x (1.928 eV), 6ar (1.879 eV), and 6as (1.842 eV), exert a notable decrease in the energy gap of the respective molecules. By withdrawing electrons from the phenyl ring, these groups effectively destabilize energy levels, leading to a significant reduction in the energy gap. Consequently, this decrease in the energy gap enhances the chemical reactivity of the molecules, rendering them more reactive in various chemical processes.
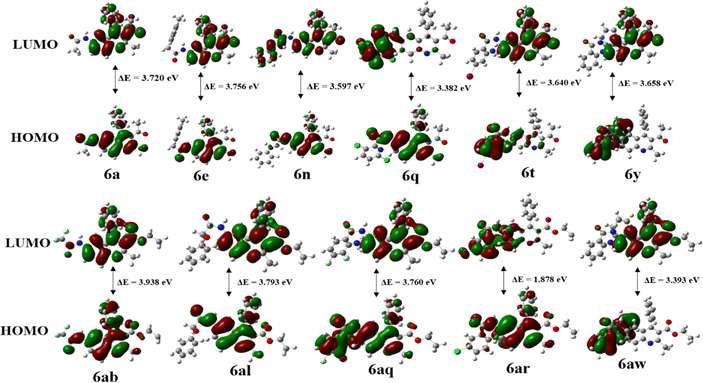 |
| | Fig. 4 Frontier Molecular Orbitals of compounds 6a, 6e, 6n, 6q, 6t, 6y, 6ab, 6al, 6aq, 6ar and 6aw. | |
Table 2 FMO parameters HOMO, LUMO and ΔE energies(eV) at the level B3LYP/6-31 G′(d,p)
| S No. |
Compound code |
HOMO |
LUMO |
ΔE |
S No. |
Code |
HOMO |
LUMO |
ΔE |
| 1 |
6a |
−5.954 |
−2.234 |
3.720 |
26 |
6z |
−5.597 |
−1.939 |
3.658 |
| 2 |
6b |
−6.173 |
−2.341 |
3.832 |
27 |
6aa |
−5.856 |
−2.114 |
3.742 |
| 3 |
6c |
−6.317 |
−2.377 |
3.940 |
28 |
6ab |
−6.198 |
−2.259 |
3.939 |
| 4 |
6d |
−5.837 |
−2.084 |
3.753 |
29 |
6ac |
−6.067 |
−2.225 |
3.842 |
| 5 |
6e |
−5.818 |
−2.071 |
3.747 |
30 |
6ad |
−5.747 |
−1.961 |
3.786 |
| 6 |
6f |
−5.755 |
−2.059 |
3.696 |
31 |
6ae |
−5.736 |
−1.968 |
3.768 |
| 7 |
6g |
−5.893 |
−2.159 |
3.734 |
32 |
6af |
−5.682 |
−1.977 |
3.705 |
| 8 |
6h |
−5.893 |
−2.063 |
3.830 |
33 |
6ag |
−5.629 |
−1.823 |
3.806 |
| 9 |
6i |
−5.91 |
−2.114 |
3.796 |
34 |
6ah |
−5.639 |
−1.801 |
3.838 |
| 10 |
6j |
−5.901 |
−2.106 |
3.795 |
35 |
6ai |
−5.806 |
−1.991 |
3.815 |
| 11 |
6k |
−5.903 |
−2.108 |
3.795 |
36 |
6aj |
−5.782 |
−1.967 |
3.815 |
| 12 |
6l |
−5.964 |
−2.191 |
3.773 |
37 |
6ak |
−5.798 |
−1.985 |
3.813 |
| 13 |
6m |
−5.912 |
−2.156 |
3.756 |
38 |
6al |
−5.866 |
−2.072 |
3.794 |
| 14 |
6n |
−5.756 |
−2.159 |
3.597 |
39 |
6am |
−5.817 |
−2.039 |
3.778 |
| 15 |
6o |
−5.702 |
−2.122 |
3.580 |
40 |
6an |
−5.669 |
−2.071 |
3.598 |
| 16 |
6p |
−6.211 |
−2.603 |
3.608 |
41 |
6ao |
−5.494 |
−1.884 |
3.610 |
| 17 |
6q |
−5.794 |
−2.417 |
3.377 |
42 |
6ap |
−5.623 |
−2.149 |
3.474 |
| 18 |
6r |
−6.065 |
−2.315 |
3.750 |
43 |
6aq |
−5.925 |
−2.164 |
3.761 |
| 19 |
6s |
−6.001 |
−2.192 |
3.809 |
44 |
6ar |
−5.701 |
−3.822 |
1.879 |
| 20 |
6t |
−5.772 |
−2.132 |
3.640 |
45 |
6as |
−5.563 |
−3.721 |
1.842 |
| 21 |
6u |
−5.851 |
−2.177 |
3.674 |
46 |
6at |
−5.761 |
−2.056 |
3.705 |
| 22 |
6v |
−5.67 |
−2.268 |
3.402 |
47 |
6au |
−5.81 |
−2.415 |
3.395 |
| 23 |
6w |
−5.844 |
−3.908 |
1.936 |
48 |
6av |
−6.107 |
−2.551 |
3.556 |
| 24 |
6x |
−5.779 |
−3.851 |
1.928 |
49 |
6aw |
−5.341 |
−1.946 |
3.395 |
| 25 |
6y |
−5.415 |
−2.069 |
3.346 |
|
|
|
|
|
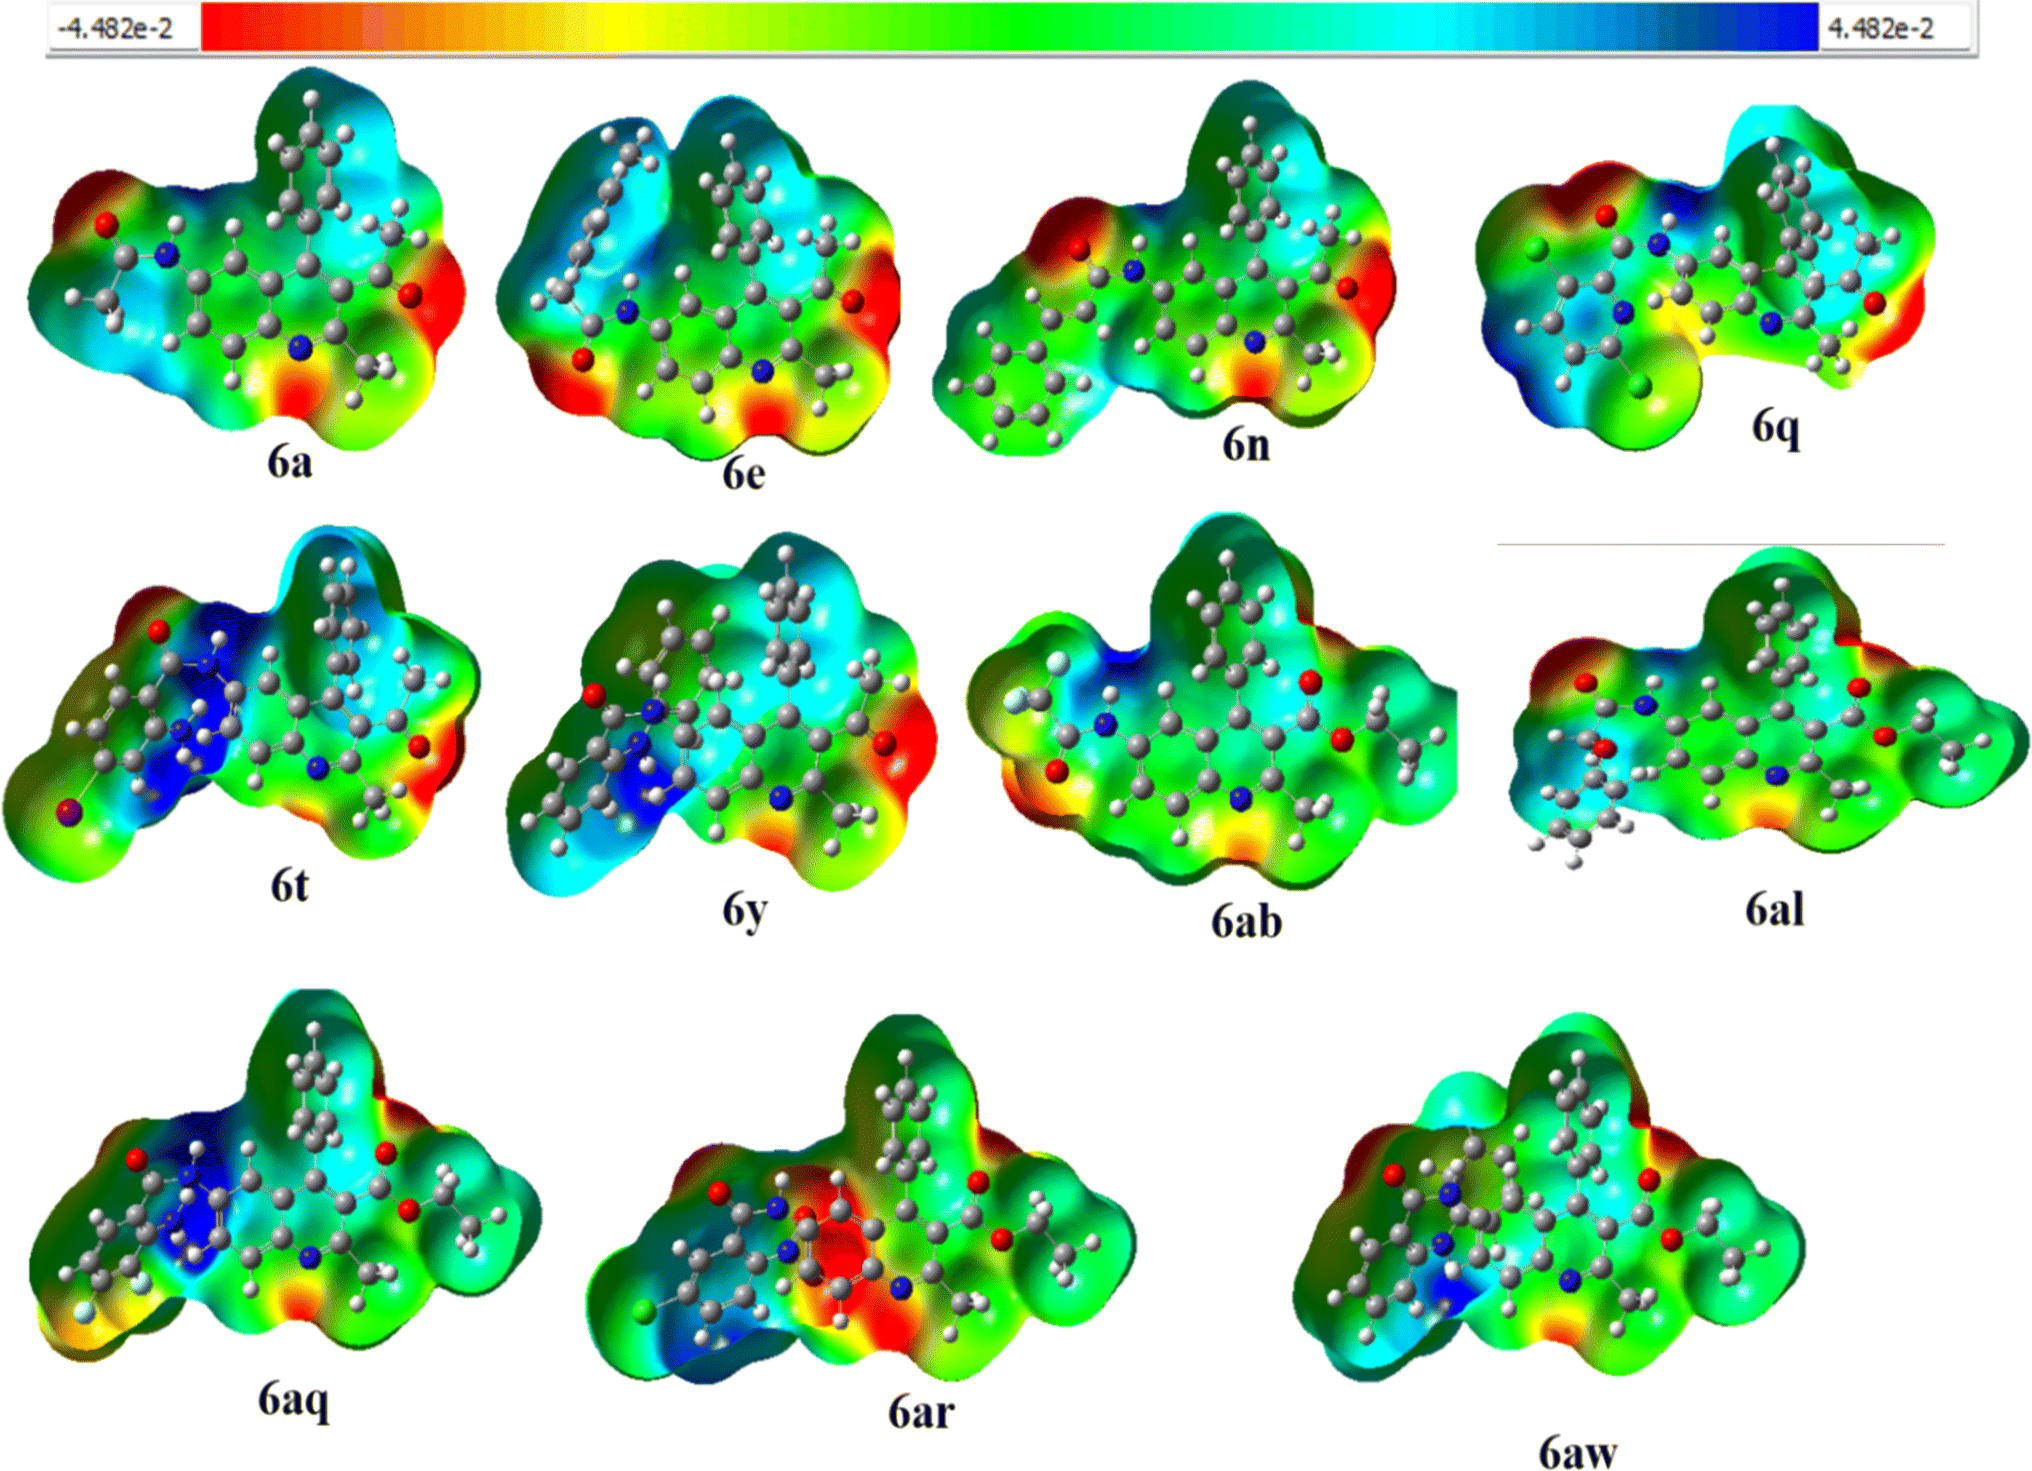
2.4 Molecular electrostatic potential (MEP)
Molecular Electrostatic Potential (MEP) is a useful tool for studying molecular interactions and reactions, especially in biological contexts where electron-rich sites such as oxygen or nitrogen act as donors and hydrogen atoms or groups act as acceptors in hydrogen bonding. MEP images provide insights into electron density distribution, which helps in identifying favorable interaction sites. By recognizing electron-rich or electron-deficient regions, MEP can predict reactivity patterns, guiding research and development efforts in chemistry by shedding light on the mechanics of electrophilic and nucleophilic reactions. This facilitates rational drug design and synthetic strategies.77–79 MEP surface analysis predicts molecular reactivity by mapping electron-rich (red) and electron-poor (blue) regions and helps identify sites prone to electrophilic or nucleophilic attack, crucial for optimizing chemical reactions and molecular properties design.80 The MEP diagram is a valuable tool for understanding the charge distribution within the molecule. It allows us to predict the electrophilic (electron-deficient) and nucleophilic (electron-rich) active sites within the complex based on the electron density.81 The MEP analysis of all the synthesized compounds 6a–6z and 6aa–6aw is shown in the ESI Fig. S8.† In Fig. 5, the electron density for compounds 6a, 6e, 6n, 6q, 6t, 6y, 6ab, 6al, 6aq, 6ar, and 6aw has been visually represented where it is colour-coded to provide a scale. Among the FMO distribution pattern of all the compounds 6a–6z and 6aa–6aw, it was observed that compound 6c had a higher energy gap, which could be due to the strong dipole–dipole movements and van der Waals forces of dispersion that nitriles exhibit. The electronic chemical potential is defined as the variation in energy of a system to the number of electrons (N) at a constant external potential. It is a measure of the system's ability to exchange electron density with the surrounding environment in its lowest energy state.82,83 Some reagents involved in acid amine cross-coupling reactions have their electronic chemical potential listed in the ESI† (Table 2), along with some electron-donating and electron-withdrawing groups (μ) in Table S2.† Although reagents such as compound 6w with a value of 4.87 eV act as strong electron-donating molecules, as the electron-withdrawing character of the substituent present increases, the electronic chemical potential of the corresponding quinoline derivative decreases this results in an increase in the polar character of 6t, 6v, 6ap, 6aq, and 6ao (6w < 6x < 6ar < 6as). Compounds 6i, 6h, 6ai, and 6j have the same molecular formula, but the position of Cl is distinct, resulting in a slight change in the Stokes shift and energy (ΔE) difference. In compounds 6j, 6k, 6aj, and 6ak, the bromine substituent is either in the meta or para position, but their shifts are similar.
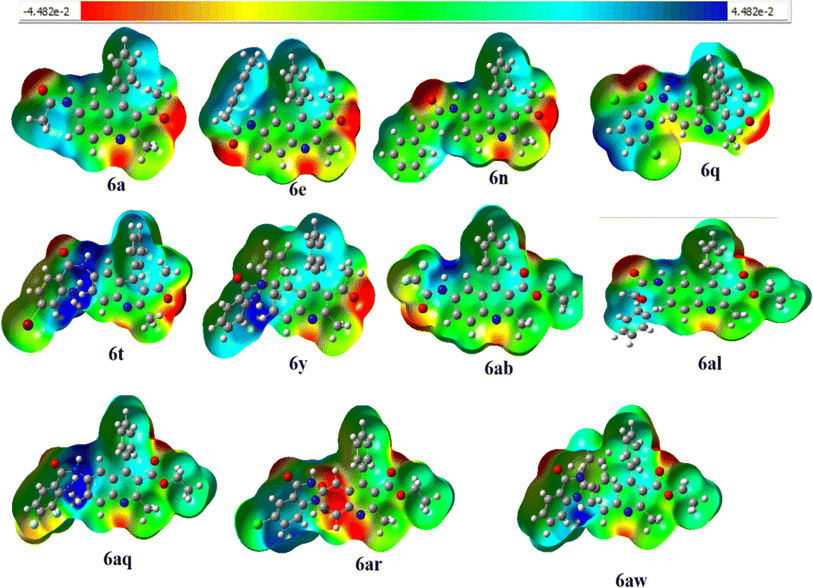 |
| | Fig. 5 Molecular Electrostatic Potential (MEP) surface of compound6a, 6e, 6n, 6q, 6t, 6y, 6ab, 6al, 6aq, 6ar, 6aw. | |
2.5 TD-DFT (UV-vis)
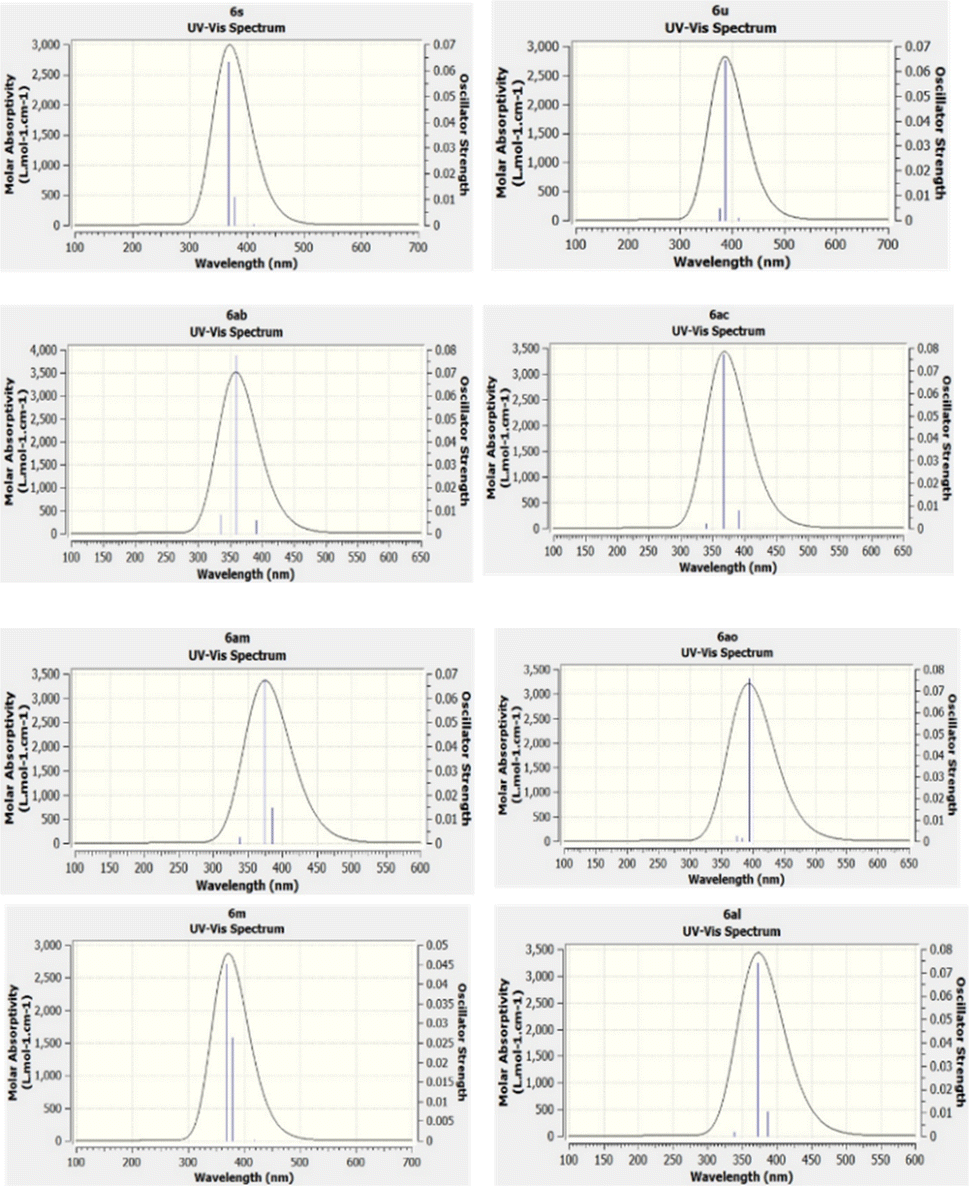
Density functional theory (DFT) is a quantum mechanical approach that posits that all system properties stem from charge density functions. This framework facilitates precise calculations elucidating a compound's structure, energy, and molecular attributes. Time-dependent density functional theory (TD-DFT) emerges as a result of leveraging DFT for excited states, enabling the computation of electronic spectra for absorption.84,85 TD-DFT empowers investigations into various processes involving excited states, offering insights into phenomena such as molecular transitions and optical properties. This methodological synergy between DFT and TD-DFT furnishes a robust toolkit for comprehensively analyzing molecular behaviour, thereby advancing our understanding of chemical reactivity, spectroscopy, and materials science applications. TD-DFT is a prevalent computational method used to predict absorption spectra in molecules. UV-vis spectra were calculated using the TD-DFT approach employing the B3LYP functional and 6-31G’ (d,p) basis sets. These calculations furnish comprehensive data enabling the elucidation of theoretical UV-vis absorption profiles, aiding in the comprehension of molecular absorptivity data. By leveraging GaussView 5, pertinent information about UV-vis spectra was extracted and depicted in Fig. 6. The TD-DFT-derived UV-vis prediction results exhibit a satisfactory correspondence with experimental data, as evidenced by the comparison presented in Table 3. This convergence underscores the utility and reliability of the TD-DFT methodology in simulating molecular absorption spectra, thereby facilitating a deeper understanding of molecular properties and behaviour.86 Our study analyzed the UV-vis and emission spectra of 31 compounds. We then focused on eight compounds that span a range of low and high wavelengths, as shown in Table 3. Among these eight compounds, compound 6am showed the smallest variance, with a theoretical λmax of 338.23 nm and an experimental λmax of 338.18 nm, resulting in a marginal difference of 0.05 nm. Similarly, compound 6al exhibited a modest difference, with a theoretical λmax of 338.23 nm and an experimental λmax of 337.72 nm, indicating a variance of 0.51 nm. Compound 6ac demonstrated a minimal difference, with theoretical and experimental λmax values of 339.96 nm and 339.11 nm, respectively, producing a disparity of 0.85 nm. On the other hand, compound 6m exhibited the most significant difference, with a theoretical λmax of 368.50 nm and an experimental λmax of 337.12 nm, resulting in a notable discrepancy of 31.37 nm. Compounds 6u and 6s showed comparable results, with theoretical λmax values of 368.63 nm and 368.83 nm, and experimental λmax values of 352.63 nm and 352.83 nm, respectively, indicating differences of approximately 15.87 nm and 16.2 nm. Compound 6ab and 6ao also showed variances, with differences of 13.14 nm and 3.85 nm, respectively, between theoretical and experimental λmax values. These findings highlight the importance of meticulous analysis to reconcile theoretical predictions with experimental observations in spectral studies. The theoretical and experimental UV-vis spectra and λmax,oscillation strength f, energy, of all 31 compounds are shown in ESI Fig. S9 and Table S2,† respectively. The UV-vis spectra data for the compounds studied revealed a notable correlation between wavelength and energy gap, as evidenced by the generated graphs. It was observed that as the wavelength approached the visible light range (around 400 nm), the energy gap decreased. For instance, compound 6al exhibited a calculated energy gap of 3.6604 eV and a λmax of 337.72 nm, consistent with its UV absorption profile, which indicates activity within the UVC range (180–360 nm). Conversely, compound 6ab, as displayed an energy gap of 3.1748 eV and a λmax of 372.65 nm, suggesting its primary UV absorption occurs within the UVA range (320–400 nm). This correlation underscores the relationship between molecular structure and spectral behaviour.
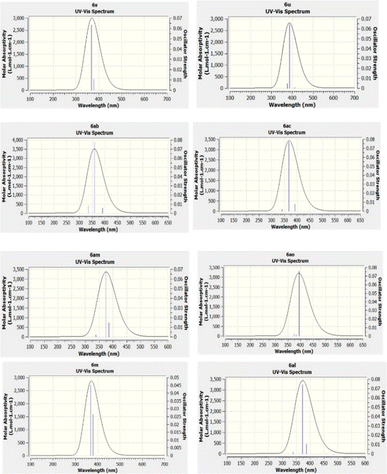 |
| | Fig. 6 Theoretical UV-vis spectra of compounds by TD-DFT at level using the B3LYP/6-31G′(d,p). Blue lines demonstrate the main electronic transitions (singlet state). | |
Table 3 Theoretical λmax, experimental λmax, oscillation strength and energy (eV)
| Sr. No. |
Experimental λmax nm |
Theoretical λmax nm |
Oscillation strength, f |
Energy eV |
| 1 |
6ab (372.65) |
359.51 |
0.0777 |
3.4486 |
| 2 |
6ac (339.11) |
339.97 |
0.002 |
3.6469 |
| 3 |
6al (337.72) |
338.72 |
0.0018 |
3.6604 |
| 4 |
6am(338.18) |
338.24 |
0.0023 |
3.6656 |
| 5 |
6ao (370.32) |
374.17 |
0.0023 |
3.3135 |
| 6 |
6m (337.12) |
368.49 |
0.042 |
3.3647 |
| 7 |
6s (352.83) |
368.85 |
0.0632 |
3.3614 |
| 8 |
6u (352.63) |
375.31 |
0.0045 |
3.3035 |
The variation between simulated and experimental spectral data, with respect to oscillator strength and energy is given in Table 3. The spectral analysis revealed distinct medium energy band n–π* transitions for various compounds: 6ab exhibited absorption peaks at 390.51 nm, 359.51 nm, and 334.90 nm; 6ac displayed transitions at 391.08 nm, 367.69 nm, and 339.97 nm; for compound 6al absorption bands at 387.18 nm, 372.38 nm, and 338.72 nm; 6am absorption peaks at 385.51 nm, 373.92 nm, and 338.24 nm; 6ao presented absorptions peaks at 394.79 nm, 383.47 nm, and 374.17 nm; 6m demonstrated transitions at 418.60 nm, 378.81 nm, and 368.49 nm; for compound 6s absorptions peaks at 412.70 nm, 379.63 nm, and 368.85 nm; and 6u exhibited peaks at 411.77 nm, 387.23 nm, and 375.31 nm. These findings elucidate the distinct electronic transitions within the compounds. Additionally, compounds 6ab, 6ac, 6al, 6am, 6ao, 6m, 6s, and 6u notably exhibited major contributions above 50% in their respective spectra, indicative of their significant roles in the observed electronic transitions. All 31 compounds calculated (three excited state) transition state from that selected major electronic transition contribution shown in Table S3† and FMO diagram density surface of the selected major contributions of compounds frontier molecular orbitals involved in electronic transitions of at Basic set level of B3LYP/6-31 + G′(d,p) using iso-surface value of 0.02 au shown inTable.S4.† Lower energy (LE) and higher energy (HE) bands, that is, S0 → S1 and S0 → S2 transitions, indicating the ICT process.
The corresponding major distribution for 6ab is HOMO-1 → LUMO (86%), HOMO-2 → LUMO (76%), HOMO → LUMO (68%), for Compound 6ac HOMO-1 → LUMO (89%), HOMO-2 → LUMO (85%), HOMO → LUMO (80%), Compound 6al is HOMO-3 → LUMO (90%), HOMO-1 → LUMO (89%), HOMO → LUMO (85%), Compound 6am is HOMO-2 → LUMO (90%), HOMO-1 → LUMO (86%), HOMO → LUMO (82%), for compound 6ao is HOMO-1 → LUMO (96%), HOMO → LUMO (93%), HOMO-2 → LUMO (91%), for compound 6m is HOMO-1 → LUMO (82%), HOMO → LUMO (55%), HOMO-2 → LUMO (53%), for compound 6s is HOMO → LUMO (78%), HOMO-1 → LUMO (61%), HOMO-2 → LUMO (57%), for compound 6u is HOMO → LUMO (89%), HOMO-2 → LUMO (62%), HOMO-3 → LUMO (59%) transitions for compounds, which reveals the donor–π–acceptor charge transfer character of the compounds.
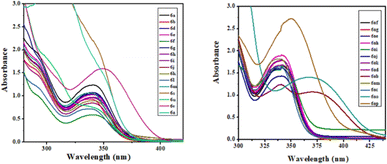
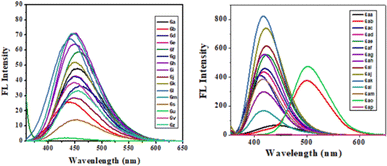
2.6. Absorption and emission
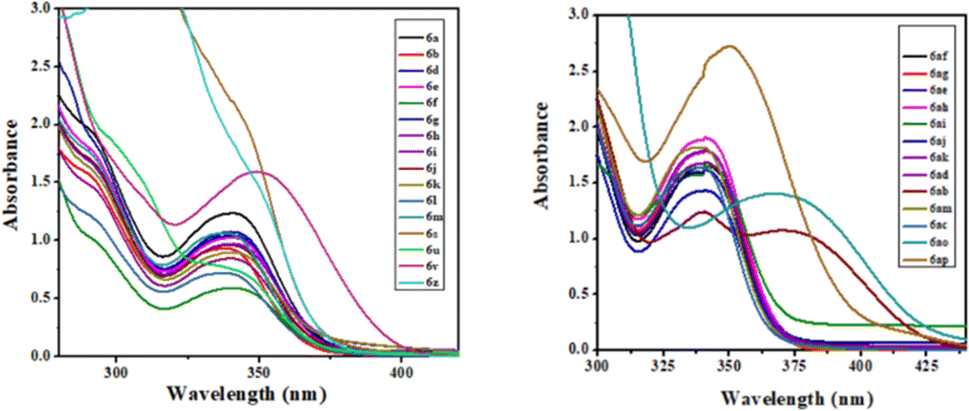
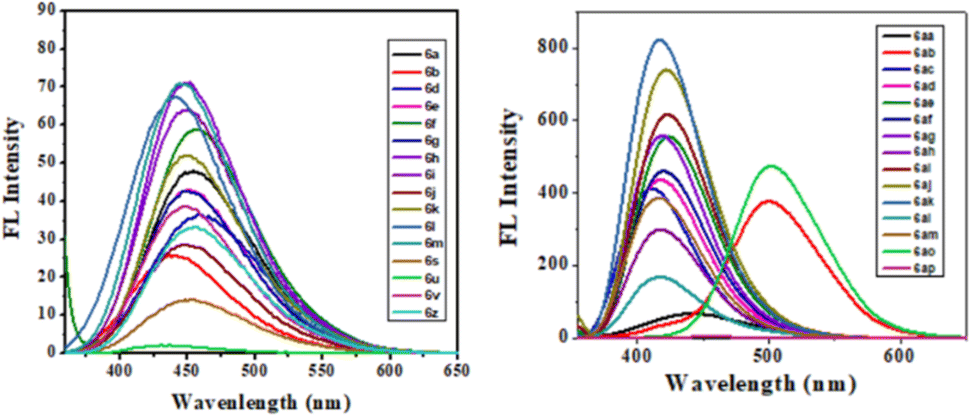
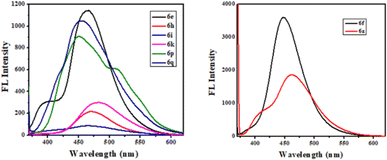
The photophysical study was conducted in methanol absorbance and emission spectra were recorded at room temperature. Observed UV-vis range 305–37 nm and emission range 430–502 nm shown in Table 4. It was observed that the intensity was higher when the ester group was placed at the 3rd position of quinoline compared to the keto function. The fluorescence intensity properties of ketones and esters are complex and dependent on various factors. While ketones can exhibit fluorescence, their intensity may be reduced by electron-donating or electron-accepting groups. On the other hand, ketones with extended conjugation, such as aromatic ketones, often display increased fluorescence due to electron delocalization. The fluorescence intensity of esters can be notably affected by solvent polarity, with nonpolar solvents sometimes enhancing their fluorescence their intensity may be reduced by electron-donating or electron-accepting groups. On the other hand, ketones with extended conjugation, such as aromatic ketones, often display increased fluorescence due to electron delocalization. The fluorescence intensity of esters can be notably affected by solvent polarity, with nonpolar solvents sometimes enhancing their fluorescence. The presence of specific substituents and the degree of esterification also play a role in determining the fluorescence properties of these compounds, with conjugation and rigidity potentially resulting in stronger fluorescence. Additionally, the ability of esters to undergo intramolecular rotation can impact their fluorescence characteristics. The unique fluorescence behavior of specific ketones and esters is further contributed by individual molecular structures, environmental conditions, and the choice of excitation wavelength. Table 4 presents the photophysical characteristics of the quinoline derivatives that were investigated. It was found that all the derivatives found to exhibit the unique fluorescence and the conversion of amine into amide at the C6 position of quinoline moiety significantly-affected the absorption (Fig. 7) and emission (Fig. 8) in solution (and some of compounds such as 6ae, 6af, 6ag, 6ah, 6ai in solid state also Fig. 9). The Fig. 8 has been recorded as unnormalized spectra. The individual emission spectra for all the compounds in solution are available in the ESI.† The quinoline fluorophore 6ab found to exhibit the absorption maximum at higher wave length (372.65 nm). The absorption, emission, Stokes shift molar molar, extinction coefficient and quantum yield for all the derivatives which are exhibiting the fluorescence can be found in Table 4. A larger Stokes shift refers to a greater separation between the wavelengths of excitation and emission. This increased separation reduces overlap between the spectra, leading to more accurate and sensitive fluorescence measurements. It results in better discrimination between the excitation light and the fluorescence signal, which minimizes interference from the background and improves the signal-to-noise ratio. Compounds with high Stokes shifts are valuable for various applications, including fluorescence microscopy, bio-sensing, and fluorescence-based assays. They offer greater flexibility in experimental design and enable the detection of fluorescent signals in complex biological or environmental samples where background fluorescence or scattering is a concern.87 The compounds 6z, and 6d exhibited excellent Stokes shifts of 1.0411 × 10⁻⁴ and 0.7766 × 10⁻⁴ respectively in methanol solution, while the Stokes shift of compound 6ac is comparatively low at 0.5168 × 10⁻⁴ in the same solution. Some compounds were recorded in solid-state spectra, which showed different absorption and emission wavelengths in the spectra, as well as Stokes shift. The solid-state Stokes shift values were 0.6226 × 10⁻⁴ for 6e, 0.5226 × 10⁻⁴ for 6f, and 0.7587 × 10⁻⁴ for 6h. Photo-physical data of synthesized derivatives, including emission, absorption, and Stokes shift, can be found in Table 4. All compounds exhibited favorable molar extinction coefficients (ε), with values ranging from 3.0205 × 10⁴ M−1 cm−1 to 9.5080 × 10⁴ M−1 cm−1 across entries 1–31 in Table 4. Particularly noteworthy were quinoline derivatives showcasing enhanced aromaticity, notably those bearing ester groups at the third position of quinoline core, in combination with halide (Cl) and amine functionalities, which displayed the highest molar extinction coefficients (Table 4, entries 25 and 30). Assessment of quantum efficiencies was carried out by comparing them to the established quantum efficiencies of quinine sulfate in a 0.5 M H2SO4 solution (Φ = 0.54) at an excitation wavelength of 340 nm. All the derivatives displayed a noteworthy level of quantum yield, as detailed in (Table 4, entries 1 to 31). The quantum efficiency of the quinoline framework was found to be dependent on the specific electronic characteristics exhibited by the aryl substituents. It was observed that the inclusion of Ar–CH2 ring substituents significantly enhanced the quantum yield, in contrast, the presence of Ar substituents was found to have a suppressive impact on the quantum yield, as indicated in Table 4.
Table 4 Photophysical data of compounds absorption, emission, stokes shift, molar extinction coefficient and quantum yield (the excitation wave length is 350 nm with 2 × 10⁻⁵ M concentrations)
| Entry |
Compound code |
λAbsorption (nm) |
λEmission (nm) |
Stokes shift Δ × 104 |
Molar extinction coefficient × 104 |
Quantum yield (Φ) |
| 1 |
6a |
341.12 |
455.19 |
0.7347 |
|
|
| 2 |
6b |
338.22 |
440.15 |
0.6858 |
6.2125 |
0.0020 |
| 3 |
6d |
340.38 |
462.33 |
0.7766 |
4.6795 |
0.0014 |
| 4 |
6e |
342.76 |
452.81 |
0.7116 |
5.1485 |
0.0019 |
| 5 |
6f |
341.45 |
457.39 |
0.7444 |
5.0510 |
0.0022 |
| 6 |
6g |
343.51 |
450.43 |
0.6932 |
3.0205 |
0.0057 |
| 7 |
6h |
340.28 |
451.36 |
0.7239 |
5.3315 |
0.0020 |
| 8 |
6i |
344.68 |
448.98 |
0.6748 |
4.8225 |
0.0037 |
| 9 |
6j |
341.09 |
450.16 |
0.7103 |
4.2445 |
0.0038 |
| 10 |
6k |
340.29 |
450.38 |
0.7189 |
4.8250 |
0.0015 |
| 11 |
6l |
338.87 |
441.77 |
0.691 |
4.4505 |
0.0030 |
| 12 |
6m |
337.12 |
446.06 |
0.7252 |
3.6155 |
0.0050 |
| 13 |
6s |
352.83 |
452.8 |
0.6286 |
5.3030 |
0.0035 |
| 14 |
6u |
352.63 |
434.54 |
0.5368 |
6.2180 |
0.0005 |
| 15 |
6v |
347.33 |
450.28 |
0.5959 |
3.6155 |
0.00012 |
| 16 |
6z |
309.18 |
457.29 |
1.0411 |
7.9805 |
0.0012 |
| 17 |
6aa |
338.87 |
442.94 |
0.6961 |
6.4730 |
0.0013 |
| 18 |
6ab |
372.65 |
501.58 |
0.6921 |
6.5455 |
0.0021 |
| 19 |
6ac |
339.11 |
411.03 |
0.5168 |
5.3670 |
0.0171 |
| 20 |
6ad |
342.78 |
417.73 |
0.5259 |
8.2825 |
0.0096 |
| 21 |
6ae |
341.95 |
423.86 |
0.5685 |
8.3715 |
0.0103 |
| 22 |
6af |
340.42 |
420.21 |
0.5602 |
7.1585 |
0.0156 |
| 23 |
6ag |
342.67 |
420.73 |
0.543 |
8.3370 |
0.0110 |
| 24 |
6ah |
340.22 |
418.34 |
0.5488 |
8.8605 |
0.0124 |
| 25 |
6ai |
340.43 |
423.52 |
0.5771 |
9.5080 |
0.0062 |
| 26 |
6aj |
339.17 |
422.27 |
0.5802 |
8.3370 |
0.0150 |
| 27 |
6ak |
340.54 |
417.61 |
0.5431 |
7.9785 |
0.0188 |
| 28 |
6al |
337.72 |
416.98 |
0.5635 |
9.0055 |
0.0179 |
| 29 |
6am |
338.16 |
416.04 |
0.5547 |
8.1260 |
0.0053 |
| 30 |
6ao |
370.32 |
502.67 |
0.7107 |
9.1775 |
0.0082 |
| 31 |
6ap |
350.27 |
454.16 |
0.6545 |
6.9935 |
0.0154 |
 |
| | Fig. 7 UV-vis spectra of compounds in MeOH solution. | |
 |
| | Fig. 8 FL spectra of compounds in MeOH solution. | |
 |
| | Fig. 9 FL spectra of compounds in solid state. | |
3 Experimental
3.1. General method
The experiments were carried out using round bottom flasks, and all chemical materials and solvents were obtained from commercial sources. The preparation of 1-(6-amino-2-methyl-4-phenylquinolin-3-yl)-ethan-1-one was done following previously reported protocols. The 1H and 13C NMR spectra were recorded using a Bruker Avance 400 spectrometer and referenced to the residual solvent signal CDCl3: (7.26) for 1H and (77.16) for 13C NMR; dimethyl sulfoxide-d6 (2.50) for 1H and (39.50) for 13C. The chemical shifts (δ) are given in ppm, and coupling constants (J) were measured in Hz. The abbreviations used were: s-singlet, d-doublet, dd-doublet of the doublet, t-triplet, m (multiple), and br-broad. HR ESI-MS values were obtained using Xeo G2-XS QTof (waters) and given in m/z. Absorption was recorded using a JASCO V-670 spectrometer. Steady-state fluorescence spectra were recorded on the Hitachi F-7000 FL spectrofluorophotometer by exciting at the respective absorption maxima. Column chromatography was performed using silica gel (100–200 mesh) packed in glass columns. Analytical TLC was conducted on Macherey-Nagel 60 F245 aluminium-backed silica gel plates.
The Stoke's shift was calculated using the following equation.
| |
Δ![[small nu, Greek, macron]](https://www.rsc.org/images/entities/i_char_e0ce.gif) = 107 / λmax (absorption) – 107/λmax (emission) = 107 / λmax (absorption) – 107/λmax (emission)
| (1) |
Quantum yield calculated the following equation.
| | |
Φf = ΦR·AR/A·I/IR·nR2/n2
| (2) |
where
Φ is the quantum yield,
I is the integrated intensity,
A is the absorbance, and
n is the refractive index. The subscript R refers to quinine sulphate. The molar extinction coefficient (
ε) was calculated using Beer–Lambert law
A =
εcl. The molar extinction coefficient is defined as the measure of absorbance per unit concentration and path length. Mathematically, it is expressed as
ε =
A/(
c ×
l). where
A is the absorbance,
c is the concentration of the absorbing species, and
l is the path length of the light through the sample.
3.2. Synthesis of title compounds (acid amine cross-coupling reaction) 6a–6z and 6aa–6aw. General procedure
To perform the reaction, take 1-(6-amino-2-methyl-4-phenylquinolin-3-yl) ethan-1-one (300–500 mg), substituted carboxylic acids (1.5 to 5.0 equivalents), HATU (2.0 to 2.5 equivalents), and DIPEA (2.5 equivalents) in a 50 mL round bottom flask containing 10 mL of DMF of analytical grade. Stir the mixture at room temperature under nitrogen gas for 6–12 hours. Once the reaction is complete, add the reaction mixture to cold water and extract with ethyl acetate (2 × 25 mL). Wash the organic layer with brine water (25 mL). Concentrate the organic layer under high vacuum to obtain crude compound. Purify the crude compound using column chromatography to obtain pure products 6a–6z and 6aa–6aw. You can find all reaction procedures and identification spectral data in the ESI.†
4 Conclusion
In Conclusion through the implementation of an acid-amine coupling methodology, a total of 49 new quinoline derivatives have been synthesized. Further modifications were carried out to introduce different substituents at the C6 position of the quinoline scaffold, allowing for the customization of their DFT investigations and photo-physical characteristics. We compared theoretical λmax value with experimental λmax value and got very less difference in compounds 6am. Currently, ongoing research is focused on conducting a comprehensive investigation into this newly discovered class of quinoline compounds.
Author contributions
The work has been designed and executed by the corresponding author Vijayaparthasarathi Vijayakumar and target molecules are synthesized, characterized and the studies are carried out by the first author Nagesh Dhanaji Chavan.
Conflicts of interest
The authors declare no conflicts of interest.
Acknowledgements
Authors gratefully acknowledges and thanking the Vellore Institute of Technology, Vellore for providing fellowship, infrastructure and characterization facilities to carry out the work. Authors thank full VIT management for seed grant (Grant number SG20230086). Authors thank Ms V Hemalatha for her helpful discussion regarding photophysical and DFT studies and also extending our heartfelt thanks to Dr S Sarveswari for her help and guidance.
References
-
(a) K. B. Patel and P. Kumari, J. Mol. Struct., 2022, 15, 1268 Search PubMed;
(b) N. Sun, R. L. Du, Y. Y. Zheng, B. H. Huang, Q. Guo, R. f. Zhang, K. Y. Wong and Y. Lu, Eur. J. Med. Chem., 2017, 135, 1–11 CrossRef CAS PubMed.
- O. A. Olateju, C. o. Babalola, O. O. Olubiyi, O. A. Kotila, D. A. Kwasi and A. O. Oaikhena, Front. Microbiol., 2021, 12, 556550 CrossRef PubMed.
-
(a) K. Govindarao, N. Srinivasan, R. Suresh, R. K. Raheja, S. Annadurai, R. R. Bhandare and A. B. Shaik, J. Saudi Chem. Soc., 2022, 26(3), 101471 CrossRef CAS;
(b) A. Shi, T. A. Nguyen, S. K. Battina, S. Rana, D. J. Takemoto, P. K. Chiang and D. H. Hua, Bioorg. Med. Chem. Lett., 2008, 18(11), 3364–3368 CrossRef CAS PubMed.
- A. Kania, W. Tejchman, A. M. Pawlak, K. Mokrzyński, B. Różanowski, B. M. Musielak and M. Greczek-Stachura, Molecules, 2022, 27(3), 1069 CrossRef CAS PubMed.
- K. L. Ji, W. Liu, W. H. Yin, J. Y. Li and J. M. Yue, Org. Biomol. Chem., 2022, 20(20), 4176–4182 RSC.
- L. Savegnago, A. I. Vieira, N. Seus, B. S. Goldani, M. R. Castro, E. J. Lenardão and D. Alves, Tetrahedron Lett., 2013, 54(1), 40–44 CrossRef CAS.
- R. S. Keri and S. A. Patil, Biomed. Pharmacother., 2014, 68(8), 1161–1175 CrossRef CAS PubMed.
- Y. Q. Hu, C. Gao, S. Zhang, L. Xu, Z. Xu, L. S. Feng, X. Wu and F. Zhao, Eur. J. Med. Chem., 2017, 139, 22–47 CrossRef CAS PubMed.
- A. Dorababu, ChemistrySelect, 2021, 6(9), 2164–2177 CrossRef CAS.
- L. J. Kumar, Y. Suresh, R. Rajasekaran, S. R. Reddy and V. Vijayakumar, J. Iran. Chem. Soc., 2019, 16, 1071–1080 CrossRef CAS.
- L. Jyothish Kumar and V. Vijayakumar, Res. Chem. Intermed., 2017,(43), 5691–5705 CrossRef CAS.
- B. Mahjour, Y. Shen and W. Liu, Nature, 2020,(580), 71–75 CrossRef CAS PubMed.
- R. Dabhi, U. Patel, V. Rathod, S. Shah and J. Maru, Curr. Chem. Lett., 2023, 12(1), 133–140 CrossRef.
- R. Jasinski, O. M. Demchuk and D. Babyuk, J. Chem., 2017, 2017, 3617527 Search PubMed.
- A. Łapczuk-Krygier, A. Kącka-Zych and K. Kula, Chem. Lett., 2019,(8), 13–38 Search PubMed.
- R. Jasinski and E. Dresler, Organics, 2020,(1), 49–69 CrossRef.
- J. C. Sheehan and G. P. Hess, J. Am. Chem. Soc., 1955, 77(4), 1067–1068 CrossRef CAS.
- W. Konig and R. Geiger, Chem. Ber., 1970, 103(3), 788–798 CrossRef CAS PubMed.
- F. Albericio, J. M. Bofill, A. El-Faham and S. A. Kates, J. Org. Chem., 1998, 63(26), 9678–9683 CrossRef CAS.
- M. Zhang, P. Vedantham, D. L. Flynn and P. R. Hanson, J. Org. Chem., 2004, 69(24), 8340–8344 CrossRef CAS PubMed.
- V. Bhatt, S. D. Samant and S. Pednekar, Lett. Org. Chem., 2017, 14(10), 764–768 CrossRef CAS.
- C. A. Montalbetti and V. Falque, Tetrahedron, 2005, 61(46), 10827–10852 CrossRef CAS.
- M. Fernández-Suárez and A. Y. Ting, Nat. Rev. Mol. Cell Biol., 2008, 9(12), 929–943 CrossRef PubMed.
- C. Y. Wu, J. J. Wei, D. H. Tian, Y. Feng, R. H. Miller and Y. M. Wang, J. Med. Chem., 2008, 51, 6682 CrossRef CAS PubMed.
- C. N. Wang, C. Y. Wu, J. Q. Zhu, R. H. Miller and Y. M. Wang, J. Med. Chem., 2011, 54, 2331 CrossRef CAS PubMed.
- R. L. Sheng, P. F. Wang, Y. H. Gao, Y. Wu, W. M. Liu, J. J. Ma, H. P. Li and S. K. Wu, Org. Lett., 2008, 10, 5015 CrossRef CAS PubMed.
- H. S. Jung, P. S. Kwon, J. W. Lee, J. I. Kim, C. S. Hong, J. W. Kim, S. H. Yan, J. Y. Lee, J. H. Lee, T. Joo and J. S. Kim, J. Am. Chem. Soc., 2009, 131, 2008–2012 CrossRef CAS PubMed.
- N. A. Owiti, Z. D. Nagel and B. P. Engelward, Trends Cancer, 2021, 7, 240–248 CrossRef CAS PubMed.
- N. R. Gassman and N. W. Holton, Curr. Opin. Biotechnol., 2019, 55, 30–35 CrossRef CAS PubMed.
- A. Zarkov, A. Vasilev, T. Deligeorgiev, S. Stoynov and M. Nedelcheva-Veleva, Mol. Imag., 2013, 12(2), 90–99 CrossRef CAS PubMed.
- J. Gebhard, L. Hirsch, C. Schwechheimer and H. A. Wagenknecht, Bioconjugate Chem., 2022, 33, 1634–1642 CrossRef CAS PubMed.
- P. J. Kolbeck, W. Vanderlinden, G. Gemmecker, C. Gebhardt, M. Lehmann, A. Lak, T. Nicolaus, T. Cordes and J. Lipfert, Nucleic Acids Res., 2021, 49, 5143–5158 CrossRef CAS PubMed.
- D. M. Kolpashchikov, Acc. Chem. Res., 2019, 52, 1949–1956 CrossRef CAS PubMed.
- E. A. Prasetyanto, H. S. Wasisto and D. Septiadi, Acta Biomater., 2022, 143, 39–51 CrossRef CAS PubMed.
- H. Freiser, Analyst, 1952, 77, 830–845 RSC.
- L. D. Lavis and R. T. Raines, ACS Chem. Biol., 2008, 3(3), 142–155 CrossRef CAS PubMed.
- T. S. Kaufman and E. A. Rúveda, Angew. Chem., Int. Ed., 2005, 44(6), 854–885 CrossRef CAS PubMed.
- Y. Laras, V. Hugues, Y. Chandrasekaran, M. Blanchard-Desce, F. C. Acher and N. J. Pietrancosta, J. Org. Chem., 2012, 77(18), 8294–8302 CrossRef CAS PubMed.
-
(a) C. Fahrni and T. O'Halloran, J. Am. Chem. Soc., 1999, 121, 11448–11458 CrossRef CAS;
(b) A. Nowakowski and D. Petering, Inorg. Chem., 2011, 50, 10124–10133 CrossRef CAS PubMed;
(c) W. Jeffrey, J. Meeusen, H. Tomasiewicz, A. Nowakowski and D. Petering, Inorg. Chem., 2011, 50, 7563–7573 CrossRef PubMed;
(d) K. Hanaoka, K. Kikuchi, H. Kojima, Y. Urano and T. Nagano, J. Am. Chem. Soc., 2004, 126(39), 12470–12476 CrossRef CAS PubMed;
(e) G. Li, D. Zhu, L. Xue and H. Jiang, Org. Lett., 2013, 15(19), 5020–5023 CrossRef CAS PubMed.
- W. Li, W. Lin, J. Wang and X. Guan, Org. Lett., 2013, 15(7), 1768–1771 CrossRef CAS PubMed.
- S. Bhagat, N. Sharma and T. S. Chundawat, J. Chem., 2012, 2013, 909217 Search PubMed.
- K. Rajalakshmi, S. Muthusamy, H. J. Lee, P. Kannan, D. Zhu, R. S. Lodi, M. Xie, J. Xie, J. W. Song and Y. Xu, Spectrochim. Acta, Part A, 2024, 304, 123282 CrossRef CAS PubMed.
- S. Wu, Q. Yan, Y. Wang, Y. Bian, D. Shi and H. Xu, Microchem. J., 2024, 201, 110597 CrossRef CAS.
- S. Che, L. Yin, M. Chen, F. Fan, A. Xu, C. Zhou, H. Fu and Y. She, Food Chem., 2023, 407, 135052 CrossRef CAS PubMed.
- S. Suguna, K. Velmurugan, D. Parimaladevi, A. Abiram, P. M. Sukitha, V. R. Kannan, R. S. Kumar, A. L. Almansour, K. Perumal, J. Prabhu and R. Nandhakumar, J. Photochem. Photobiol., A, 2024, 447, 115226 CrossRef CAS.
- P. C. Mai, T. C. Ngo, T. H. Nguyen and T. H. Le, J. Fluoresc., 2023, 1–9, DOI:10.1007/s10895-023-03477-9.
- K. Balasubramanian, S. K. Ramaraj, C. Karuppiah, C. C. Yang and K. Nagaraj, Inorg. Chem. Commun., 2023, 155, 111069 CrossRef CAS.
- R. W. Sinkeldam, N. J. Graco and Y. Tor, Chem. Rev., 2010, 110(5), 2579–2619 CrossRef CAS PubMed.
- R. Dhanapal, P. T. Perumal, M. Damodiran, C. Ramprasath and N. Mathivanan, Bioorg. Med. Chem. Lett, 2012, 22, 6494–6497 CrossRef CAS PubMed.
- X. Meng, S. X. Wang and M. Z. Zhu, Quinoline-Based Fluorescence Sensors, Molecular Photochemistry – Various Aspects, InTech, London, UK, 2012, pp. 1–22, DOI:10.5772/31771.
- R. Cinar, J. Nordmann, E. Dirksen and T. J. J. Muller, Org. Biomol. Chem., 2013, 11, 2597 RSC.
- M. Malathi, P. S. Mohan, R. J. Butcher and C. K. Venil, Can. J. Chem., 2009, 87, 1692–1703 CrossRef CAS.
- H. G. Lee, J. H. Lee, S. P. Jang, I. H. Hwang, S. J. Kim, Y. Kim, C. Kim and R. G. Harrison, Inorg. Chim. Acta., 2013, 394, 542–551 CrossRef CAS.
- L. E. McQuade and S. J. Lippard, Inorg. Chem., 2010, 49, 9535–9545 CrossRef CAS PubMed.
- H. Kim, J. Kang, K. B. Kim, E. J. Song and C. Kim, Spectrochim. Acta, Part A, 2014, 118, 883–887 CrossRef CAS PubMed.
- G. Xie, P. Xi, X. Wang, X. Zhao, L. Huang, F. Chen, Y. Wu, X. Yao and Z. Zeng, Eur. J. Inorg. Chem., 2011, 2011, 2927–2931 CrossRef CAS.
- D. Mahanand and J. C. Houck, Clin. Chem., 1968, 14, 6–11 CrossRef CAS.
- G. Yang, S. Li, S. Wang, R. Hu, J. Feng, Y. Li and Y. Qian, Pure Appl.
Chem., 2013, 85, 1465–1478 CrossRef CAS.
- M. Fernández-Suárez, A. Y. Ting and M. Fern, Nat. Rev. Mol. Cell Biol., 2008,(9), 929–943 CrossRef PubMed.
- C. Santana-Calvo, F. Romero, I. López-González and T. Nishigaki, BioTechniques, 2018,(65), 211–218 CrossRef CAS PubMed.
- Y. Li, T. Liu, H. Liu, M. Z. Tian and Y. Li, Accounts Chem. Res., 2014, 47, 1186–1198 CrossRef CAS PubMed.
- M. Suresh, P. Kar and A. Das, Inorg. Chim. Acta., 2010, 363, 2881–2885 CrossRef CAS.
- L. Xu, Y. Y. Zhao, G. Long, Y. Wang, J. Zhao, D. Li, J. Li, R. Ganguly, Y. Li, H. Sun and X. W. Sun, RSC Adv., 2015, 5, 63080–63086 RSC.
- R. Das, D. Guha, S. Mitra, S. Kar, S. Lahiri and S. Mukherjee, J. Phys. Chem. A, 1997, 101, 4042–4047 CrossRef CAS.
- C. V. Kumar and L. M. Tolosa, J. Chem. Soc. Chem. Commun., 1993, 78(1), 722–724 RSC.
- A. Prakash and D. Adhikari, Int. J. ChemTech Res., 2011, 3, 1891–1896 Search PubMed.
- A. Kajal, S. Bala, S. Kamboj, N. Sharma and V. Saini, J. Catal., 2013, 2013, 1–14 Search PubMed.
- K. Brodowska and E. Lodyga-Chruscinska, Cheminform, 2015, 46, 129–134 CrossRef.
- J. C. Qin, T. R. Li, B. D. Wang, Z. Y. Yang and L. Fan, Synth. Met., 2014, 195, 141–146 CrossRef CAS.
- S. Halder, S. Dey and P. Roy, RSC Adv., 2015, 5, 54873–54881 RSC.
- K. Grychowska, G. Satała, T. Kos, A. Partyka, E. Colacino, S. Chaumont-Dubel, X. Bantreil, A. Wesołowska, M. Pawłowski, J. Martinez and P. Marin, Chem. Neurosci., 2016, 7(7), 972–983 CrossRef CAS PubMed.
- A. L. Bédé, A. B. Assoma, K. D. Yapo, M. G. Koné, S. Koné, M. Koné, B. R. N'Guessan and E. H. Bamba, Comput. Chem., 2018, 6(03), 57 CrossRef.
- M. Rossi, J. Erlebacher, D. E. Zacharias, H. L. Carrell and B. Iannucci, Carcinog, 1991, 12(12), 2227–2232 CrossRef CAS PubMed.
- M. Z. Wang, J. Gao, Y. Chu, J. Niu, M. Chen, Q. Shang, L. H. Peng and Z. H. Jiang, BMC Complementary Med. Ther., 2020, 20, 1–8 CrossRef PubMed.
- M. Frisch, G. Trucks, H. Schlegel, G. Scuseria, M. Robb, J. Cheeseman, G. Scalmani, V. Barone, B. Mennucci and G. Petersson, G. Gaussian09, Revision D. 01, Gaussian, Inc., Wallingford CT, 2009, http://www.gaussian.com Search PubMed.
- R. Dennington, T. Keith and J. Millam, GaussView 5.0. Gaussian. Inc., Wallingford, 2008 Search PubMed.
- B. Kosar and C. Albayrak, Spectrochim. Acta, Part A, 2011, 78(1), 160 CrossRef PubMed.
- A. Mermer, H. Bayrak, S. Alyar and M. Alagumuthu, J. Mol. Struct., 2020,(1208), 127891 CrossRef CAS.
- P. Subhapriya, K. Sadasivam, M. L. Madhu Mohan and P. S. Vijayanand, Spectrochim. Acta, Part A, 2014, 123, 511–523 CrossRef CAS PubMed.
- K. burke, J. Chem. Phys., 2012,(15), 136 Search PubMed.
- L. R. Domingo, M. Ríos-Gutiérrez and P. Perez, Molecules, 2016, 21(6), 748 CrossRef PubMed.
- A. E. Reed and F. Weinhold, J. Chem. Phys., 1985, 83(4), 1736–1740 CrossRef CAS.
- C. B. Santos, C. C. Lobato, M. A. de Sousa, W. J. Macedo and J. C. Carvalho, Rev. Theor. Sci., 2014, 2, 91–115 CrossRef.
- D. Pankin, M. Smirnov, A. Povolotckaia, A. Povolotskiy, E. Borisov, M. Moskovskiy, A. Gulyaev, S. Gerasimenko, A. Aksenov and M. Litvinov, Materials, 2022,(15), 649 CrossRef CAS PubMed.
- C. Adamo and D. Jacquemin, Chem. Soc. Rev., 2013, 42, 845–856 RSC.
- R. D. Garcia, V. G. Maltarollo, K. M. Honorio and G. H. Trossini, J. Mol. Model., 2015,(21), 150 CrossRef PubMed.
- B. Czaplińska, K. Malarz, A. Mrozek-Wilczkiewicz, A. Korzec and R. Musiol, Molecules, 2020, 25(11), 2488 CrossRef PubMed.
Footnote |
| † Electronic supplementary information (ESI) available: Detailed experimental procedures and characterization data for all novel compounds along with fluorescent emission spectra for compounds, MEP diagrams and FMO diagrams, NMR, IR and HRMS spectra. See DOI: https://doi.org/10.1039/d4ra03961k |
|
| This journal is © The Royal Society of Chemistry 2024 |
Click here to see how this site uses Cookies. View our privacy policy here. 
 Open Access Article
 This Open Access Article is licensed under a Creative Commons Attribution-Non Commercial 3.0 Unported Licence
 *
*