
 Open Access Article
 This Open Access Article is licensed under a Creative Commons Attribution-Non Commercial 3.0 Unported Licence
Preparation of Zn3Nb2O8 anode material for high-performance lithium/sodium-ion batteries†
Xuemin Yin *a,
Shuling Chengb,
Yuyang Zhangc and
Chencheng Liua
*a,
Shuling Chengb,
Yuyang Zhangc and
Chencheng Liua
aHebei Key Laboratory of Green Development of Rock and Mineral Materials, Hebei GEO University, Shijiazhuang 050031, China. E-mail: xueminyin24@163.com
bSchool of Chemical and Environmental Engineering, Shanghai Institute of Technology, Shanghai 201418, China
cFaculty of Robot Science and Engineering, Northeastern University, Liaoning 110819, China
First published on 14th August 2024
Abstract
Niobium-based oxides (M-Nb-O) as promising lithium/sodium-ion storage anode materials have attracted much attention. More types of niobium-based oxides are prepared in order to provide more candidates for anode materials. Herein, Zn3Nb2O8 as a novel intercalation-type anode material has been reported for the first time. Arborescent Zn3Nb2O8 particles (Zn3Nb2O8-A) and stump-like Zn3Nb2O8 particles (Zn3Nb2O8-B) have been prepared by solid-state and solvothermal methods, respectively. Benefiting from the microsized stump-like structure and the exposure of the (110) facet, Zn3Nb2O8-B delivers superior long-term cycling stability with a 139.6% capacity retention (291.8 mA h g−1) over 650 cycles at 0.5 A g−1 and a large reversible specific capacity of 91.4 mA h g−1 at 4.0 A g−1 in lithium-ion batteries. Furthermore, the Zn3Nb2O8-B electrode exhibits outstanding cycling stability (100.1 mA h g−1 with 94.5% capacity retention after 400 cycles at 0.5 A g−1) in sodium-ion batteries. The excellent electrochemical performance of the stump-like Zn3Nb2O8-B materials can be attributed to the exposure of the (110) facet, enlarged interlayer spacing, small charge transfer resistance, and high pseudocapacitive contribution. Therefore, Zn3Nb2O8-B has great application prospects as an anode material for lithium/sodium-ion storage.
1 Introduction
The development of electronics, electric vehicles, and smart grids has created a huge demand for lithium-ion batteries (LIBs) with high energy density, long cycle life, and low cost.1–3 As an important part of LIBs, anode materials should have the characteristics of high specific capacity and excellent cycle performance. Although the existing intercalation material technology has matured, the problem of slow diffusion kinetics of Li+ in graphite cannot be avoided, which limits the development and application of LIBs in the field of fast charging. Therefore, anode materials with the advantages of high rate and long life are an effective method to solve the above problems.In recent years, niobium-based oxides have been found to exhibit stable Wadsley–Roth phases with shear-type crystal structures, fast ion intercalation and deintercalation, excellent rate capability, and high operating voltages (above 1.0 V). Therefore, niobium-based oxides have become very promising candidates for electrochemical energy storage materials. The M in binary niobium-based oxides (M-Nb-O) generally includes elements such as Sn,4 Fe,5 Zn,6,7 Ti,8,9 W,10,11 Mo,12,13 Cr,14,15 Ge,16 Ga,17 V,18 Mg,19 P20 or Ni,21,22 which can provide more redox electron pairs and make the overall structure of niobium-based materials have higher energy density and theoretical capacity. Therefore, the application of M-Nb-O type anode materials in LIBs has recently attracted extensive attention.
Zinc has the advantages of light weight, relatively cheap price and the large ionic radius of Zn2+ (0.740 Å), which can provide a wider transport channel for Li+ and improve the diffusion rate of Li+. Therefore, zinc niobium oxide has great advantages as an energy storage material. At present, there are few reports on zinc niobium oxide as an electrode material, mainly involving ZnNb2O6,6 Zn2Nb34O87.7 For example, bulk-ZnNb2O6 materials were successfully prepared by solid-state reaction and showed stable electrochemical performance in LIBs (specific capacity of 181.9 mA h g−1 after 100 cycles at 0.1 A g−1).6 Zhu's group successfully prepared Zn2Nb34O87 blocks by a solid-state reaction method and used them as anode materials for LIBs, which showed excellent cycling performance (216.5 mA h g−1 after 100 cycles at 0.4 A g−1).7 It can be seen that the different proportions of Zn, Nb and O elements will affect the electrochemical properties of Zn–niobium oxide anode materials. Moreover, the Zn3Nb2O8 materials and their applications as anode materials in lithium/sodium-ion batteries have yet to be investigated. Based on the above research results and related literature research, we have not found any literature on Zn3Nb2O8 as an anode material and its application in lithium/sodium-ion batteries.
Herein, we prepared two Zn3Nb2O8 materials with distinct morphologies through different methods and the Zn3Nb2O8 was used as the electrode material in lithium/sodium-ion batteries for the first time. Arborescent Zn3Nb2O8 particles (Zn3Nb2O8-A) with a size ranging from 300 to 2300 nm were fabricated via a conventional solid-state reaction (Fig. 1a), and stump-like Zn3Nb2O8 particles (Zn3Nb2O8-B) with a size ranging from 250 to 1700 nm were fabricated through a solvothermal method (Fig. 1b). The morphological characteristics, crystalline structure, chemical composition and electrochemical performance of these two Zn3Nb2O8 materials were systematically investigated. Compared with Zn3Nb2O8-A, Zn3Nb2O8-B exhibited good rate performance (reversible capacity of 91.4 mA h g−1 at 4.0 A g−1) and excellent cycling stability (291.8 mA h g−1 after 650 cycles at 0.5 A g−1). Therefore, Zn3Nb2O8-B is expected to be a promising electrode material in the future.
 | ||
| Fig. 1 Schematic illustration of Zn3Nb2O8 materials synthesized by (a) solid-state reaction and (b) solvothermal reaction. | ||
2 Experimental
2.1 Material preparation
According to the traditional solid-phase synthesis method,23,24 3.0 mmol of zinc oxide (ZnO, 99.99%, Macklin) and 1.0 mmol of niobium pentoxide (Nb2O5, 99.9%, Aladdin) were added to absolute ethanol, and mixed uniformly under the action of a ball mill (Fig. 1a). The mixed solution after ball milling was dried in a blast drying oven at 80 °C for 12 h to obtain a white powdery precursor. Finally, the precursor was calcined at a heating rate of 5 or 10 °C min−1 for 2 hours in an air or argon atmosphere at 700–1200 °C to obtain zinc–niobium oxide, and the obtained product was named Zn3Nb2O8-A.3.0 mmol of zinc acetate (C4H6O4Zn·2H2O, 98%, Aladdin) and 2.0 mmol of niobium oxalate (C10H5NbO20, 98%, Macklin) were added to a mixed solution of 40 mL of H2O and 20 mL of C2H5OH, and stirred vigorously for 2 h (Fig. 1b). The uniformly stirred mixed solution was transferred to a Teflon reactor, and then placed in a blast oven at 180 °C for 24 h. The mixed solution was washed with deionized water and absolute ethanol for several times, dried in a blast drying oven at 80 °C for 12 h, and calcined at high temperature to obtain Zn3Nb2O8-B.
2.2 Material characterization
The phase and crystal structure of the as-synthesized materials were analyzed by X-ray diffractometer (XRD, D/MAX-2200). The element information of the as-prepared materials was recorded by X-ray photoelectron spectrometry (XPS, Thermo Scientific K-Alpha). The morphologies of the materials were observed by scanning electron microscope (SEM, Hitachi SU-70) equipped with energy dispersive spectroscopy (EDS). The microstructures of the as-prepared materials were characterized by the transmission electron microscope (TEM, JEOL JEM-2100F).2.3 Electrochemical measurements
The working electrode consists of 70 wt% active material (Zn3Nb2O8), 20 wt% conductive agent Super P, 10 wt% polyvinylidenefluoride (PVDF), and appropriate amount of N-methyl-2-pyrrolidone (NMP). Then, the uniformly mixed slurry was coated on copper foil and dried in a vacuum oven at 80 °C for 12 h. The electrodes were assembled into coin-shaped cells (CR2032) using lithium foil as the counter electrode and Whatman glassfiber as the separator. For lithium-ion batteries, the electrolyte was composed of 1.0 mol L−1 LiPF6 solution in a mixture (1![[thin space (1/6-em)]](https://www.rsc.org/images/entities/char_2009.gif) :1:1, in vol%) of ethylene carbonate (EC), diethyl carbonate (DEC), and ethyl methyl carbonate (EMC). 1.0 mol L−1 NaPF6 in diglyme was used as electrolyte for sodium-ion batteries. The LAND testing system (CT2001A) was used for constant current (dis)charge test and galvanostatic intermittent titration technique (GITT) measurement in the voltage range of 0.01–3.00 V. Electrochemical workstation (CHI 660E) was used to measure cyclic voltammetry (CV) and electrochemical impedance spectroscopy (EIS).
:1:1, in vol%) of ethylene carbonate (EC), diethyl carbonate (DEC), and ethyl methyl carbonate (EMC). 1.0 mol L−1 NaPF6 in diglyme was used as electrolyte for sodium-ion batteries. The LAND testing system (CT2001A) was used for constant current (dis)charge test and galvanostatic intermittent titration technique (GITT) measurement in the voltage range of 0.01–3.00 V. Electrochemical workstation (CHI 660E) was used to measure cyclic voltammetry (CV) and electrochemical impedance spectroscopy (EIS).
3 Results and discussion
Firstly, the optimal sintering temperature of Zn3Nb2O8 materials was investigated. Take Zn3Nb2O8-A materials for example, as shown in Fig. S1a,† XRD patterns of the zinc niobate materials that were calcined at 700–1200 °C for 2 h in air. The products are ZnNb2O6 phase (no. JCPDS 76-1827) and unreacted ZnO precursor in the calcination temperature range from 700 to 850 °C. It is worth mentioning that a strong diffraction peak appears at 30.21°, which is consistent with the characteristic peak of ZnNb2O6. When the calcination temperature reaches 900 °C, the diffraction peak at 30.21° becomes weaker, but a weaker Zn3Nb2O8 diffraction peak appears at 32.72°. When the calcination temperature rises to 950 °C, all diffraction peaks are completely consistent with the diffraction peaks of monoclinic Zn3Nb2O8 (no. JCPDS 79-1164). When the calcination temperature continues to rise to 1000 or 1200 °C, the characteristic peak at 32.72° disappears, and a strong diffraction peak of ZnNb2O6 appears at 30.21°. In conclusion, the optimum calcination temperature of Zn3Nb2O8 is preliminarily determined to be 950 °C. In addition, the effect of precursors in different calcination atmospheres (air or argon) and heating rates on the synthesis of Zn3Nb2O8 was investigated, and the XRD patterns of the products are shown in Fig. S1b.† It can be seen that the XRD patterns of the three samples are consistent with the diffraction peaks of monoclinic Zn3Nb2O8 (no. JCPDS 79-1164), indicating the successful synthesis of Zn3Nb2O8 materials. The ideal calcination setting for Zn3Nb2O8 material, however, is calcination to 950 °C at a heating rate of 10 °C min−1 under an air atmosphere, taking time and cost into consideration. Based on the above optimal sintering conditions, the XRD spectra of the as-prepared Zn3Nb2O8-A and Zn3Nb2O8-B are shown in Fig. 2a. It can be seen that the diffraction peaks of both samples correspond to the diffraction peaks of monoclinic Zn3Nb2O8, indicating the successful preparation of Zn3Nb2O8 materials. Fig. 2b presents the crystal structure of Zn3Nb2O8-A and Zn3Nb2O8-B, which has a corundum-like monoclinic cell structure (a = 19.093 Å, b = 5.927 Å and c = 5.22 Å), and the space group is C2/c. ZnO6 and NbO6 have shear-type ReO3 octahedral structures. There are corner and edge sharing between octahedra to form quadrilateral channels. In addition, the distance between O1 and O3 is 4.31 Å, and the distance between O2 and O4 is 2.94 Å, which can allow the normal insertion and extraction of metal-ion (Li+ and Na+). | ||
| Fig. 2 (a) XRD pattern of Zn3Nb2O8-A and Zn3Nb2O8-B calcined at 950 °C at 10 °C min−1 in air. (b) Crystal structure of Zn3Nb2O8, (c) XPS survey spectra of Zn3Nb2O8-B; XPS spectra of Zn3Nb2O8-B for (d) Zn 2p, (e) Nb 3d, (f) O 1s. | ||
X-ray photoelectron spectroscopy (XPS) was applied to investigate the element composition and valence state of the material surface. Fig. 2c shows the XPS survey spectra of Zn3Nb2O8-B materials, in which the zinc, niobium, oxygen, carbon elements were detected. In the Zn 2p spectra (Fig. 2d), the XPS peaks located at 1021.8 and 1044.9 eV can be attributed to the Zn 2p3/2 and Zn 2p1/2 binding energies of Zn2+, respectively.7 Fig. 2e shows two strong characteristic peaks centered at 207.0 eV and 209.7 eV in the high resolution Nb 3d XPS spectrum, consistent with 3d5/2 and 3d1/2, which confirms the presence of Nb5+.25–27 The O 1s spectrum (Fig. 2f) can be spilt into three peaks at 530.3, 531.8, and 533.0 eV, which were related to the Zn–O/Nb–O, C–O, and C![[double bond, length as m-dash]](https://www.rsc.org/images/entities/char_e001.gif) O, respectively.28 In the C 1s high-resolution spectrum of Zn3Nb2O8-B (Fig. S2†), the peaks at 286.2, 285.3, and 284.8 eV are attributed to CO, C–O, and C–C groups, respectively.11 In addition, the XPS spectra of Zn3Nb2O8-A are shown in Fig. S3.† These results demonstrate that the valence states of Zn, Nb and O elements in both samples are Zn2+, Nb5+ and O2−, respectively.
O, respectively.28 In the C 1s high-resolution spectrum of Zn3Nb2O8-B (Fig. S2†), the peaks at 286.2, 285.3, and 284.8 eV are attributed to CO, C–O, and C–C groups, respectively.11 In addition, the XPS spectra of Zn3Nb2O8-A are shown in Fig. S3.† These results demonstrate that the valence states of Zn, Nb and O elements in both samples are Zn2+, Nb5+ and O2−, respectively.
In order to explore the effect of preparation method on the morphology of Zn3Nb2O8, scanning electron microscope (SEM) and elemental mapping characterizations were carried out. Fig. 3a and b shows the SEM images of Zn3Nb2O8-A sample, it can be seen that these particles are smooth, with arborescent particle sizes ranging from 300 to 2300 nm. However, Zn3Nb2O8-B sample shows a different morphology. As shown in Fig. 3e and f, SEM images clearly show that the Zn3Nb2O8-B particles are rough, stump-like, no-aggregating, and the particle size ranges from 250 to 1700 nm. Meanwhile, Fig. 3i demonstrates the energy dispersive spectroscopy (EDS) mapping images of Zn3Nb2O8-B, which further confirmed the homogeneous distribution of elements (Zn, Nb, O) in the Zn3Nb2O8-B, indicating the Zn3Nb2O8 has been successfully synthesized. In addition, the EDS mapping images of Zn3Nb2O8-A are presented in Fig. S4,† the uniform homogeneous distribution of elements (Zn, Nb, O) in the Zn3Nb2O8-A also proved its successful preparation. The microstructures of Zn3Nb2O8-A and Zn3Nb2O8-B were confirmed by transmission electron microscope (TEM). As shown in Fig. 3c and d, there are distinct fringes with lattice spacing of about 0.44 nm, corresponding to the (310) facet in Zn3Nb2O8-A. In addition, the distances of lattice fringes are measured to be 0.57 nm, corresponding to the (110) facet in Zn3Nb2O8-B. Different crystal facets in Zn3Nb2O8-A and Zn3Nb2O8-B were observed by TEM, indicating that there may be more (110) facet exposure in Zn3Nb2O8-B and more (310) facet exposure in Zn3Nb2O8-A. Therefore, the area ratio of exposed (110)/(310) facets in Zn3Nb2O8-A and Zn3Nb2O8-B are roughly calculated based on these XRD pattern in Fig. 2a. The approximate ratios of (110)/(310) facets in Zn3Nb2O8-A and Zn3Nb2O8-B are 34.2% and 41.2%, respectively. XRD and TEM results show that the area ratio of exposed (110)/(310) facets in Zn3Nb2O8-A is lower than that in Zn3Nb2O8-B. The lattice spacing of (110) facet is larger than that of (310) facet, so Zn3Nb2O8-B material may be more conducive to the rapid insertion and extraction of metal-ions (Li+ and Na+).
 | ||
| Fig. 3 (a and b) SEM images, (c) TEM image and (d) HRTEM image of Zn3Nb2O8-A; (e and f) SEM images, (g) TEM image, (h) HRTEM image and (i) EDS mapping images of Zn3Nb2O8-B. | ||
In order to explore the effect of Zn3Nb2O8-A and Zn3Nb2O8-B samples on the electrochemical performance, Zn3Nb2O8-A/Li and Zn3Nb2O8-B/Li half-cells for lithium-ion storage were assembled (Fig. 4a). Fig. 4b shows the cyclic voltammetry (CV) curves of Zn3Nb2O8-B in the voltage range of 0.01–3.00 V at a scan rate of 0.1 mV s−1. In the cathode process, the broad peaks at the potential of 0.1–0.5 V and 0.5–1.0 V are mainly due to the formation of irreversible SEI and LixZn3Nb2O8 products (Zn3Nb2O8 + xLi+ + xe− ↔ LixZn3Nb2O8).6,20 In the first anodic process, there is a broad peak at 1.0–1.5 V, which is basically consistent with the subsequent cycle, indicating that the Zn3Nb2O8-B material has a good reversibility performance. Additionally, Fig. S5† demonstrates that the CV curves of Zn3Nb2O8-A are similar to those of Zn3Nb2O8-B.
 | ||
| Fig. 4 (a) Schematic illustration of Zn3Nb2O8//Li lithium-ion cell. (b) CV curves of Zn3Nb2O8-B at the scan rate of 0.1 mV s−1; (c) Nyquist plots of Zn3Nb2O8-A and Zn3Nb2O8-B; (d) rate performances of Zn3Nb2O8-A and Zn3Nb2O8-B at different current densities; (e) galvanostatic discharge and charge curves of Zn3Nb2O8-B at different current densities from 0.05 to 4.0 A g−1. (f) Cycling performances of Zn3Nb2O8 at a current density of 0.2 A g−1; (g) discharge and charge curves of Zn3Nb2O8-B at a current density of 0.5 A g−1; (h) cycling performances of Zn3Nb2O8 at a current density of 0.5 A g−1. (i) Comparison of cycling stability between Zn3Nb2O8-B with other Nb-based anode materials. | ||
The Nyquist plots of Zn3Nb2O8-A and Zn3Nb2O8-B electrode materials show similar curves (Fig. 4c). The charge transfer resistance value of Zn3Nb2O8-B is 75 Ω, which is lower than that of Zn3Nb2O8-A (230 Ω), indicating that the (110)-exposed Zn3Nb2O8-B provided better Li ion/electron transfer kinetics than (310)-exposed Zn3Nb2O8-A. It is well known that different surface atoms are arranged according to different crystal facets.29 This result indicating that the movement of Li ion/electron through the (110) facet is more easily than through the (310) facet of Zn3Nb2O8. The rate performance of Zn3Nb2O8 electrode was tested at various current densities, as shown in Fig. 4d. The reversible capacities of the Zn3Nb2O8-B electrode are 371.8, 282.1, 247.9, 199.1, 161.8, 121.3, 102.1 and 91.4 mA h g−1 at current densities of 0.05, 0.10, 0.20, 0.50, 1.00, 2.00, 3.00 and 4.00 A g−1, respectively. The specific capacity returned to 308.1 mA h g−1 when the current density was changed back to 0.05 A g−1, revealing the electrode's exceptional structural stability throughout a broad current range. However, the reversible capacities of the Zn3Nb2O8-A electrode are relatively low, which are 274.0, 205.9, 170.8, 117.8, 77.8, 53.4, 44.4, 40.1 and 231.3 mA h g−1 at current densities of 0.05, 0.10, 0.20, 0.50, 1.00, 2.00, 3.00, 4.00 and 0.05 A g−1, respectively. The corresponding galvanostatic discharge and charge curves of Zn3Nb2O8-A and Zn3Nb2O8-B at different current densities are shown in Fig. 4e and S6,† it can be seen that the capacity is mainly contributed by the slope segment. In addition, the cycling performance was also investigated at a current density of 0.2 A g−1 (Fig. 4f). The Zn3Nb2O8-B electrode had a high specific capacity of 341.7 mA h g−1 after 115 cycles. While the Zn3Nb2O8-A electrode had a relative low specific capacity of 295.2 mA h g−1 after 115 cycles. The partial discharge and charge curves of Zn3Nb2O8-A and Zn3Nb2O8-B electrodes are shown in Fig. S7.† Increasing the current density to 0.5 A g−1, the long-cycling stability of Zn3Nb2O8-A and Zn3Nb2O8-B electrodes were investigated (Fig. 4h). After 650 cycles, the discharge capacities of Zn3Nb2O8-A and Zn3Nb2O8-B are 291.8 and 127.3 mA h g−1, respectively, and the corresponding discharge–charge curves are presented in Fig. 4g and S7c.† Obviously, the overall capacity of the electrode material decreases first and then increases during cycling. The initial capacity attenuation is mainly attributed to the fracture and exfoliate of the electrode material during the Li+ insertion and extraction processes. The subsequent capacity increase is ascribed to the rapid Li-diffusion kinetics in the SEI layer. This similar behavior has been reported in the previous literature.6,30–32. Compared with Zn3Nb2O8-A materials, Zn3Nb2O8-B materials show excellent cycling and rate performance, which may be due to the exposure of (110) facets in Zn3Nb2O8-B materials.33–35 More importantly, as shown in Fig. 4i and Table S1,† the cycling stability of Zn3Nb2O8-B was particularly better than that of other Nb-based anode materials (e.g. Nb2O5, K6Nb10.8O30, ZnNb2O6, Bi5Nb3O15, VNb9O25, CrNb49O124, TiNb2O7, WNb12O33 and GaNb18O47).
In order to further explore the mechanism for excellent electrochemical performance of Zn3Nb2O8-B material. The reaction kinetics and charge storage mechanism of Zn3Nb2O8-A and Zn3Nb2O8-B were analyzed using CV tests with scanning rates in the range of 0.1–10.0 mV s−1 (Fig. S8a† and 5a). The relationship between the peak current i (A) and the scanning rate v (mV s−1) follows the following equation: i = avb. Diffusion-controlled processes are indicated by a b-value of 0.5, whereas surface capacitance-controlled processes are indicated by a b-value of 1.36 The calculated b-values of Zn3Nb2O8-A and Zn3Nb2O8-B are shown in Fig. S8b† and 5b, respectively. The b-values of anodic (oxidation) and cathodic (reduction) peaks for Zn3Nb2O8-B electrode were calculated to be 0.77 and 0.95. While the Zn3Nb2O8-A showed the b-values are 0.69 and 0.78 for the anodic and cathodic (reduction) peaks, respectively. The results indicating that the charge storage mechanism for Zn3Nb2O8-A and Zn3Nb2O8-B is a combination of surface capacitance-controlled process and diffusion-controlled behavior. However, Zn3Nb2O8-B displays a greater b-values than Zn3Nb2O8-A and exhibits a pseudo-capacitive tendency. This behavior could enable the fast charge transport.7 A typical CV curves at 2.0 mV s−1 are shown in Fig. S9,† the pseudo-capacitive capacity contribution of Zn3Nb2O8-A and Zn3Nb2O8-B at different sweep rates are calculated as shown in Fig. 5c and S8d,† respectively. The results demonstrate that the pseudo-capacitance contribution of both electrodes are obviously improving with sweep rates rising, but the capacitance contribution of Zn3Nb2O8-B electrode is significantly higher than that of Zn3Nb2O8-A electrode at the same sweep rate, indicating that the Zn3Nb2O8-B electrode has fast electron/ion transport kinetics, which eventually makes it have good long-term stability.
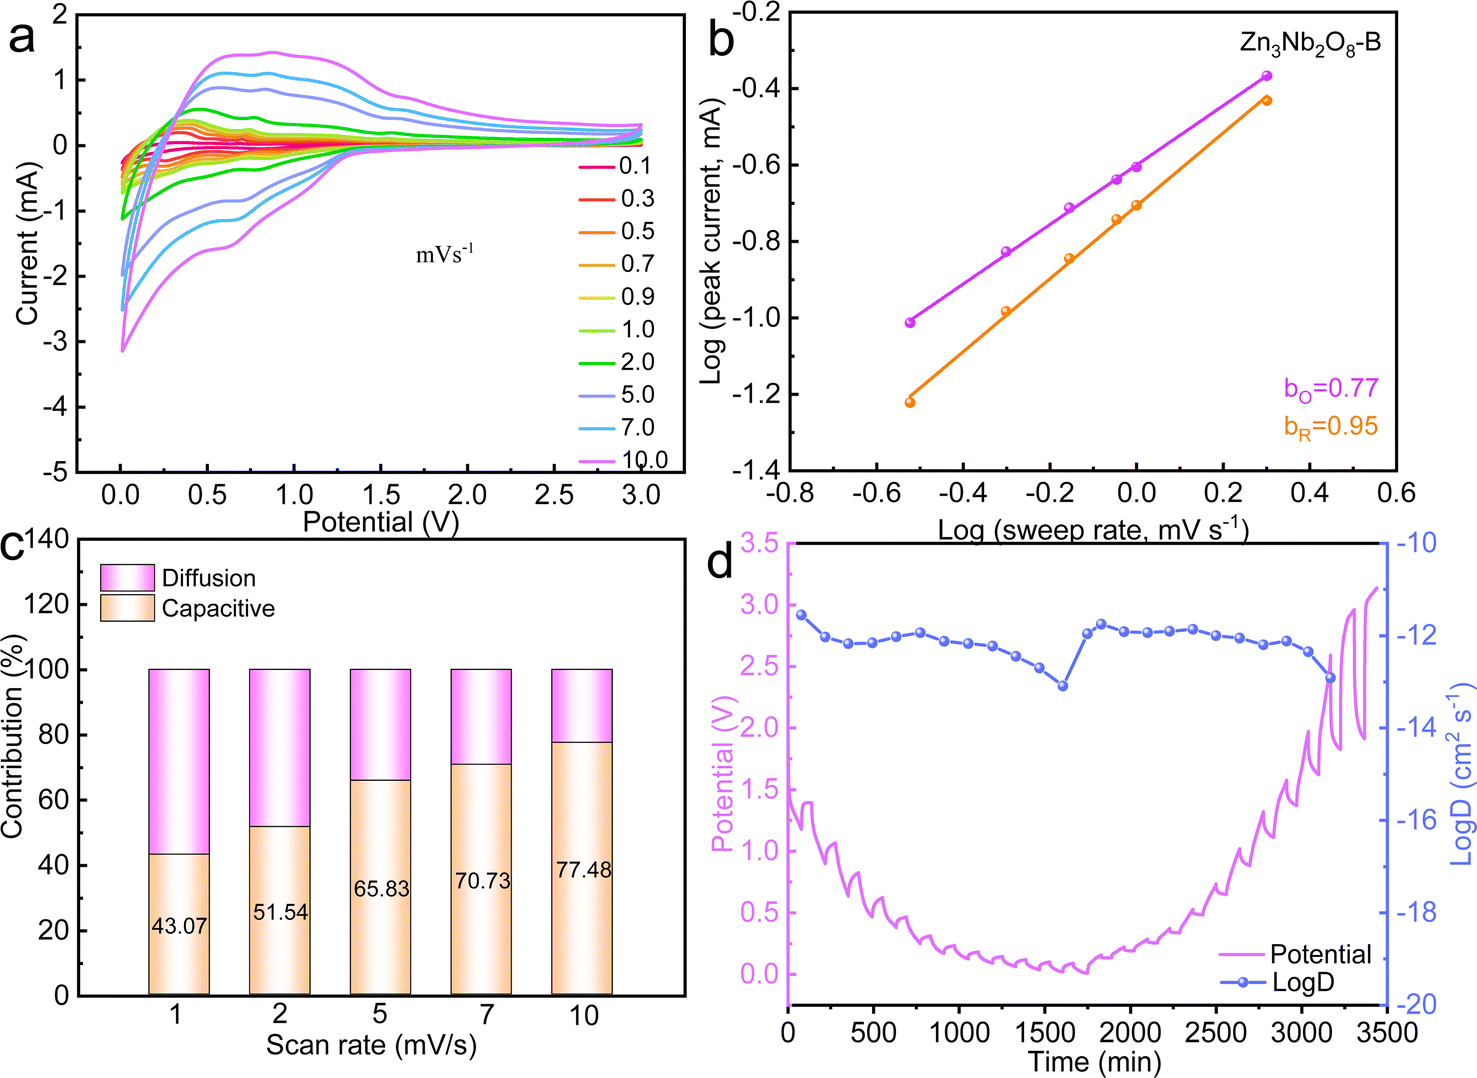 | ||
| Fig. 5 (a) CV curves of Zn3Nb2O8-B from 0.1 to 10.0 mV s−1; (b) plots of log(i) vs. log(v) of the Zn3Nb2O8-B/Li cell; (c) contribution ratios of diffusion- and capacitive-controlled capacities at different scan rates. (d) GITT curves of Zn3Nb2O8-B at 0.01–3.00 V. | ||
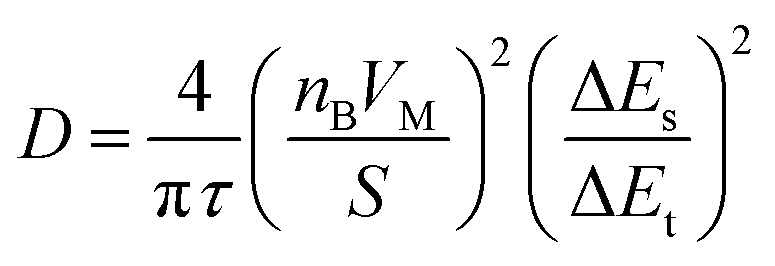
In addition, the diffusion coefficient of Li+ in the electrode material is measured by GITT and can be calculated according to the following formula:37
 | (1) |
The GITT curves and corresponding D values of Zn3Nb2O8-B during the charge–discharge process are shown in Fig. 5d, and the average value of log(D) during the (de)intercalation of Li+ is ∼1 × 10⁻¹². The results of EIS and GITT together confirm that Li+ can diffuse rapidly in the Zn3Nb2O8-B electrode material. Therefore, the Zn3Nb2O8-B electrode can effectively reduce the charge transfer resistance and accelerate Li+ migration, resulting in excellent rate performance.
We further investigated the application of Zn3Nb2O8-B in sodium-ion batteries, the electrodes were assembled into coin-shaped cells using sodium foil as counter electrode. The rate behaviors of the Zn3Nb2O8-B anode throughout a current density range of 0.05 to 4.0 A g−1 are shown in Fig. 6a. Zn3Nb2O8-B demonstrated good rate performance in comparison to Zn3Nb2O8-A (Fig. 6c), producing reversible capacities of 212.2, 154.9, 121.9, 92.1, 72.0, 55.1, 52.1, and 49.4 mA h g−1 at current densities of 0.05, 0.1, 0.2, 0.5, 1, 2, 3, and 4 A g−1, respectively. Then, when the current density was decreased to 0.05 A g−1, the specific capacity of the Zn3Nb2O8-B anode recovered to 172.9 mA h g−1, demonstrating the good kinetic process. The corresponding discharge and charge curves of Zn3Nb2O8-B at different current densities are displayed in Fig. 6b. As a comparison of Zn3Nb2O8-A electrode, the rate performance and discharge–charge curves at different current densities are shown in Fig. S10a and b.† In addition, Fig. 6d displays the long cycle stability of Zn3Nb2O8-B electrode at 0.5 A g−1, the discharge capacity of Zn3Nb2O8-B is 100.1 mA h g−1 with 94.5% capacity retention after 400 cycles. While the Zn3Nb2O8-A electrode has a relative low specific capacity of 50.8 mA h g−1 with 61.3% capacity retention after 400 cycles (Fig. S10c†). Compared with Zn3Nb2O8-A electrode, the better electrochemical performance of Zn3Nb2O8-B electrode may be related to the exposed (110) crystal planes, which enables more sodium-ions to be (de)intercalated. As shown in Fig. S11,† the EIS demonstrated that the impedance of Zn3Nb2O8-A (12.7 Ω) is significantly higher than that of Zn3Nb2O8-B (10.7 Ω), which indicated that Zn3Nb2O8-B has a fast charge transfer rate. Based on the above tests and analysis show that Zn3Nb2O8-B can be used as an excellent negative electrode for LIBs/SIBs.
 | ||
| Fig. 6 (a) Rate performances of Zn3Nb2O8-B at different current densities for SIBs; (b) galvanostatic discharge and charge curves of Zn3Nb2O8-B at different current densities from 0.05 to 3.0 A g−1. (c) Comparison of specific capacities of Zn3Nb2O8-A and Zn3Nb2O8-B electrodes at different current densities. (d) Cycling performances of Zn3Nb2O8-B at a current density of 0.5 A g−1; (e) discharge and charge curves of Zn3Nb2O8-B at a current density of 0.5 A g−1. | ||
4 Conclusions
In summary, we have successfully designed Zn3Nb2O8-A and Zn3Nb2O8-B anode materials via solid-state reaction and solvothermal methods, respectively. SEM results show that Zn3Nb2O8-A particles were arborescent and smooth, while the Zn3Nb2O8-B particles were stump-like and rough. XRD and TEM results show that the area ratio of exposed (110)/(310) facets in Zn3Nb2O8-A is lower than that in Zn3Nb2O8-B, the (110) facet is more conducive to the rapid insertion and extraction of metal-ions (Li+ and Na+) than (310) facet. Compared with the Zn3Nb2O8-A anode material, the Zn3Nb2O8-B anode material exhibits superior long-cycle cyclability and better rate performance. It displays a high reversible specific capacity of 291.8 mA h g−1 at the current density of 0.5 A g−1 after 650 cycles and a large reversible specific capacity of 91.4 mA h g−1 at 4.0 A g−1 in Li-ion batteries. In addition, Zn3Nb2O8-B electrode exhibits excellent reversible specific capacity of 100.1 mA h g−1 at the current density of 0.5 A g−1 after 400 cycles in sodium-ion batteries. This work provides an effective strategy for the application in high performance lithium/sodium energy storage.Data availability
Data are available on request from the authors.Author contributions
Xuemin Yin: experimental work, writing the original draft, and reviewing the draft. Shuling Cheng: conceptualization, experimental work, data analysis. Yuyang Zhang: conceptualization, formal analysis. Chencheng Liu: conceptualization.Conflicts of interest
The authors declare no competing interest.Acknowledgements
The authors are grateful for the financial support from the Science Research Project of Hebei Education Department (BJK2024063), Open Foundation of Hebei Key Laboratory of Green Development of Rock and Mineral Materials (RM202305).References
- J. Chen, Y. Yang, S. Yu, Y. Zhang, J. Hou, N. Yu and B. Fang, Nanomaterials, 2023, 13, 2416 CrossRef CAS PubMed.
- C. Sun, Y.-J. Wang, D. Liu, B. Fang, W. Yan and J. Zhang, Chem. Eng. J., 2023, 453, 139603 CrossRef CAS.
- B. Fang, Y.-J. Wang and H. Wang, Matter, 2023, 6, 2508 CrossRef CAS.
- M. Huang, J. X. Liu, P. Huang, H. Hu and C. Lai, Rare Met., 2021, 40, 425 CrossRef CAS.
- R. Zheng, Y. Li, H. Yu, T. Liu, M. Xia, X. Zhang, N. Peng, J. Zhang, Y. Bai and J. Shu, Chem. Eng. J., 2020, 384, 123314 CrossRef CAS.
- X. F. Li, J. Li, R. N. Ali, Z. Wang, G. J. Hu and B. Xiang, Chem. Eng. J., 2019, 368, 764 CrossRef CAS.
- X. Zhu, H. Cao, R. Li, Q. Fu, G. Liang, Y. Chen, L. Luo, C. Lin and X. S. Zhao, J. Mater. Chem. A, 2019, 7, 25537 RSC.
- Y. Yuan, H. Yu, X. Cheng, R. Zheng, T. Liu, N. Peng, N. Long, M. Shui and J. Shu, Chem. Eng. J., 2019, 374, 937 CrossRef CAS.
- X. Cheng, Y. Zhao, A. Lushington, J. Gao, Q. Li, P. Zuo, B. Wang, Y. Gao and Y. Ma, Nano Energy, 2017, 34, 15 CrossRef.
- Q. Tian, W. Ye, H. Yu, X. Cheng, H. Zhu, N. Long, M. Shui and J. Shu, Ceram. Int., 2019, 45, 1893 CrossRef CAS.
- L. Yan, J. Shu, C. Li, X. Cheng, H. Zhu, H. Yu, C. Zhang, Y. Zheng, Y. Xie and Z. Guo, Energy Storage Mater., 2019, 16, 535 CrossRef.
- S. L. Cheng, X. P. Yin, S. Sarkar, Z. W. Wang, Q. A. Huang, J. J. Zhang and Y. F. Zhao, Rare Met., 2022, 81, 2645 CrossRef.
- X. Ma, P. Chen, M. Qian, D. Wu, J. Du, X. Chen, R. Dai, M. Sha, Z. Zi and J. Dai, J. Alloys Compd., 2021, 864, 158379 CrossRef CAS.
- J. Wu, G. Pan, W. Zhong, L. Yang, S. Deng and X. Xia, J. Colloid Interface Sci., 2020, 562, 511 CrossRef CAS PubMed.
- C. Xiao, M. Xia, W. Ye, X. Zhang, S. Chen, H. Yu, W. Bi, M. Shui and J. Shu, Ceram. Int., 2020, 46, 15527 CrossRef CAS.
- F. Ran, X. Cheng, H. Yu, R. Zheng, T. Liu, X. Li, N. Ren, M. Shui and J. Shu, Electrochim. Acta, 2018, 282, 634 CrossRef CAS.
- S. N. He, Y. L. Xu, X. N. Ma, Y. J. Chen, J. Lin and C. Wang, ChemElectroChem, 2020, 7, 2087 CrossRef CAS.
- S. Qian, H. Yu, L. Yan, H. Zhu, X. Cheng, Y. Xie, N. Long, M. Shui and J. Shu, ACS Appl. Mater. Interfaces, 2017, 9, 30608 CrossRef CAS PubMed.
- X. Zhu, Q. Fu, L. Tang, C. Lin, J. Xu, G. Liang, R. Li, L. Luo and Y. Chen, ACS Appl. Mater. Interfaces, 2018, 10, 23711 CrossRef CAS PubMed.
- P. Hei, S. Luo, K. Wei, J. Zhou, Y. Zhao and F. Gao, ACS Sustain. Chem. Eng., 2020, 9, 216 CrossRef.
- H. Dai, G. Zhang, D. Rawach, C. Fu, C. Wang, X. Liu, M. Dubois, C. Lai and S. Sun, Energy Storage Mater., 2021, 34, 320 CrossRef.
- C. P. Lv, C. F. Lin and X. S. Zhao, Adv. Energy Mater., 2021, 12, 2102550 CrossRef.
- A. Prasatkhetragarn, R. Yimnirun and S. Ananta, Mater. Lett., 2007, 61, 3873 CrossRef CAS.
- P. Pakawanit, P. Amonpattaratkit, R. Yimnirun and S. Ananta, Ferroelectr. Lett.Sect., 2013, 40, 85 CrossRef CAS.
- T. Liu, X. Yin, X. Yin, S. Cheng, X. Wang and Y. Zhao, Chem.–Asian J., 2022, 17, e202200288 CrossRef CAS PubMed.
- S. L. Cheng, X. P. Yin, S. Sarkar, Z. W. Wang, Q. A. Huang, J. J. Zhang and Y. F. Zhao, Rare Met., 2022, 41, 2645 CrossRef CAS.
- X. Yin, T. Liu, X. Yin, X. Feng, Y. Liu, Q. Shi, X. Zou and Y. Zhao, Chin. Chem. Lett., 2023, 34, 107840 CrossRef CAS.
- G.-Y. Liu, Y.-Y. Zhao, Y.-F. Tang, X.-D. Liu, M. Liu and P.-J. Wu, Rare Met., 2020, 39, 1063 CrossRef CAS.
- S. Lee, H. Kim, J.-H. Lee, B.-K. Kim, H. Shin, J. Kim and S. Park, Nano Energy, 2021, 79, 105480 CrossRef CAS.
- H. Sun, G. Xin, T. Hu, M. Yu, D. Shao, X. Sun and J. Lian, Nat. Commun., 2014, 5, 4526 CrossRef CAS.
- D. Li, X. Li, S. Wang, Y. Zheng, L. Qiao and D. He, ACS Appl. Mater. Interfaces, 2014, 6, 648 CrossRef CAS PubMed.
- J. Zhu, Z. Yin, D. Yang, T. Sun, H. Yu, H. E. Hoster, H. H. Hng, H. Zhang and Q. Yan, Energy Environ. Sci., 2013, 6, 987 RSC.
- Y. Jian, H. Liu, J. Zhu, Y. Zeng, Z. Liu, C. Hou and S. Pu, RSC Adv., 2020, 10, 42860 RSC.
- Q. Li, T. Li, S. Chang, Q. Tao, B. Tian and J. Zhang, CrystEngComm, 2016, 18, 5074 RSC.
- H. Xu, P. Reunchan, S. Ouyang, H. Tong, N. Umezawa, T. Kako and J. Ye, Chem. Mater., 2013, 25, 405 CrossRef CAS.
- Z. Tong, S. Liu, Y. Zhou, J. Zhao, Y. Wu, Y. Wang and Y. Li, Energy Storage Mater., 2018, 13, 223 CrossRef.
- X. Wang, X. Yin, X. Feng, Y. Li, X. Dong, Q. Shi, Y. Zhao and J. Zhang, Chem. Eng. J., 2021, 428, 130990 CrossRef.
Footnote |
| † Electronic supplementary information (ESI) available. See DOI: https://doi.org/10.1039/d4ra03616f |
| This journal is © The Royal Society of Chemistry 2024 |