 Open Access Article
Catalytic conversion of residual raw material into biodiesel using a superior magnetic solid acid catalyst based on Zn–Fe ferrite: thermodynamic and kinetic studies
Matheus Arrais Gonçalves,
Hiarla Cristina Lima dos Santos,
Paula Maria Melo da Silva,
Ana Paula da Luz Corrêa,
Thaissa Saraiva Ribeiro,
Izadora de Araújo Sobrinho,
Geraldo Narciso da Rocha Filho and
Leyvison Rafael Vieira da Conceição
 *
*
Federal University of Pará, Institute of Exact and Natural Sciences, Graduate in Chemistry Program, Laboratory of Catalysis and Oleochemical, 66075-110, Belém, Pará, Brazil. E-mail: rafaelvieira@ufpa.br
First published on 1st July 2024
Abstract
This study investigates the potential and applicability of a novel solid magnetic catalyst constructed by incorporating molybdenum oxide (MoO3) into zinc ferrite (ZnFe2O4) to biodiesel production using Waste Frying Oil (WFO) as the residual raw material. The molybdenum amounts (5, 15, 25, 35 and 45%) present in the catalyst were studied and the catalyst demonstrated great characteristics and high acid properties, as well as superior magnetic and catalytic attributes. The one variable at time (OVAT) optimization method revealed that the application of the MoO3/ZnFe2O4 catalyst resulted in obtaining a biodiesel with 97.6% ± 0.727 conversion to fatty acid methyl esters (FAME) under the following optimized reaction conditions: temperature of 165 °C, methanol![[thin space (1/6-em)]](https://www.rsc.org/images/entities/char_2009.gif) :
:![[thin space (1/6-em)]](https://www.rsc.org/images/entities/char_2009.gif) WFO molar ratio of 40
WFO molar ratio of 40![[thin space (1/6-em)]](https://www.rsc.org/images/entities/char_2009.gif) :
:![[thin space (1/6-em)]](https://www.rsc.org/images/entities/char_2009.gif) 1, catalyst amount of 6 wt% and reaction time of 3 h. In addition, the catalyst showed high reusability after six reaction cycles, with conversion to esters above 90%. Besides, the activation energy (Ea) calculated in the kinetic study was 25.3 kJ mol−1. Moreover, the properties of the synthesized biodiesel met the standards set by the ASTM D6751 and EN 14214, which indicates the high MoO3/ZnFe2O4 potential for industrial application with low energy consumption as well as minimal negative environmental impact.
1, catalyst amount of 6 wt% and reaction time of 3 h. In addition, the catalyst showed high reusability after six reaction cycles, with conversion to esters above 90%. Besides, the activation energy (Ea) calculated in the kinetic study was 25.3 kJ mol−1. Moreover, the properties of the synthesized biodiesel met the standards set by the ASTM D6751 and EN 14214, which indicates the high MoO3/ZnFe2O4 potential for industrial application with low energy consumption as well as minimal negative environmental impact.
1 Introduction
The increase in fuel demand and efforts to reduce pollution caused by greenhouse gas emissions have caused countries around the world to seek new alternative sources of clean and renewable energy, such as biodiesel. Biodiesel emerges as a clean energy alternative with great potential, due to the fact that it is obtained from the conversion of biomass into alkyl esters and has similar characteristics to petroleum diesel oil.1–3 Biodiesel is commonly produced by the transesterification reaction, consisting of the reaction of a short chain alcohol with a triglyceride source to obtain biodiesel (esters from fatty acids) and glycerol as co-product.4,5The cost of the biodiesel production could be reduced by the use of residual feedstocks, with low quality and low added value, such as waste frying oil (WFO), animal fats, etc. WFO stands out among these residual raw materials studied due to its abundance and to the fact that it is obtained from various sources, such as restaurants, fast food places and food processing industries.6 However, low quality raw materials have a high percentage of free fatty acids (FFA), which makes it impossible to use basic catalysts due to the occurrence of parallel and unwanted reactions, such as saponification.7,8
In this respect, catalysts with acidic properties have gained prominence due to the fact that they are versatile and do not generate inconveniences when applied together with refined or residual raw materials.7 In addition, specifically heterogeneous acid catalysts have been widely studied due to the fact that they are more easily separated from the catalytic process. This does not occur with homogeneous catalysts, which cause problems such as corrosion and are hardly recovered at the end of the catalytic process.9,10
Heterogeneous catalysts such as zeolites, sulfonated carbons, mixed oxides, heteropolyacids and magnetic materials are widely applied and studied in the biodiesel production process.11–19 Among the wide range of heterogeneous catalysts reported in the literature, catalytic solids with magnetic properties have attracted attention because they reduce the costs of biodiesel production since they can be separated at the end of the process by applying a magnetic field, to the detriment of more expensive separation methods used, such as centrifugation.7,18
Thus, magnetic materials such as magnetite (Fe3O4) and ferrites (MFe2O4, M being a divalent metal), defined as magnetic mixed oxides, have been reported as promising catalysts for the transesterification reaction, especially when they are together with other oxides with catalytic properties (active phases), such as calcium oxide (CaO), potassium oxide (K2O), magnesium oxide (MgO), tungsten oxide (WO3) and molybdenum oxide (MoO3).7,20–22
Among the other oxides reported in the literature, MoO3 stands out due to its Brønsted acid property, as well as being applied industrially in several catalytic processes.11 The study reported by Cardoso et al.23 studied the use of the heterogeneous acid catalyst, composed of MoO3 impregnated in KIT-6 mesoporous silica, in the production of biodiesel and obtained 68.51% conversion into fatty acid methyl esters (FAME) under the following reaction conditions: temperature of 150 °C, reaction time of 3 h, catalyst amount of 3 wt% and methanol![[thin space (1/6-em)]](https://www.rsc.org/images/entities/char_2009.gif) :
:![[thin space (1/6-em)]](https://www.rsc.org/images/entities/char_2009.gif) WFO molar ratio of 20
WFO molar ratio of 20![[thin space (1/6-em)]](https://www.rsc.org/images/entities/char_2009.gif) :
:![[thin space (1/6-em)]](https://www.rsc.org/images/entities/char_2009.gif) 1. In the study reported by Torkzaban et al.,24 it was studied the application of the magnetic catalyst composed of CaO impregnated in ZnFe2O4 in the production of biodiesel and a biofuel with ester conversion content of 98% was obtained under the following reaction conditions: temperature of 65 °C, reaction time of 3 h, catalyst amount of 6 wt% and methanol
1. In the study reported by Torkzaban et al.,24 it was studied the application of the magnetic catalyst composed of CaO impregnated in ZnFe2O4 in the production of biodiesel and a biofuel with ester conversion content of 98% was obtained under the following reaction conditions: temperature of 65 °C, reaction time of 3 h, catalyst amount of 6 wt% and methanol![[thin space (1/6-em)]](https://www.rsc.org/images/entities/char_2009.gif) :
:![[thin space (1/6-em)]](https://www.rsc.org/images/entities/char_2009.gif) WFO molar ratio of 12
WFO molar ratio of 12![[thin space (1/6-em)]](https://www.rsc.org/images/entities/char_2009.gif) :
:![[thin space (1/6-em)]](https://www.rsc.org/images/entities/char_2009.gif) 1.
1.
In that regard, this study aims to fabricate a new magnetic acid catalyst by incorporating MoO3 into ZnFe2O4 and apply it in the transesterification reaction of WFO for biodiesel production. As far as we know, zinc ferrites as support for acid catalyst has not been applied in the process of transesterification reaction. The optimization of the catalytic process variables, such as temperature, methanol![[thin space (1/6-em)]](https://www.rsc.org/images/entities/char_2009.gif) :
:![[thin space (1/6-em)]](https://www.rsc.org/images/entities/char_2009.gif) WFO molar ratio, catalyst amount and time was performed using the OVAT methodology.
WFO molar ratio, catalyst amount and time was performed using the OVAT methodology.
2 Methodology
2.1 Materials
The WFO used as feedstock for biodiesel production was collected from a local market and its physicochemical properties are shown in Table 1 below. Zinc nitrate (Zn(NO3)2·6H2O, 99.8%) and iron III chloride (FeCl3, 99.8%) were acquired from Sigma-Aldrich and Synth, respectively. Ethyl alcohol (99.8%, C2H6O), methyl alcohol (99.8%, CH3OH) and nitric acid (37.0% HNO3), were acquired from Vetec. Besides, sodium hydroxide (97.0%, NaOH) and ammonium heptamolybdate ((NH4)6Mo7O24·4H2O) and were acquired from Dinamica. Finally, heptane (99%, C7H16) and hexane (99%, C6H14) were purchased from Êxodo as well as methyl heptadecanoate (99%, C18H36O2) was purchased from Sigma-Aldrich. All materials applied in this study were used as received.| Properties | Value |
|---|---|
| Acid value, (mg KOH per g) (AOCS Cd 3d-63) | 4.2 |
| Saponification value, (mg KOH per g) (AOCS Tl 1a-64) | 188.3 |
| Viscosity at 40 °C, (mm2 s−1) | 34.4 |
| Moisture content (%) (AOCS Ca 2b-38) | 0.1 |
| Molecular weight, (g mol−1) | 856 |
2.2 Preparation of zinc ferrite (ZnFe2O4)
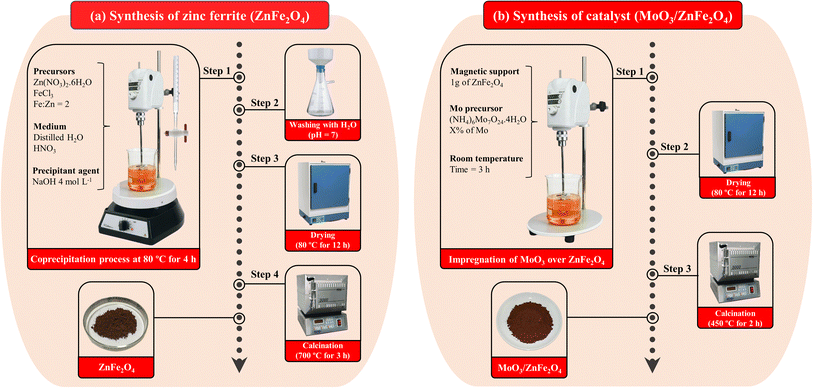
The coprecipitation methodology was used for the synthesis of zinc ferrite according to the procedure adopted by Torkzaban et al.,24 with adaptations. The synthesis process was performed in four steps, as shown in Fig. 1(a). In step 1, a certain mass of Zn(NO3)2·6H2O and FeCl3 was added to 80 mL of distilled water, considering the molar ratio Fe![[thin space (1/6-em)]](https://www.rsc.org/images/entities/char_2009.gif) :
:![[thin space (1/6-em)]](https://www.rsc.org/images/entities/char_2009.gif) Zn = 2, followed by the addition of a certain amount of HNO3 until pH = 3 and subsequently NaOH (4.0 mol L−1), as a precipitating agent, until pH = 12 is reached. Then, the system was kept under mechanical agitation and heating for 4 h at 85 °C. In step 2, the precipitated material obtained was washed with distilled water until pH = 7, followed by drying the material in an oven at 80 °C overnight, as shown in step 3. Finally, in step 4, the material was calcined at 700 °C/3 h in order to obtain ZnFe2O4.
Zn = 2, followed by the addition of a certain amount of HNO3 until pH = 3 and subsequently NaOH (4.0 mol L−1), as a precipitating agent, until pH = 12 is reached. Then, the system was kept under mechanical agitation and heating for 4 h at 85 °C. In step 2, the precipitated material obtained was washed with distilled water until pH = 7, followed by drying the material in an oven at 80 °C overnight, as shown in step 3. Finally, in step 4, the material was calcined at 700 °C/3 h in order to obtain ZnFe2O4.
2.3 Preparation of heterogeneous acid magnetic catalyst (MoO3/ZnFe2O4)
The wet impregnation methodology over three steps, according to the methodology adopted by Dos Santos et al.20 was used to synthesized the MoO3/ZnFe2O4 catalyst, as can be seen in Fig. 1(b). In step 1, 1.0 g of ZnFe2O4 and a certain amount of (NH4)6Mo7O24·4H2O was added to a beaker containing 50 mL of water, in order to obtain catalysts with molybdenum metal contents of 5, 15, 25, 35 and 45%. The system was kept under mechanical agitation for 3 h at room temperature. In step 2, the material was dried in an oven at 75 °C overnight and calcined at 450 °C/2 h (step 3), in order to obtain the catalyst μ-MoO3/ZnFe2O4, where μ corresponds to the content of molybdenum present in the catalyst composition.2.4 Materials characterization
The surface acidity of the materials was identified by using Boehm25 methodology, with adaptations. This method consists of a suspension, in a solution of NaOH (0.1 mol L−1), of 0.1 g of the sample, keeping the system stirring at 25 °C for 4 h. Subsequently, the suspension is separated magnetically and the supernatant is titrated with a solution of HCl (0.1 mol L−1), using phenolphthalein as an indicator.The MoO3, ZnFe2O4 and MoO3/ZnFe2O4 were analyzed using X-ray diffraction (XRD), Fourier transform infrared spectroscopy (FTIR), scanning electron microscopy (SEM), energy dispersion X-ray spectroscopy (EDS) and vibrating sample magnetometer (VSM) to determine their composition, surface morphology and magnetic properties, respectively. XRD was performed using a BRUKER diffractometer, model D8 ADVANCE. The radiation used was Cu Kα (1.541874 Å) with 40 kV and 30 mA and the scan interval was from 8° to 90°, with an angular step of 0.02 and a time per step of 0.01 seconds. In addition, Fourier transform infrared spectroscopy (FTIR) was performed from 2000 cm−1 to 400 cm−1, with 32 scans resolution of 4 cm−1 using a BRUKER spectrometer, model Vertex 70 V. The scanning electron microscopy (SEM) was performed using a Vega 3 LMU tescan microscope as well as the analysis of the surface elemental composition of the materials was performed by energy dispersion X-ray spectroscopy (EDS) using an Oxford Microanalysis system®, Aztec Energy X-Act model, with 129 eV resolution. Finally, the VSM was performed in a magnetic field in the range of −20![[thin space (1/6-em)]](https://www.rsc.org/images/entities/char_2009.gif) 000 oersted (Oe) at 20
000 oersted (Oe) at 20![[thin space (1/6-em)]](https://www.rsc.org/images/entities/char_2009.gif) 000 Oe, at room temperature, by using a model MICROSENSE magnetometer EZ9.
000 Oe, at room temperature, by using a model MICROSENSE magnetometer EZ9.
2.5 Transesterification experiments
The transesterification experiments of WFO were performed in a PARR 5000 series reactor, with constant agitation at 900 revolutions per minute (rpm). The influence of molybdenum content (5, 15, 25, 35 and 45%) on biodiesel production was initially studied. After the study of molybdenum concentrations and the choice of catalyst, the parameters of the transesterification reaction were studied using OVAT technique in the following ranges: reaction temperature (120–180 °C), methanol![[thin space (1/6-em)]](https://www.rsc.org/images/entities/char_2009.gif) :
:![[thin space (1/6-em)]](https://www.rsc.org/images/entities/char_2009.gif) WFO molar ratio (10
WFO molar ratio (10![[thin space (1/6-em)]](https://www.rsc.org/images/entities/char_2009.gif) :
:![[thin space (1/6-em)]](https://www.rsc.org/images/entities/char_2009.gif) 1–50
1–50![[thin space (1/6-em)]](https://www.rsc.org/images/entities/char_2009.gif) :
:![[thin space (1/6-em)]](https://www.rsc.org/images/entities/char_2009.gif) 1), catalyst amount (2–10 wt%) and reaction time (1–5 h). The catalytic performance of only ZnFe2O4 as well as the reaction performed without the presence of the catalytic solid were also evaluated.
1), catalyst amount (2–10 wt%) and reaction time (1–5 h). The catalytic performance of only ZnFe2O4 as well as the reaction performed without the presence of the catalytic solid were also evaluated.
The products obtained, at the end of each reaction, were separated from the catalyst magnetically, and the mixture was transferred into a 500 mL separatory funnel for separation of the esters (upper phase) from glycerol (lower phase). The glycerol was removed, and the ester phase was washed with portions of hot distilled water (80 °C) in order to promote the removal of residual glycerol and unreacted alcohol. This procedure was carried out five times to assure total glycerol removal. Finally, the residual water from the washing stage was removed by drying the ester phase in an oven at 60 °C for 24 h. Then, synthesized biodiesel was stored under refrigeration and analyzed by gas chromatography (GC) in order to determine the FAME (%).
2.6 Determination of biodiesel properties
The methodology adapted from the European Standard EN14103 described by Dos Santos et al.20 was used to determine FAME percentage in the biodiesels produced. In that regard, it was used the Varian chromatograph, model CP-3800, equipped with flame ionization detector (FID) and capillary column CP WAX 52 CB (30 m long, 0.32 mm diameter and 0.25 μm film). Besides, helium gas was used as a mobile phase with a flow of 1.0 mL min−1 and initial oven temperature programming of 170 °C, with heating rate of 10 °C min−1 up to 250 °C (same temperature as FID and injector). Methyl heptadecanoate as internal standard, with injection volume of 1.0 μL and heptane was used as solvent. The FAME (%) was calculated according to eqn (1):
 | (1) |
2.7 Kinetic study
The kinetic study was performed in order to evaluate the effect of time and temperature variables on the catalytic process. According to Olubunmi et al.,26 the transesterification reaction mechanism can be represented in three steps, according to eqn (2), below:
 | (2) |
The eqn (3) shows the rate law of the transesterification reaction assuming that it occurs in a single step.
 | (3) |
Due to the excess of methanol employed in the present study, the methanol concentration was assumed to be constant, and in this case, the process is assumed to be of pseudo first order (eqn (4)) despite the previous eqn (3) has order 2.
 | (4) |
After reordering and integrating eqn (4), we obtain
and, consequently, from the origin to eqn (5), below:
| −ln(1 − XFAME) = kt | (5) |
The thermodynamic parameters of the catalytic process will also be studied. The activation energy (Ea) for the transesterification of WFO with methanol will be estimated by means of the linearized Arrhenius equation (eqn (6)), below.
ln![[thin space (1/6-em)]](https://www.rsc.org/images/entities/char_2009.gif) k = −Ea/RT + ln k = −Ea/RT + ln![[thin space (1/6-em)]](https://www.rsc.org/images/entities/char_2009.gif) A A
| (6) |
In addition, the enthalpy thermodynamic parameters (ΔH) and entropy (ΔS) will be determined by means of the Eyring–Polanyi eqn (7) as well as Gibbs free energy (ΔG) will be calculated by means of eqn (8), as follows:
 | (7) |
| ΔG = ΔH − TΔS | (8) |
2.8 Catalyst recovery study
The catalyst was recovered by applying a magnetic field and washed several times with polar and apolar solvents to remove impurities. Then, the catalyst was dried in an oven at 80 °C overnight and reused in the transesterification experiments.3 Results and discussion
3.1 Impact of active phase incorporated amounts
The impact of different molybdenum contents (active phase) on the final catalyst composition, concentrations of 5, 15, 25, 35 and 45%, were evaluated in the FAME values of the biodiesels produced, as shown in Fig. 2. All reactions involved in this step were performed under non-optimized conditions: reaction temperature of 150 °C, methanol![[thin space (1/6-em)]](https://www.rsc.org/images/entities/char_2009.gif) :
:![[thin space (1/6-em)]](https://www.rsc.org/images/entities/char_2009.gif) WFO molar ratio of 30
WFO molar ratio of 30![[thin space (1/6-em)]](https://www.rsc.org/images/entities/char_2009.gif) :
:![[thin space (1/6-em)]](https://www.rsc.org/images/entities/char_2009.gif) 1, catalyst amount of 6 wt% and reaction time of 3 h.
1, catalyst amount of 6 wt% and reaction time of 3 h.
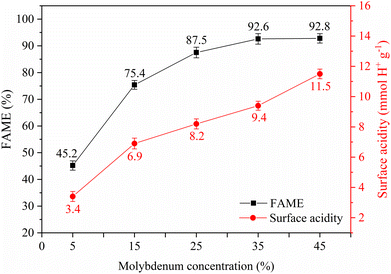 | ||
Fig. 2 Influence of molybdenum concentration (reaction conditions: reaction temperature of 150 °C, molar ratio methanol![[thin space (1/6-em)]](https://www.rsc.org/images/entities/char_2009.gif) : :![[thin space (1/6-em)]](https://www.rsc.org/images/entities/char_2009.gif) WFO of 30 WFO of 30![[thin space (1/6-em)]](https://www.rsc.org/images/entities/char_2009.gif) : :![[thin space (1/6-em)]](https://www.rsc.org/images/entities/char_2009.gif) 1, catalyst amount of 6 wt% and reaction time of 3 h). 1, catalyst amount of 6 wt% and reaction time of 3 h). | ||
It is observed that the conversion into esters using catalysts containing 5, 15, 25, 35 and 45% molybdenum were 45.2% ± 1.75, 75.4% ± 1.65, 87.5% ± 1.98, 92.6% ± 1.98 and 92.8% ± 1.75, respectively. In this regard, it is noticed the linear relationship between molybdenum content present in the catalyst composition and the availability of acidic sites in the catalysts, which results in increased conversion to methyl esters, since it is at the surface that ion exchange occurs throughout the transesterification reaction.7,22 Furthermore, it is observed, from Fig. 2, a linear relationship between the surface acidity values determined in catalysts with different molybdenum concentrations, since catalysts with molybdenum concentrations of 5, 15, 25, 35 and 45%, led to surface acidity values of 3.4 ± 0.332, 6.9 ± 0.354, 8.2 ± 0.332, 9.4 ± 0.296 and 11.5 ± 0.319 mmol H+ per g, respectively. It is trustworthy mentioning that the surface acidity of ZnFe2O4 was found to be considerably lower (1.5 mmol H+ per g ± 0.157) in relation to the acidity of the catalysts, since the increase in acidity in the catalysts is related to the acidic Brønsted sites of the impregnated MoO3.27 In this regard, the catalyst containing 35% molybdenum in its composition was chosen due to its superior catalytic performance in the biodiesel production process studied. The catalyst was named 35-MoO3/ZnFe2O4.
3.2 Characterization of the 35-MoO3/ZnFe2O4 catalyst
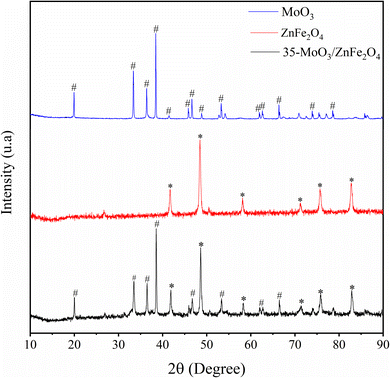
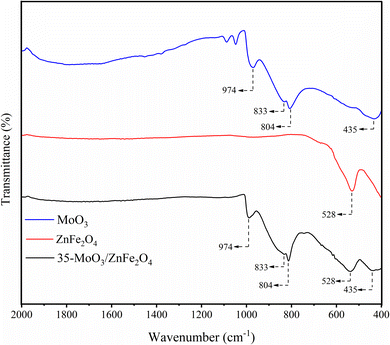
The X-ray diffraction patterns provide a valuable information about the phases present in the materials according to the intensity and diffraction angles. In that sense, the Fig. 3 shows the X-ray diffraction patterns referring to MoO3 (in blue) and it is perceived the presence of characteristic peaks of MoO3 in 19.9°, 33.4°, 36.4°, 38.6°, 41.4°, 45.8°, 46.7°, 48.9°, 53.3°, 61.9°, 62.6°, 66.4°, 73.9° and 78.5°.27–29 Besides, the diffractogram referring to ZnFe2O4 (in red) shows the presence of peaks characteristic of the spinel structure of ZnFe2O4 at 41.7°, 48.5°, 58.2°, 71.1°, 75.7° and 82.7°.24,30 Finally, in the diffractogram for the 35-MoO3/ZnFe2O4 catalyst (in black) it is perceived the occurrence of peaks characteristics of both MoO3 (19.9°, 33.5°, 36.5°, 38.5°, 46.7°, 53.4°, 61.9° and 66.5°) and ZnFe2O4 (41.9°, 48.6°, 58.3°, 71.5°, 75.8°, and 82.9°) structures, suggesting that the catalyst composition consists of both materials.The FTIR technique is very useful to investigate and identify, qualitatively, the functional groupings present in the materials. In that regard, the Fig. 4 shows the FTIR spectra of MoO3 (in blue) and it is realized the presence of bands at 435, 804, 833 and 974 cm−1, characteristics of Mo–O and O–Mo–O stretch bond vibrations.11,31 In the ZnFe2O4 spectrum (in red), a band characteristic of the octahedral and tetrahedral sites of the spinel phase of ferrite is identified at 528 cm−1.24,30 Furthermore, in the spectrum referring to the 35-MoO3/ZnFe2O4 catalyst (in black), the bands identified in 528 cm−1 are related to the spinel phase of ferrite, used as a catalytic support as well as the bands identified at 435, 804, 833 and 974 cm−1 indicate the presence of MoO3 in the catalyst.
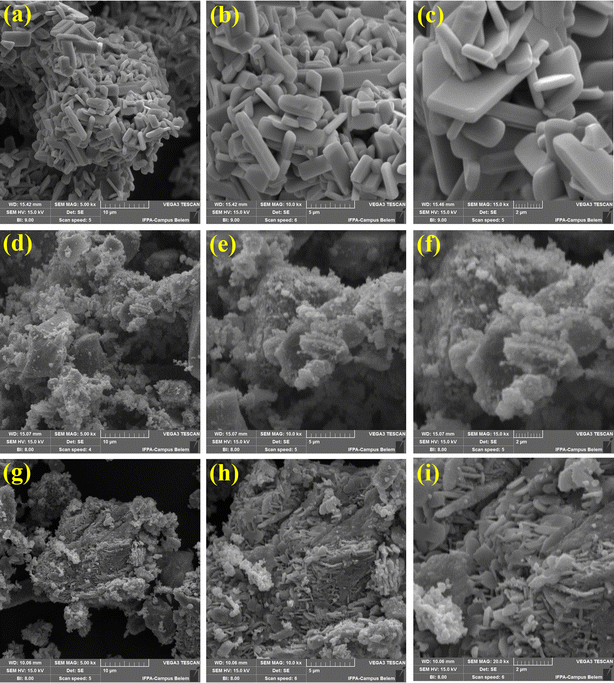
The surface morphology of the materials are shown in Fig. 5. The micrographs regarding MoO3 (Fig. 5(a)–(c)) present a material formed by a rod cluster with characteristic morphology of the MoO3 structure synthesized at temperatures around 400 °C.32 In Fig. 5(d)–(f), the micrographs referring to ZnFe2O4 suggest that there is no defined morphology for this ferrite, according to what is reported in the literature.30 Besides, In Fig. 5(g)–(i), the micrographs referring to the 35-MoO3/ZnFe2O4 catalyst show the presence of rods characteristic of the MoO3 coating the surface of the ZnFe2O4 ferrite, which suggests the efficiency of the wet impregnation method adopted.
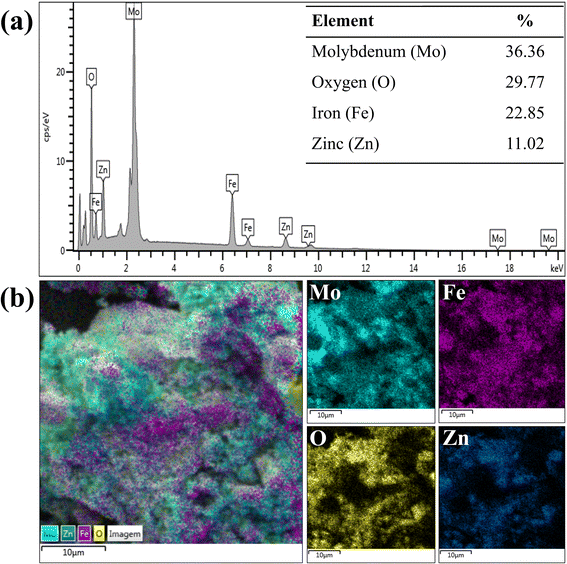
The composition and elemental maps relating to the components of the catalyst are shown in Fig. 6. The catalyst composition (Fig. 6(a)) indicates the presence of 36.36% molybdenum in its composition, a value similar to the desired percentage of 35%. In addition, the percentages of iron (22.85%) and zinc (11.02%) obtained indicate a Fe![[thin space (1/6-em)]](https://www.rsc.org/images/entities/char_2009.gif) :
:![[thin space (1/6-em)]](https://www.rsc.org/images/entities/char_2009.gif) Zn ratio of 2.07, a value close to that of the Fe
Zn ratio of 2.07, a value close to that of the Fe![[thin space (1/6-em)]](https://www.rsc.org/images/entities/char_2009.gif) :
:![[thin space (1/6-em)]](https://www.rsc.org/images/entities/char_2009.gif) Zn = 2 ratio that was intended to be obtained in the synthesis step of ZnFe2O4 ferrite. Finally, in Fig. 6(b), the elemental map of the catalyst indicate the high dispersion of all elements present in the 35-MoO3/ZnFe2O4 catalyst as there is a high intensity of colors representing each element throughout the image.
Zn = 2 ratio that was intended to be obtained in the synthesis step of ZnFe2O4 ferrite. Finally, in Fig. 6(b), the elemental map of the catalyst indicate the high dispersion of all elements present in the 35-MoO3/ZnFe2O4 catalyst as there is a high intensity of colors representing each element throughout the image.
 | ||
| Fig. 6 EDS composition of (a) catalyst 35-MoO3/ZnFe2O4 and (b) elemental maps of each component of the catalyst 35-MoO3/ZnFe2O4. | ||
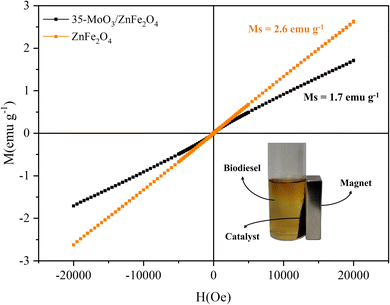
The magnetic properties of the zinc ferrite and the catalyst were measured using the VSM technique, by obtaining magnetization (M) and applied magnetic field (H) plots, as shown in Fig. 7. The values of saturation magnetization (Ms), obtained for ZnFe2O4 was 2.6 emu g−1, while for 35-MoO3/ZnFe2O4 was 1.7 emu g−1.
The heat treatment for the formation of MoO3 may have affected the orientation of the zinc ferrite spins and consequently the magnetic moment of the material which could explain the decrease in the Ms value from ZnFe2O4 to 35-MoO3/ZnFe2O4.7,20 However, the Ms value obtained for the catalyst is sufficient for separation of the catalyst through the application of a magnetic field as depicted in the Fig. 7. Besides, the Ms value of the catalyst developed in his study is superior to the Ms value of other catalytic magnetic solids applied to the production of biodiesel reported in the literature, as shown in Table 2.
3.3 Effect of catalyst use on FAME
The OVAT methodology was used to optimize the parameters of the transesterification reaction, such as reaction temperature, methanol![[thin space (1/6-em)]](https://www.rsc.org/images/entities/char_2009.gif) :
:![[thin space (1/6-em)]](https://www.rsc.org/images/entities/char_2009.gif) WFO molar ratio, catalyst amount and reaction time. The results arising from the effects of each variable on the ester content of biodiesels are shown in Fig. 8.
WFO molar ratio, catalyst amount and reaction time. The results arising from the effects of each variable on the ester content of biodiesels are shown in Fig. 8.
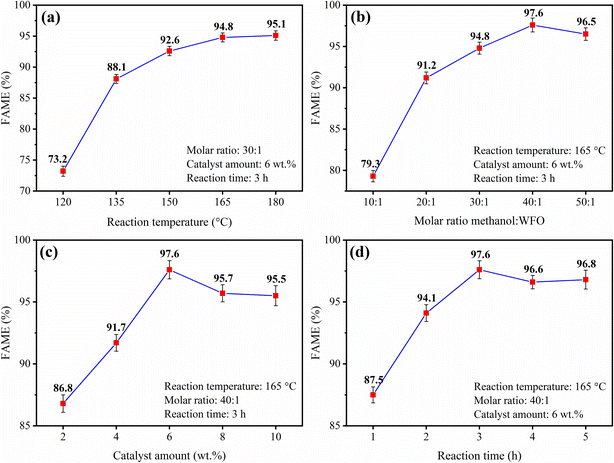 | ||
Fig. 8 Effect of (a) reaction temperature, (b) molar ratio methanol![[thin space (1/6-em)]](https://www.rsc.org/images/entities/char_2009.gif) : :![[thin space (1/6-em)]](https://www.rsc.org/images/entities/char_2009.gif) WFO, (c) catalyst amount and (d) reaction time. WFO, (c) catalyst amount and (d) reaction time. | ||
The study of optimization of the reaction temperature, shown in Fig. 8(a), was conducted in the range of 120 °C to 180 °C, keeping constant the variables of methanol![[thin space (1/6-em)]](https://www.rsc.org/images/entities/char_2009.gif) :
:![[thin space (1/6-em)]](https://www.rsc.org/images/entities/char_2009.gif) WFO molar ratio, catalyst amount and reaction time, in 30
WFO molar ratio, catalyst amount and reaction time, in 30![[thin space (1/6-em)]](https://www.rsc.org/images/entities/char_2009.gif) :
:![[thin space (1/6-em)]](https://www.rsc.org/images/entities/char_2009.gif) 1, 6 wt% and 3 h, respectively. The results show an increase in conversion to esters as the reaction temperature rises, with the highest conversion to esters of 95.1% ± 0.765 obtained in the reaction performed at 180 °C. This tendency is similar to that reported by Torkzaban et al.,24 in which the authors evaluated the application of the CaO/ZnFe2O4 catalyst in the methyl transesterification of WFO. Such results are due to the fact that the increase in temperature provides an increase in the collision of the reactant molecules and favors an increase in miscibility and mass transfer, which, in turn, leads to a bond breaking and cleavage as well as it causes an increase in the FAME of the synthesized biodiesels.14,16,17 However, the reaction temperature at 165 °C was selected as the optimal value, since the biodiesel produced at this temperature presented an ester content of 94.8% ± 0.727, a value extremely close to the biodiesel synthesized at 180 °C, but with lower energy expenditure.
1, 6 wt% and 3 h, respectively. The results show an increase in conversion to esters as the reaction temperature rises, with the highest conversion to esters of 95.1% ± 0.765 obtained in the reaction performed at 180 °C. This tendency is similar to that reported by Torkzaban et al.,24 in which the authors evaluated the application of the CaO/ZnFe2O4 catalyst in the methyl transesterification of WFO. Such results are due to the fact that the increase in temperature provides an increase in the collision of the reactant molecules and favors an increase in miscibility and mass transfer, which, in turn, leads to a bond breaking and cleavage as well as it causes an increase in the FAME of the synthesized biodiesels.14,16,17 However, the reaction temperature at 165 °C was selected as the optimal value, since the biodiesel produced at this temperature presented an ester content of 94.8% ± 0.727, a value extremely close to the biodiesel synthesized at 180 °C, but with lower energy expenditure.
The effect of varying methanol![[thin space (1/6-em)]](https://www.rsc.org/images/entities/char_2009.gif) :
:![[thin space (1/6-em)]](https://www.rsc.org/images/entities/char_2009.gif) WFO molar ratio on conversion to biodiesel via transesterification reaction is shown in Fig. 8(b). This study was conducted in the methanol
WFO molar ratio on conversion to biodiesel via transesterification reaction is shown in Fig. 8(b). This study was conducted in the methanol![[thin space (1/6-em)]](https://www.rsc.org/images/entities/char_2009.gif) :
:![[thin space (1/6-em)]](https://www.rsc.org/images/entities/char_2009.gif) WFO molar ratio range from 10
WFO molar ratio range from 10![[thin space (1/6-em)]](https://www.rsc.org/images/entities/char_2009.gif) :
:![[thin space (1/6-em)]](https://www.rsc.org/images/entities/char_2009.gif) 1 to 50
1 to 50![[thin space (1/6-em)]](https://www.rsc.org/images/entities/char_2009.gif) :
:![[thin space (1/6-em)]](https://www.rsc.org/images/entities/char_2009.gif) 1, keeping constant the variables reaction temperature, catalyst amount and reaction time at 165 °C, 6 wt% and 3 h, respectively. From the analysis of the results, there is a linear relationship between the FAME and methanol
1, keeping constant the variables reaction temperature, catalyst amount and reaction time at 165 °C, 6 wt% and 3 h, respectively. From the analysis of the results, there is a linear relationship between the FAME and methanol![[thin space (1/6-em)]](https://www.rsc.org/images/entities/char_2009.gif) :
:![[thin space (1/6-em)]](https://www.rsc.org/images/entities/char_2009.gif) WFO molar ratio value used in the reaction in the range of 10
WFO molar ratio value used in the reaction in the range of 10![[thin space (1/6-em)]](https://www.rsc.org/images/entities/char_2009.gif) :
:![[thin space (1/6-em)]](https://www.rsc.org/images/entities/char_2009.gif) 1 to 40
1 to 40![[thin space (1/6-em)]](https://www.rsc.org/images/entities/char_2009.gif) :
:![[thin space (1/6-em)]](https://www.rsc.org/images/entities/char_2009.gif) 1. This is due to the excess of methanol used, considerably higher than the reaction stoichiometry of 3
1. This is due to the excess of methanol used, considerably higher than the reaction stoichiometry of 3![[thin space (1/6-em)]](https://www.rsc.org/images/entities/char_2009.gif) :
:![[thin space (1/6-em)]](https://www.rsc.org/images/entities/char_2009.gif) 1, leading the reaction in the direction of product formation, as well as increasing the miscibility of the catalyst in the reaction medium and providing greater opportunity for collisions between the reactant molecules.20,22 However, at a certain point, the high excess of methanol used causes saturation of the catalytic surface, which deactivates the catalyst, reducing the efficiency of transesterification, as can be seen with a methanol
1, leading the reaction in the direction of product formation, as well as increasing the miscibility of the catalyst in the reaction medium and providing greater opportunity for collisions between the reactant molecules.20,22 However, at a certain point, the high excess of methanol used causes saturation of the catalytic surface, which deactivates the catalyst, reducing the efficiency of transesterification, as can be seen with a methanol![[thin space (1/6-em)]](https://www.rsc.org/images/entities/char_2009.gif) :
:![[thin space (1/6-em)]](https://www.rsc.org/images/entities/char_2009.gif) WFO molar ratio of 50
WFO molar ratio of 50![[thin space (1/6-em)]](https://www.rsc.org/images/entities/char_2009.gif) :
:![[thin space (1/6-em)]](https://www.rsc.org/images/entities/char_2009.gif) 1.13 Among the biodiesels produced by varying the methanol
1.13 Among the biodiesels produced by varying the methanol![[thin space (1/6-em)]](https://www.rsc.org/images/entities/char_2009.gif) :
:![[thin space (1/6-em)]](https://www.rsc.org/images/entities/char_2009.gif) WFO molar ratio, the highest recorded value was an ester content of 97.6% ± 0.727 using the molar ratio of 40
WFO molar ratio, the highest recorded value was an ester content of 97.6% ± 0.727 using the molar ratio of 40![[thin space (1/6-em)]](https://www.rsc.org/images/entities/char_2009.gif) :
:![[thin space (1/6-em)]](https://www.rsc.org/images/entities/char_2009.gif) 1. However, it should be noted that the reaction using a molar ratio of 50
1. However, it should be noted that the reaction using a molar ratio of 50![[thin space (1/6-em)]](https://www.rsc.org/images/entities/char_2009.gif) :
:![[thin space (1/6-em)]](https://www.rsc.org/images/entities/char_2009.gif) 1 led to a biodiesel with a slight decrease in conversion to esters (FAME = 96.5% ± 0.755), since the excess methanol causes saturation of the catalytic surface, which can cause catalyst deactivation and lead to a decrease in the catalytic efficiency of the transesterification reaction.37 In this regard, the optimized methanol
1 led to a biodiesel with a slight decrease in conversion to esters (FAME = 96.5% ± 0.755), since the excess methanol causes saturation of the catalytic surface, which can cause catalyst deactivation and lead to a decrease in the catalytic efficiency of the transesterification reaction.37 In this regard, the optimized methanol![[thin space (1/6-em)]](https://www.rsc.org/images/entities/char_2009.gif) :
:![[thin space (1/6-em)]](https://www.rsc.org/images/entities/char_2009.gif) WFO molar ratio was of 40
WFO molar ratio was of 40![[thin space (1/6-em)]](https://www.rsc.org/images/entities/char_2009.gif) :
:![[thin space (1/6-em)]](https://www.rsc.org/images/entities/char_2009.gif) 1 (FAME = 97.6% ± 0.727).
1 (FAME = 97.6% ± 0.727).
The effect of varying the catalyst amount employed in the reaction process is shown in Fig. 8(c). This study was conducted in the catalyst amount range of 2 to 10 wt%, keeping the other variables constant at a reaction temperature of 165 °C, methanol![[thin space (1/6-em)]](https://www.rsc.org/images/entities/char_2009.gif) :
:![[thin space (1/6-em)]](https://www.rsc.org/images/entities/char_2009.gif) WFO molar ratio of 40
WFO molar ratio of 40![[thin space (1/6-em)]](https://www.rsc.org/images/entities/char_2009.gif) :
:![[thin space (1/6-em)]](https://www.rsc.org/images/entities/char_2009.gif) 1 and reaction time of 3 h. From the results presented, it can be seen a linear relationship between the FAME of the biodiesel produced and the catalyst amount employed in the process, especially when using catalyst amount up to 6 wt%, value that led to the biodiesel with the highest conversion value to esters (FAME = 97.6% ± 0.727). This tendency is related to the increase of acid sites present in the catalysts providing the increase of conversion to esters into biodiesels. However, when employing catalyst amounts with 8 wt% and 10 wt%, biodiesels are produced with values of FAME = 95.7% ± 0.693 and FAME = 95.5% ± 0.808, respectively. This slight decrease in conversion to esters when compared to the value obtained by using the catalyst amount of 6 wt% is due to the limitations of mass transfer and saturation of the active sites caused by the increase in the mass of catalyst used in the reaction medium.26 Thus, the optimized catalyst amount value selected was of 6 wt%.
1 and reaction time of 3 h. From the results presented, it can be seen a linear relationship between the FAME of the biodiesel produced and the catalyst amount employed in the process, especially when using catalyst amount up to 6 wt%, value that led to the biodiesel with the highest conversion value to esters (FAME = 97.6% ± 0.727). This tendency is related to the increase of acid sites present in the catalysts providing the increase of conversion to esters into biodiesels. However, when employing catalyst amounts with 8 wt% and 10 wt%, biodiesels are produced with values of FAME = 95.7% ± 0.693 and FAME = 95.5% ± 0.808, respectively. This slight decrease in conversion to esters when compared to the value obtained by using the catalyst amount of 6 wt% is due to the limitations of mass transfer and saturation of the active sites caused by the increase in the mass of catalyst used in the reaction medium.26 Thus, the optimized catalyst amount value selected was of 6 wt%.
The study of the reaction time in the biodiesel synthesis process is shown in Fig. 8(d). The studied range of reaction time was from 1 to 5 h, while the other variables were kept constant at: reaction temperature of 165 °C, methanol![[thin space (1/6-em)]](https://www.rsc.org/images/entities/char_2009.gif) :
:![[thin space (1/6-em)]](https://www.rsc.org/images/entities/char_2009.gif) WFO molar ratio of 40
WFO molar ratio of 40![[thin space (1/6-em)]](https://www.rsc.org/images/entities/char_2009.gif) :
:![[thin space (1/6-em)]](https://www.rsc.org/images/entities/char_2009.gif) 1 and catalyst amount of 6 wt%. It is observed from the data presented an increase in the ester content values of the biodiesels produced as an increase in the reaction time is provided, with a maximum ester content value of 97.6% ± 0.727 for the synthesized biodiesel with a reaction time of 3 h. However, the biodiesels synthesized in the reaction times of 4 h and 5 h demonstrate certain stability with a slight decrease in the ester contents, FAME = 96.6% ± 0.534 and FAME = 96.8% ± 0.759, respectively. This may be related to the reversibility of both esterification and transesterification reaction, since excessively long reaction times may contribute to the reaction proceeding in the opposite direction, thus disadvantaging the formation of products.27
1 and catalyst amount of 6 wt%. It is observed from the data presented an increase in the ester content values of the biodiesels produced as an increase in the reaction time is provided, with a maximum ester content value of 97.6% ± 0.727 for the synthesized biodiesel with a reaction time of 3 h. However, the biodiesels synthesized in the reaction times of 4 h and 5 h demonstrate certain stability with a slight decrease in the ester contents, FAME = 96.6% ± 0.534 and FAME = 96.8% ± 0.759, respectively. This may be related to the reversibility of both esterification and transesterification reaction, since excessively long reaction times may contribute to the reaction proceeding in the opposite direction, thus disadvantaging the formation of products.27
3.4 Characterization of the biodiesel produced
The characterization of the biodiesel produced was performed by analysing its physico-chemical properties in order to investigate its safe application in engines, according to the ASTM D6751 and EN 14214 standards, were: density at 15 °C, kinematic viscosity at 40 °C, copper corrosivity, flash point, cold filter plugging point, acidity and FAME (Table 3).| Properties | Test methods | Limits | This study | |
|---|---|---|---|---|
| ASTM D6751 | EN 14214 | |||
| a NS = not specified. | ||||
| Density, at 15 °C (g cm−3) | ASTM D6850 | — | 0.86–0.90 | 0.879 |
| Kinematic viscosity, at 40 °C (mm2 s−1) | ASTM D445 | 1.9–6.0 | 3.5–5.0 | 4.29 |
| Copper strip corrosion | ASTM D130 | <3 | 1 | 1a |
| Flash point (°C) | ASTM D93 | >130 | >120 | 159 |
| Cold filter plugging point (°C) | ASTM D6371 | NSa | — | 0 |
| Acid value (mg KOH per g) | ASTM D664 | <0.8 | <0.5 | 0.21 |
| FAME (%) | EN 14103 | — | >96.5 | 97.6 |
The recorded values of density and viscosity were 0.879 g cm−3 and 4.29 mm2 s−1, respectively. These values are within the limits stipulated by international standards and suggest that the biodiesel will not cause problems in the lubrication of pumps and injectors by deposition of residues in the internal parts of the engine, to its atomization and in the process of burning in the combustion chamber.8,37 In addition to these properties, copper corrosivity is also related to the corrosion process on metal surfaces present in storage tanks and engine parts. The determined value of this property was 1a and complies with international standards, suggesting that the use of the biodiesel will not lead to corrosion problems, corroborating the recorded values of the density and viscosity properties. In addition, the other properties of the biodiesel, such as flash point, cold filter plugging point and acid value of 159 °C, 0 °C and 0.24 mg KOH per g, respectively, and were found to be adequate to international standards.38
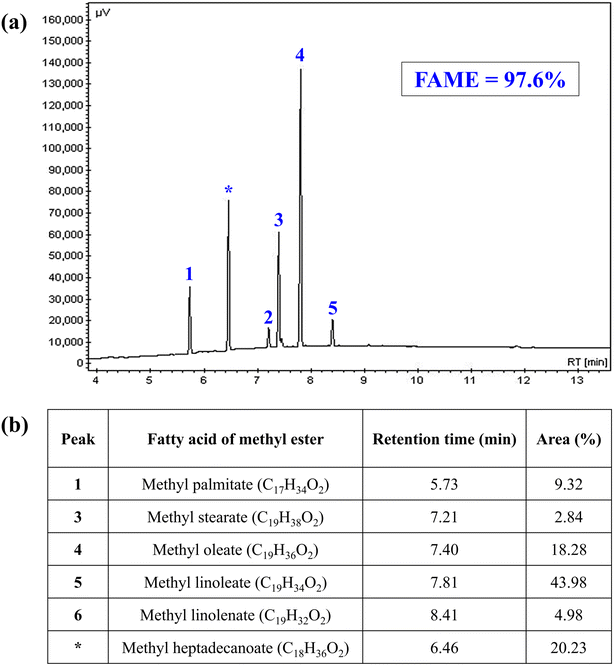
The FAME is the main property related to biodiesel, as it indicates the degree of purity of the biofuel produced and is directly related to the efficiency of the production process used. This property was determined by gas chromatography and the recorded value was FAME = 97.6% ± 0.727. In addition, the methyl ester composition of the biodiesel produced from WFO was obtained, as shown in Fig. 9. Through the analysis of the chromatogram present in Fig. 9(a), it is possible to perceive the presence of five peaks related to the composition of biodiesel from 1 to 5, and one relative to the internal standard used (*). Analyzing Fig. 9(b), the predominance of peak number 5 referring to methyl linoleate (43.98%) and peak number 4 referring to methyl oleate (18.28%) can be observed. Both values reported are in agreement with the data presented in the literature, given the predominance of linoleic and oleic acids in the composition WFO.21
3.5 Reusability study
After the optimization of the catalytic process, the catalytic stability of the catalyst when employing it in several reaction cycles was analyzed. In this regard, Fig. 10 shows the reusability study of the 35-MoO3/ZnFe2O4 catalyst performed under the following optimized conditions: reaction temperature of 165 °C, methanol![[thin space (1/6-em)]](https://www.rsc.org/images/entities/char_2009.gif) :
:![[thin space (1/6-em)]](https://www.rsc.org/images/entities/char_2009.gif) WFO molar ratio of 40
WFO molar ratio of 40![[thin space (1/6-em)]](https://www.rsc.org/images/entities/char_2009.gif) :
:![[thin space (1/6-em)]](https://www.rsc.org/images/entities/char_2009.gif) 1, catalyst amount of 6 wt% and reaction time of 3 h.
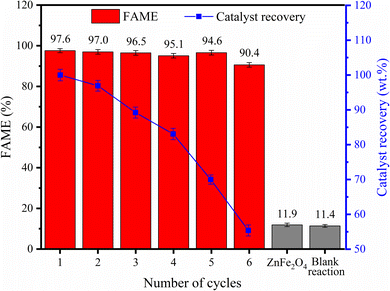
1, catalyst amount of 6 wt% and reaction time of 3 h.
It is possible to obtain 97.6% ± 0.727 FAME for biodiesel produced in the first cycle and maintain the ester content above 90% over 6 reaction cycles, which indicates the high catalytic performance of the catalyst developed. In addition, the efficiency of the 35-MoO3/ZnFe2O4 catalytic solid is proven when comparing the results obtained in the reactions performed only with the ZnFe2O4 support and in the blank reaction, with FAME of 11.9% ± 0.844 and 11.4% ± 0.675 respectively, since the presence of the 35-MoO3/ZnFe2O4 catalyst increases process performance considerably by more than 85%.
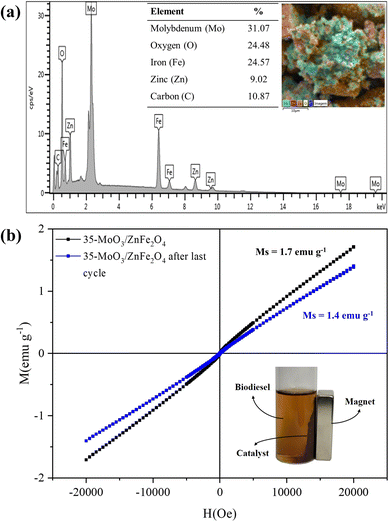
Fig. 11 shows the composition and magnetic behavior of the catalyst after the reaction cycles. Despite the high catalytic stability of the 35-MoO3/ZnFe2O4 catalyst, there is a slight decrease in FAME (about 7%) over the six reaction cycles, probably due to the decrease in molybdenum content (36.36% to 31.1%), shown in Fig. 11(a), because of the leaching phenomenon, since the active phase is slightly soluble in methanol.39,40 In that regard the leaching of the active phase decrease the quantity of active phase available which reduce the ability of the catalyst the speed up the reactions.1,40 This fact is corroborated by the decrease in the acidity of the catalyst surface from 9.4 mmol H+ per g ± 0.147 to 8.6 mmol H+ per g ± 0.228. In addition, the obstruction of the acid sites of the catalyst, due to the deposit of organic material (carbon content = 10.87%), shown in Fig. 11(a), is another factor that corroborates the slight decrease in catalytic performance.
 | ||
| Fig. 11 EDS composition of (a) recovered catalyst 35-MoO3/ZnFe2O4 and (b) magnetic hysteresis loop of the recovered catalyst 35-MoO3/ZnFe2O4. | ||
The magnetic property of the catalyst, after the sixth reaction cycle, shows, through the analysis of Fig. 11(b), a slight decrease in the value of saturation magnetization (Ms = 1.4 emu g−1), but it doesn't represent an obstacle and the catalyst can be separated without difficulty by applying a magnet as depicted in Fig. 11.
3.6 Feedstock evaluation
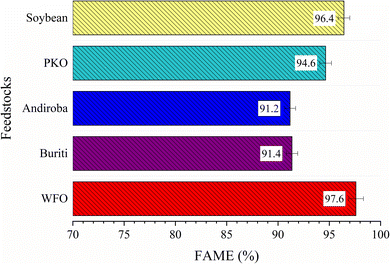
The robustness and applicability of the catalyst was evaluated for different feedstocks, such as soybean oil, waste frying oil (WFO), palm kernel oil (PKO), andiroba oil (Carapa guianensis), buriti oil (Mauritia flexuosa), and waste frying oil (WFO). In that regard, the Fig. 12 depicts that the tests performed with all feedstocks presented FAME above 90%, which indicates the robustness of the catalyst studied when applied in the transesterification reactions, since the catalyst is also efficient in the presence of both refined (with an acid value of less than 0.5 mg KOH per g, such as soybean oil and PKO) and low-quality feedstocks (with an acid value of 4.2, 33.8 and 18.8 mg KOH per g, for WFO, buriti and andiroba oil, respectively).3.7 Kinetic study
The kinetic study for the WFO transesterification process using the 35-MoO3/ZnFe2O4 catalyst was performed under the optimized reaction conditions, in the reaction time interval of 1 to 5 h, at four different temperatures: 120 °C, 135 °C, 150 °C and 165 °C, as shown in Fig. 13.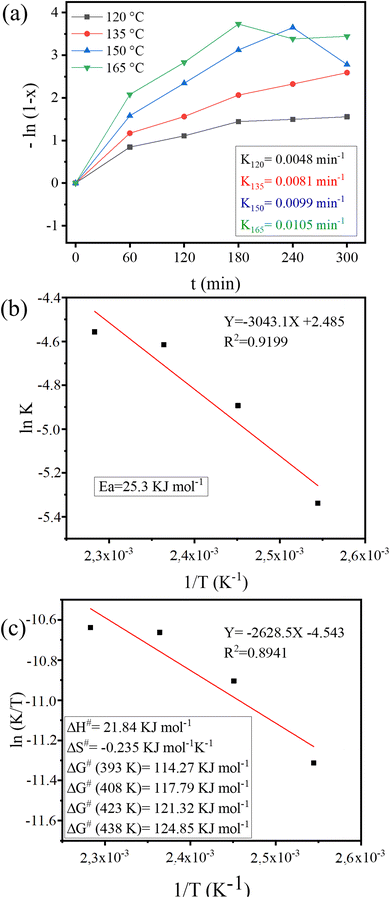 | ||
| Fig. 13 Plot of (a) −ln(1 − X) versus reaction time (t) at different temperatures, (b) Arrhenius for activation energy determination and (c) ln(K/T) versus 1/T. | ||
A linear behavior is perceived, from the analysis of the Fig. 13(a), typical of a (pseudo) first order reaction, as previously assumed. The activation energy (Ea) value for the transesterification of WFO with methanol estimated from the plot ‘ln![[thin space (1/6-em)]](https://www.rsc.org/images/entities/char_2009.gif) k’ vs. ‘1/T’ (eqn (6)), as shown in Fig. 13(b) was 25.3 kJ mol−1. The Ea value is similar to that reported in the literature for biodiesel production reactions.41–44
k’ vs. ‘1/T’ (eqn (6)), as shown in Fig. 13(b) was 25.3 kJ mol−1. The Ea value is similar to that reported in the literature for biodiesel production reactions.41–44
The enthalpy (ΔH), entropy (ΔS) and Gibbs free energy (ΔG) thermodynamic parameters for the transesterification reaction were calculated using the Eyring–Polanyi eqn (7) and (8). The values obtained (Fig. 13(c)) for ΔH, ΔS and ΔG, for different temperatures, were 21.84 kJ mol−1; −0.235 kJ mol−1 k−1; 114.27 kJ mol−1; 117.79 kJ mol−1; 121.32 kJ mol−1 and 124.85 kJ mol−1, respectively.
The ΔH > 0 indicates the endothermic nature of the reaction carried out.38 A higher ordering in the transition state when compared to the reactants is indicated by the ΔS < 0.40,44 Furthermore, ΔG > 0 indicates the endergonic nature and lack of spontaneity of the transesterification reaction performed.41,45
3.8 Comparative study of developed catalyst
The comparison of 35-MoO3/ZnFe2O4 catalyst with other solid acid catalysts applied to biodiesel production reported in the literature is shown in Table 4. Through the analysis of Table 4, the catalytic tests performed in this study present values of the reaction variables lower than reported in the literature, as in the case of reactions catalyzed by HPMo/TiO2, Nb2O5/SO4, HPM/Nb2O5, WO3/CuFe2O4 which used higher temperatures, increasing energy expenditure, compared to that performed in this study and presented similar catalytic conversion.9,10,16,20 In addition, it is worth mentioning that some studies used temperatures lower than reported in the present study, but with significantly higher reaction times, as in the case of studies using 25% MoO3/ZSM-5 and 5Mo/ZSM-22 catalysts with reaction times of 6 h and 12 h, respectively.11,12 Besides, it is worth noting that this study has an optimized molar ratio value considerably lower than that of other acid catalytic solids reported in the literature, as well as an equal or higher number of reaction cycles, such as FAME above 90% in the last cycle, which shows the stability and robustness of the 35-MoO3/ZnFe2O4 catalyst studied. In this regard, the 35-MoO3/ZnFe2O4 catalyst has high potential for use in the biodiesel production process, generating lower costs, considering its high catalytic performance and its easy separation through its magnetic property.| Catalyst | Feedstocks | Reaction conditions | FAME (%) | Number of cycles | Reference | |||
|---|---|---|---|---|---|---|---|---|
| T (°C) | Molar ratio | Catalyst amount (wt%) | t (h) | |||||
| MoO3/graphene | WCO | 140 | 35 | 6 | 5 | 95.6 | 5 | 1 |
| MoO3/SrFe2O4 | WCO | 164 | 40 | 10 | 4 | 95.4 | 8 | 7 |
| Nb2O5/SO4 | Macaw | 250 | 120 | 30 | 4 | 99.2 | 5 | 9 |
| HPMo/Nb2O5 | Macaw | 210 | 90 | 20 | 4 | 99.65 | 4 | 10 |
| 25% MoO3/ZSM-5 | Oleic acid | 160 | 20 | 3 | 6 | 98.0 | 6 | 11 |
| 5Mo/ZSM-22 | WCO | 140 | 9 | 2 | 12 | 78.2 | 4 | 12 |
| HPMo/TiO2 | WCO | 190 | 90 | 5 | 4 | 94.5 | 4 | 16 |
| WO3/CuFe2O4 | WCO | 180 | 45 | 6 | 3 | 95.2 | 6 | 20 |
| MoO3/KIT-6 | Soybean | 150 | 20 | 3 | 3 | 68.51 | — | 23 |
| MoO3 | Soybean | 150 | 45 | 0.5 | 4 | 93.0 | 8 | 27 |
| Fe2O3–MnO–SO4/ZrO2 | WCO | 180 | 20 | 3 | 6 | 96.0 | 6 | 46 |
| α-MoO3 | Soybean | 200 | 15 | 4 | 1 | 99.0 | 7 | 47 |
| 35-MoO3/ZnFe2O4 | WFO | 165 | 40 | 6 | 3 | 97.6 | 6 | Present study |
4 Conclusion
This work studied the application of the new magnetic acid solid catalyst in the transesterification reaction for biodiesel synthesis. From the characterization analyzes, the robustness of the synthesized catalyst was verified, which provided the production of a biodiesel with 97.6% ± 0.727 FAME under the following optimized reaction conditions: reaction temperature of 165 °C, methanol![[thin space (1/6-em)]](https://www.rsc.org/images/entities/char_2009.gif) :
:![[thin space (1/6-em)]](https://www.rsc.org/images/entities/char_2009.gif) WFO molar ratio of 40
WFO molar ratio of 40![[thin space (1/6-em)]](https://www.rsc.org/images/entities/char_2009.gif) :
:![[thin space (1/6-em)]](https://www.rsc.org/images/entities/char_2009.gif) 1, catalyst amount of 6 wt% and reaction time of 3 h. In the recyclability study, the catalyst showed stability over six reaction cycles, with FAME of 90.4% ± 1.115 in the last cycle. When evaluating the reaction process for different feedstocks, it was noticed the maintenance of catalytic efficiency, which proves the high versatility of the 35-MoO3/ZnFe2O4 catalyst. In addition, the transesterification reaction showed pseudo first order behavior, according to the kinetic study carried out, as well as ease of separation through the application of a magnetic field, which highlights that the high catalytic activity of the 35-MoO3/ZnFe2O4 catalyst in mild reaction conditions and together with its easy recyclability provide a process and production of biodiesel at lower cost and without high environmental damage.
1, catalyst amount of 6 wt% and reaction time of 3 h. In the recyclability study, the catalyst showed stability over six reaction cycles, with FAME of 90.4% ± 1.115 in the last cycle. When evaluating the reaction process for different feedstocks, it was noticed the maintenance of catalytic efficiency, which proves the high versatility of the 35-MoO3/ZnFe2O4 catalyst. In addition, the transesterification reaction showed pseudo first order behavior, according to the kinetic study carried out, as well as ease of separation through the application of a magnetic field, which highlights that the high catalytic activity of the 35-MoO3/ZnFe2O4 catalyst in mild reaction conditions and together with its easy recyclability provide a process and production of biodiesel at lower cost and without high environmental damage.
Data availability
Data are available upon request from the authors.Author contributions
Matheus Arrais Gonçalves: conceptualization, methodology, investigation, visualization, formal analysis, writing – original draft. Hiarla Cristina Lima dos Santos: methodology, resources, investigation. Paula Maria Melo da Silva: methodology, resources, investigation. Ana Paula da Luz Corrêa: methodology, resources, investigation. Thaissa Saraiva Ribeiro: methodology, resources, investigation. Izadora de Araújo Sobrinho: methodology, resources, investigation. Geraldo Narciso da Rocha Filho: supervision. Leyvison Rafael Vieira da Conceição: conceptualization, visualization, supervision, project administration, writing – review & editing.Conflicts of interest
Authors declare no conflict of interest.Acknowledgements
The authors thank the Graduate Program in Chemistry of the Federal University of Pará (UFPA), the Research Laboratory and Fuel Analysis (LAPAC/UFPA), the Laboratory of Catalysis and Oleochemical (LCO/UFPA), X-ray Diffraction Laboratory (PPGF/UFPA), Laboratory of Vibrational Spectroscopy and High Pressures (LEVAP/UFPA) and Metallurgy Laboratory of Federal Institute of Technical Education of Pará for structural support. The Coordenação de Aperfeiçoamento de Pessoal de Nível Superior (CAPES) for the financial support to the author in form of scholarship (finance code 001).References
- P. M. L. Silva, M. A. Gonçalves, A. P. L. Correa, P. T. S. Luz, J. R. Zamian, G. N. R. Filho and L. R. V. Conceição, Renew. Energy, 2023, 211, e01531, DOI:10.1016/j.renene.2023.04.131.
- T. S. Ribeiro, M. A. Gonçalves, G. N. R. Filho and L. R. V. Conceição, Molecules, 2023, 28, 7980, DOI:10.3390/molecules28247980.
- B. Zheng, L. Ban, Y. Nie, L. Chen, S. Yang and H. Zhang, J. Cleaner Prod., 2024, 453, 142263, DOI:10.1016/j.jclepro.2024.142263.
- L. He, L. Chen, B. Zheng, H. Zhou, H. Wang, H. Li, H. Zhang, C. C. Xu and S. Yang, Green Chem., 2023, 25, 7410–7440, 10.1039/D3GC02816J.
- R. P. Lima, P. T. S. Luz, M. Braga, P. R. Santos, C. E. F. Costa, J. R. Zamian, L. A. S. Nascimento and G. N. R. Filho, Ind. Crops Prod., 2017, 97, 536–544, DOI:10.1016/j.indcrop.2016.12.052.
- W. C. Ulakpa, R. O. E. Ulakpa, E. O. Eyankware and M. C. Egwunyenga, Cleaner Waste Syst., 2022, 3, 100049, DOI:10.1016/j.clwas.2022.100049.
- M. A. Gonçalves, E. K. L. Mares, J. R. Zamian, G. N. R. Filho and L. R. V. Conceição, Fuel, 2021, 304, 121463, DOI:10.1016/j.fuel.2021.121463.
- E. K. L. Mares, M. A. Gonçalves, P. T. S. Luz, G. N. R. Filho, J. R. Zamian and L. R. V. Conceição, Fuel, 2021, 299, 120887, DOI:10.1016/j.fuel.2021.120887.
- L. R. V. Conceição, L. M. Carneiro, J. D. Rivaldi and H. F. De Castro, Ind. Crops Prod., 2016, 89, 416–424, DOI:10.1016/j.indcrop.2016.05.044.
- L. R. V. Conceição, L. M. Carneiro, D. S. Giordani and H. F. De Castro, Renewable Energy, 2017, 113, 119–128, DOI:10.1016/j.renene.2017.05.080.
- S. Mohebbi, M. Rostamizadeh and D. Kahforoushan, Fuel, 2020, 266, 117063, DOI:10.1016/j.fuel.2020.117063.
- W. Zhang, C. Wang, B. Luo, P. He, L. Zhang and G. Hu, Biomass Bioenergy, 2022, 167, 106646, DOI:10.1016/j.biombioe.2022.106646.
- M. A. Gonçalves, H. C. L. Santos, T. S. Ribeiro, A. C. Viegas, G. N. R. Filho and L. R. V. Conceição, Arabian J. Chem., 2024, 17, 105521, DOI:10.1016/j.arabjc.2023.105521.
- A. P. L. Correa, P. M. L. Silva, M. A. Gonçalves, R. R. C. Bastos, G. N. R. Filho and L. R. V. Conceição, Arabian J. Chem., 2023, 16, 104964, DOI:10.1016/j.arabjc.2023.104964.
- M. A. Gonçalves, H. C. L. Santos, M. A. R. Silva, A. C. Viegas, G. N. R. Filho and L. R. V. Conceição, J. Ind. Eng. Chem., 2024, 135, 270–285, DOI:10.1016/j.jiec.2024.01.038.
- M. A. Gonçalves, E. K. L. Mares, P. T. S. Luz, J. R. Zamian, G. N. R. Filho, H. F. Castro and L. R. V. Conceição, J. Renewable Sustainable Energy, 2021, 13, 043101, DOI:10.1063/5.0048147.
- L. R. V. Conceição, C. E. R. Reis, R. Lima, D. V. Cortez and H. F. De Castro, RSC Adv., 2019, 9, 23450–23458, 10.1039/C9RA04300D.
- H. Wang, H. Zhou, Q. Yan, X. Wu and H. Zhang, Energy Convers. Manage., 2023, 297, 117758, DOI:10.1016/j.enconman.2023.117758.
- W. Xie and J. Li, Renewable Sustainable Energy Rev., 2023, 171, 113017, DOI:10.1016/j.rser.2022.113017.
- H. C. L. D. Santos, M. A. Gonçalves, A. C. Viegas, B. A. M. Figueira, P. T. S. Luz, G. N. R. Filho and L. R. V. Conceição, RSC Adv., 2022, 12, 34614, 10.1039/d2ra06923g.
- P. Zhang, Q. Han, M. Fan and P. Jiang, Appl. Surf. Sci., 2014, 317, 1125–1130, DOI:10.1016/j.apsusc.2014.09.043.
- R. Foroutan, S. J. Peighambardoust, R. Mohammadi, S. H. Peighambardoust and B. Ramavandi, Chemosphere, 2022, 289, 133226, DOI:10.1016/j.chemosphere.2021.133226.
- R. K. P. Cardoso, G. V. A. Silva, B. T. S. Alves, V. A. Freire, J. J. N. Alves and B. V. S. Barbosa, Arabian J. Chem., 2022, 15, 104074, DOI:10.1016/j.arabjc.2022.104074.
- S. Torkzaban, M. Feyzi and L. Norouzi, Renewable Energy, 2022, 200, 996–1007, DOI:10.1016/j.renene.2022.09.077.
- H. P. Boehm, Carbon, 1994, 32, 759–769, DOI:10.1016/0008-6223(94)90031-0.
- B. E. Olubunmi, A. F. Alade, S. O. Ebhodaghe and O. T. Oladapo, Energy Convers. Manage.: X, 2022, 14, 10022, DOI:10.1016/j.ecmx.2022.100221.
- B. F. Pinto, M. A. S. Garcia, J. C. S. Costa, C. R. V. Moura, W. C. Abreu and E. M. Moura, Fuel, 2019, 239, 290–296, DOI:10.1016/j.fuel.2018.11.025.
- L. P. B. Reddy, R. Megha, B. Chethan, H. G. R. Prakash, Y. T. Ravikiran and C. H. V. V. Ramana, Inorg. Chem. Commun., 2018, 98, 68–74, DOI:10.1016/j.inoche.2018.10.007.
- P. Thangasamy, V. Shanmugapriya and M. Sathish, Phys. E, 2018, 99, 189–193, DOI:10.1016/j.physe.2018.02.001.
- A. Ashok and L. J. Kennedy, Catal. Lett., 2019, 119, 3525–3542, DOI:10.1007/s10562-019-02906-4.
- Q. Ma, X. Li, G. Li and Z. Shao, Ionics, 2020, 27, 157–164, DOI:10.1007/s11581-020-03824-x.
- S. R. Dhage, M. S. Hassan and O. B. Yang, Mater. Chem. Phys., 2009, 114, 511–514, DOI:10.1016/j.matchemphys.2008.10.076.
- A. M. El-Nahas, T. A. Salaheldin, T. Zaki, H. H. El-Maghrabi, A. M. Marie, S. M. Morsy and N. K. Allam, Chem. Eng. J., 2017, 322, 167–180, DOI:10.1016/j.cej.2017.04.031.
- H. Nayebzadeh, F. Naderi and B. Rahmanivahid, Fuel, 2020, 271, 117595, DOI:10.1016/j.fuel.2020.117595.
- S. Kazemifard, H. Nayebzadeh, N. Saghatoleslami and E. Safakish, Environ. Sci. Pollut. Res., 2018, 25, 32811–32821, DOI:10.1007/s11356-018-3249-7.
- B. J. Xue, J. Luo, F. Zhang and Z. Fang, Energy, 2014, 68, 584–591, DOI:10.1016/j.energy.2014.02.082.
- M. A. Goncalves, H. C. L. Santos, T. S. Ribeiro, A. C. Viegas, G. N. R. Filho and L. R. V. Conceição, Arabian J. Chem., 2024, 17, 105521, DOI:10.1016/j.arabjc.2023.105521.
- O. A. Mawlid, H. H. Abdelhady and M. S. El-Deab, Energy Convers. Manage., 2022, 273, 116435, DOI:10.1016/j.enconman.2022.116435.
- V. L. Brito, M. A. Goncalves, H. C. L. Santos, G. N. R. Filho and L. R. V. Conceição, Renew. Energy, 2023, 215, 118947, DOI:10.1016/j.renene.2023.118947.
- M. A. Goncalves, H. C. L. Santos, M. A. R. Silva, A. C. Viegas, G. N. R. Filho and L. R. V. Conceição, J. Ind. Eng. Chem., 2024, 135, 270–285, DOI:10.1016/j.jiec.2024.01.038.
- M. Kaur, R. Malhotra and A. Ali, Renewable Energy, 2018, 116, 109–119, DOI:10.1016/j.renene.2017.09.065.
- D. G. Aranda, R. P. Santos, N. O. Tapanes, A. Ramos and O. Antunes, Catal. Lett., 2008, 122, 20–25, DOI:10.1007/s10562-007-9318-z.
- C. Muthukumaran, R. Praniesh, P. Navamani, R. Swathi, G. Sharmila and N. M. Kumar, Fuel, 2017, 195, 217–225, DOI:10.1016/j.fuel.2017.01.060.
- X. Liu, X. Piao, Y. Wang and S. Zhu, J. Phys. Chem. A, 2010, 114, 3750–3755, DOI:10.1021/jp9039379.
- H. Beall, J. Chem. Educ., 1994, 71, 1056–1057 CrossRef CAS.
- F. H Alhassan, U. Rashid and Y. Taufiq-Yap, Fuel, 2015, 142, 38–45, DOI:10.1016/j.fuel.2014.10.038.
- A. L. Silva, H. L. Pereira, H. B. Sales, J. K. Dionizio, M. C. F. Alves, D. G. Guedes, C. B. B. Luna and A. C. F. M. Costa, Molecules, 2024, 29, 2404, DOI:10.3390/molecules29102404.
| This journal is © The Royal Society of Chemistry 2024 |

