
 Open Access Article
 This Open Access Article is licensed under a Creative Commons Attribution-Non Commercial 3.0 Unported Licence
Impacts of polyethylene glycol (PEG) dispersity on protein adsorption, pharmacokinetics, and biodistribution of PEGylated gold nanoparticles†
Xinsheng Tian ab and
Yumin Yuan*b
ab and
Yumin Yuan*b
aInstitute of Smart Biomedical Materials, Zhejiang Sci-Tech University, Hangzhou 310018, China
bBiomatrik Inc., 501 Changsheng South Road, Nanhu, Jiaxing 314001, China. E-mail: yyuan@biomatrik.com
First published on 1st July 2024
Abstract
PEGylated gold nanoparticles (PEG-AuNPs) are widely used in drug delivery, imaging and diagnostics, therapeutics, and biosensing. However, the effect of PEG dispersity on the molecular weight (MW) distribution of PEG grafted onto AuNP surfaces has been rarely reported. This study investigates the effect of PEG dispersity on the MW distribution of PEG grafted onto AuNP surfaces and its subsequent impact on protein adsorption and pharmacokinetics, by modifying AuNPs with monodisperse PEG methyl ether thiols (mPEGn-HS, n = 36, 45) and traditional polydisperse mPEG2k-SH (MW = 1900). Polydisperse PEG-AuNPs favor the enrichment of lower MW PEG fractions on their surface due to the steric hindrance effect, which leads to increased protein adsorption. In contrast, monodisperse PEG-AuNPs have a uniform length of PEG outlayer, exhibiting markedly lower yet constant protein adsorption. Pharmacokinetics analysis in tumor-bearing mice demonstrated that monodisperse PEG-AuNPs possess a significantly prolonged blood circulation half-life and enhanced tumor accumulation compared with their polydisperse counterpart. These findings underscore the critical, yet often underestimated, impacts of PEG dispersity on the in vitro and in vivo behavior of PEG-AuNPs, highlighting the role of monodisperse PEG in enhancing therapeutic nanoparticle performance.
1 Introduction
Gold nanoparticles (AuNPs) have garnered considerable attention for drug delivery carriers,1,2 sensing,3 disease diagnosis,4,5 and treatment owing to their distinctive optical properties, high electron density, ample surface area, facile modification, and excellent biocompatibility.6 Moreover, AuNPs exhibit minimal or zero cytotoxicity to cells, making them valuable for nanomedicine applications.7–9 However, in vivo studies have revealed that most AuNPs are swiftly absorbed by mononuclear phagocytes, leading to their rapid sequestration in the liver and spleen, with inadequate delivery or targeting to diseased tissues.10,11 To address this challenge, preventing non-specific protein adsorption on the surface of AuNPs becomes crucial. Hence, surface modification of AuNPs with electrically neutral and highly hydrophilic “anti-fouling” polymers is essential. Such polymers possess the ability to resist the adsorption of nanoparticles by biomolecules, cells, and microorganisms.12–14 Among these, polyethylene glycol (PEG) emerges as the most commonly used “anti-fouling” polymer to modify AuNPs, effectively inhibiting non-specific protein attachment, prolonging the circulation time of nanoparticles, and enhancing their delivery efficiency to diseased tissues.15,16PEGylated gold nanoparticles (PEG-AuNPs), serving as nanocarriers, find extensive applications in anticancer therapy,17,18 antibiotic therapy,19 and stem cell therapy.20 For instance, doxorubicin can be efficiently attached to PEG-coated AuNPs for targeted cancer cell treatment.21 Okła E.22 and colleagues used PEG-AuNPs (AuNP14a and AuNP14b) coupled with therapeutic siRNA targeting the Alzheimer's disease gene (APOE4). The conjugated complexes exhibited low cytotoxicity, providing a foundation for further research into the use of gold nanoparticles in nucleic acid delivery. Utilizing mPEG-SH modified AuNPs allows for the covalent linkage of drugs and other biomolecules, facilitating improved drug biodistribution23 and cellular uptake24 by linking to target cells in vitro25 and tissue antibodies in vivo. Hence, it is crucial to undertake additional research to enhance the effectiveness of surface protein resistivity for PEG-AuNPs.
The molecular weight (MW), density, and conformation of PEG play crucial roles in inhibiting non-specific protein adsorption.26–28 In a study conducted by Perera29 et al., 20 nm AuNPs were modified with mPEG-HS (MW = 5k, 10k, 30k Da) of varying MWs, and their resistance to different proteins was investigated. The findings revealed that as the MW of PEG increased, its resistance to protein adsorption weakened. This trend is attributed to the decrease in the grafting density of PEG on the surface of AuNPs as the MW of PEG increases. Another study by Ahmed Alalaiwe30 et al. examined the pharmacokinetics of 4 nm AuNPs in mice when modified with mPEG-HS (MW = 1k, 2k, 5k Da) of different MWs. The results indicated that as the MW of PEG increased, the circulation time of AuNPs in the body decreased. Furthermore, the modification of PEG improved the blood half-life of gold nanorods, and an increase in PEG density extended the blood half-life to 24 h.31 These studies underscore the importance of increasing the grafting density on the surface of AuNPs. However, the current use of polydisperse PEG with non-uniform MWs hampers its effectiveness in resisting protein adsorption. For instance, gold flakes modified with monodisperse mPEG-SH (MW = 752 Da) exhibit a protein adsorption level in fetal bovine serum (FBS) comparable to that of polydisperse mPEG-SH (MW = 2k Da).32
In this investigation, we assess the impact of PEG dispersity on protein adsorption, and their pharmacokinetics and biodistribution of PEG-AuNPs in a murine model (Fig. 1). We employed monodisperse mPEGn-SH (n = 36, 45) and polydisperse mPEG2k-SH (MW = 1900) to achieve saturated grafting densities on the surfaces of AuNPs. Using a thermogravimetric analyzer and a Fourier transform ion cyclotron resonance mass spectrometer (FT-ICR MS), we measured the grafting density and MW distribution of PEG on the monodisperse and polydisperse PEG-AuNPs. Additionally, we conducted in vitro protein adsorption assays with bovine serum albumin (BSA), FBS, and human serum, and performed in vivo experiments in a CT26 colon cancer model established in Balb/c nude mice. These studies collectively provide critical insights that could guide the future utilization of monodisperse PEG in various biomedical applications.
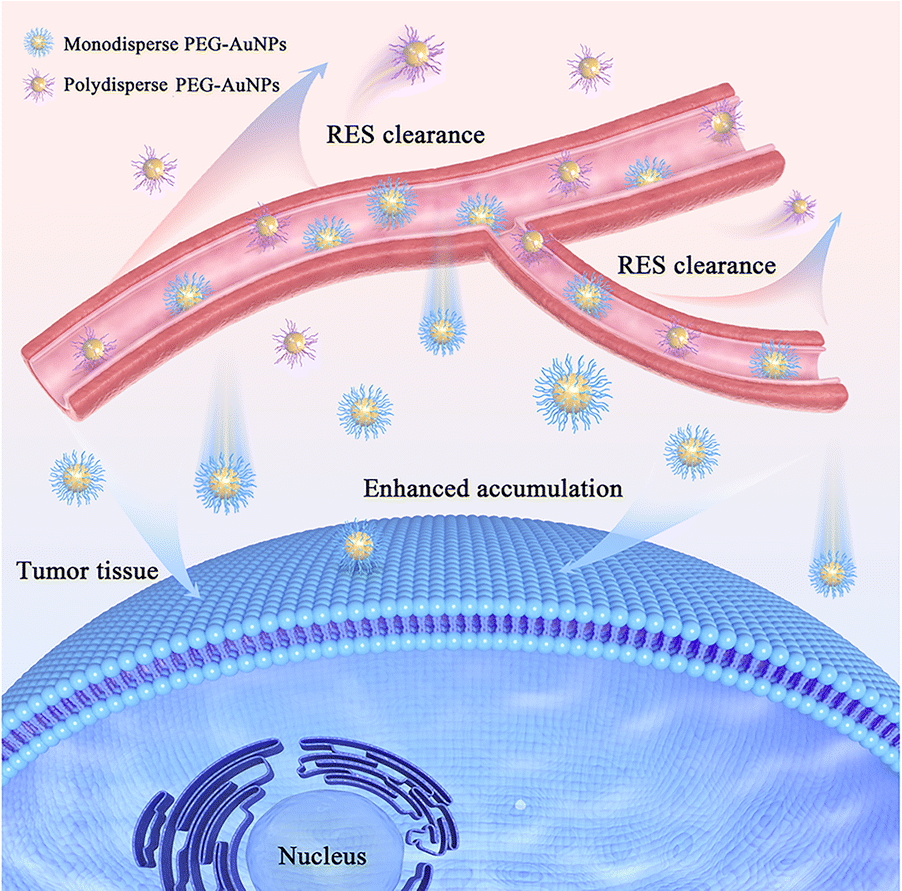 | ||
| Fig. 1 Monodisperse PEG-AuNPs in blood vessels can avoid being rapidly cleared by reticuloendothelial system and thus increase the accumulation in tumor tissue. | ||
2 Experimental section
2.1 Materials
Polydisperse mPEG2k-HS (MW = 1900 Da), monodisperse mPEGn-SH (n = 36, 45, MW = 1633.9 Da and 2030.4 Da, respectively, the dispersion characterization of PEG is shown in Fig. S1, refer to the ESI†) provided by Biomatrik Inc. (Jiaxing, China); bovine serum albumin (BSA) was purchased from Beijing Solebao Technology Co., Ltd, fetal bovine serum (FBS) was purchased from Hangzhou Novus Biotechnology Co., Ltd, human serum was purchased from Shanghai Hengyuan Biotechnology Co., Ltd, phosphate buffered saline (PBS, pH = 7.4) was purchased from Situofan Biotechnology (Hangzhou, China) Co., Ltd, and the BCA protein concentration determination kit was purchased from Yisheng Biotechnology (Shanghai, China) Co., Ltd, cetyltrimethylammonium bromide (CTAB), L-ascorbic acid (AA), hydrogen tetrachloroaurate hydrate (HAuCl4·3H2O), and sodium borohydride (NaBH4) were purchased from Aladdin (Shanghai, China).2.2 Synthesis of AuNPs
“The seeded growth method”33 is used to prepare AuNPs, employing small-sized AuNPs as crystal nuclei (referred to as “seeds”) that grow into larger-sized AuNPs within the growth solution. (1) Preparation of seed solution: 250 μL of HAuCl4·3H2O (0.01 M) and 600 μL of NaBH4 (0.01 M) were added to 9.75 mL of CTAB (0.10 M), and then the mixture was stirred and reacted at room temperature for 3 h; (2) preparation of growth solution: 9.75 mL of CTAB (0.10 M) and 4 mL of HAuCl4·3H2O (0.01 M) were added to 190 mL of ultrapure water; (3) seed growth: 15 mL of AA (0.10 M) was added to the growth solution stirred at room temperature until the solution became colorless, then 180 μL of seed solution was added, and the solution turned into wine red. The reaction was stirred at room temperature for 7 h. Finally, AuNPs with an average particle size of 30 nm were obtained.2.3 Preparation of PEG-AuNPs
Take 7 mL of CTAB-capped AuNPs, centrifuge at 10![[thin space (1/6-em)]](https://www.rsc.org/images/entities/char_2009.gif) 000 rpm for 20 min, washed three times with ultrapure water to remove CTAB and sonicate in an ultrasonic cleaner for 10 s to evenly disperse the AuNPs in 1 mL ultrapure water, Then mPEG2k-SH (1 mg, 0.5 μmol) was added to the AuNPs colloid (0.25 mg mL−1), the solution was left to react at room temperature for 12 h, centrifuged at 10000 rpm for 20 min, and washed three times with PBS (pH = 7.4) to remove the excess mPEG2k-SH, and finally, 1 mL of PBS (pH = 7.4) was added to obtain a stable PEG2k-AuNPs colloid. PEG36-AuNPs and PEG45-AuNPs colloids were obtained using the same method.
000 rpm for 20 min, washed three times with ultrapure water to remove CTAB and sonicate in an ultrasonic cleaner for 10 s to evenly disperse the AuNPs in 1 mL ultrapure water, Then mPEG2k-SH (1 mg, 0.5 μmol) was added to the AuNPs colloid (0.25 mg mL−1), the solution was left to react at room temperature for 12 h, centrifuged at 10000 rpm for 20 min, and washed three times with PBS (pH = 7.4) to remove the excess mPEG2k-SH, and finally, 1 mL of PBS (pH = 7.4) was added to obtain a stable PEG2k-AuNPs colloid. PEG36-AuNPs and PEG45-AuNPs colloids were obtained using the same method.
2.4 Characterization of AuNPs and PEG-AuNPs
The CTAB-capped AuNPs and PEG-AuNPs were placed on a carbon-coated copper grid and dried in an oven overnight for use. The samples were detected by transmission electron microscopy (TEM, JEOL JEM-F200, Japan), and then the TEM images were analyzed using Image J software. The hydrodynamic diameter (DH), size distribution, and zeta potential of AuNPs were measured using a nanoparticle size potential analyzer (BeNano 180 Zeta Pro, Dandong, China). The DH and average zeta potential of each sample were calculated using the software provided by the manufacturer. UV absorption spectra were measured using UV-3600i Plus instrument (Shimadzu, Japan). In this experiment, thermal gravimetric analysis (TGA, Netzsch TG 209 F3 Tarsus, German) was used to detect the grafting density of PEG on the surface of AuNPs. Before measurement, centrifugation was performed to remove physically adsorbed PEG on the surface of AuNPs, and then excess water was removed by freeze-drying. The freeze-dried samples were heated from 30 °C to 700 °C at a heating rate of 20 °C min−1 under nitrogen protection. The weight loss seen in the thermogravimetric curve corresponds to the degradation of PEG in the sample. PEG degrades at temperatures below 300 °C, while PEG on the surface of AuNPs degrades at temperatures ranging from 300 °C to 500 °C.34 The possible reason is that more energy was required to destroy the Au–S complex bond. FT-ICR MS (Solarix 2XR 7.0T) was used to measure the MW distribution of PEG on the surface of AuNPs. A 10 mg mL−1 PEG-AuNPs colloid was prepared with methanol, ultrasonicated for 3 min to ensure complete disperse. Use a 10 μL pipette to drop onto the target plate several times. Test after the solvent has completely evaporated.2.5 In vitro protein adsorption study of PEG-AuNPs
Study on the effect of PEG grafting reaction concentration on AuNPs protein adsorption: different molar amounts (0.5, 1, 2, 4 μmol) of monodisperse mPEGn-HS (n = 36, 45) or polydisperse mPEG2k-HS were added to 1 mL AuNPs colloid (0.25 mg mL−1) and reacted with magnetic stirring at room temperature for 12 h to obtain mPEG-SH modified PEG-AuNPs colloid with different concentrations. Take 1 mL of each sample (the absorbance of each sample will be measured with a microplate reader before protein adsorption to keep the AuNPs content consistent at about 0.25 mg mL−1), add 2 mg of BSA powder, and incubate in a 37 °C incubator for 12 h. Particles were then washed to remove unbound BSA by three rounds of centrifugation (10000 rpm for 20 min at 4 °C). Redisperse the sample at the bottom of the centrifuge tube in 100 μL of PBS, take out 25 μL of the sample, add 200 μL of BCA working solution was incubated at 37 °C for 30 min, centrifuged at 10000 rpm for 20 min. The supernatant was taken and measured with an enzyme analyzer for absorbance at 562 nm.
Study on the protein adsorption properties of monodisperse/polydisperse PEG-AuNPs: take out 1 mL of PEG-AuNPs colloid (use a microplate reader to measure the absorbance before protein adsorption so that the amount of AuNPs used should be consistent at about 0.25 mg mL−1), remove the supernatant after centrifugation and add it to 1 mL of BSA solution (2 mg mL−1) prepared in PBS (pH = 7.4), or 1 mL PBS (pH = 7.4) containing 10% FBS or 10% human serum, respectively, and shake evenly, placed in a 37 °C incubator for 3 h, treated with the same method as above, and then used a BCA protein concentration assay kit for quantitative protein detection.
2.6 Study on the pharmacokinetics and distribution of PEG-AuNPs in mice
Female Bablb/c mice, 6–8 weeks old (about 18 g), were purchased from Nanjing Pengsheng Biotechnology Co., Ltd. All animal procedures were performed in accordance with the Guidelines for Care and Use of Laboratory Animals of Soochow University and approved by the Animal Ethics Committee of Soochow University (reference number: SYXK(Su)2021-0073). All mice were fed under specific pathogen-free conditions for at least one week to acclimate before experiments. A colon cancer tumor-bearing mouse model was used. CT26 cells were injected subcutaneously on the right side of the mice. One week later, when the tumor volume reached about 100 mm3, the mice were evenly divided into 3 groups (n = 5). PEG-AuNPs were injected into the tail vein (0.8 mg kg−1), using a syringe to collect blood from the submandibular venous plexus of the mice at 0.5, 1, 3, 6, 12 h and 24 h after injection, and sacrifice the mice at 24 h after injection. The liver, spleen, and tumor were collected. Add 1–2 mL of 20% HNO3 to each blood sample/tissue to lyse cells and AuNPs. All samples were filtered through 0.22 μm filter paper, and then the gold content in each sample was determined using inductively coupled plasma-mass spectrometry (ICP-MS). Data were analysed using DAS2.1.1 software (Pharmaceutical Statistics Version 2.1.1, Chinese Professional Committee on Mathematical Pharmacology, Shanghai, China).2.7 Data analysis
SPSS software was used for statistical analysis. The distribution of observation values between experimental replicates was assumed to be normal. The hypothesis test used the t-test. The distribution of AuNPs in each tissue used the one-factor variance test (ANOVO) and LSD multiple comparison test. Identify significant differences between specific groups. *p value < 0.05 indicates significant difference; **p < 0.01 indicates extremely significant difference.3 Results and discussion
3.1 Particle size and morphological characterization of the PEG-AuNPs
The synthesized AuNPs and PEG-AuNPs were analysed using TEM (Fig. 2), showing that both the CTAB-capped AuNPs and PEG-AuNPs were predominantly spherical, although some were elliptical. The CTAB-capped AuNPs exhibited an average particle size of 22.7 ± 2.0 nm as determined by TEM. The size of the PEG-AuNPs samples appeared unchanged under TEM, which aligns with expectations since the acceleration voltage employed does not sensitively detect the organic PEG out layer.35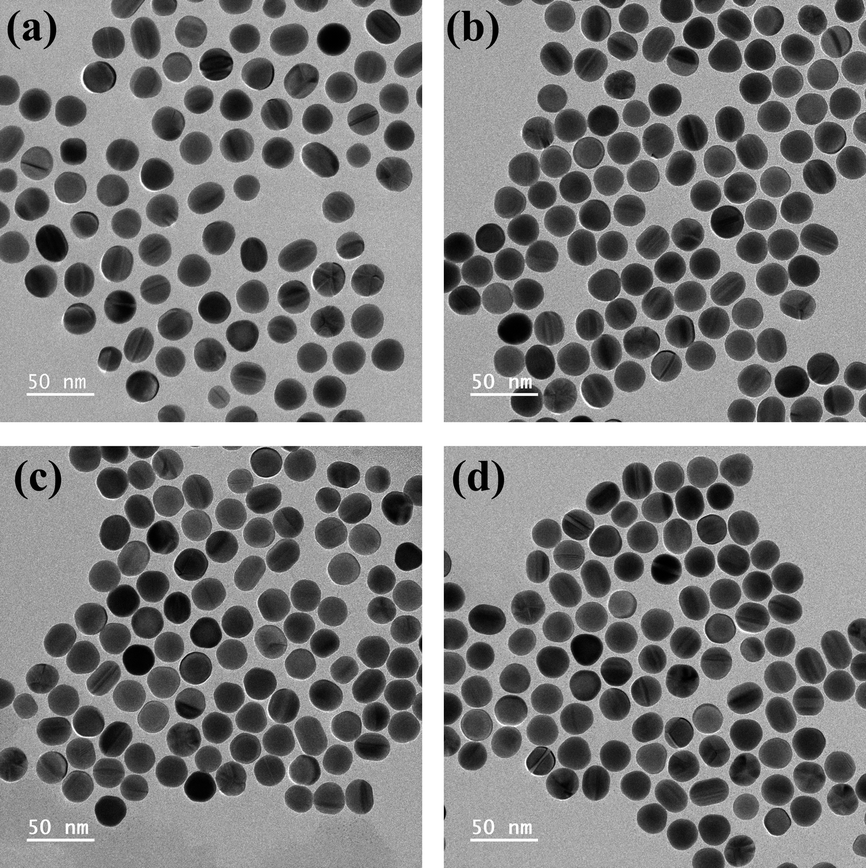 | ||
| Fig. 2 TEM images of (a) AuNPs; (b) PEG2k-AuNPs; (c) PEG36-AuNPs; (d) PEG45-AuNPs. | ||
When AuNPs at a concentration of 0.25 mg mL−1 were treated with varying mPEG-HS concentrations, ranging from 0.5 to 4 mM for 12 h, the DH of the resultant PEG-AuNPs was measured using dynamic light scattering (DLS), as depicted in Fig. 3(a). The DH remained consistent across the different mPEG-HS concentrations, irrespective of whether monodisperse mPEGn-HS (n = 36, 45) or polydisperse mPEG2k-HS was employed, indicating that PEG grafting on the AuNPs surface reached saturation even at the lowest tested concentration of 0.5 mM. This observation is in line with Wang et al.'s finding that DH stabilizes upon achieving saturated grafting density.36 Further analysis on PEG-AuNPs modified with mPEG-HS (0.5 mM) showed a notable increase in DH (Fig. 3(b)) compared to CTAB-capped counterpart (DH = 30.2 nm), and the DH of PEG-AuNPs increased with increasing PEG MW,34 zeta potential measurements (Fig. 3(c)) revealed a shift from positive to negative charge after modification, indicating successful PEGylation of AuNPs. In the ultraviolet spectra (Fig. 3(d)), a slight red shift (∼2 nm) in the localized surface plasmon resonance band suggests a change in the dielectric constant on the AuNPs surface due to PEGylation.34
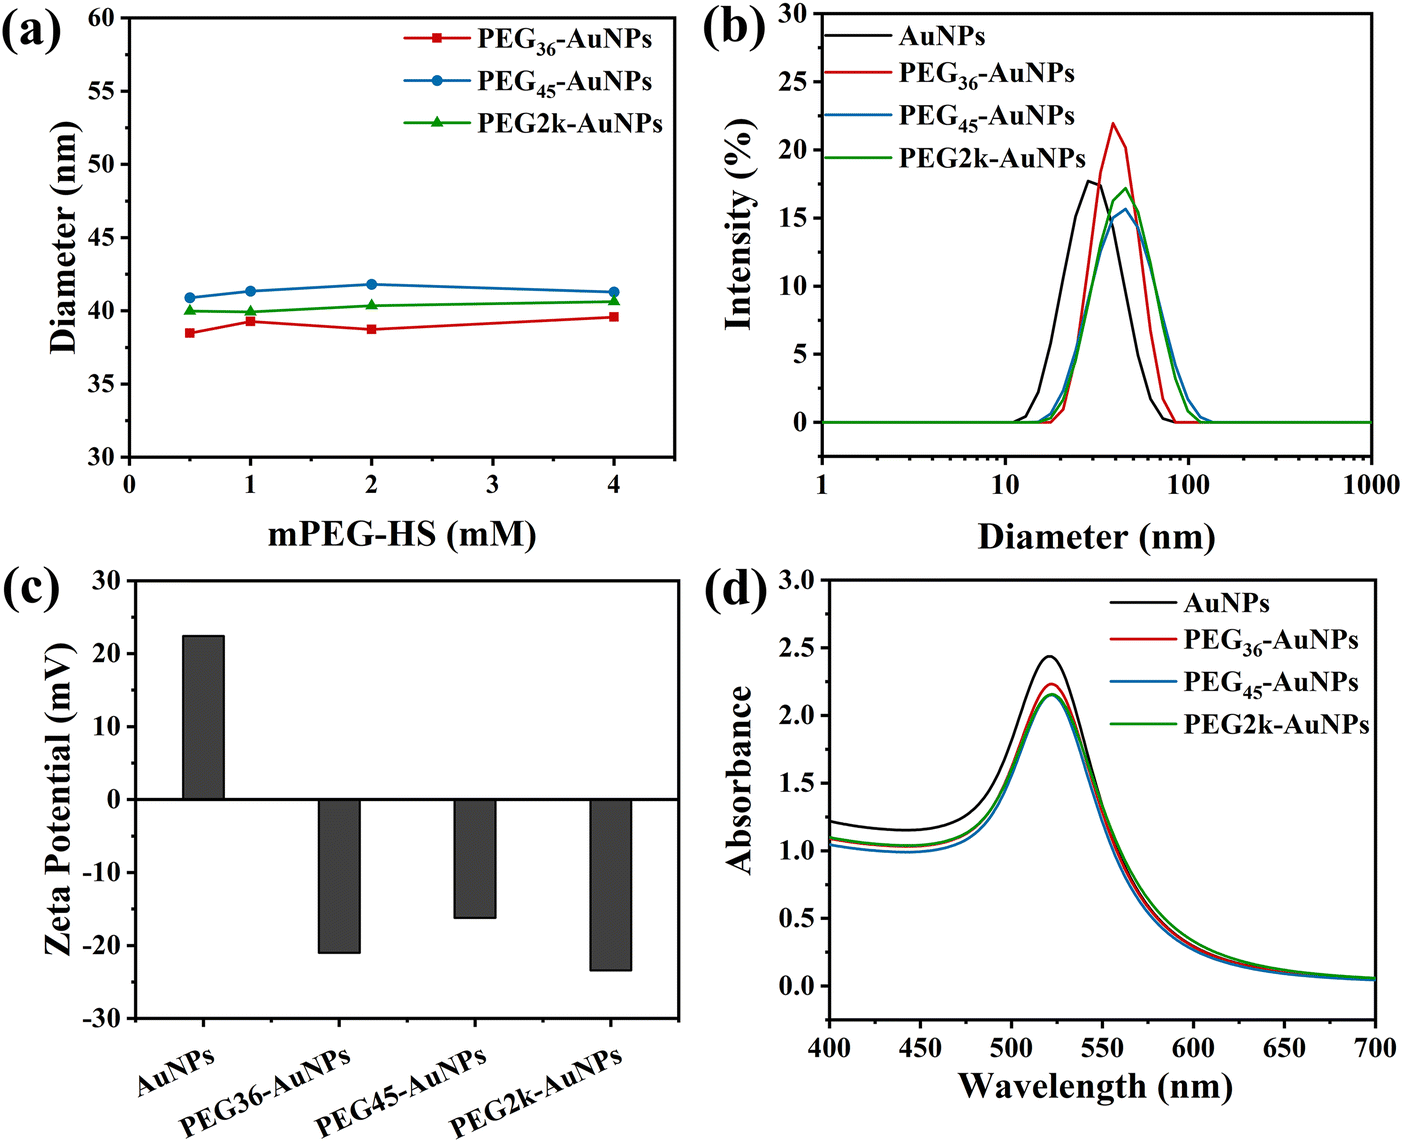 | ||
| Fig. 3 (a) DH of PEG-AuNPs modified with different concentrations of mPEG-HS; (b) DH of AuNPs and PEG-AuNPs; (c) zeta potential of AuNPs and PEG-AuNPs; (d) UV-vis absorption spectra of AuNPs and PEG-AuNPs. | ||
3.2 The surface grafting density of PEG-AuNPs and the MW distribution of surface PEG
As depicted in Fig. S2 (refer to the ESI† for the calculation methodology), TGA was utilized to quantify the grafting density of PEG on the PEG-AuNPs surface. The results revealed a grafting density of PEG36-AuNPs (4.7 PEG per nm2) is slightly greater than that of PEG45-AuNPs (4.4 PEG per nm2). This indicates that for AuNPs of identical size and surfaces curvatures, an increase in PEG MW leads to a reduction in grafting density. Obviously, this is due to the steric hindrance effect, where the higher the MW of PEG used, the more limited the grafting of PEG molecules on the AuNP surface.34For polydisperse PEG-AuNPs, the apparent surface density is calculated as 3.3 PEG per nm2. Previous studies by Zhang et al. observed that PEGs with lower MWs or shorter chain lengths were more preferred for surface modifications of gold flakes.32 As a result, the MW distribution of PEG chains grafted onto the surface likely differs from that of the polydisperse mPEG-HS used. Consequently, using the average MW of the starting polydisperse PEG to estimate the grafting density on the surface can lead to a significant deviation. However, the density of monodisperse PEG-AuNPs accurately represents the actual surface densities.
FT-ICR MS was used to analyse the MW distribution of PEG grafted onto PEG-AuNPs, with a particular focus on the actual MW and distribution of PEG on the surface of the polydisperse PEG-AuNPs. A comparison of the MALDI-TOF mass spectra of mPEG2k-SH before grafting (Fig. 4(a)), and of PEG2k grafted onto PEG2k-AuNPs (Fig. 4(b)), highlighted a lower shift in the MW distribution. Initially, the MW of mPEG2k-SH ranged from 1250–3000 Da, with a peak position near 1900 Da. However, after grafting, the MW range shifted to 500–2500 Da, with a peak near 1500 Da. Notably, the lower MW segment (500–1250 Da) of the polydisperse mPEG2k-HS was predominantly found on the surface of the AuNPs, while the higher MW segment (2500–3000 Da) was largely absent. In contrast, for monodisperse PEG-AuNPs such as PEG36-AuNPs and PEG45-AuNPs, the MW remained consistent, with molecular ion peaks detected at 1656.2 [M + Na]+and 2053.5 [M + Na]+, respectively, as shown in Fig. 4(c and d). These mass spectrometry findings indicate a significant shift toward lower MW PEG molecules on the AuNPs surface when modified with polydisperse PEG, diverging from the original MW distribution of the PEG used.
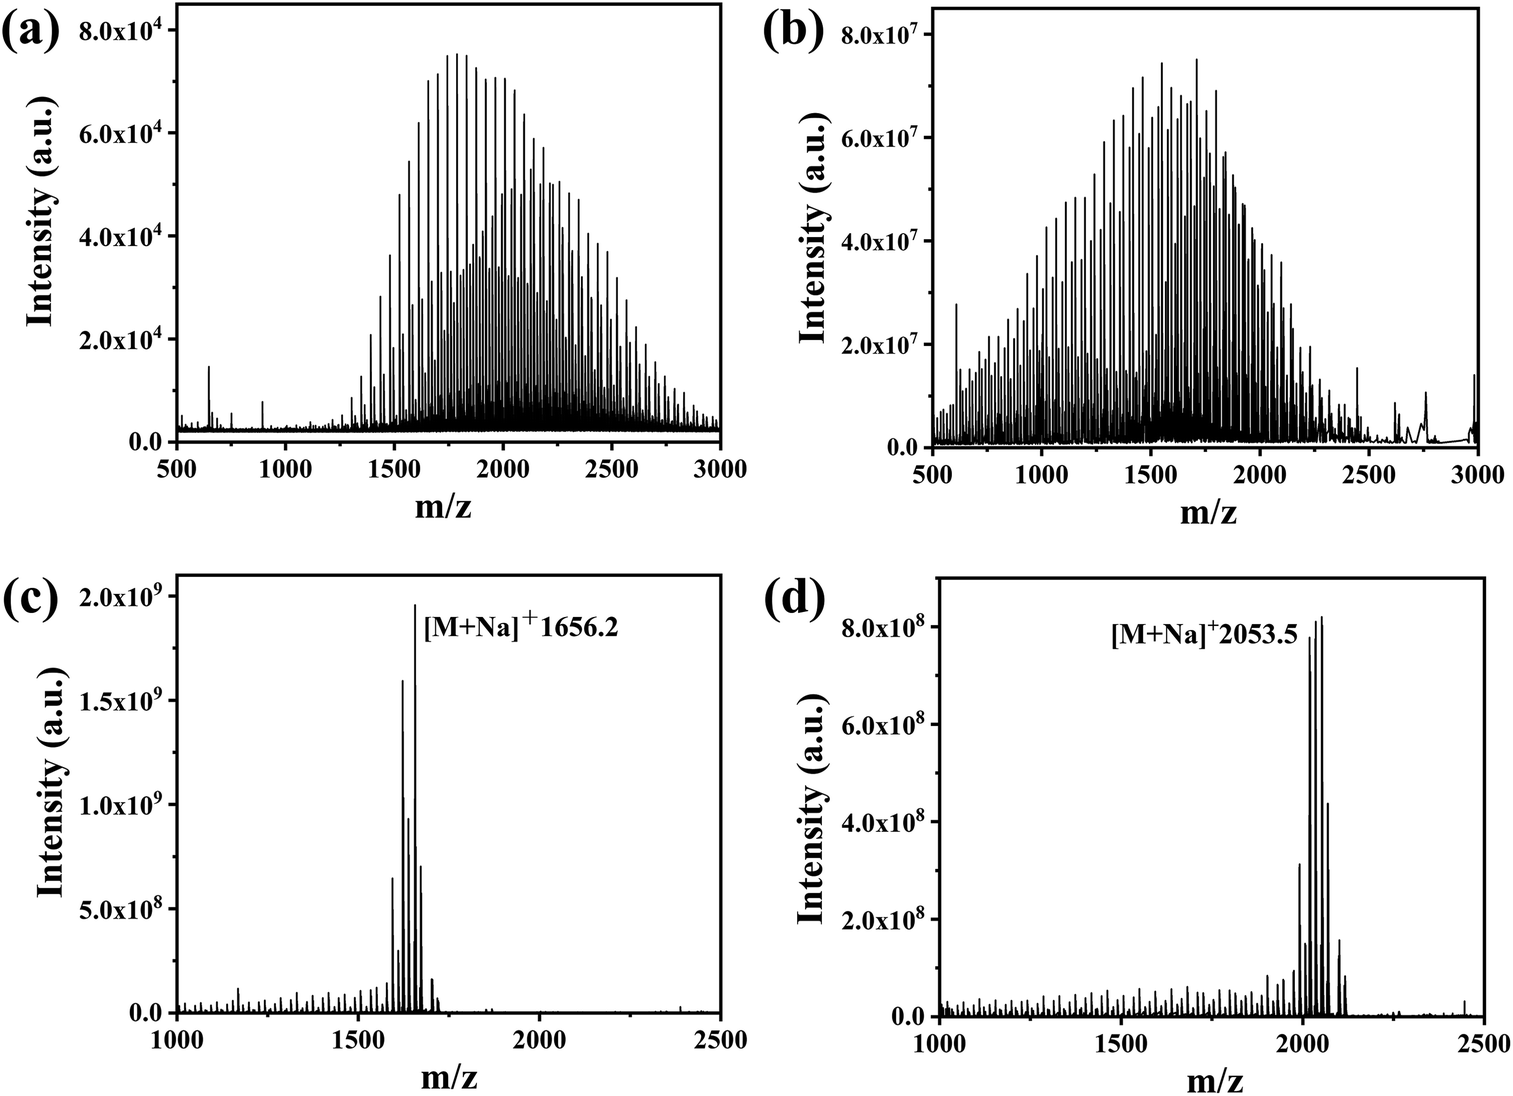 | ||
| Fig. 4 (a) MALDI-TOF spectra of mPEG2k-SH; FMS spectra of (b) PEG2k-AuNPs; (c) PEG36-AuNPs; (d) PEG45-AuNPs. | ||
3.3 Effect of mPEG-HS concentration on the BSA adsorption of PEG-AuNPs
We assessed the protein adsorption of AuNPs modified with different concentrations of monodisperse/polydisperse mPEG-HS in a BSA environment, and the findings were presented in Fig. 5(a). The BSA adsorption levels on PEG36-AuNPs and PEG45-AuNPs remained consistent upon reaching the saturation grafting density, irrespective of the mPEG-HS concentration used. Conversely, as mPEG-HS concentrations increase, BSA binding to PEG2k-AuNPs surface increased. Notably, BSA adsorption on PEG2k-AuNPs was significantly higher than on monodisperse PEGn-AuNPs (n = 36, 45).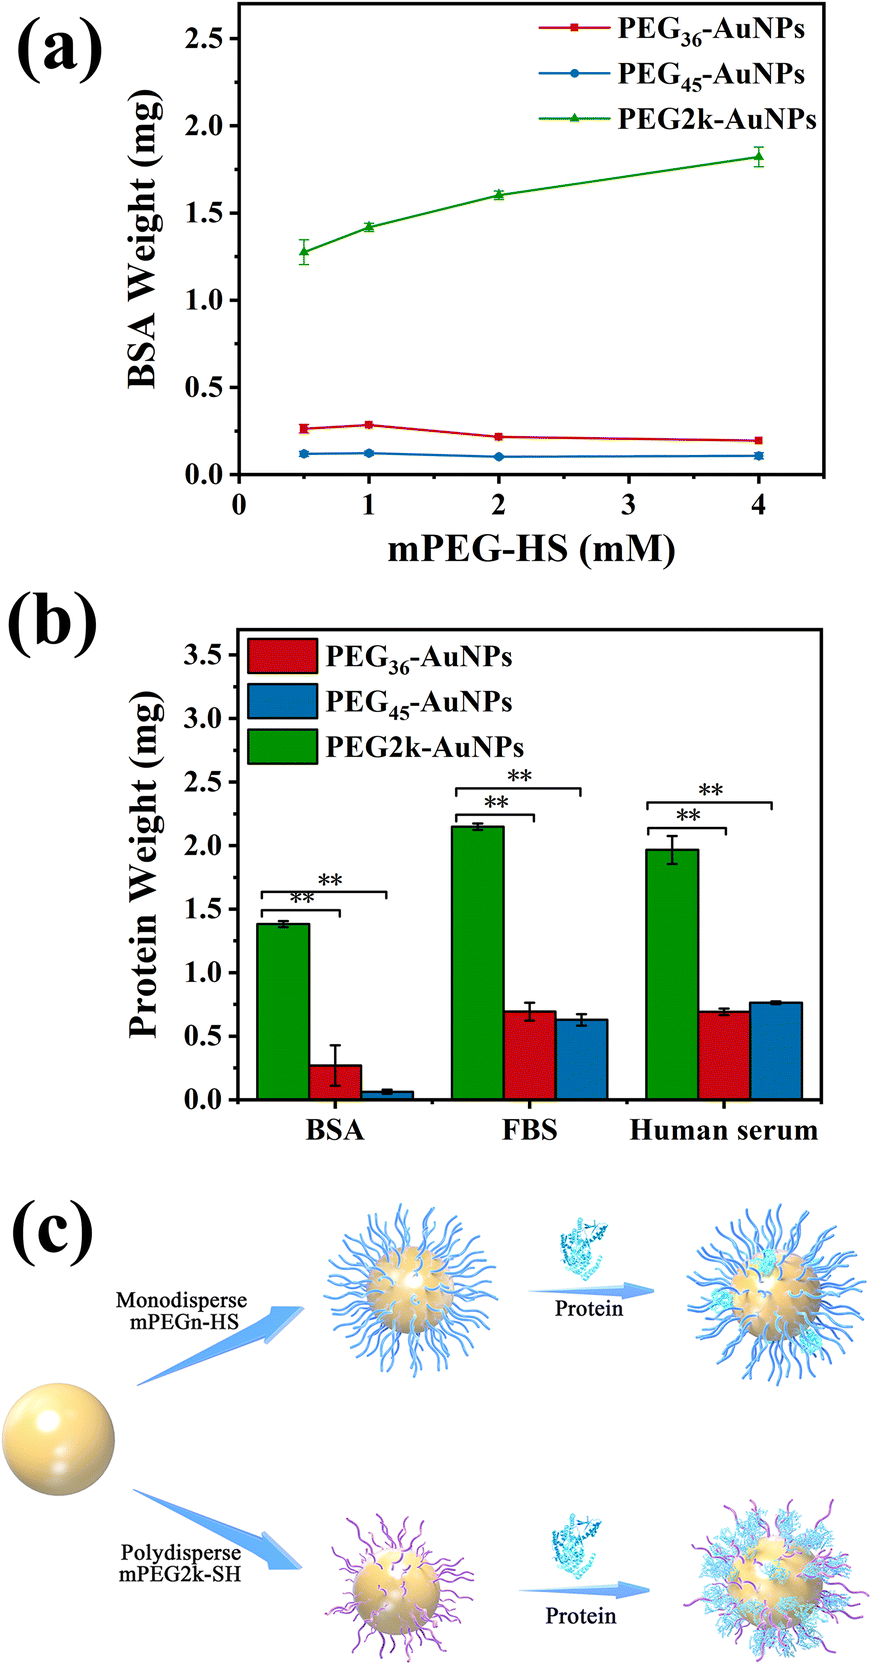 | ||
| Fig. 5 (a) Protein adsorption of PEG-AuNPs (1 mg) with different mPEG-HS concentrations in BSA at 37 °C for 12 h, all data points are mean ± SD of 3 independent replicates; (b) comparison of protein adsorption of 1 mg PEG-AuNPs in BSA, FBS, and human serum at 37 °C for 3 h (n = 3–5), using t-test to compare three PEG-AuNPs in different proteins, **p < 0.01 is significantly different from the PEG2k-AuNPs group; (c) schematic diagram of in vitro protein adsorption of monodisperse PEG-AuNPs and polydisperse PEG2k-AuNPs. | ||
Once the minimum polydisperse PEG concentration required to achieve saturated grafting density is reached, an increase in this concentration tends to enrich even more smaller MW fractions of PEG, thus, absorbing more proteins on AuNPs surface, and deteriorating the outcomes of in vitro and potentially in vivo experiments. In related research, Zhang et al. synthesized 50 nm AuNPs and observed that upon reaching a saturated grafting density on the surface of AuNPs, a higher concentration of mPEG20k-SH resulted in a reduced circulation time of mPEG20k-AuNPs in mice.37 This indicates that the polydispersity of PEG is a significant defect in terms of surface modification of AuNPs.
3.4 In vitro protein adsorption studies of PEG-AuNPs
Our observations indicated that higher concentrations of polydisperse PEG were less effective at preventing BSA adsorption. Consequently, we opted for the lowest concentration (0.5 mmol L−1) of both monodisperse/polydisperse mPEG-HS for AuNPs modification and evaluated their surface protein adsorption in vitro. The protein adsorption levels of three different PEG-AuNPs on BSA, FBS, and human serum are presented in Fig. 5(b). Using PEG2k-AuNPs, which showed the highest protein adsorption, as a reference, we calculated the relative protein adsorption levels of the other PEG-AuNPs. In the case of BSA, PEG36-AuNPs and PEG45-AuNPs showed adsorption 5 and 20 times less than that of PEG2k-AuNPs, respectively, highlighting a significant disparity. This trend was consistent across the FBS and human serum tests. For FBS, PEG36-AuNPs and PEG45-AuNPs exhibited a 70% reduction in adsorption compared to PEG2k-AuNPs. In human serum, the reduction in protein adsorption for PEG36-AuNPs and PEG45-AuNPs showed a 60% reduction compared to PEG2k-AuNPs. This suggests that monodisperse PEG-AuNPs exhibited significantly reduced protein adsorption compared with the PEG2k-AuNPs. This is due to the surface of monodisperse PEG-AuNPs forming a uniform PEG layer that effectively resists protein adsorption (Fig. 5(c)).3.5 The discrepancy uptake in vivo biodistribution
Pharmacokinetics characteristics and biodistribution data are pivotal for accurately evaluating the delivery effectiveness of nanoparticles and largely influence their therapeutic efficacy. To further elucidate the connection between the surface PEG properties of PEG-AuNPs and in vivo pharmacokinetics, we utilized CT26 tumor-bearing mice treated with PEG-AuNPs (0.8 mg kg−1) via tail vein injection and collected blood data at different time intervals (Fig. 6(a)). The total body clearance (CL), defined as the plasma volume eliminating the drug per unit time, was calculated as the ratio of drug clearance to the corresponding reference concentration.38 The CL values measured for the PEG36-AuNPs and PEG45-AuNPs, as shown in Fig. 6b, were lower than those for the PEG2k-AuNPs, indicating that the polydisperse PEG2k-AuNPs were more readily cleared by liver/kidney. The blood circulation half-lives (t1/2) (Fig. 6(c)) of PEG36-AuNPs, PEG45-AuNPs and PEG2k-AuNPs were 23.6 ± 2.3 h, 21.9 ± 1.5 h and 8.8 ± 0.7 h, respectively. This demonstrates that monodisperse PEG-modified AuNPs have an extended blood circulation time of at least 12 h, highlighting their superior longevity in circulation. A study by Alalaiwe et al.30 utilized mPEG2k-HS to modify 5 nm AuNPs with t1/2 of 13.2 ± 7.2 h, which is close to the t1/2 of our polydisperse PEG2k-AuNPs.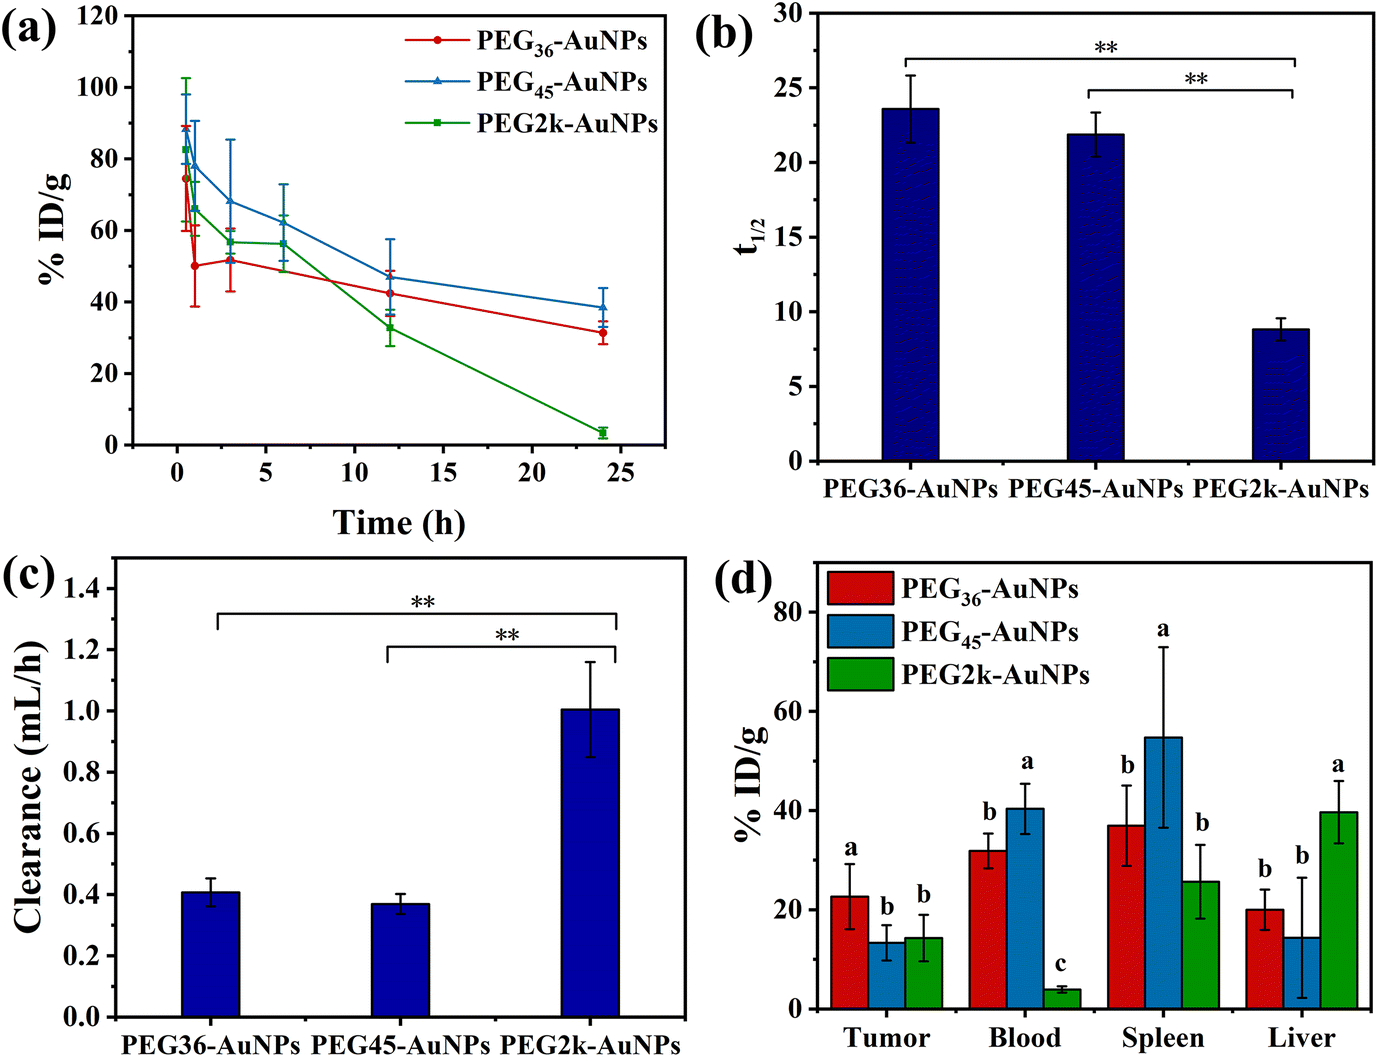 | ||
| Fig. 6 (a) Amount of gold measured by ICP-MS at various time points in the blood reported as percent injected dose per gram of tissue (n = 5); (b) t1/2 and (c) clearance were analysed in a single-compartment model; **p < 0.01 is significantly different from the PEG2k-AuNPs group (d) distribution of intravenously injected PEG36-AuNPs, PEG45-AuNPs and PEG2k-AuNPs in CT26 subcutaneous tumor-bearing mice, results are expressed as mean ± SD, (n = 5), letter superscripts (a, b or c) indicate the presence of highly significant differences between the different types of PEG-AuNPs within the respective tissue differences **p < 0.01; letters superscripted with different significant differences *p < 0.05. | ||
The distribution of PEG36-AuNPs, PEG45-AuNPs and PEG2k-AuNPs, in tumor, blood, spleen, and liver was assessed at 24 h, as depicted in Fig. 6(d). The tumor tissue uptake of the PEG36-AuNPs (22.6 ± 6.6% ID per g) was approximately 1.5 times greater than that of the PEG2k-AuNPs (14.3 ± 4.7% ID per g). The uptake of PEG45-AuNPs by tumor tissue (13.3 ± 3.6% ID per g) resembled that of PEG2k-AuNPs. However, at 24 h, the distribution of AuNPs in the blood indicated significantly higher amounts of PEG36-AuNPs (31.9 ± 3.5% ID per g) and PEG45-AuNPs (40.3 ± 5.1% ID per g) than of PEG2k-AuNPs (3.9 ± 0.6% ID per g). This suggests that PEG36-AuNPs and PEG45-AuNPs may enhance tumor tissue accumulation during subsequent in vivo circulation. Monodisperse PEG-AuNPs demonstrated better inhibition of reticuloendothelial system uptake (liver, spleen, kidney), increasing their effective blood concentration, which allowed more AuNPs to enter tumor tissue, thereby improving their performance in tumor tissue biodistribution. Despite this, PEG-AuNPs predominantly accumulated in the liver and spleen, aligning with numerous studies indicating the highest levels of intravenously injected AuNPs in these organs.39,40
4 Conclusion
This study investigated the impact of PEG dispersity on the grafting density and MW distribution of PEG on the surface of 30 nm AuNPs, modified with monodisperse mPEGn-HS (n = 36, 45) and conventional polydisperse mPEG2k-SH, respectively, and their subsequent effects on protein adsorption in vitro, as well as pharmacokinetics and tissue distribution in mice. The findings indicate that polydisperse PEG-AuNPs preferentially graft lower MW fractions while excluding higher MW fractions, resulting in a downward shift in the MW distribution of grafted PEGs on surface. In contrast, monodisperse PEG-AuNPs form a uniform PEG out layer with a consistent chain length. As a result, monodisperse PEG-AuNPs show significantly lower adsorption of proteins such as BSA, FBS, and human serum proteins. Pharmacokinetics studies demonstrated that monodisperse PEG-AuNPs have a prolonged blood circulation half-life and enhanced accumulation at the CT26 tumor site in mice. These results establish a direct correlation between resistance to serum proteins in vitro, prolonged circulation time, and targeted tumor delivery in vivo, underscoring the critical importance of PEG monodispersity in enhancing the efficacy of PEGylated AuNPs for various biomedical applications.Data availability
All date supporting the findings of this study are available within the paper and its ESI.†Conflicts of interest
There are no conflicts to declare.Acknowledgements
In this work, we extend our gratitude to Professor Liangzhu Feng from Soochow University for his invaluable assistance with our animal studies. We are also thankful to Professor Chao Ma from the Institute of Surface-Earth System Science at Tianjin University for his insightful suggestions regarding our FT-ICR MS tests. Additionally, our sincere thanks Dr Han Zhang from Zhejiang Sci-Tech University for his advice on the synthesis of gold nanoparticles.References
- Y. Chen and X. Feng, Int. J. Pharm., 2022, 625, 122122 CrossRef CAS PubMed.
- A. Urso, F. Meloni, M. Malatesta, R. Latorre, C. Damoci, J. Crapanzano, L. Pandolfi, M. D. Giustra, M. Pearson, M. Colombo, K. Schilling, R. A. Glabonjat and F. D'Ovidio, Nanomedicine, 2023, 18, 317–330 CrossRef CAS PubMed.
- T. Yao, R. Wang, Y. Meng and X. Hun, ACS Appl. Mater. Interfaces, 2021, 13, 26515–26521 CrossRef CAS PubMed.
- P. P. P. Kumar and D. K. Lim, Pharmaceutics, 2023, 15, 2349 CrossRef CAS PubMed.
- J. Khan, Y. Rasmi, K. K. Kirboga, A. Ali, M. Rudrapal and R. R. Patekar, Beni-Suef Univ. J. Basic Appl. Sci., 2022, 11, 111–122 CrossRef PubMed.
- R. R. Liu, L. T. Song, Y. J. Meng, M. Zhu and H. L. Zhai, J. Phys. Chem. B, 2019, 123, 7570–7577 CrossRef CAS PubMed.
- J. C. Henson, A. Brickell, J. W. Kim, H. Jensen, J. L. Mehta and M. Jensen, IEEE Trans. NanoBiosci., 2022, 21, 387–394 CAS.
- M. Kus-Liskiewicz, P. Fickers and I. Ben Tahar, Int. J. Mol. Sci., 2021, 22, 10952–10973 CrossRef CAS PubMed.
- C. M. G. de Faria, M. Bissoli, R. Vago, A. E. Spinelli and V. Amendola, Nanomaterials, 2023, 13, 3044–3062 CrossRef CAS PubMed.
- J. Lazarovits, Y. Y. Chen, E. A. Sykes and W. C. W. Chan, Chem. Commun., 2015, 51, 2756–2767 RSC.
- E. Blanco, H. Shen and M. Ferrari, Nat. Biotechnol., 2015, 33, 941–951 CrossRef CAS PubMed.
- J. Lu, Y. Xue, R. Shi, J. Kang, C.-Y. Zhao, N.-N. Zhang, C.-Y. Wang, Z.-Y. Lu and K. Liu, Chem. Sci., 2019, 10, 2067–2074 RSC.
- J. S. Suk, Q. Xu, N. Kim, J. Hanes and L. M. Ensign, Adv. Drug Delivery Rev., 2016, 99, 28–51 CrossRef CAS PubMed.
- X. Yang, M. Yang, B. Pang, M. Vara and Y. Xia, Chem. Rev., 2015, 115, 10410–10488 CrossRef CAS PubMed.
- E. Harrison, J. R. Nicol, M. Macias-Montero, G. A. Burke, J. A. Coulter, B. J. Meenan and D. Dixon, Mater. Sci. Eng., C, 2016, 62, 710–718 CrossRef CAS PubMed.
- Arnida, A. Malugin and H. Ghandehari, J. Appl. Toxicol., 2009, 30, 212–217 CrossRef PubMed.
- L. E. Cole, T. L. McGinnity, L. E. Irimata, T. Vargo-Gogola and R. K. Roeder, Acta Biomater., 2018, 82, 122–132 CrossRef CAS PubMed.
- L. Zhang, S. R. Jean, X. Li, T. Sack, Z. Wang, S. Ahmed, G. Chan, J. Das, A. Zaragoza, E. H. Sargent and S. O. Kelley, Nano Lett., 2018, 18, 6222–6228 CrossRef CAS PubMed.
- H. Moustaoui, D. Movia, N. Dupont, N. Bouchemal, S. Casale, N. Djaker, P. Savarin, A. Prina-Mello, M. L. de la Chapelle and J. Spadavecchia, ACS Appl. Mater. Interfaces, 2016, 8, 19946–19957 CrossRef CAS PubMed.
- E. M. Donnelly, K. P. Kubelick, D. S. Dumani and S. Y. Emelianov, Nano Lett., 2018, 18, 6625–6632 CrossRef CAS PubMed.
- J. Spadavecchia, D. Movia, C. Moore, C. Manus Maguire, H. Moustaoui, S. Casale, Y. Volkov and A. Prina-Mello, Int. J. Nanomed., 2016, 11, 791–822 CrossRef CAS PubMed.
- E. Okła, P. Bialecki, M. Kedzierska, E. Pedziwiatr-Werbicka, K. Milowska, S. Takvor, R. Gomez, F. J. de la Mata, M. Bryszewska and M. Ionov, Int. J. Mol. Sci., 2023, 24, 6638–6651 CrossRef PubMed.
- L. Bu, X. Jiang, S. Martin-Puig, L. Caron, S. Zhu, Y. Shao, D. J. Roberts, P. L. Huang, I. J. Domian and K. R. Chien, Nature, 2009, 460, 113–117 CrossRef CAS PubMed.
- J. Lin, H. Zhang, Z. Chen and Y. Zheng, ACS Nano, 2010, 4, 5421–5429 CrossRef CAS PubMed.
- J. Gao, X. Huang, H. Liu, F. Zan and J. Ren, Langmuir, 2012, 28, 4464–4471 CrossRef CAS PubMed.
- Z.-T. Cao, L.-Q. Gan, W. Jiang, J.-L. Wang, H.-B. Zhang, Y. Zhang, Y. Wang, X. Yang, M. Xiong and J. Wang, ACS Nano, 2020, 14, 3563–3575 CrossRef CAS PubMed.
- L. A. Navarro, T. P. Shah and S. Zauscher, Langmuir, 2020, 36, 4745–4756 CrossRef CAS PubMed.
- H. Otsuka, Y. Nagasaki and K. Kataoka, Biomacromolecules, 2000, 1, 39–48 CrossRef CAS PubMed.
- Y. R. Perera, J. X. Xu, D. L. Amarasekara, A. C. Hughes, I. Abbood and N. C. Fitzkee, Molecules, 2021, 26, 5788–5802 CrossRef CAS PubMed.
- A. Alalaiwe, G. Roberts, P. Carpinone, J. Munson and S. Roberts, Drug Delivery, 2017, 24, 591–598 CrossRef CAS PubMed.
- Y. Akiyama, T. Mori, Y. Katayama and T. Niidome, J. Controlled Release, 2009, 139, 81–84 CrossRef CAS PubMed.
- P. Zhang, Z. Zhang, D. Wang, J. Hao and J. Cui, ACS Macro Lett., 2020, 9, 1478–1482 CrossRef CAS PubMed.
- N. R. Jana, L. Gearheart and C. J. Murphy, Langmuir, 2001, 17, 6782–6786 CrossRef CAS.
- K. Rahme, L. Chen, R. G. Hobbs, M. A. Morris, C. O'Driscoll and J. D. Holmes, RSC Adv., 2013, 3, 6085–6094 RSC.
- E. Harrison, J. R. Nicol, M. Macias-Montero, G. A. Burke, J. A. Coulter, B. J. Meenan and D. Dixon, Mater. Sci. Eng., C, 2016, 62, 710–718 CrossRef CAS PubMed.
- W. Wang, Q.-Q. Wei, J. Wang, B.-C. Wang, S.-h. Zhang and Z. Yuan, J. Colloid Interface Sci., 2013, 404, 223–229 CrossRef CAS PubMed.
- C. Tortiglione, Y. Zhang, A. T. Liu, Y. R. Cornejo, D. Van Haute and J. M. Berlin, PLoS One, 2020, 15, e0234916 CrossRef PubMed.
- F. Geng, J. Z. Xing, J. Chen, R. Yang, Y. Hao, K. Song and B. Kong, J. Biomed. Nanotechnol., 2014, 10, 1205–1216 CrossRef CAS PubMed.
- O. B. Adewale, H. Davids, L. Cairncross and S. Roux, Int. J. Toxicol., 2019, 38, 357–384 CrossRef CAS PubMed.
- A. Sani, C. Cao and D. Cui, Biochem. Biophys. Rep., 2021, 26, 100991–101003 CAS.
Footnote |
| † Electronic supplementary information (ESI) available. See DOI: https://doi.org/10.1039/d4ra03153a |
| This journal is © The Royal Society of Chemistry 2024 |