
 Open Access Article
 This Open Access Article is licensed under a Creative Commons Attribution-Non Commercial 3.0 Unported Licence
Identification of taurine biomarker in human biofluids using plasmonic patterns of silver nanostructure†
Farnaz Bahavarniaa,
Hamed Baharib,
Mohammad Hasanzadeh *c and
Nasrin Shadjoud
*c and
Nasrin Shadjoud
aNutrition Research Center, Tabriz University of Medical Sciences, Tabriz, Iran
bFood and Drug Safety Research Center, Tabriz University of Medical Sciences, Tabriz, Iran
cPharmaceutical Analysis Research Center, Tabriz University of Medical Sciences, Tabriz, Iran. E-mail: hasanzadehm@tbzmed.ac.ir
dDepartment of Nanotechnology, Faculty of Chemistry, Urmia University, Urmia, Iran
First published on 26th June 2024
Abstract
Taurine is now widely used as a new biomarker for cardiovascular and neurodegenerative diseases. This study discusses the importance of accurately determining taurine biomarker levels in various tissues and fluids for the early diagnosis of important pathologies and diseases. Current methods for taurine analysis face challenges such as low sensitivity, lack of selectivity, and complex procedures. Therefore, an efficient analytical method/technique is urgently needed by clinicians. A new paper-based photochemical method using triangular silver nanoparticles (TA-AgNPs) as optical nanoprobes was developed to detect taurine in human blood plasma and urine samples. This method involves a chemical reaction between taurine and TA-AgNPs, leading to a color change at pH 4.8, which is detected using a paper-based colorimetry (PCD) assay. The reaction is further confirmed by UV-visible spectrophotometry as the interaction between taurine and TA-AgNPs causes a significant change in the absorption spectrum, enabling the rapid and reliable measurement of this important biomarker with a detection limit of less than 0.2 μM to 20 mM. The method has been successfully applied to bioanalyzing taurine in human body fluids. Additionally, it requires optimized single-drop paper/parafilm-based colorimetric devices (OD-PCDs) for in situ and on-demand taurine analysis. This study represents the first use of TA-AgNPs for the specific and sensitive detection of taurine in real samples. The sensor design allows for the direct quantification of biomarkers in biological samples without the need for derivatization procedures or sample preparation. The simplicity and portability of OD-PCDs make them promising for tracking and monitoring. This method is expected to contribute to improving environmental health and occupational safety and represents a significant advancement in colorimetric analysis for the sensitive and selective detection of taurine, potentially providing a platform for the identification of taurine and other biomarkers.
1. Introduction
Taurine, a semi-essential micronutrient known as 2-aminoethane sulfonic acid, is among the most plentiful amino acids in humans and other eukaryotes. While considered nonessential, taurine is primarily found in tissues as a free amino acid and is distinguished by its sulfonic acid group, rather than the carboxylic acid moiety present in other amino acids. This disparity may explain why taurine, despite its prevalence as a free amino acid in various tissues such as skeletal and cardiac muscles as well as the brain, is not integrated into proteins. In healthy adults, taurine is produced through the catabolism of methionine and cysteine.1While taurine is primarily known for its role in forming bile salts, it is also associated with various metabolic effects such as regulating intracellular calcium ion balance, guarding against ischemia-reperfusion injury, functioning as a natural antioxidant, and demonstrating anti-atherogenic effects.2–5 Taurine serves as a crucial therapeutic element in the treatment of conditions such as taurine deficiency retinopathy, kidney disease, and congestive heart failure. It works to inhibit various biochemical alterations caused by harmful substances such as monocrotaline.6 While bile acid conjugation may be its primary function, it accounts for just a small portion of the total taurine content present in the body. Other metabolic roles of taurine encompass detoxification, osmoregulation, and the modulation of cellular calcium levels. Taurine has been used in the treatment of various clinical conditions such as heart disease, epilepsy, macular degeneration, Alzheimer's disease, liver disease, and cystic fibrosis, among other uses.7 Interestingly, the intracellular taurine concentration is stringently controlled,8 and plasma levels are affected during trauma,9 sepsis,10 and cancer.11 As the understanding of the significance of taurine in different diseases grows, there is a greater demand for a quick and straightforward test to regularly measure this compound in plasma and urine.12
Conventional techniques to detect the taurine concentration usually include chromatography with spectrometric detection,13 capillary electrophoresis,14 and electrochemical assay.15 Despite the excellent limit of detection, these methods involve time-consuming sample preparation, costly and hazardous solvents, and require skilled personnel to run the complex procedures. Thus, researchers aim to develop more accessible, rapid, and cost-effective techniques for the detection of taurine in body fluids.16
The utilization of colorimetric analysis has emerged as an efficient and cost-effective technology to address these issues. In particular, detection techniques based on nanoparticles (NPs), notably AgNPs, have mostly been utilized for their heightened sensitivity.17–19 These NPs exhibit distinct optical properties determined by their size, shape, and distance, rendering them suitable for detecting various target molecules such as enzymes, proteins, and metal ions in real samples.20,21 Traditional nanoparticle-based colorimetric analysis is commonly conducted using expensive commercial-grade plates or boxes in a plate reader, which are inconveniently stationary and reliant on the sample volume. Therefore, the incorporation of nanoparticle-based sensors into paper-based microfluidic devices presents a challenge in the development of colorimetric biosensors, despite their advantages of low cost, rapidity, ease of manufacture, small sample volume requirement, and portability.22–24
In recent years, the use of digital technology in analysis has become more prevalent. This involves capturing and processing digital images to expedite analysis and eliminate the need for expensive equipment.25 These digital images are produced by the interaction of radiation with the sample, where some radiation is absorbed and the rest is reflected. Digital image-based methods are particularly appealing for colorimetric reactions, as the colored reaction product reflects radiation when exposed to visible light, which can then be captured. The concentration of the colored product is measured using a digital sensor.26 The reflected radiation can be correlated with the concentration of the reaction between the analyte and the reagent. Images taken with smartphones can be converted into red (R), green (G), and blue (B) color patterns, as per the International Color Consortium (ICC) proposal.27 Color variations within this space are defined on a scale ranging from zero to 255 (8-bit format) or 0–1 (fractional format). The intensity of the measured R, G, and B channels of the captured digital image can be analyzed using image processing programs such as Photo-Metrix.28 Consequently, the color intensity depicted in the images is associated with the concentration of the colored product formed between the analyte and the reagent. The utilization of digital images enables the replacement of expensive instrumental techniques. Furthermore, digital image-based methods facilitate reduced reagent and sample usage, swift analysis, automation, and portability.29
This study presents the development of a straightforward and innovative colorimetric detection technique for the cost-effective monitoring of taurine in authentic human samples using TA-AgNPs. The findings can be analyzed using UV-vis spectroscopy, as well as through visual inspection with paper-based colorimetric devices (PCDs) to detect trace levels of taurine in real samples. The PCD was created by transferring a microfluidic sample from a paraffin-coated fiberglass sheet to a clean fiberglass sheet using heat. This device was then utilized for the rapid and portable colorimetric detection of taurine in blood serum and urine samples using triangular silver nanoparticles (TA-AgNPs). There are several methods for producing paper sensors, with the wax transfer method being one of them for colorimetric analysis.30
Wax is chosen for its wide availability and eco-friendliness. Utilizing a wax printer and inexpensive printing plates, the straightforward wax screen printing method is a budget-friendly means of producing micro PCDs. The process involves printing wax patterns onto paper using a simple screen-printing approach, eliminating the need for a sterile environment, UV lamps, organic solvents, or complex equipment. Additionally, its flexibility allows for worldwide utilization on a regular hot plate or similar surface, making it particularly advantageous for PCD production in developing nations.31 Furthermore, the design can be used for both spectrophotometric and colorimetric detection methods. “Lab on paper” emerged as a new research field in 2007. Since then, paper microfluidics has proven to be an effective system for fluid transportation and analysis across various applications. The utilization of paper for microfluidic systems holds appeal due to its widespread availability and low cost, as well as its compatibility with chemical, biochemical, and medical materials.32 Presently, Point-of-Care Devices (PCDs) are being hailed as a cost-effective, user-friendly, disposable, and equipment-free technology that shows promise in enhancing global healthcare, disease treatment, and screening, particularly in underserved regions.33
Based on some limitations of the current methods for the monitoring of taurine in human biofluids (like low sensitivity, lack of selectivity, complex procedures, and the high demand of clinicians for the efficient and reliable recognition of taurine in real samples), a new paper-based photochemical method using triangular silver nanoparticles (TA-AgNPs) as optical nanoprobes was developed to detect taurine in human blood plasma and urine samples. This method involves a chemical reaction between taurine and TA-AgNPs, leading to a color change, which is detected using a paper-based colorimetry (PCD) assay and confirmed by UV-visible spectrophotometry. The interaction between taurine and TA-AgNPs causes a significant change in the absorption spectrum, enabling the rapid and accurate measurement of this biomarker. The method has been successfully applied to analyzing taurine in human biological fluids. Additionally, it requires optimized single-drop paper/parafilm-based colorimetric devices (OD-PCDs) for in situ and on-demand taurine bioanalysis. This study represents the first use of TA-AgNPs for the specific and sensitive detection of taurine in real samples. The sensor design allows for the direct quantification of biomarkers in biological samples without the need for derivatization procedures or sample preparation. The simplicity and portability of OD-PCDs make them promising for tracking and monitoring. This method is expected to contribute toward improving environmental health and occupational safety, and represents a significant advancement in colorimetric analysis for the sensitive and selective detection of taurine, potentially providing a platform for the identification of taurine and other biomarkers.
To the best of our knowledge, there are no existing reports on the quantification of taurine utilizing PCDs with multiple sensor zones. Furthermore, there are no reports on the use of PCDs decorated with TA-AgNPs for taurine detection, allowing for a comparison of the nanoprobes employed. Apart from the employed methods, the detection of taurine biomarkers in real samples was also explored using the RGB method and smartphone-captured digital images. The results can be visually analyzed, with PCDs enabling the detection of trace-level taurine biomarkers (Scheme 1).
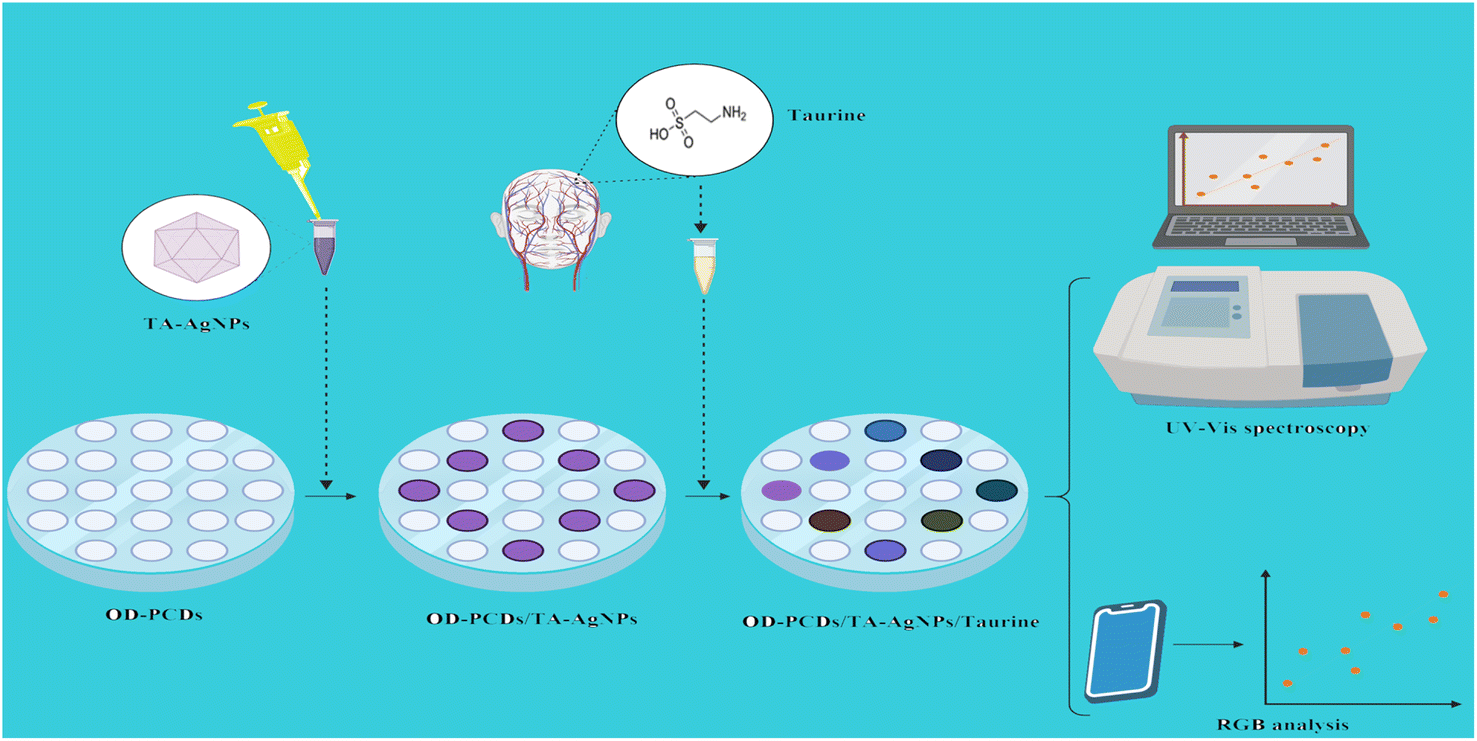 | ||
| Scheme 1 Illustration of the fabrication and detection process of Taurine using triangular TA-AgNPs with RGB analysis and PCD. | ||
2. Experimental
2.1. Reagents and materials
Taurine biomarkers, cysteine (Cys), ascorbic acid (AA), uric acid (UA), proline (Pro), aspartic acid (As), methionine (Met), histidine (His), glycine (Gly), alanine (Ala), and acetonitrile were purchased from Merck, Germany. Silver chloride (AgCl), silver nitrate (AgNO3), sodium borohydride (NaBH4, 96%), trisodium citrate (Na3C6H5O7), hydrogen peroxide (H2O2, 30 by weight), and polyvinyl pyrrolidone (PVP) K-30 were purchased from Sigma-Aldrich, Canada. Deionized water was provided by Ghazi Pharmaceutical Company, Tabriz, Iran. Glass fiber sheets were purchased from Whatman Co., Germany, and parafilm from Temad-Kala.2.2. Instrument
The analysis of the size distribution and zeta potential detection for the manufactured TA-AgNPs was conducted using the Zetasizer Ver from Malvern Instrument, Ltd (England) with reference code MAL1032660. Spectrophotometric studies were carried out using the Shimadzu UV-1800 UV-vis spectrophotometer. The digital photographs were taken using a Motorola Moto G5 Plus XT smartphone equipped with a 12 MP rear camera featuring dual autofocus pixels and an Android 6.0 operating system. Additionally, a Samsung Galaxy A5 with a 13 MP camera was employed for capturing the images. For better capturing of color changes in the images taken with the smartphone, a white polymeric cylinder was selected. To control the luminosity and prevent interference from external radiation, a circular box made of black PLA with an inner diameter of 8.0 cm and a height of 10 cm was used. The smartphone was positioned approximately 10 cm above the spot tests inside the box, and the pictures were taken with autofocus using the free Photo Metrix application.2.3. Synthesis of TA-AgNPs
The TA-AgNPs were synthesized as previously described in our earlier report.34 In summary, 0.06 grams of PVP were mixed with 200 milliliters of deionized water, and then combined with 8 milliliters of a 75 mM trisodium citrate (TCS) solution and 4 milliliters of a 0.01 M AgNO3 solution. Subsequently, 960 milliliters of H2O2 was added to the mixture and stirred continuously. Finally, 3.2 milliliters of a 100 mM NaBH4 solution was introduced to the reaction medium as a reducing agent, facilitating the reduction of Ag(I) to Ag (0) and resulting in the formation of TA-AgNPs with a distinct bright yellow color. After 30 minutes of agitation, the color of the colloidal mixture changed to blue. This colloidal solution was then stored at 4 °C for future use.2.4. Preparation of the citrate–phosphate buffer (McElwain's)
Citrate–phosphate buffer or McElwain's buffer is a buffer solution consisting of citric acid and disodium hydrogen phosphate. Depending on the ratio of these two components, a buffer solution with a pH value between 2.2 and 8 can be produced. This solution provides a buffering capacity in a wide pH range. Citrate–phosphate buffer is used in many applications, especially in comparative studies based on colorimetry. In this study, we used citrate–phosphate buffer to prepare 100 mL of phosphate/citrate buffer solution: the stock solutions are 0.2 M dibasic sodium phosphate and 0.1 M citric acid, and 0.2 M Na2HPO4 mixed with 0.1 M citrate. The pH values of the solutions were adjusted to 4.8, 5.8, 6.5, 7.5 and 8.2 with Na2HPO4 and citric acid.2.5. Real sample preparation
Human blood serum samples were obtained by the Iranian Blood Transfusion Research Centre, Tabriz, Iran. Human urine samples were collected from drug-free healthy volunteers. Blood serum samples were centrifuged with acetonitrile at 8000 rpm for 10 minutes. The supernatant was kept in a 2 mL vial for colorimetric and spectrophotometric analysis, while the urine samples were untreated and diluted only with distilled water in a 1![[thin space (1/6-em)]](https://www.rsc.org/images/entities/char_2009.gif) :1 ratio.
:1 ratio.
2.6. Production of PCD
In this study, fiberglass and thin-layer chromatography (TLC) were employed to assess the efficacy of the papers. The findings indicated that glass fiber paper experiences less abrasion as a result of its superior flow behavior. Paraffin, through the interaction between the excited product driven by a force and a chromogen in the detection zone, can serve as a means to identify the target. This choice was based on its favorable attributes, such as its low melting point, and thermoplastic properties. Furthermore, paraffin, a primary component of solids, is commonly utilized in the production of paper-based analytical devices (PADs) through the wax printing process, and is highly resistant to the majority of chemical compounds used in the investigation. Conventional PADs were fabricated using wax printing.35,36 The suggested pattern comprises thirty-two hydrophilic circular areas. The template made from paper has microchannels with minimal capillarity, ensuring the smooth flow of liquid. The designed micro-zones facilitate the simultaneous analysis of multiple samples.37The mold is heated to 90 °C, and the relevant paper is then placed in it for 30 seconds. After drying, the iron sample is heated for two minutes at 150 °C. A piece of paper is placed between the iron sample and the magnet. Consequently, the paraffin seeps into the paper's structure, creating hydrophilic channels on the surface.
In addition to producing micro-zones on a flexible substrate, parafilm was also applied for droplet deposition. This material is liquefied at 90 °C, and the corresponding paper is immersed in it for 30 seconds. Following drying, the iron mold was heated at 85 °C for 10 seconds. A layer of parafilm was interposed between the iron mold and the magnet, causing the paraffin to permeate the parafilm structure and create hydrophilic channels on the surface. Once dried, the prepared PCDs were utilized for colorimetric analyses. Parafilm comprises thin, flexible, and semi-transparent sheets that belong to the thermoplastic polymer category. Thermoplastic polymers are not decomposed by an increase in temperature; they melt with fixed chemical composition and revert to the same material after cooling. From a chemical perspective, parafilm is both flexible and thermoplastic, and also conductive. Taurine was detected using PCDs modified with optical nanoprobes (TA-AgNPs). Consequently, the proposed method represents progress towards the development of taurine diagnostic kits that offer superior qualitative performance, and facilitate rapid and cost-effective color changes. The ability of paraffin to penetrate the paper's structure and create a hydrophilic layer on its surface is the driving force behind this advancement (Scheme S1 and Video (see ESI†)).
3. Results and discussion
3.1. Determination of the appropriate nanoprobe type for the colorimetric detection of taurine
Three distinct nanoprobes – TA-AgNPs, GQDs, and AgNPs capped by citrate (Ag-Cit) – were mixed and combined with a 20 mM taurine standard in a 1:1 V/V solution, resulting in various colors for the control. Results presented in Fig. S1(A1 and A2)† reveal notable color changes exhibited by TA-AgNPs. Upon the addition of taurine to TA-AgNPs, their original sea blue hue transformed to a very light blue shade. However, there was no observable color change when taurine was mixed with GQDs, and when taurine was combined with Ag-Cit, as demonstrated in Fig. S1(B1, B2) and (C1, C2),† respectively. Subsequently, TA-AgNPs were selected for further analysis. As our objective was to examine the impact of pH on the colorimetric detection of taurine, the taurine biomarker was studied at different pH levels. These results were confirmed by DLS/zeta analysis of the probe after its reaction with the taurine biomarker (Fig. S2 (see ESI)†).
:1 for analysis. The detection of the activity and color change was documented at 0 min and 60 min after the reaction. As shown in the figures (Fig. 1(A and B)), the blue color of TA-AgNPs was reduced at all pH levels in the absence of taurine and the presence of McIlvaine. TA-AgNPs maintained color stability at pH 6.5, 7.5, and 8.2 when taurine was added to the McIlvaine's buffer solution.
 | ||
| Fig. 1 (A and B) Photographic images for the colorimetric analysis of (1–6) TA-AgNPs/buffer (Mcllvaine) solutions, (7–11) buffer solutions of taurine and 20 mM taurine/TA-AgNPs at different pH values (4.8, 5.8, 6.5, 7.5 and 8.2), and (12–16) different buffer (McIllvaine) solutions at different pH values (4.8, 5.8, 6.5, 7.5 and 8.2). The solutions were mixed at a V/V ratio of 1:1; (A) after 0 minutes and (B) after 60 minutes. (C and D) UV-vis spectral comparison of 20 mM taurine/TA-AgNPs in buffer (Mcllvaine) at different pH values with a V/V ratio of 1:1 after 0, 60 min. (E and F) Histogram curve of the actual pressure (TA-AgNPs) at 0.60 min, TA-AgNPs + buffer at different pH values, TA-AgNPs + taurine buffer at different pH values (1:1 V/V ratio). | ||
However, the introduction of taurine at a concentration of 20 mM led to a noticeable alteration in color within the pH range of 4.8 to 5.8. Subsequent examination using a UV-visible spectrophotometer (Fig. 1(C and D)) validated the extent and intensity of the blue color alteration with LSPR at pH 4.8 and 5.8. It is important to note that taurine did not inhibit the McIlvaine etching effect, especially at low pH values, resulting in an increased coverage of the TA-AgNPs surface. The histogram plot depicting the actual pressure of TA-AgNPs at 0.60 min (Fig. 1(E and F)) at various pH levels (1:1 v/v ratio) is also shown. Hence, this research study has developed and assessed a colorimetric assay centered on the transfer of TA-AgNPs within the pH range of 4.8 to 8.2.
3.2. Real sample analysis
To assess the validity of our approach in identifying taurine in actual samples, we employed the following supplementary techniques for analyzing blood and urine samples.:1, followed by centrifugation for 10 minutes to collect the supernatant. The taurine concentration in treated blood, TA-AgNPs, TA-AgNPs/McIlvaine (pH 4.8), TA-AgNPs/treated blood, and TA-AgNPs/treated blood/McIlvaine 10 mM taurine (pH 4.8) to 20 mM taurine (0.5:0.5 V/V/V) was then determined and analyzed for 60 minutes (Fig. 2(A)). Visual inspection revealed a decrease in the color intensity of TA-AgNPs after serum addition, even in the presence of taurine, with no discernible difference in color. Further analysis using UV-vis spectroscopy confirmed these observations, showing minimal variation in the peak area and absorption intensity of TA-AgNPs/treated blood in the presence and absence of taurine (Fig. 2(B)). These results were consistent with the UV-visible spectrum, thereby validating the colorimetric findings. The histogram and calibration of the corresponding solutions' peak position and absorbance intensity are depicted in Fig. 2(C–E). Notably, the equation Abs (a.u.) = 0.0488C(taurine) + 0.1416, with an R2 value of 0.9152, was established for the taurine concentration range of 1 μM to 2 mM, confirming the association between the wavelength and concentration.
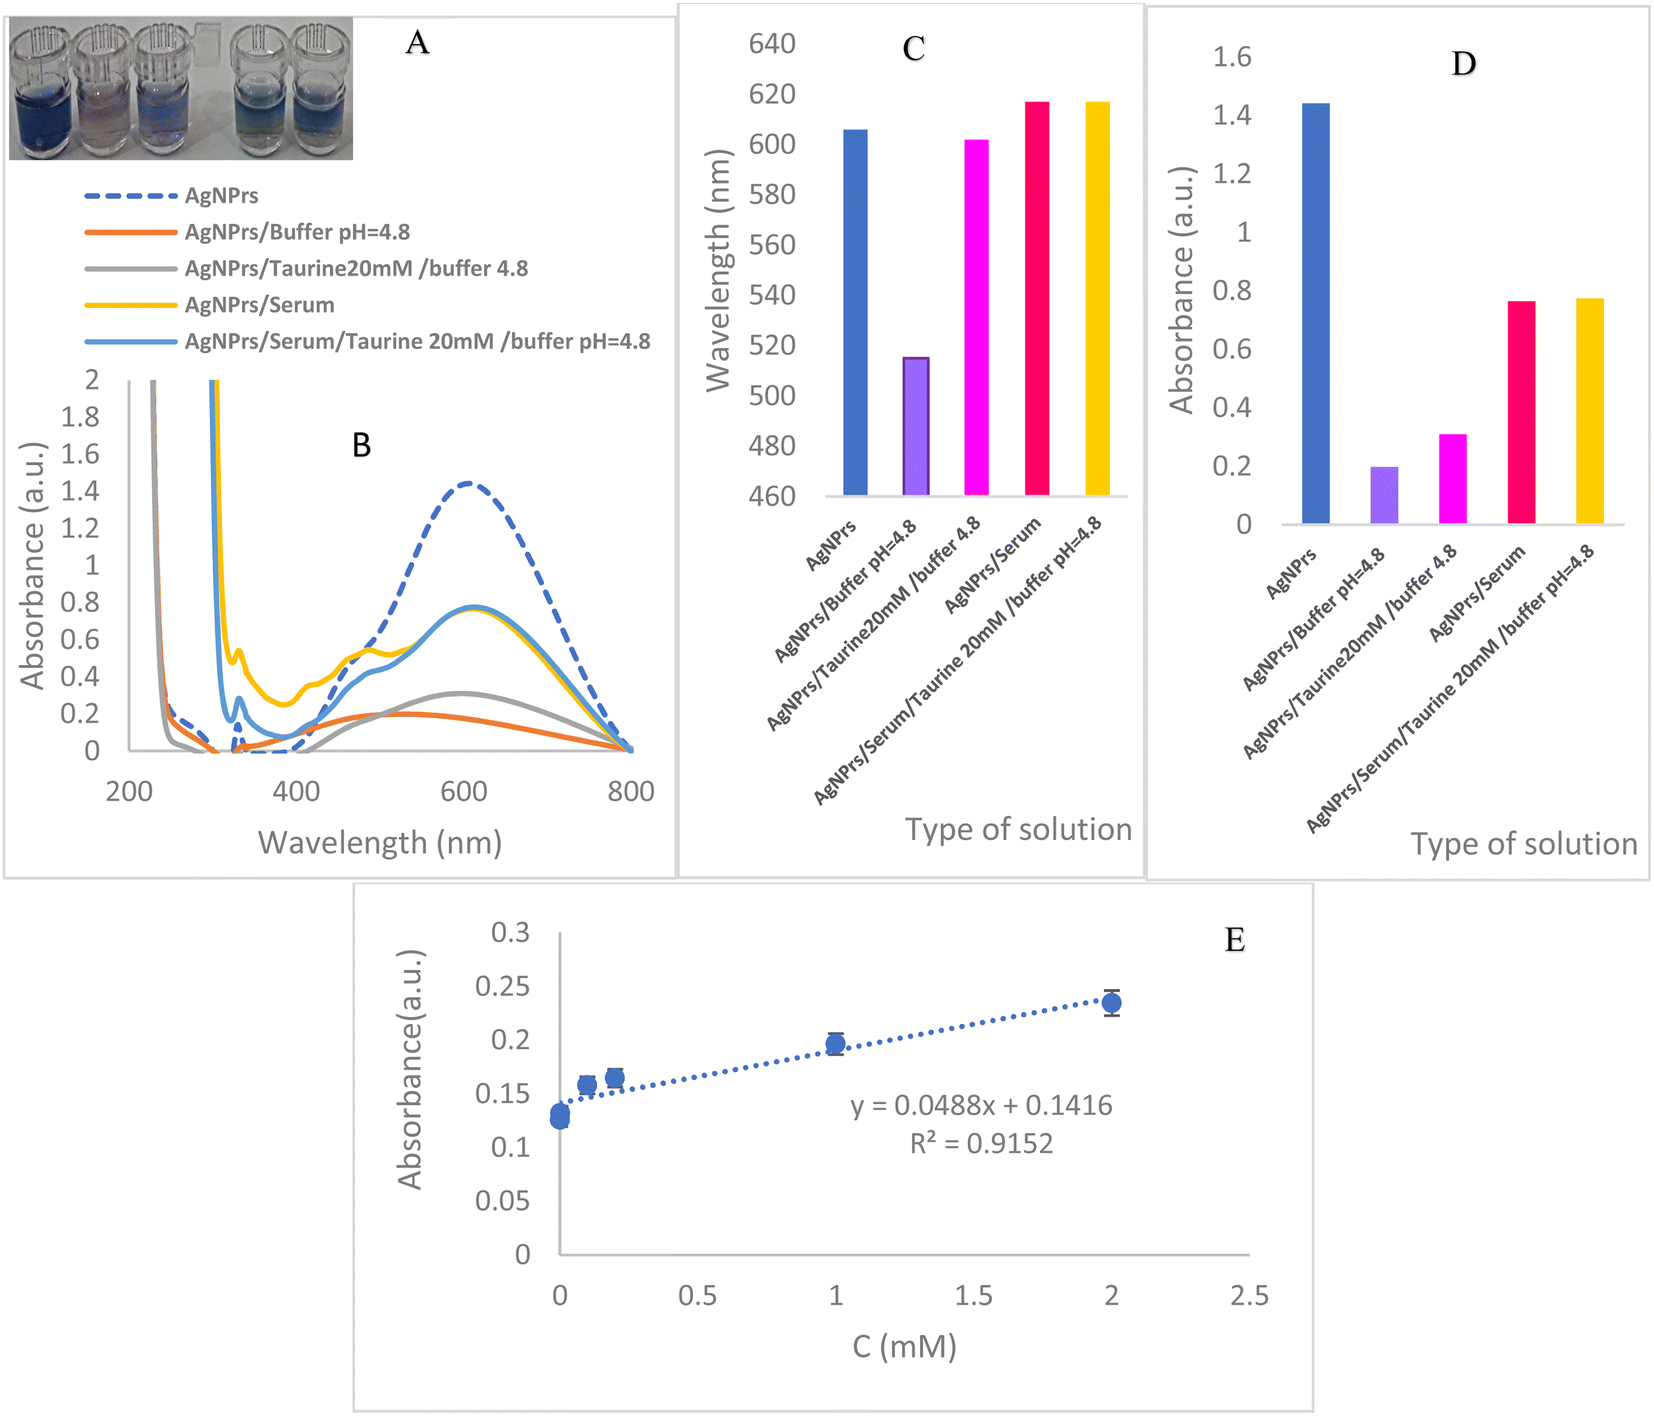 | ||
| Fig. 2 Photographic images of (A) (1) TA-AgNPs, (2) TA-AgNPs/buffer (pH 4.8), (3) TA-AgNPs/taurine (20 mM)/buffer (pH 4.8), (4) TA-AgNPs/serum, (5) TA-AgNPs/serum/taurine (20 mM)/buffer (pH 4.8) (1:0.5:0.5 V/V/V), After 60 min. (B) UV-Vis spectrum in 60 min. (C) A histogram curve of the peak position, and (D) a histogram curve of the peak intensity of the corresponding solutions. (1) TA-AgNPs, (2) TA-AgNPs/buffer (pH 4.8), (3) TA-AgNPs/taurine (20 mM)/buffer (pH 4.8), (4) serum-treated TA-AgNPs, and (5) serum-treated TA-AgNPs/taurine (20 mM)/buffer (pH 4.8) (1:0.5:0.5 V/V/V) after 60 min. (E) Calibration curves of the related absorbance intensity serum-treated AgNPs/taurine concentration. | ||
Because the applied analytical technique used in the solution did not yield acceptable results in detecting taurine, the research shifted to investigating the bioanalysis of taurine using PCDs.
3.3. Bioanalysis of taurine using PCDs
:1 to induce a noticeable color transformation for analysis. Illustratively shown in (Fig. 3(A, C) and Video (see ESI)†), the color alteration rapidly begins, and the TA-AgNPs demonstrate a discernible change after 60 minutes. Notably, upon introducing taurine with a pH of 4.8 into the TA-AgNPs, the color transitioned from sea blue to purple, becoming distinctly purple after 1 hour (Fig. 3(B, D) and Video (see ESI)†). In contrast, the anticipated color change does not manifest, leading to the selection of taurine with a pH value of 4.8 for further investigation.
 | ||
| Fig. 3 High-resolution images of PCD and parafilm (1) functionalized with 10 μL of TA-AgNPs, followed by (2) TA-AgNPs/McIlvaine buffer (pH = 4.8). (3) TA-AgNPs/McIlvaine buffer (pH = 5.8), (4) TA-AgNPs/McIlvaine buffer (pH = 6.5), (5) TA-AgNPs/McIlvaine buffer (pH = 7.5), (6) TA-AgNPs/McIlvaine buffer (pH = 8.2) (1:1 V/V), (7) TA-AgNPs + taurine 20 mM/McIlvaine buffer (pH = 4.8), (8) TA-AgNPs + taurine 20 mM/McIlvaine buffer (pH = 5.8), (9) TA-AgNPs + taurine 20 mM/McIlvaine buffer (pH = 6.5), (10) TA-AgNPs + taurine 20 mM/McIlvaine buffer (pH = 7.5), (11) TA-AgNPs + taurine 20 mM/McIlvaine buffer (pH = 8.2) (1:0.5:0.5 V/V). (A) High-resolution images of PCD in 0 min and (C) High-resolution images of parafilm in 0 min. (B) High-resolution images of PCD in 60 min and (D) High-resolution images of parafilm in 60 min. | ||
We visually assessed the color change and utilized the Photo Metrix software to confirm the effective mobility of PCD for reliable taurine identification in real samples, ensuring user satisfaction (Fig. S4 and S5†). The absorption rate of the analyte samples was determined in accordance with Beer's law.
In accordance with Lambert's law, the absorption of light by various solution layers remains constant, irrespective of the intensity of the emitted light. Beer's and Lambert's laws establish a linear relationship between the concentration of the solution and the absorbed light. Typically, the concentration of substances is determined within a range where the absorption demonstrates a linear correlation with the concentration. The amount of light absorbed, or the absorbance, A, is defined as:
| Abs = −logI/I0 |
| A = εbc |
A loss (OD) strategy is employed in performing the chemical analysis of taurine to minimize the consumption of reagents (analyte and solvent) during taurine monitoring. Consequently, a compact kit was created to specifically measure the taurine concentration with a lower limit of quantification (LLOQ) of 0.2 μM. The redox reaction between taurine and TA-AgNPs was assessed based on the color change observable with the naked eye within 30 minutes. In Table 1, the analytical performances of various methods for taurine detection, such as UV-vis and fluorescence, localized surface plasmon resonance (LSPR), NMR spectrometer, and electrochemical sensors, were compared with the method developed in this study. Most of the reported techniques offer several advantages, including low sensitivity, complex mobile phases, and time-consuming extraction procedures with limited applicability. A summary of the results obtained in this study compared with previously reported works is presented in Table 1,39–45 showing that the developed method has certain advantages over previous approaches in terms of stability, suitable surface area, and feasible biological activity. Notably, our study's strengths include the utilization of a calorimetric chemosensing procedure to detect taurine in urine and blood samples for the first time.
| Type of probe | Methods | Linear range | Limits of detection | Ref. |
|---|---|---|---|---|
| PLL-fGQDs, UiO-66@NH2 MOF | UV-vis and fluorescence | 5 ng mL−1 to 360 ng mL−1 | 2.91 ng mL−1 | 39 |
| PLL-fGQDs@UiO-66@NH2 MOF | 5 ng mL−1 to 360 ng mL−1 | 8.84 ng mL−1 | ||
| AuNPs probe | Localized surface plasmon resonance (LSPR) | 0–1 mM | 53 μM | 40 |
| 33s NMR probe | NMR spectrometer | 2–20 mM | 100 μM | 41 |
| Poly(aspartic acid)–graphene quantum dots (GQDs) | Electrochemical sensor (AUTOLAB) | 0.0022–0 M | 0.001 mM | 42 |
| ZnO nanowires | Electrochemiluminescence | 0 to 1 mM | 5.5 × 10⁻⁶ mol L−1 | 43 |
| MOFs and graphene composite-modified electrode | Electrochemical sensor (MIECS) | 1.00 × 10⁻¹⁴–1.00 × 10⁻⁸ mol L−1 | 3.20 × 10⁻¹⁵ mol L−1 | 44 |
| Silver nanoparticle-based nanocomposite | Electrochemical sensor | 0.7 nM to 0.1 mM | 0.7 nM | 45 |
| TA-AgNPs probe | Colorimetric and spectrophotometric chemosensor | 0.0002–20 mM | 0.2 μM (LLOQ) | This work |
We consider that the planned approach represents a reliable bio-assay for the quantitative analysis of the taurine biomarker in real samples. With regard to its response, the suggested chemosensor approach surpasses the performance of methods reported previously. Compared to previously reported findings (refer to Table 1), the results achieved in this study demonstrate that the developed method offers several advantages over previous approaches, such as enhanced stability, suitable surface area, and feasible biological activity.
Furthermore, a comparative analysis was conducted, as depicted in Table S1,† to further assess the capability of identifying taurine and to compare it with previous tests using various methods. This report represents the first discussion of paper and parafilm-based PCD sensors for taurine analysis. While one possible solution involves using the TMB reaction for quantifying the biomarker taurine through a colorimetric assay, the interaction between taurine and TMB is known to be specific and reliable for measuring small amounts of taurine, playing a crucial role in biochemical assays (Table S1, see ESI†). However, this approach is not employed due to environmental concerns.
:1 V/V ratio (refer to Fig. S4†). Initial analysis indicated no discernible differences among the varying taurine levels. However, RGB analysis unveiled a chemical interaction between the taurine concentration and absorbance, which did not align with the expected taurine standard concentration (Fig. S4A and B, ESI†). Consequently, the calibration curve depicting the peak intensity versus taurine concentration in urine, fluctuating from 200 nM to 0.2 mM with an incubation time of 60 minutes, exhibited an R2 value of 0.926. These findings are visually represented in Fig. S4C,† and further outlined in the accompanying video (ESI†).The serum sample was combined with acetonitrile in a 1:1 volume/volume ratio, and then centrifuged for 10 minutes to collect the supernatant. Subsequently, it underwent analysis following the addition of varying taurine concentrations (ranging from 1 μM to 2 mM, diluted in McIlvaine solution at pH 4.8) at a 1:1 volume/volume ratio (refer to Fig. S5†). The positive analysis indicated no discernible variance across the different taurine levels. However, an RGB analysis uncovered an unexpected relationship between the taurine concentration and absorbance, deviating from the anticipated taurine standard concentration (refer to Fig. S5(A and B)†). The calibration curve depicted in Fig. S5C† illustrates the peak intensity's correlation with taurine concentration in the serum, ranging from 1 μM to 2 mM over a duration of 60 minutes (ESI Video†).
:0.5:0.5 ratio) was applied to each of the ten sensing zones (refer to Fig. S5A and ESI Video†). Initially, the PCDs' sensing zones were loaded with TA-AgNPs, TA-AgNPs/taurine at pH = 4.8, TA-AgNPs/taurine/Gly, TA-AgNPs/taurine/Cys, TA-AgNPs/taurine/Met, TA-AgNPs/taurine/Prol, TA-AgNPs/taurine/Phe, TA-AgNPs/taurine/Asp, TA-AgNPs/taurine/AA, TA-AgNPs/taurine/dopamine, and TA-AgNPs/taurine/uric acid, and were observed after 60 minutes incubation time. According to the obtained results (Fig. S7B†), the most significant color change was evident only in the region containing TA-AgNPs/taurine/dopamine, resulting in a yellow color. Conversely, no notable changes were observed in the other areas (Fig. S7B and ESI Video†). Specifically, the reactions for taurine/phenyl and taurine/aspartate necessitate a longer incubation period. These findings demonstrate that despite the presence of active components, the proposed optical probe presents high selectivity for detecting taurine.The method for taurine determination was enhanced by combining smartphone image capture with RGB, offering advantages such as speed, low cost, reduced reagent consumption, and minimal waste generation. Replicating the digital imaging-based process is crucial to ensure accurate data analysis, as the cylindrical, hand-made box with LEDs captures images without introducing shadows or excessive brightness. The information generated during this process is dependable not only for calibration, but also for determining sample composition. The results demonstrate numerous potential applications for this method, and a simple dilution modification of the dye is all that is required. Varying the number of samples will not lead to errors in the measured taurine content. The absence of significant differences highlights the reliability and robustness of the following methods.
4. Conclusion
In summary, the interaction of triangular TA-AgNPs with taurine led to the development of a versatile, simple, rapid, and cost-effective method for identifying taurine in real samples using naked eye and UV-visible light spectroscopy. Moreover, the use of PCD demonstrated excellent stability and reproducibility for colorimetric quantification of taurine in human biological fluids under various conditions. The method exhibited impressive LLOQs of less than 0.2 μM using UV-vis spectrophotometric and colorimetric techniques, owing to the vast potential of TA-AgNPs. This research has laid the groundwork for developing straightforward and effective semi-quantitative analytical devices, which could revolutionize research into heart disease and its treatments through real-time on-site detection of taurine in a portable device. Furthermore, PCDs hold the potential for integration with smart devices like smartphones, enabling personalized medicine. It is anticipated that the preparation process/PCD can be adjusted to focus on liquid taurine in the human body.Conflicts of interest
There are no conflicts to declare.Acknowledgements
The research reported in this publication was supported by the Elite Researcher Grant Committee under award number [4003682] from the National Institutes for Medical Research Development (NIMAD), Tehran, Iran, [IR.NIMAD.REC.1402.063].References
- A. T. Jan, M. Azam, K. Siddiqui, A. Ali, I. Choi and Q. M. R. Haq, Int. J. Mol. Sci., 2015, 16, 29592–29630 CrossRef CAS PubMed.
- N. I. Callaghan, L. J. Durland, R. G. Ireland, J. P. Santerre, C. A. Simmons and L. Davenport Huyer, npj Regener. Med., 2022, 7, 44 CrossRef PubMed.
- S. W. Schaffer, C. J. Jong, T. Ito and J. Azuma, Amino Acids, 2014, 46, 21–30 CrossRef CAS PubMed.
- P. F. Surai, K. Earle-Payne and M. T. Kidd, Antioxidants, 2021, 10, 1876 CrossRef CAS PubMed.
- A. E. Roşca, A.-M. Vlădăreanu, R. Mirica, C.-M. Anghel-Timaru, A. Mititelu, B. O. Popescu, C. Căruntu, S. E. Voiculescu, Ş. Gologan and M. Onisâi, J. Clin. Med., 2022, 11, 666 CrossRef PubMed.
- A. C. Rosa, D. Corsi, N. Cavi, N. Bruni and F. Dosio, Molecules, 2021, 26, 1844 CrossRef CAS PubMed.
- R. Heidari and M. M. Ommati, Taurine and the Mitochondrion: Applications in the Pharmacotherapy of Human Diseases, Bentham Science Publishers, 2023 Search PubMed.
- S. Baliou, M. Adamaki, P. Ioannou, A. Pappa, M. I. Panayiotidis, D. A. Spandidos, I. Christodoulou, A. M. Kyriakopoulos and V. Zoumpourlis, Mol. Med. Rep., 2021, 24, 1–19 Search PubMed.
- Y. Su, W. Fan, Z. Ma, X. Wen, W. Wang, Q. Wu and H. Huang, Neuroscience, 2014, 266, 56–65 CrossRef CAS PubMed.
- A. Erdem, A. Sevgili, F. Akbiyik, P. Atilla, N. Cakar, Z. Balkanci, A. Iskit and M. Guc, Amino Acids, 2008, 35, 403–410 CrossRef CAS PubMed.
- Y. Gao, X. Li, J. Gao, Z. Zhang, Y. Feng, J. Nie, W. Zhu, S. Zhang and J. Cao, Dose-Response, 2019, 17, 1559325819883479 CAS.
- H. M. Awwad, J. Geisel and R. Obeid, J. Chromatogr. B, 2016, 1038, 12–18 CrossRef CAS PubMed.
- C. Terriente-Palacios, I. Diaz and M. Castellari, J. Chromatogr. A, 2019, 1589, 83–92 CrossRef CAS PubMed.
- K. A. Todorova and I. P. Pencheva, Int. J. Nutr. Food Sci., 2015, 4, 1–8 CrossRef.
- M. Revenga-Parra, E. Martínez-Periñán, B. Moreno, F. Pariente and E. Lorenzo, Electrochim. Acta, 2017, 240, 506–513 CrossRef CAS.
- B. Lee, A. New and C. Ong, J. Chromatogr. B: Biomed. Sci. Appl., 1997, 704, 35–42 CrossRef CAS PubMed.
- H. N. Baghban, H. Kholafazad, A. Nilghaz, R. Ebrahimi, M. Hasanzadeh and N. Shadjou, J. Photochem. Photobiol., A, 2024, 453, 115596 CrossRef.
- D. Vilela, M. C. González and A. Escarpa, Anal. Chim. Acta, 2012, 751, 24–43 CrossRef CAS PubMed.
- I. Che Sulaiman, B. Chieng, M. Osman, K. Ong, J. Rashid, W. Wan Yunus, S. Noor, N. Kasim, N. Halim and A. Mohamad, Microchim. Acta, 2020, 187, 1–22 CrossRef PubMed.
- H. Kolya, K. Hashitsume and C.-W. Kang, Toxics, 2021, 9, 143 CrossRef CAS PubMed.
- R. Umapathi, S. Sonwal, M. J. Lee, G. M. Rani, E.-S. Lee, T.-J. Jeon, S.-M. Kang, M.-H. Oh and Y. S. Huh, Coord. Chem. Rev., 2021, 446, 214061 CrossRef CAS.
- D. Stoia, L. De Sio, F. Petronella and M. Focsan, Biosens. Bioelectron., 2024, 116243 CrossRef CAS PubMed.
- F. Farshchi, A. Saadati, M. Hasanzadeh and N. Shadjou, Food Chem., 2024, 14, 15755–15765 CAS.
- L. Qi, A. Liao, X. Huang, X. Li, X. Jiang, X. Yuan and K. Huang, Coord. Chem. Rev., 2024, 508, 215787 CrossRef CAS.
- G. M. Fernandes, W. R. Silva, D. N. Barreto, R. S. Lamarca, P. C. F. L. Gomes, J. F. da S Petruci and A. D. Batista, Anal. Chim. Acta, 2020, 1135, 187–203 CrossRef CAS PubMed.
- C. Dincer, R. Bruch, E. Costa-Rama, M. T. Fernández-Abedul, A. Merkoçi, A. Manz, G. A. Urban and F. Güder, Adv. Mater., 2019, 31, 1806739 CrossRef PubMed.
- R. S. Lamarca, N. da Costa Luchiari, A. F. Bonjorno, J. Passaretti Filho, A. A. Cardoso and P. C. F. de Lima Gomes, Anal. Methods, 2019, 11, 3697–3705 RSC.
- D. R. Albert, M. A. Todt and H. F. Davis, J. Chem. Educ., 2012, 89, 1432–1435 CrossRef CAS.
- T. S. Kuntzleman and E. C. Jacobson, J. Chem. Educ., 2016, 93, 1249–1252 CrossRef CAS.
- M. M. Bordbar, A. Sheini, P. Hashemi, A. Hajian and H. Bagheri, Biosensors, 2021, 11, 316 CrossRef CAS PubMed.
- S. Chandel and T. Agarwal, Renewable Sustainable Energy Rev., 2017, 67, 581–596 CrossRef CAS.
- T. Akyazi, L. Basabe-Desmonts and F. Benito-Lopez, Anal. Chim. Acta, 2018, 1001, 1–17 CrossRef CAS PubMed.
- M. M. AlShehri and M. A. AlMeshal, Arabian J. Chem., 2020, 13, 2096–2100 CrossRef CAS.
- A. Saadati, F. Farshchi, M. Hasanzadeh and F. Seidi, Anal. Methods, 2021, 13, 3909–3921 RSC.
- D. Mark, S. Haeberle, G. Roth, F. Von Stetten and R. Zengerle, Microfluidics Based Microsystems: Fundamentals and Applications, 2010, pp. 305–376 Search PubMed.
- M. M. Ali, C. L. Brown, S. Jahanshahi-Anbuhi, B. Kannan, Y. Li, C. D. Filipe and J. D. Brennan, Sci. Rep., 2017, 7, 12335 CrossRef PubMed.
- R. Koivunen, Inkjet printed hydrophobic microfluidic channelling on porous substrates, International Research Conference of Advances in Printing and Media Technology, Swansea, United Kingdom. 2014 Search PubMed.
- G. de Carvalho Oliveira, C. C. S. Machado, D. K. Inácio, J. F. da Silveira Petruci and S. G. Silva, Talanta, 2022, 241, 123244 CrossRef CAS PubMed.
- S. Nangare, K. Chaudhari and P. Patil, J. Photochem. Photobiol., A, 2024, 446, 115158 CrossRef CAS.
- P. Sharma, V. Semwal and B. D. Gupta, Opt. Fiber Technol., 2019, 52, 101962 CrossRef CAS.
- F. Hobo, M. Takahashi and H. Maeda, Rev. Sci. Instrum., 2009, 80, 036106 CrossRef PubMed.
- N. Shadjou, S. Alizadeh and M. Hasanzadeh, J. Mol. Recognit., 2018, 31, e2737 CrossRef PubMed.
- T. Guerrero-Esteban, C. Gutiérrez-Sánchez, M. Revenga-Parra, J. L. Pau, F. Pariente and E. Lorenzo, Talanta, 2019, 204, 63–69 CrossRef CAS PubMed.
- D. Duan, J. Wang, P. Han, X. Liu, L. Zhao and S. Ma, Microchim. Acta, 2023, 190, 162 CrossRef CAS PubMed.
- M. Hasanzadeh, E. Javidi, A. Jouyban, A. Mokhtarzadeh, N. Shadjou and S. Mahboob, J. Mol. Recognit., 2018, 31, e2739 CrossRef PubMed.
Footnote |
| † Electronic supplementary information (ESI) available. See DOI: https://doi.org/10.1039/d4ra03575e |
| This journal is © The Royal Society of Chemistry 2024 |