 Open Access Article
Creative Commons Attribution 3.0 Unported Licence
Synthesis, anticancer evaluation of novel hybrid pyrazole-based chalcones, molecular docking, DNA fragmentation, and gene expression: in vitro studies†
Norhan Yasserad,
Farid M. Sroor *b,
Haidan M. El-Shorbagyad,
Shaymaa M. Eissaa,
Hamdi M. Hassaneenc and
Ismail A. Abdelhamid
 *c
*c
aDepartment of Zoology, Faculty of Science, Cairo University, 12613 Giza, Egypt
bOrganometallic and Organometalloid Chemistry Department, National Research Centre, 12622 Cairo, Egypt. E-mail: faridsroor@gmx.de; fm.sroor@nrc.sci.eg
cDepartment of Chemistry, Faculty of Science, Cairo University, Giza, Egypt. E-mail: ismail_shafy@yahoo.com; ismail_shafy@cu.edu.eg
dFaculty of Biotechnology, October University for Modern Science and Arts, 6th October, Giza, Egypt
First published on 9th July 2024
Abstract
A unique series of pyrazolyl-chalcone derivatives was synthesized via the method of Claisen–Schmidt condensation. The desired chalcone derivatives 7a–d and 9a–f were obtained in good yields by reacting the 4-acetyl-5-thiophene-pyrazole with the appropriate heteroaryl aldehyde derivatives. The novel chalcones have undergone complete elemental analysis, 1H-NMR, 13C-NMR, mass spectrometry, and IR characterization. The three human cancer cell lines MCF7 (human Caucasian breast adenocarcinoma), PC3 (prostatic cancer) and PACA2 (pancreatic carcinoma) as well as the normal cell line BJ1 (normal skin fibroblasts) were tested in vitro for the anti-cancer properties of the newly synthesized chalcone derivatives. When compared to the reference medicine doxorubicin (IC50 = 52.1 μM), compound 9e showed the most promise derivative (IC50 = 27.6 μM) against PACA2 cells, while compound 7d demonstrated anticancer efficacy (IC50 = 42.6 μM against MCF7 cells compared to the reference drug doxorubicin (IC50 = 48 μM). Using breast and pancreatic cell lines, the gene expression, DNA damage, and DNA fragmentation percentages for compounds 7d and 9e were evaluated. Moreover, the molecular docking study of compounds 7d and 9e was assessed. The binding affinities of compound 9e toward P53 mutant Y220C was −22 kcal per mole, while those of compound 7d towards Bcl2 and CDK4 were −27.81 and −26.9 kcal per mole, respectively, compared to the standard values (−15.82, −33.96 and −29.9 kcal per mole).
1 Introduction
Cancer cells arise when a cell ignores the rules governing cell division and starts to proliferate according to its own agenda. In 2040, there will likely be 28.4 million instances of cancer worldwide. According to the GLOBOCAN 2020 report, the primary cause of cancer incidence worldwide in 2020 is no longer lung cancer but rather breast cancer in women, with 2.3 million new cases expected, accounting for 11.7% of all cases of cancer and prostate cancer. Prostate cancer accounts for 7.3% of all cancer cases and is the second most common cancer in men. It is also the fifth largest cause of cancer-related death among males.1,2 Pancreatic cancer is the seventh greatest cause of cancer death in both sexes and, due to its poor prognosis, accounts for nearly as many deaths (466![[thin space (1/6-em)]](https://www.rsc.org/images/entities/char_2009.gif) 000) as cases (496
000) as cases (496![[thin space (1/6-em)]](https://www.rsc.org/images/entities/char_2009.gif) 000).1 Chemotherapeutic drugs are a standard treatment for the majority of malignancies, every patient responds differently to this kind of treatment, particularly when their tumors are inadequately diagnosed. The necessity for combination therapy and/or targeted medicines is indicated by tumor heterogeneity, the existence of cancer stem cells, and the adaptability of these cells.3 With multi-drug-resistant tumors continuously evolving, developing new drugs with enhanced efficacy is essential. The two main goals of cancer treatments are to destroy cancer cells (cytotoxic impact) and stop them from proliferating (cytostatic effect).4
000).1 Chemotherapeutic drugs are a standard treatment for the majority of malignancies, every patient responds differently to this kind of treatment, particularly when their tumors are inadequately diagnosed. The necessity for combination therapy and/or targeted medicines is indicated by tumor heterogeneity, the existence of cancer stem cells, and the adaptability of these cells.3 With multi-drug-resistant tumors continuously evolving, developing new drugs with enhanced efficacy is essential. The two main goals of cancer treatments are to destroy cancer cells (cytotoxic impact) and stop them from proliferating (cytostatic effect).4
The α,β-unsaturated variants of chalcones, which are secondary metabolites of plants, have a more stable thermodynamic trans-conformation among two aryl groups. Chalcones can be generated easily utilizing the Claisen–Schmidt condensation reaction, which is a commonly employed method to synthesize these compounds by condensation of carbonyl derivatives with the presence of a base.5–7 Numerous biological and pharmacological behavior, including anticancer, antibacterial, anti-proliferative, antifungal, antioxidant, and anti-inflammatory properties, have been linked to chalcones that incorporate heterocyclic scaffolds.6,8,9 In addition, it has been found that 3-(thiophen-2-yl)-1H-pyrazoles have promising biological implications.7,10–15 Cancer and death rates continue to increase dramatically worldwide. The growth of cancer is characterized by its rapidity and adaptability, which makes it difficult to find new therapies that will offer more potent therapeutic treatments due to drug resistance and side effects. In light of these results, and in keeping with our research interest in the synthesis of bioactive heterocycles,2,16–23 we were motivated to create a novel series of chalcones (7a–d and 9a–f) associated with heterocyclic moieties and assess their anti-tumor efficacy in vitro using different human cancer cell lines. The novel chalcones 7d and 9e proved potent and interesting cytotoxic effects against breast cancer cell lines (MCF7) and pancreatic cancer cell lines (PACA2), respectively compared with doxorubicin as a reference drug. Moreover the DNA fragmentation, comet assay and molecular docking studies were investigated for the most promising compounds (7d and 9e).
2 Results and discussion
2.1 Chemistry
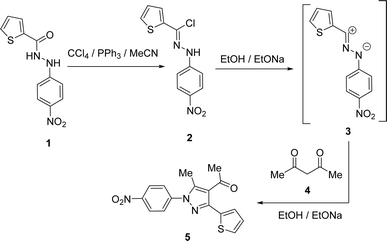
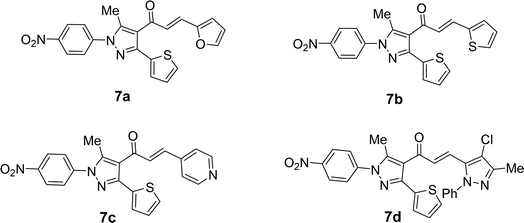
1-(3-(Thiophen-2-yl)-1H-pyrazol-4-yl)ethan-1-one (5) was synthesized straightforwardly as reported in the literature24 and depicted in Scheme 1 and used as a suitable precursor to prepare the titled chalcone derivatives. Chlorination of thiophene-2-carbohydrazide (1) gave thiophene-2-carbohydrazonoyl chloride (2). The treatment of 2 with acetylacetone (4) in an ethanolic sodium ethoxide solution, 5 is produced via the intermediacy of nitrilimine (3) (Scheme 1).4-Acetyl-3-(thiophen-2-yl)-1H-pyrazole (5) in ethanol and the presence of NaOH solution underwent Claisen–Schmidt condensation with equimolar amounts of heteroaldehydes 6a–d (specifically, furan-2-carbaldehyde 6a, thiophene-2-carbaldehyde 6b, isonicotinaldehyde 6c, 4-chloro-3-methyl-1-phenyl-1H-pyrazole-5-carbaldehyde 6d) afforded the corresponding chalcone derivatives, 3-(thiophen-2-yl)pyrazolyl-chalcones (7a–d) as depicted in Schemes 2 and Fig. 1.
Based on their spectrum data, the end products of the synthesized chalcones' chemical structures were established. 1H NMR (300 MHz, CDCl3) spectrum of 7d as a representative example for series of 7a–d showed the presence of two singlet signals at δ 2.18 and 2.68 (ppm) for the methyl groups. The protons of the vinyl group were observed at δ 6.95 (ppm) as a doublet with coupling constant J = 15.9 (Hz) indicting trans configuration. The other aromatic protons appear at their expected position at δ 7.27–7.79 (ppm). Due to the symmetry in some carbons in compound 7d, 23 carbon' signals in the 13C-NMR spectrum were recorded and the carbon of the carbonyl group was observed at δ 186.6 (ppm).
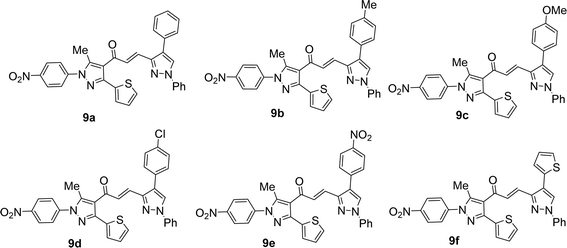
Likewise, the treatment of 5 with pyrazole-2-carboxaldehyde derivatives (8a–f) (specifically, 1,4-diphenyl-1H-pyrazole-3-carbaldehyde 8a, 1-phenyl-4-(p-tolyl)-1H-pyrazole-3-carbaldehyde 8b, 4-(4-methoxyphenyl)-1-phenyl-1H-pyrazole-3-carbaldehyde 8c, 4-(4-chlorophenyl)-1-phenyl-1H-pyrazole-3-carbaldehyde 8d, 4-(4-nitrophenyl)-1-phenyl-1H-pyrazole-3-carbaldehyde 8e, 1-phenyl-4-(thiophen-2-yl)-1H-pyrazole-3-carbaldehyde 8f) produced the targeted chalcone derivatives (9a–f) in good to excellent yield (Schemes 3 and Fig. 2).
2.2 Anti-cancer activity
The obtained results were summarized in Table 1 and showed that compound 7d possesses anticancer activities in the range of 70–80% on MCF7, PC3, and PACA2 cell lines, while compounds 7a and 9f exhibited specific anticancer activity on MCF7 cell line 63.5 and 80.4%, respectively. Compound 9e showed specific anticancer activity on the PACA2 cell line 100%. Compounds 7a, 9e and 7d exhibited limited inhibition activity on BJ1 cell lines (11.2, 5.6, and 12.3% respectively). The other compounds showed low activity against MCF7, PC3, and PACA2 cell lines as presented in Table 1. To find their IC50, the most efficacious compounds (7a, 9e, and 7d) underwent secondary screening.| Compound | MCF7 | PACA2 | PC3 | BJ1 |
|---|---|---|---|---|
| 7a | 63.5 ± 0.11 | 17.3 ± 0.13 | 3.8 ± 0.65 | 11.2 ± 0.48 |
| 7b | 45.3 ± 0.98 | 32.5 ± 0.74 | 4.2 ± 0.73 | — |
| 7c | 100% up to 6.25 μg ml−1 | 100% up to 6.25 μg ml−1 | 100% up to 6.25 μg ml−1 | 52.3 ± 0.76 |
| 7d | 71.2 ± 0.14 | 80.3 ± 019 | 70.6 ± 0.97 | 12.3 ± 0.23 |
| 9a | 42.3 ± 0.21 | 50.3 ± 0.42 | 4.5 ± 0.26 | — |
| 9b | 44.5 ± 0.74 | 39.5 ± 0.91 | 27.2 ± 0.31 | — |
| 9c | 25.2 ± 0.41 | 19.8 ± 0.68 | 2.9 ± 0.57 | — |
| 9d | 44.2 ± 0.33 | 54.5 ± 0.84 | 3.5 ± 0.92 | — |
| 9e | 14.2 ± 0.37 | 100 | 5.3 ± 0.94 | 5.6 ± 0.55 |
| 9f | 80.4 ± 0.25 | 16.5 ± 0.35 | 4.5 ± 0.23 | — |
| Doxorubicin | 100 | 100 | 100 | 100 |
According to IC50 values, compound 7d had been found to be a promising chemical against the MCF7 cell line, with an IC50 value of 42.6 μM when compared to the reference drug doxorubicin (IC50 = 48.0 μM) (Table 2). Additionally, compound 9e showed the highest efficacy against the PACA2 cell line, with an IC50 of 27.6 μM compared to the reference drug doxorubicin (IC50 = 52.1 μM). Cancer can be treated in one of three ways: surgery, chemotherapy, or radiation. Chemotherapy, such as doxorubicin, is frequently given prior to surgery. The principal dose-limiting adverse effect of these chemicals is cardiotoxicity, which can result in heart failure in extreme situations.25 Thus, new therapeutic medications are required to counteract the negative effects of present treatments. We effectively synthesized a novel series of pyrazolyl-chalcone derivatives as powerful anticancer drugs and tested their in vitro cytotoxicity against three different human cancer cell lines. The expression levels of the apoptotic genes P53, BID, and CCND1 were investigated in PACA2 9e-treated cells, as well as the anti-apoptotic genes Bcl2, CDK4, and p21 in MCF7 7d-treated cells.
| Compound | MCF7 | PACA2 | PC3 | BJ1 |
|---|---|---|---|---|
| 7a | 72.3 ± 0.34 | — | — | — |
| 7b | — | — | — | — |
| 7c | — | — | — | 86.2 ± 0.22 |
| 7d | 42.6 ± 0.71 | 51.9 ± 0.29 | 66.9 ± 0.98 | — |
| 9a | — | — | — | — |
| 9b | — | — | — | — |
| 9c | — | — | — | — |
| 9d | — | — | — | — |
| 9e | 59.3 ± 0.85 | 27.6 ± 0.33 | — | — |
| 9f | — | — | — | — |
| Doxorubicin | 48.0 ± 0.74 | 52.1 ± 0.64 | 43.8 ± 0.24 | 13.6 ± 0.28 |
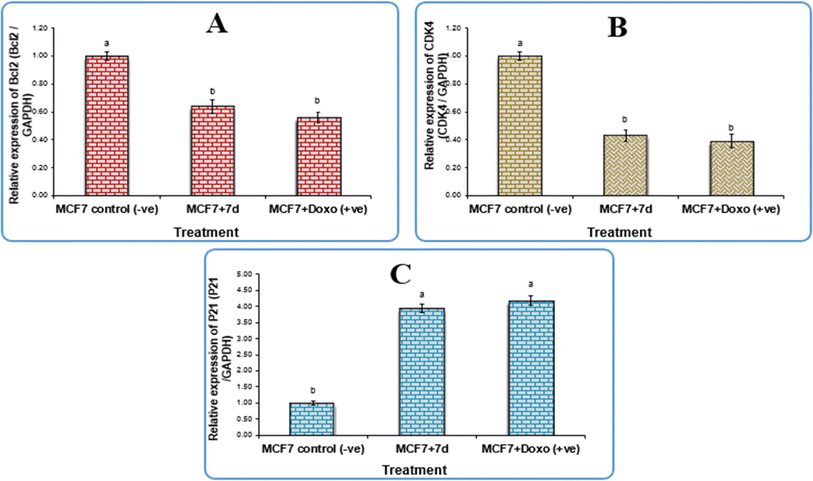
According to the qPCR results, which are displayed in Table 3, compound 7d successfully upregulated the p21 gene expression with a fold change value of 3.95. This indicates that compound 7d may be responsible for cell cycle arrest because the p21 protein is a universal inhibitor of multiple cyclin-dependent kinases, which pauses the G1 to S and G2 to M phases of the cell cycle.26 Conversely, it had a down-regulatory effect on the expression level of the antiapoptotic gene Bcl-2 and CDK4, with fold change values of 0.64 and 0.43, respectively. Mammary gland tumours require CDK4 in order to form.27 Tumorigenesis has been shown to be significantly impacted by downregulation of the CDK4/6-cyclin D/INK4/pRB/E2F axis, or its promoters.28
| Gene expression (fold change/GAPDH) sample | |||
|---|---|---|---|
| Sample | Bcl-2 | CDK4 | P21 |
| 7d | 0.64 | 0.43 | 3.95 |
| MCF7 +ve control | 0.56 | 0.39 | 4.18 |
| MCF7 −ve control | 1 | 1 | 1 |
Bcl-2 is an essential component in preventing apoptosis by preventing the release of cyt-c from the mitochondria, and as such, it has been recognized as a possible target for establishing of innovative anti-tumor treatments.29 As a result, 7d may be employed as a Bcl-2 and CDK4 inhibitor to cause apoptosis in the therapy of breast cancer. Chalcones have been shown in earlier investigations to induce apoptosis by upregulating the expressions of Bcl-2 and p53 in several cancer cell lines.2,18,30
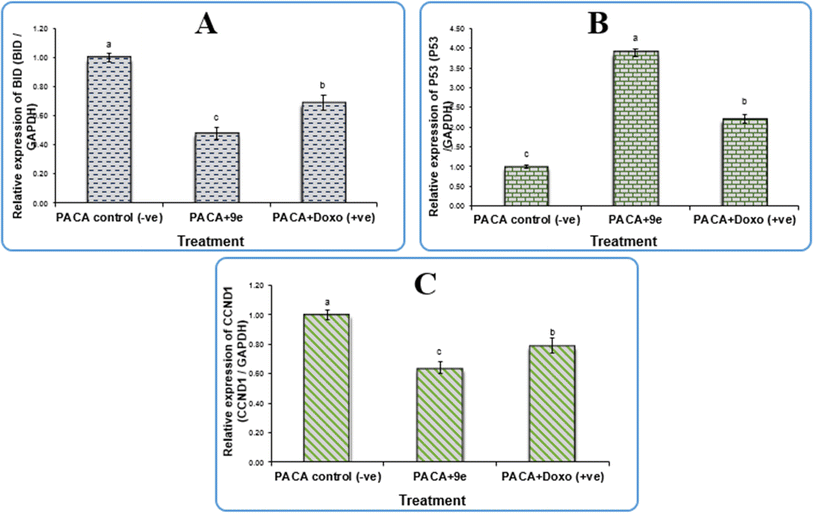
In terms of qPCR data, our findings shown in Table 4 revealed that compound 9e upregulated p53 expression levels by a factor of 3.89, which is at the heart of the cell's tumor suppressive mechanism. Conversely, 9e downregulated the expression levels of BID and CCND1 with fold change values of 0.48 and 0.64, respectively. The primary cyclin involved in the cell's transition from the G1 to S phase, cyclin D1 (CCND1), is a critical modulator of cell cycle progression and is essential to the etiology of cancer.31 A member of the pro-apoptotic Bcl-2 family, Bid activates the intrinsic mechanism of apoptosis by activating Bak and Bax directly, allowing cytochrome c to be released from the mitochondria, and triggering the activation of downstream caspases, which in turn causes cell apoptosis.32 Our results confirm that the 9e compound induced apoptosis and cell cycle arrest and thus can be used as a promising antitumor therapeutic drug.
| Gene expression (fold change/GAPDH) sample | |||
|---|---|---|---|
| Sample | P53 | BID | CCND1 |
| 9e | 3.89 | 0.48 | 0.64 |
| PACA +ve control | 2.21 | 0.69 | 0.79 |
| PACA −ve control | 1 | 1 | 1 |
| Treatment | DNA fragmentation (%) M ± SEM | Change | Inhibition (%) |
|---|---|---|---|
| a NB: means with different superscripts (a and b) between treatments in the same column are significantly different at P < 0.05. | |||
| 7d | 21.8 ± 0.94a | 13.2 | 20.48 |
| MCF7 +ve control | 25.2 ± 0.65a | 16.6 | 23.67 |
| MCF7 −ve control | 8.6 ± 0.36b | 0 | 0 |
| Treatment | DNA fragmentation (%) M ± SEM | Change | Inhibition (%) |
|---|---|---|---|
| a NB: means with different superscripts (a and b) between treatments in the same column are significantly different at P < 0.05. | |||
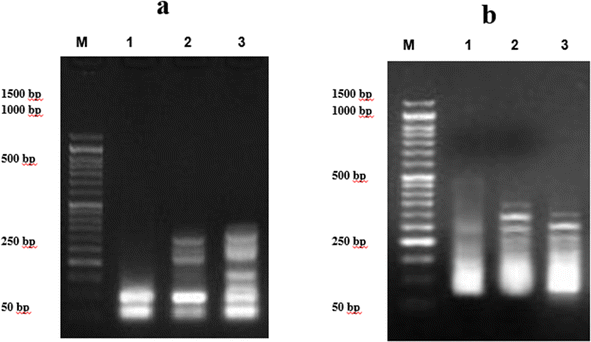
| PACA (−ve) control | 8.3 ± 0.31b | 0 | 0 |
| 9e | 24.2 ± 0.57a | 15.9 | 24.45 |
| PACA (+ve) control | 21.5 ± 0.46a | 13.2 | 17.94 |
We demonstrated the capability of chalcone derivatives to induce DNA damage. Compounds 9e and 7d significantly increased DNA damage in PACA2, and MCF7 human cancer cell lines, as indicated by DNA fragmentation tests. Similar results have been reported for chalcone derivatives, which lowered the long-term survival of HepG2 cancer cells owing to DNA fragmentation.33 Furthermore, chalcone derivatives totally destroyed the genomic DNA of HCT1.7,20,21,33,34 Similar conclusions have been observed for pyrazolyl-chalcones which markedly elevated the DNA fragmentation values (p 0.01) in the treated lung and liver cell line samples in contrast to the negative control.15 Chalcone derivatives have the potential for damaging DNA by binding DNA strands through interactions between aromatic ring stacking and van der Waal forces. Molecular docking study demonstrating that chalcones are linked to a DNA dodecamer with multiple hydrogen bonds provide evidence that the unsaturated carbonyl system in chalcone compounds allows greater electrostatic interactions between the hydrogen and DNA bases.35
| Treatment | No. of samples | No. of cells | Classb | DNA damaged cells% (mean ± SEM) | ||||
|---|---|---|---|---|---|---|---|---|
| Analyzeda | Comets | 0 | 1 | 2 | 3 | |||
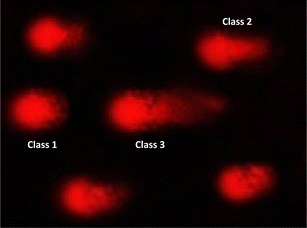
| a Number of cells examined per a group.b Class 0 = no tail; 1 = tail length < diameter of nucleus; 2 = tail length between 1× and 2× the diameter of nucleus; and 3 = tail length > 2× the diameter of nucleus. Means with different superscripts (a,b,c) between groups in the same treatment are significantly different at P < 0.05. Data are presented as mean ± SEM. | ||||||||
| MCF-7 (−ve) | 4 | 405 | 39 | 366 | 26 | 9 | 4 | 9.63 ± 0.64c |
| MCF-7 + 7d | 4 | 405 | 105 | 300 | 30 | 41 | 34 | 25.93 ± 1.08a |
| MCF-7 + Dox | 4 | 405 | 89 | 316 | 27 | 33 | 29 | 21.98 ± 0.91b |
| Treatment | No of samples | No. of cells | Classb | DNA damaged cells% (mean ± SEM) | ||||
|---|---|---|---|---|---|---|---|---|
| Analyzeda | Comets | 0 | 1 | 2 | 3 | |||
| a Number of cells examined per a group.b Class 0 = no tail; 1 = tail length < diameter of nucleus; 2 = tail length between 1× and 2× the diameter of nucleus; and 3 = tail length > 2× the diameter of nucleus. Means with different superscripts (a,b) between groups in the same treatment are significantly different at P < 0.05. Data are presented as mean ± SEM. | ||||||||
| Paca2 (−ve) | 4 | 405 | 41 | 364 | 29 | 9 | 3 | 10.12 ± 0.85b |
| Paca2 + 9e | 4 | 405 | 115 | 290 | 35 | 37 | 43 | 28.40 ± 1.04a |
| Paca2 + Dox | 4 | 405 | 106 | 299 | 38 | 32 | 36 | 26.17 ± 1.38a |
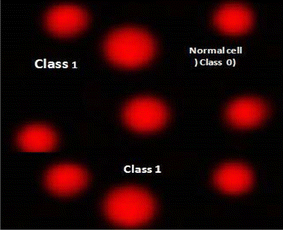
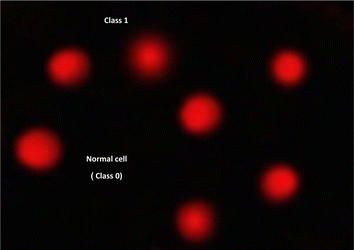 | ||
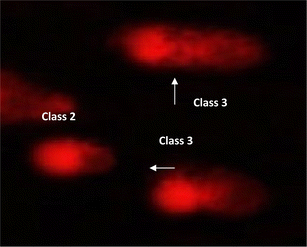
| Fig. 8 Visual score of normal DNA (class 0) and DNA damage (class 1) using comet assay in pancreatic cancer cell lines. | ||
2.3 Molecular docking study
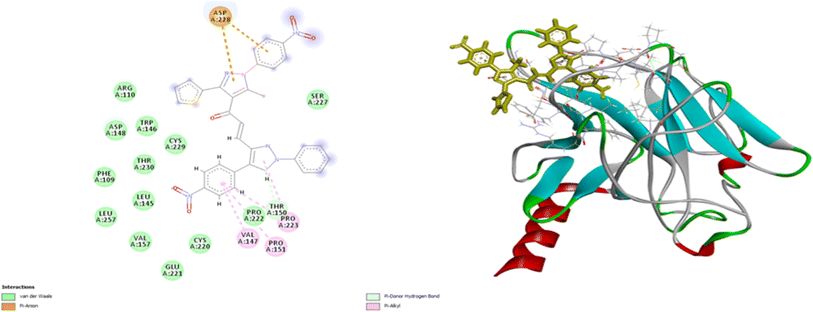
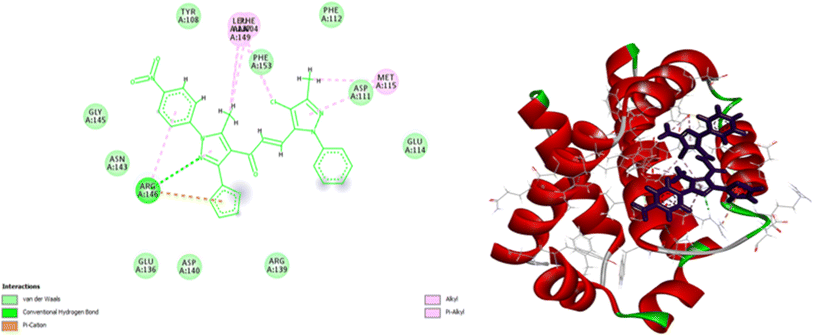
Molecular docking is an excellent approach for predicting binding sites and the kind of interaction between interacting molecules. Compounds 7d and 9e have been selected for further molecular investigation because they showed the most promising cytotoxic activity against PACA2 and MCF7, respectively. Molecular docking investigations were carried out to establish the binding affinity of compound 9e to P53 mutant Y220C and compound 7d to anti-apoptotic Bcl2 and CDK4. The root mean squared deviation (RMSD) for P53 mutant Y220C, Bcl2, and CDK4 (PDB ID: 5O1H, 6QGG, and 1GIJ), respectively were 0.72, 2.4, and 1.8, indicating that docking findings were highly precise. The binding affinities of compound 9e toward P53 mutant Y220C was −22 kcal per mole while that of compound 7d towards Bcl2 and CDK4 were −27.81 and −26.9 kcal per mole respectively which were comparable to the standard values (−15.82, −33.96 and −29.9 kcal per mole).As shown in Fig. 10, compound 9e reactivated p53 mutant Y220C and revealed a high docking score through seven interactions. Two pi-anion hydrophobic interactions were seen between the benzene ring of nitrobenzene moiety and ASP 228 with a bond distance of 5.58 Å and another one between imidazole moiety and ASP 228 with a bond distance of 4.46 Å. In addition to four pi-Alkyl hydrophobic bonds and the interacting amino acid residues were VAL 147, PRO 223 and PRO 151. Besides a pi–donor hydrogen bond with amino acid residues THR 150 with a bond distance of 5.39 Å. It was observed that compound 7d achieved a high docking score based on its interaction with protein Bcl2 via ten interactions, a pi–cation interaction between thiophene moiety and ARG 146 (5.21 Å), a conventional hydrogen bond between imidazole moiety and ARG 146 (4 Å), and the remaining eight interactions were alkyl and pi–alkyl interactions with (ARG 146, MET 115, LEU 137, PHEA 104 and ALA 104) amino acid residues (Fig. 11).
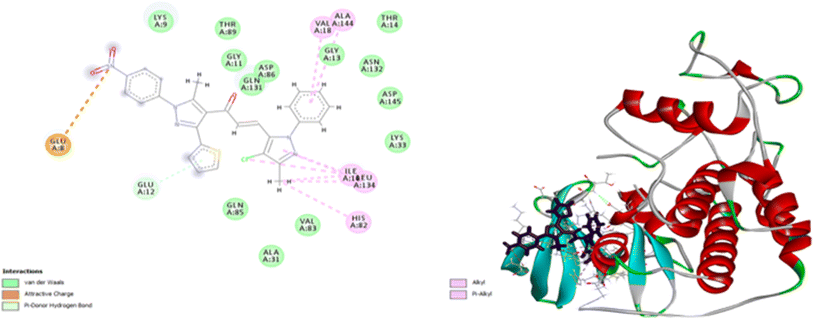
Compound 7d inhibits CDK4 via ten interactions as shown in Fig. 11. These interactions include a pi donor hydrogen bond between GLU 12 and thiophene moiety (5.88 Å), an ionic bond between GLU 8 and nitrogen atom of nitrophenol moiety (5.28 Å).36–40 In addition to three alkyl interactions between methyl-chloro-imidazole moiety ILE 10 and LEU 134 amino acid residues (5.03, 5.04, 5.18 Å). Five pi–alkyl interactions with VALA 18, ALA 144, ILE 10, LEU 134, HIS 82 (5.80, 6.49, 4.87, 5.89, 4.85 Å) (Fig. 12). Since all docked poses with the lowest binding energy have the highest affinity, they are thought to be the best-docked conformations. So, from the above results, we could assume the activating effect of compound 9e on P53 mutant Y220C and the inhibitory effect of compound 7d against Bcl2 anti-apoptotic protein and CDK4. This assumption was confirmed in the subsequent gene expression assay.
![[thin space (1/6-em)]](https://www.rsc.org/images/entities/char_2009.gif) S); medications are deemed highly soluble when their log
S); medications are deemed highly soluble when their log![[thin space (1/6-em)]](https://www.rsc.org/images/entities/char_2009.gif) S values are more than 4.43 The calculated log
S values are more than 4.43 The calculated log![[thin space (1/6-em)]](https://www.rsc.org/images/entities/char_2009.gif) S values of compounds 7d and 9e revealed that they are poorly soluble (−10.47 and −9.06).
S values of compounds 7d and 9e revealed that they are poorly soluble (−10.47 and −9.06).
| Physicochemical properties | 7d | 9e | |
|---|---|---|---|
| Adsorption | Water solubility (log mol L−1) | −5.737 | −3.431 |
| Caco2 permeability (log Papp in 10−6 cm s−1) | 0.789 | −0.545 | |
| Human intestinal absorption (% absorbed) | 100 | 100 | |
Skin permeability (log![[thin space (1/6-em)]](https://www.rsc.org/images/entities/char_2009.gif) Kp) Kp) |
−2.735 | −2.735 | |
| P-glycoprotein substrate (yes/no) | No | No | |
| P-glycoprotein I inhibitor (yes/no) | Yes | Yes | |
| P-glycoprotein II inhibitor (yes/no) | Yes | Yes | |
| Distribution | Fraction unbound (human) (Fu) | 0.316 | 0.382 |
| BBB permeability (log BB) | −1.401 | −1.806 | |
| CNS permeability (log PS) | −1.595 | −1.662 | |
| Metabolism | CYP3A4 substrate (yes/no) | Yes | Yes |
| CYP2C19 inhibitor (yes/no) | Yes | No | |
| CYP2C9 inhibitor (yes/no) | Yes | No | |
| CYP3A4 inhibitor (yes/no) | Yes | No | |
| Excretion | Total clearance (log![[thin space (1/6-em)]](https://www.rsc.org/images/entities/char_2009.gif) ml min−1 kg−1) ml min−1 kg−1) |
0.32 | 0.162 |
| Toxicity | AMES toxicity (yes/no) | No | Yes |
Max. tolerated dose (human) (log![[thin space (1/6-em)]](https://www.rsc.org/images/entities/char_2009.gif) mg per kg per day) mg per kg per day) |
0.586 | 0.448 | |
| Oral rat acute toxicity (LD50) (mol kg−1) | 2.519 | 2.734 | |
Oral rat chronic toxicity (LOAEL) (log![[thin space (1/6-em)]](https://www.rsc.org/images/entities/char_2009.gif) mg per kg per bw per day) mg per kg per bw per day) |
−0.499 | −1.717 | |
| Hepatotoxicity (yes/no) | Yes | Yes | |
| Skin sensitisation (yes/no) | No | No | |
T. Pyriformis toxicity (log![[thin space (1/6-em)]](https://www.rsc.org/images/entities/char_2009.gif) μg L−1) μg L−1) |
0.285 | 0.285 | |
Minnow toxicity (log![[thin space (1/6-em)]](https://www.rsc.org/images/entities/char_2009.gif) mM) mM) |
−5.073 | −7.873 | |
An alternative metric for assessing oral absorption of freshly manufactured medicines is the permeability coefficient across Caco-2 cell monolayers (PCaco-2).44 It is considered that a medication has strong Caco2 permeability if its predictive value is higher than 0.90.42 Compound 9e is considered slightly permeable (−0.545) while compound 7d was found to be relatively Caco2 permeable (0.789), as presented in Table 9. The amount of a drug that is orally absorbed via the human small intestine is estimated using an intestinal absorption parameter. A drug with an absorption rate of less than 30%42 is regarded as poorly absorbed, Therefore, Table 9 indicates that the chalcone derivatives 7d and 9e that were examined are fully absorbed via the human SI. A crucial aspect of transdermal drug distribution linked to pharmacological activity is skin permeability (log![[thin space (1/6-em)]](https://www.rsc.org/images/entities/char_2009.gif) Kp). A drug with a log
Kp). A drug with a log![[thin space (1/6-em)]](https://www.rsc.org/images/entities/char_2009.gif) Kp value of more than −2.5 (ref. 45) is supposed to have low skin permeability. Compounds 7d and 9e exhibited low skin permeability as their value was −2.735. P-glycoprotein functions as a biological barrier by squeezing out xenobiotics of the cell. The parameter predicts whether a given drug is a substrate of Pgp or not. Compounds 7d and 9e act as P-glycoprotein I and II inhibitors. The fraction of the medication that will be unbound in plasma is predicted by the fraction unbound (Fu) parameter. Fu values of compounds 7d and 9e were 0.382 and 0.316. The blood–brain barrier (BBB) may protect the brain from chemical substances that could be hazardous. The values of blood–brain permeability (log
Kp value of more than −2.5 (ref. 45) is supposed to have low skin permeability. Compounds 7d and 9e exhibited low skin permeability as their value was −2.735. P-glycoprotein functions as a biological barrier by squeezing out xenobiotics of the cell. The parameter predicts whether a given drug is a substrate of Pgp or not. Compounds 7d and 9e act as P-glycoprotein I and II inhibitors. The fraction of the medication that will be unbound in plasma is predicted by the fraction unbound (Fu) parameter. Fu values of compounds 7d and 9e were 0.382 and 0.316. The blood–brain barrier (BBB) may protect the brain from chemical substances that could be hazardous. The values of blood–brain permeability (log![[thin space (1/6-em)]](https://www.rsc.org/images/entities/char_2009.gif) BB) of compounds 7d and 9e were (−1.806 and −1.401) higher than (−1)45 indicating that synthesized compounds had poor brain distribution. Correspondingly, the blood–brain permeability surface area product (log
BB) of compounds 7d and 9e were (−1.806 and −1.401) higher than (−1)45 indicating that synthesized compounds had poor brain distribution. Correspondingly, the blood–brain permeability surface area product (log![[thin space (1/6-em)]](https://www.rsc.org/images/entities/char_2009.gif) PS) of 7d and 9e were (−1.662 and −1.595) indicating that the inability of compounds to penetrate the Central Nervous System (CNS) as reference value of a drug to penetrate the CNS more than (−3).46 P450 genes encode a superfamily of detoxifying enzymes called cytochromes P450, which are mostly located in the liver. They play a crucial role in drug metabolisms to foster excretion. If the IC50 for each cytochrome P450 isoform is less than 10 μM, the drug is termed a cytochrome P450 inhibitor.45 CYP3A4 is one of the main isoforms implied in drug metabolism. Compounds 7d and 9e are predicted to be CYP3A4 substrates. In addition to 7d acts as CYP2C9, CYP2C19 and CYP3A4 inhibitors Table 9. Drug clearance is assessed using the proportion constant (CLtot), which is generally composed of hepatic and renal clearance. CLtot parameter is crucial in setting rates of dose. The total clearance log(CLtot) of the synthesized compounds 7d and 9e (0.162 and 0.32 (mlmin−1kg)) is shown in Table 9. AMES test is an assay to determine carcinogens using mutagenicity in bacteria, positive result indicates that the substance is mutagenic and consequently potentially carcinogenic.47 Synthetic 9e compound tested negative, indicating that it is not mutagenic while 7d tested positive. The drug's hazardous dosage threshold in humans is ascertained using the maximum recommended tolerated dose (MRTD). A substance is deemed non-toxic if its MRTD value is less than or equal to 0.477 [log(mg per kg per day)], while values higher than that are deemed toxic.48 The MRTD value of 9e is 0.448 thus it is nontoxic while that of 7d is 0.586 therefore it is considered slightly toxic. Lethal dose (LD50) is the amount of an ingested drug that kills 50% of test animal models. The drug is counted safe if LD50 values higher than 2.5 mol kg−1.49 The synthesized compounds 7d and 9e have an LD50 value slightly are higher than 2.5 mol kg−1 as demonstrated in Table 9, making them conceivably safe. The lowest amount of a drug that has been tested with negative effects on an exposed population is known as the lowest observed adverse effect level (LOAEL), while the greatest amount of a drug at which no adverse effects are recorded is known as the no adverse effect level (NOAEL). According to LOAEL values anticipated in log mg kg−1 bw/day (Table 9), the two synthetic compounds 7d and 9e have no negative impacts at larger doses. Disordered liver function is linked to hepatoxicity, and the expected values for the two synthesized chalcone derivatives 7d and 9e are positive. Oppositely, they anticipated negative values for Skin Sensitization. Toxicity of protozoa “Tetrahymena pyriformi” is often used as a lethal endpoint. If the plGC50 value of a drug is greater than −0.50 log μg L−1, the drug will be considered as toxin. The synthesized compounds 7d and 9e are toxic to T. pyriformis. To study toxicity in vertebrate animals, Flathead minnow is used as a model. If the drug concentration needed to kill 50% of the minnow sample population log LC50 value is <−0.3, it is considered to have acute toxicity.50 Compounds 7d and 9e have Flathead minnow toxicity.
PS) of 7d and 9e were (−1.662 and −1.595) indicating that the inability of compounds to penetrate the Central Nervous System (CNS) as reference value of a drug to penetrate the CNS more than (−3).46 P450 genes encode a superfamily of detoxifying enzymes called cytochromes P450, which are mostly located in the liver. They play a crucial role in drug metabolisms to foster excretion. If the IC50 for each cytochrome P450 isoform is less than 10 μM, the drug is termed a cytochrome P450 inhibitor.45 CYP3A4 is one of the main isoforms implied in drug metabolism. Compounds 7d and 9e are predicted to be CYP3A4 substrates. In addition to 7d acts as CYP2C9, CYP2C19 and CYP3A4 inhibitors Table 9. Drug clearance is assessed using the proportion constant (CLtot), which is generally composed of hepatic and renal clearance. CLtot parameter is crucial in setting rates of dose. The total clearance log(CLtot) of the synthesized compounds 7d and 9e (0.162 and 0.32 (mlmin−1kg)) is shown in Table 9. AMES test is an assay to determine carcinogens using mutagenicity in bacteria, positive result indicates that the substance is mutagenic and consequently potentially carcinogenic.47 Synthetic 9e compound tested negative, indicating that it is not mutagenic while 7d tested positive. The drug's hazardous dosage threshold in humans is ascertained using the maximum recommended tolerated dose (MRTD). A substance is deemed non-toxic if its MRTD value is less than or equal to 0.477 [log(mg per kg per day)], while values higher than that are deemed toxic.48 The MRTD value of 9e is 0.448 thus it is nontoxic while that of 7d is 0.586 therefore it is considered slightly toxic. Lethal dose (LD50) is the amount of an ingested drug that kills 50% of test animal models. The drug is counted safe if LD50 values higher than 2.5 mol kg−1.49 The synthesized compounds 7d and 9e have an LD50 value slightly are higher than 2.5 mol kg−1 as demonstrated in Table 9, making them conceivably safe. The lowest amount of a drug that has been tested with negative effects on an exposed population is known as the lowest observed adverse effect level (LOAEL), while the greatest amount of a drug at which no adverse effects are recorded is known as the no adverse effect level (NOAEL). According to LOAEL values anticipated in log mg kg−1 bw/day (Table 9), the two synthetic compounds 7d and 9e have no negative impacts at larger doses. Disordered liver function is linked to hepatoxicity, and the expected values for the two synthesized chalcone derivatives 7d and 9e are positive. Oppositely, they anticipated negative values for Skin Sensitization. Toxicity of protozoa “Tetrahymena pyriformi” is often used as a lethal endpoint. If the plGC50 value of a drug is greater than −0.50 log μg L−1, the drug will be considered as toxin. The synthesized compounds 7d and 9e are toxic to T. pyriformis. To study toxicity in vertebrate animals, Flathead minnow is used as a model. If the drug concentration needed to kill 50% of the minnow sample population log LC50 value is <−0.3, it is considered to have acute toxicity.50 Compounds 7d and 9e have Flathead minnow toxicity.
3 Materials and methods
3.1 Chemistry
Melting points were measured with a Stuart melting point apparatus and were uncorrected. The IR spectra were recorded using a FTIR Bruker-vector 22 spectrophotometer as KBr pellets. The 1H and 13C NMR spectra were recorded in CDCl3 as a solvent on a Varian Gemini NMR spectrometer at 300 MHz using TMS as an internal standard. Chemical shifts are reported as δ values in ppm. Mass spectra were recorded with a Shimadzu GCMS-QP-1000 EX mass spectrometer in an EI (70 eV) model. The elemental analyses were performed at the Microanalytical Center, Cairo University. The 1-(5-methyl-1-(4-nitrophenyl)-3-(thiophen-2-yl)-1H-pyrazol-4-yl)ethan-1-one 5 (ref. 15 and 24) were prepared using the reported procedures.3.2 Synthesis of 1-(5-methyl-1-(4-nitrophenyl)-3-(thiophen-2-yl)-1H-pyrazol-4-yl)prop-2-en-1-one derivatives (7a–d)
To a stirred mixture of 1-(5-methyl-1-(4-nitrophenyl)-3-(thiophen-2-yl)-1H-pyrazol-4-yl)ethan-1-one 5 (0.01 mol) and equimolar amounts of heteroaldehydes 6a–d (0.01 mol) in ethanol (30 ml), sodium hydroxide solution 20% was added and the reaction mixture was stirred for 4 h at room temperature and left overnight. The resulting solid product that precipitated was filtered, washed with water and crystallized from a suitable solvent to give the corresponding 1-(5-methyl-1-(4-nitrophenyl)-3-(thiophen-2-yl)-1H-pyrazol-4-yl)prop-2-en-1-one derivatives (7a–d).3.3 Synthesis of 1-(5-methyl-1-(4-nitrophenyl)-3-(thiophen-2-yl)-1H-pyrazol-4-yl)prop-2-en-1-one derivatives (9a–d)
To a stirred mixture of 1-(5-methyl-1-(4-nitrophenyl)-3-(thiophen-2-yl)-1H-pyrazol-4-yl)ethan-1-one 5 (0.01 mol) and equimolar amounts of pyrazole-2-carboxaldehyde derivatives (8a–f) (0.01 mol) in ethanol (30 ml), sodium hydroxide solution 20% was added and the reaction mixture was stirred for 4 h at room temperature and left overnight. The resulting solid product that precipitated was filtered, washed with water and crystallized from a suitable solvent to give the corresponding 1-(5-methyl-1-(4-nitrophenyl)-3-(thiophen-2-yl)-1H-pyrazol-4-yl)prop-2-en-1-one derivatives (9a–f).3.4 Anti-cancer evaluation
The percentage of the cell viability treated with the newly synthesized compounds was evaluated using MTT assay (3-(4,5-dimethylthiazol-2-yl)-2,5-diphenyl tetrazolium bromide). All the subsequent steps were done in a sterile Laminar flow class II biosafety cabinet (Baker, SG406INT, Sanford, ME, USA). DMEM was used as a suspension medium for breast cancer (MCF7), prostate cancer (PC3), and pancreatic cancer (PACA2), while normal cell line (BJ1) was suspended in DMEM-F12 medium, a 1% antibiotic-antimycotic mixture (10![[thin space (1/6-em)]](https://www.rsc.org/images/entities/char_2009.gif) 000 U ml−1 potassium penicillin, 10
000 U ml−1 potassium penicillin, 10![[thin space (1/6-em)]](https://www.rsc.org/images/entities/char_2009.gif) 000 μg ml−1 streptomycin sulfate, and 25 μg ml−1 amphotericin B), and 1% L-glutamine at 37 °C under 5% CO2.
000 μg ml−1 streptomycin sulfate, and 25 μg ml−1 amphotericin B), and 1% L-glutamine at 37 °C under 5% CO2.
Cells were cultured for 10 days and then seeded at a concentration of 10 × 104 cells per well in fresh complete growth medium in 96-well microtiter plastic plates at 37 °C for 24 hours under 5% CO2 using a water-jacketed carbon dioxide incubator (Sheldon, TC2323). Media were aspirated, serum-free fresh medium was added, and cells were incubated either alone (negative control) or with different concentrations of the synthesized chalcone derivatives to a final concentration of (100–50–25–12.5–6.25–3.125–0.78 and 1.56 μg ml−1). After incubation for 48 hours, the medium was aspirated and 40 μl of MTT salt (2.5 μg ml−1) was added to each well and incubated for another four hours at 37 °C under 5% CO2. To stop the reaction and dissolve the formed crystals, 200 μl of 10% sodium dodecyl sulfate (SDS) in deionized water was added to each well and incubated overnight at 37 °C. Doxorubicin was used as a positive control of concentration 100 μg ml−1.19–22,33
The absorbance was then measured at 595 nm and a reference wavelength of 620 nm using a microplate multi-well reader (Bio-Rad Laboratories Inc., model 3350). Statistical significance was tested between the samples and the negative control (cells with vehicle) using an independent t-test using the SPSS 11 program. DMSO was the vehicle used for the dissolution of the synthesized chalcones, and its final concentration on the cells was less than 0.2%. The percentage of change in viability was calculated according to the formula: ((reading of extract/reading of negative control) − 1) × 100. A Probit analysis was carried out for the determination of IC50 using the SPSS 11 program.
3.5 Gene expression analysis
| Gene | Primer sequence | GenBank (accession no) |
|---|---|---|
| a Abbreviations: BID: BH3 interacting-domain death agonist, CCND1: cyclin D1, p53: tumor suppressor protein p53, Bcl-2: B-cell lymphoma 2, p21: cyclin kinase inhibitor, CDK4: cyclin dependent kinase 4, and GAPDH: glyceraldehyde-3-phosphate dehydrogenase. | ||
| BID | F: GGCCTACCCTAGAGACATGG | CU012947.1 |
| R: TGGCTAAGCTCCTCACGTAG | ||
| CCND1 | F: GCATGTTCGTGGCCTCTAAG | NM_053056.3 |
| R: CGTGTTTGCGGATGATCTGT | ||
| P53 | F: TGGCCATCTACAAGCAGTCA | AB082923.1 |
| R: GGTACAGTCAGAGCCAACCT | ||
| GAPDH | F: CCAAGGAGTAAGACCCCTGG | NM_001256799.3 |
| R: TGGTTGAGCACAGGGTACTT | ||
| BCL2 | F: CAAGTGTTCCGCGTGATTGA | KY098799.1 |
| R: CAGAGGAAAAGCAACGGGG | ||
| CDK4 | F: AGTGTGAGAGTCCCCAATGG | KR709914.1 |
| R: CCTTGATCTCCCGGTCAGTT | ||
| P21 | F: CCCAAGCTCTACCTTCCCAC | S67388.1 |
| R: CTGAGAGTCTCCAGGTCCAC | ||
![[thin space (1/6-em)]](https://www.rsc.org/images/entities/char_2009.gif) 000 g for 20 min. Fragmented DNA in the supernatant was extracted with an equal volume of a neutral phenol/chloroform/isoamyl alcohol mixture (25
000 g for 20 min. Fragmented DNA in the supernatant was extracted with an equal volume of a neutral phenol/chloroform/isoamyl alcohol mixture (25![[thin space (1/6-em)]](https://www.rsc.org/images/entities/char_2009.gif) :
:![[thin space (1/6-em)]](https://www.rsc.org/images/entities/char_2009.gif) 24
24![[thin space (1/6-em)]](https://www.rsc.org/images/entities/char_2009.gif) :
:![[thin space (1/6-em)]](https://www.rsc.org/images/entities/char_2009.gif) 1) and analyzed electrophoretically on 2% agarose gels containing 0.1 μg ml−1 ethidium bromide.
1) and analyzed electrophoretically on 2% agarose gels containing 0.1 μg ml−1 ethidium bromide.4 Conclusion
In summary, a novel ten chalcone derivatives bearing pyrazole ring were prepared and assessed as anti-cancer molecules against normal cell line BJ1 and human cancer cell lines of MCF7, PACA2 and PC3. Compound 7d demonstrated anticancer activity with IC50 = 42.6 μM against MCF7 cells compared to the reference medication doxorubicin (IC50 = 48 μM), and compound 9e emerged as the most promising molecule with IC50 = 27.6 μM against PACA2 cells compared to the reference drug doxorubicin (IC50 = 52.1 μM). Using breast and pancreatic cell lines, the gene expression, DNA damage, and DNA fragmentation percentages for compounds 7d and 9e were evaluated. Moreover, the molecular docking study has been discussed.Author contributions
Norhan Yasser: anti-cancer activity, gene expression, DNA damage, molecular docking study. Farid Sroor: conceptualization, design, chemical reactions, methodology, writing – original draft, writing – review & editing, visualization, supervision, data curation, investigation. Haidan El-Shorbagy: supervision. Shaymaa Eissa: supervision. Hamdi M. Hassaneen: supervision, investigation. Ismail Abdelhamid: supervision, investigation, writing – original draft. All authors have seen and approved the submitted manuscript.Conflicts of interest
There are no financial or other relationships that might lead to a conflict of interest.References
- H. Sung, J. Ferlay, R. L. Siegel, M. Laversanne, I. Soerjomataram, A. Jemal and F. Bray, Ca-Cancer J. Clin., 2021, 71, 209–249 CrossRef PubMed.
- F. M. Sroor, W. M. Tohamy, K. M. A. Zoheir, N. M. Abdelazeem, K. F. Mahrous and N. S. Ibrahim, BMC Chem., 2023, 17, 106 CrossRef CAS PubMed.
- T. Constantinescu and A. G. Mihis, Int. J. Mol. Sci., 2022, 23, 11595 CrossRef CAS PubMed.
- D. N. Carney, Ir. J. Med. Sci., 1990, 159, 171 CrossRef CAS PubMed.
- K. Mezgebe, Y. Melaku and E. Mulugeta, ACS Omega, 2023, 8, 19194–19211 CrossRef CAS PubMed.
- E. M. Fathi, F. M. Sroor, K. F. Mahrous, M. F. Mohamed, K. Mahmoud, M. Emara, A. H. M. Elwahy and I. A. Abdelhamid, ChemistrySelect, 2021, 6, 6202–6211 CrossRef CAS.
- M. T. Helmy, F. M. Sroor, H. M. Hassaneen, M. A. Mohamed Teleb and F. M. Saleh, Polycyclic Aromat. Compd., 2023, 1–14, DOI:10.1080/10406638.2023.2214284.
- B. Salehi, C. Quispe, I. Chamkhi, N. El Omari, A. Balahbib, J. Sharifi-Rad, A. Bouyahya, M. Akram, M. Iqbal, A. O. Docea, C. Caruntu, G. Leyva-Gómez, A. Dey, M. Martorell, D. Calina, V. López and F. Les, Front. Pharmacol, 2021, 11, 592654 CrossRef PubMed.
- A. A. WalyEldeen, S. Sabet, H. M. El-Shorbagy, I. A. Abdelhamid and S. A. Ibrahim, Chem.-Biol. Interact., 2023, 369, 110297 CrossRef CAS PubMed.
- Y. Ünver, M. Tuluk, N. Kahriman, M. Emirik, E. Bektaş and Ş. Direkel, Russ. J. Gen. Chem., 2019, 89, 794–799 CrossRef.
- M. G. Kamel, H. M. Hassaneen, F. M. Sroor, T. A. Abdallah, M. A. M. Teleb and F. M. Saleh, J. Mol. Struct., 2023, 1287, 135722 CrossRef CAS.
- M. T. Helmy, F. M. Sroor, A. M. Othman, H. M. Hassaneen, F. M. Saleh and M. A. M. Teleb, J. Heterocycl. Chem., 2022, 60(4), 585–595 CrossRef.
- M. G. Kamel, F. M. Sroor, A. M. Othman, H. M. Hassaneen, T. A. Abdallah, F. M. Saleh and M. A. M. Teleb, Monatsh. Chem., 2022, 153, 929–937 CrossRef CAS.
- M. G. Kamel, F. M. Sroor, A. M. Othman, K. F. Mahrous, F. M. Saleh, H. M. Hassaneen, T. A. Abdallah, I. A. Abdelhamid and M. A. M. Teleb, Monatsh. Chem., 2022, 153, 211–221 CrossRef CAS.
- M. T. Helmy, F. M. Sroor, K. F. Mahrous, K. Mahmoud, H. M. Hassaneen, F. M. Saleh, I. A. Abdelhamid and M. A. Mohamed Teleb, Arch. Pharm., 2021, 355, 2100381 CrossRef PubMed.
- F. M. Sroor, A. F. El-Sayed and M. Abdelraof, Arch. Pharm., 2024, 357(6), 2300738 CrossRef CAS PubMed.
- M. A. Elsayed, A. M. Elsayed and F. M. Sroor, Med. Chem. Res., 2024, 33, 476–491 CrossRef CAS.
- F. M. Sroor, K. F. Mahrous, H. A. M. A. El-Kader, A. M. Othman and N. S. Ibrahim, Sci. Rep., 2023, 13, 17560 CrossRef CAS PubMed.
- F. M. Sroor, A. M. Othman, K. Mahmoud and K. F. Mahrous, J. Mol. Struct., 2023, 1294, 136516 CrossRef CAS.
- F. M. Sroor, K. F. Mahrous, H. I. Shafey, N. R. Eid, I. A. Abdelhamid and N. S. Ibrahim, Med. Chem. Res., 2023, 32, 1190–1203 CrossRef CAS.
- I. A. Abdelhamid, A. H. M. Elwahy, F. M. Sroor, M. F. Mohamed, S. E. Elsayed, K. F. Mahrous, L. Mageed, M. K. Hanafy and S. A. Ibrahim, Lett. Drug Des. Discovery, 2022, 19, 1007–1021 CrossRef.
- F. M. Sroor, A. M. Othman, M. M. Aboelenin and K. F. Mahrous, Med. Chem. Res., 2022, 31, 400–415 CrossRef CAS.
- F. M. Sroor, M. F. Mohamed, G. K. Abdullah, K. F. Mahrous, K. M. A. Zoheir, S. A. Ibrahim, A. H. M. Elwahy and I. A. Abdelhamid, Polycyclic Aromat. Compd., 2022, 1–18 Search PubMed.
- H. M. Hassaneen, A. S. Shawali, N. M. Elwan and A. H. A. Ibrahim, Arch. Pharmacal Res., 1991, 14, 266–270 CrossRef.
- G. Cavaletti, B. Frigeni, F. Lanzani, M. Piatti, S. Rota, C. Briani, G. Zara, R. Plasmati, F. Pastorelli, A. Caraceni, A. Pace, M. Manicone, A. Lissoni, N. Colombo, G. Bianchi and C. Zanna, J. Peripher. Nerv. Syst., 2007, 12, 210–215 CrossRef PubMed.
- B. Al and M. Gali, Cancers, 2019, 11, 1475 CrossRef PubMed.
- S. J. Baker and E. P. Reddy, Genes Cancer, 2013, 3, 658–669 CrossRef PubMed.
- Y. Niu, J. Xu and T. Sun, J. Cancer, 2019, 10, 5504–5517 CrossRef CAS PubMed.
- M. Alam, S. Ali, T. Mohammad, G. M. Hasan, D. K. Yadav and M. I. Hassan, Int. J. Mol. Sci., 2021, 22, 10442 CrossRef CAS PubMed.
- J. Moreira, J. Almeida, L. Saraiva, H. Cidade and M. Pinto, Molecules, 2021, 26, 3737 CrossRef CAS PubMed.
- J. Wang, W. Su, T. Zhang, S. Zhang, H. Lei, F. Ma, M. Shi, W. Shi, X. Xie and C. Di, Cell Death Dis., 2023, 14(4), 244 CrossRef CAS PubMed.
- C.-F. Lu, S.-H. Wang, X.-J. Pang, T. Zhu, H.-L. Li, Q.-R. Li, Q.-Y. Li, Y.-F. Gu, Z.-Y. Mu, M.-J. Jin, Y.-R. Li, Y.-Y. Hu, Y.-B. Zhang, J. Song and S.-Y. Zhang, Molecules, 2020, 25, 5530 CrossRef CAS PubMed.
- N. S. Ibrahim, F. M. Sroor, K. F. Mahrous, J. A. Abd Elaleem and I. A. Abdelhamid, ChemistrySelect, 2023, 8, 1754 Search PubMed.
- M. F. Mohamed, F. M. Sroor, N. S. Ibrahim, G. S. Salem, H. H. El-Sayed, M. M. Mahmoud, M.-A. M. Wagdy, A. M. Ahmed, A.-A. T. Mahmoud, S. S. Ibrahim, M. M. Ismail, S. M. Eldin, F. M. Saleh, H. M. Hassaneen and I. A. Abdelhamid, Invest. New Drugs, 2020, 39, 98–110 CrossRef PubMed.
- M. H. El-Wakil, S. N. Khattab, A. F. El-Yazbi, N. El-Nikhely, A. Soffar and H. H. Khalil, Bioorg. Chem., 2020, 105, 104393 CrossRef CAS PubMed.
- T. Abe and M. Terasaki, Helv. Chim. Acta, 2018, 101, 1700284 CrossRef.
- S. Ramamoorthy, N. Dhatchana Moorthy, B. Muthu Ramalingam, S. Iqbal, A. K. Mohanakrishnan, K. Gunasekaran and E. Vellaichamy, PLoS One, 2018, 13, e0202903 CrossRef PubMed.
- B. Muthu Ramalingam, N. Dhatchana Moorthy, S. R. Chowdhury, T. Mageshwaran, E. Vellaichamy, S. Saha, K. Ganesan, B. N. Rajesh, S. Iqbal, H. K. Majumder, K. Gunasekaran, R. Siva and A. K. Mohanakrishnan, J. Med. Chem., 2018, 61, 1285–1315 CrossRef CAS PubMed.
- T. Nishiyama, N. Hatae, T. Yoshimura, S. Takaki, T. Abe, M. Ishikura, S. Hibino and T. Choshi, Eur. J. Med. Chem., 2016, 121, 561–577 CrossRef CAS PubMed.
- M. Tercel, H. H. Lee, S. Y. Mehta, J.-J. Youte Tendoung, S. Y. Bai, H. D. S. Liyanage and F. B. Pruijn, J. Med. Chem., 2017, 60, 5834–5856 CrossRef CAS PubMed.
- F. M. Sroor, A. A. F. Soliman, E. M. Youssef, M. Abdelraof and A. F. El-Sayed, Sci. Rep., 2024, 14(1), 15441 CrossRef PubMed.
- D. E. V. Pires, T. L. Blundell and D. B. Ascher, J. Med. Chem., 2015, 58, 4066–4072 CrossRef CAS PubMed.
- T. J. Ritchie, S. J. F. Macdonald, S. Peace, S. D. Pickett and C. N. Luscombe, MedChemComm, 2013, 4, 673 RSC.
- N. Panse and P. M. Gerk, Int. J. Pharm., 2022, 624, 122004 CrossRef CAS PubMed.
- N. Flores-Holguín, J. Frau and D. Glossman-Mitnik, ChemistryOpen, 2021, 10, 1142–1149 CrossRef PubMed.
- J. Lee, S. K. Parmbil, N. K. Pandit, S. Kumar, A. Syed, A. M. Elgorban, L. S. Wong, R. K. Mehta, H. Kim and B. Mathew, Appl. Biol. Chem., 2024, 67, 6 CrossRef CAS.
- K. Mortelmans and E. Zeiger, Mutat. Res., Fundam. Mol. Mech. Mutagen., 2000, 455, 29–60 CrossRef CAS PubMed.
- T. Liu, T. Oprea, O. Ursu, C. Hasselgren and R. B. Altman, Clin. Transl. Sci., 2016, 9, 311–320 CrossRef CAS PubMed.
- A. Belal, Pharmazie, 2018, 73, 635–642 CAS.
- M. Amir, M. A. Ansari, S. Wahab, W. Ahmad, M. S. Alhumaidi, M. N. Alomary, S. A. Alyahya, Q. M. S. Jamal, F. A. Khan and P. Alam, S. Afr. J. Bot., 2023, 163, 497–510 CrossRef CAS.
- Q. Yang, M. H. Feng, X. Ma, H. C. Li and W. Xie, Oncol. Lett., 2017, 14, 6071–6078 Search PubMed.
- A. Yawata, M. Adachi, H. Okuda, Y. Naishiro, T. Takamura, M. Hareyama, S. Takayama, J. C. Reed and K. Imai, Oncogene, 1998, 16, 2681–2686 CrossRef CAS PubMed.
- P. L. Olive, J. P. Banáth and R. E. Durand, Radiat. Res., 2012, 178, AV35–AV42 CrossRef CAS PubMed.
- A. Collins, M. Dusinska, M. Franklin, M. Somorovska, H. Petrovska, S. Duthie, L. Fillion, M. Panayiotidis, K. Raslova and N. Vaughan, Environ. Mol. Mutagen., 1997, 30, 139–146 CrossRef CAS.
- M. Ikuta, K. Kamata, K. Fukasawa, T. Honma, T. Machida, H. Hirai, I. Suzuki-Takahashi, T. Hayama and S. Nishimura, J. Biol. Chem., 2001, 276, 27548–27554 CrossRef CAS PubMed.
- L. Aixiao, B. Florent, M. François, D. Michel and W. Baoshan, J. Mol. Struct., 2008, 849, 62–75 CrossRef.
Footnote |
| † Electronic supplementary information (ESI) available. See DOI: https://doi.org/10.1039/d4ra03375b |
| This journal is © The Royal Society of Chemistry 2024 |

