
 Open Access Article
 This Open Access Article is licensed under a Creative Commons Attribution-Non Commercial 3.0 Unported Licence
An optimized impedance matching construction strategy: carbon nanofibers inlaid with Ni nanocrystals by electrospinning for high-performance microwave absorber†
Danfeng Zhang *a,
Heng Gaob,
Congai Hanb,
Guoxun Zengb and
Qibai Wub
*a,
Heng Gaob,
Congai Hanb,
Guoxun Zengb and
Qibai Wub
aCollege of Innovation and Entrepreneurship, Guangdong University of Technology, Guangzhou, 510006, China. E-mail: dfzhang@gdut.edu.cn
bSchool of Materials and Energy, Guangdong University of Technology, Guangzhou 510006, China
First published on 1st July 2024
Abstract
With the widespread use of electronic goods, solving electromagnetic pollution has become one of the new challenges. Higher requirements for microwave-absorbing materials (MAM) have emerged to address this issue. The composite of carbon nanofiber (CNF) and magnetic nanoparticles is the material that effectively absorbs microwaves. This paper fabricated Ni/C nanofibers using a combination of electrospinning and high-temperature carbonization. With 50 wt% paraffin wax, Ni/C nanofibers demonstrated optimal microwave absorption capabilities. With a thickness of 3 mm, the minimum RL value can reach −30.6 dB, and the effective absorption bandwidth is 5.96 GHz. By encapsulating Ni nanoparticles in carbon nanofibers, the synergic interaction of dielectric and magnetic losses effectively meets the need for constant attenuation and impedance matching, and effectively improves microwave-absorbing properties. Hence, Ni/C nanofibers are promising for MAM application with excellent MA performance.
1 Introduction
Nowadays, the recent speedy advancement of communication technology and electronic devices offers us a lot of convenience. In the meantime, electromagnetic wave pollution has become a new type of pollution, extraordinarily harming humans and the environment.1–4 Hence, the advancement of microwave-absorbing materials (MAM) presents an efficient way to solve electromagnetic pollution.5,6 Superior, efficient absorbing materials should have enhanced absorption capacity, extended absorption bandwidth, thin thickness, and light mass, so there is still a challenge in the exploration of high-performance absorbing materials.7,8Carbon materials are of great interest to MAM researchers due to their light mass, excellent conductance, high dielectric constant, and good chemical stability.6,9 Carbon nanofibers (CNFs), as a typical one-dimensional carbon material, have the advantages of low density, high aspect ratio, high strength, and good dielectric properties, and are widely used in microwave absorption.6 The composite of carbon nanofibers and magnetic metals combines both advantages. The three-dimensional network structure promotes conduction loss, and the rich heterogeneous interfaces generate a large amount of interface polarization, improving microwave absorption performance.10 It cannot just generate dielectric loss as with magnetic loss through various loss mechanisms, but it can also avoid the drawback of a high proportion of a single magnetic metal-absorbing material.11 For instance, Han et al. reported a CNF–NiCo2O4 composite by facile electrospinning and in situ delamination heat treatment methods.11 Wang et al. successfully fabricated three-dimensional network-structured Fe/C nanoporous fibers with a low extent of graphitization via electrospinning.12 Nickel has a relatively superior magnetic permeability and saturation magnetization, contributing to the magnetic loss capacity and increasing the Snoek limit. It is beneficial to absorb microwaves over a range of high frequencies.13
Here, we used a two-step procedure of electrospinning and carbonization to manufacture Ni/C nanofibers. On one hand, the cross-linking of carbon nanofibers creates a conductive network and simultaneously lowers the material's density. On the other hand, Ni nanoparticles assisted in achieving a well-matched impedance by modulating the electromagnetic parameters. Based on the above synergies, Ni/C nanofibers demonstrate excellent microwave absorption performance, which may have great promise in real-life applications.
2 Experimental
2.1 Materials
Shanghai Aladdin Biochemical Technology Co., Ltd provided nickel acetate tetrahydrate, polyvinyl alcohol (PVA) 1799.2.2 Preparation of the Ni/C nanofibers
The Ni/C nanofibers were manufactured using an electrospinning and carbonizing approach. Firstly, 1.2 g of polyvinyl alcohol (PVA) was dissolved in 12 mL of deionized water with sufficient stirring at 60 °C for 2 h. Then, 2.5 g of nickel acetate tetrahydrate (C4H6O4Ni–4H2O) was added and stirred continuously to obtain a uniformly mixed precursor solution. Thirdly, 10 mL of precursor solution was transferred into a 21-gauge stainless steel needle. With a pumping rate of 0.07 mm min−1 under a positive voltage of 20 kV, Ni/PVA-based fibers were electrospun onto aluminum foil, which was 12 cm from the syringe. After drying overnight, Ni/PVA-based fibers were pre-oxidized in a muffle furnace for 2 hours at 220 °C with a heating rate of 2 °C min−1. Finally, Ni/C nanofibers were obtained by carbonization in an H2/Ar atmosphere at a heating rate of 5 °C min−1 at 600 °C.2.3 Preparation of the coaxial sample for electromagnetic parameter measurement
The Ni/C nanofibers and wax were blended evenly in a certain proportion at 90 °C until the color was homogeneous. The mixture was then refrigerated from liquidity to solidity, ground to a powder in a mortar, and placed under pressure in a mold to form a ring-shaped specimen with an inner diameter of 3.04 mm and an outer diameter of 7 mm. Specifically, the content of Ni/C nanofibers in the paraffin was set at 30 wt%, 50 wt%, and 70 wt%, which were marked as Ni/C-30%, Ni/C-50%, and Ni/C-70%, respectively. As a comparison, PVA-based carbon nanofibers without added nickel acetate tetrahydrate were mixed in paraffin in a 1![[thin space (1/6-em)]](https://www.rsc.org/images/entities/char_2009.gif) :1 ratio, which was labeled as CNF-50%.
:1 ratio, which was labeled as CNF-50%.
3 Results and discussion
Fig. 1 presents the manufacturing process of Ni/C nanofibers. Firstly, nickel acetate tetrahydrate was dissolved in a PVA solution to prepare a homogeneous precursor. Secondly, Ni/C nanofibers were obtained by electrospinning and calcination. The carbonation process pyrolyzed polyvinyl alcohol and converted nickel acetate into nickel monomers in a reducing atmosphere.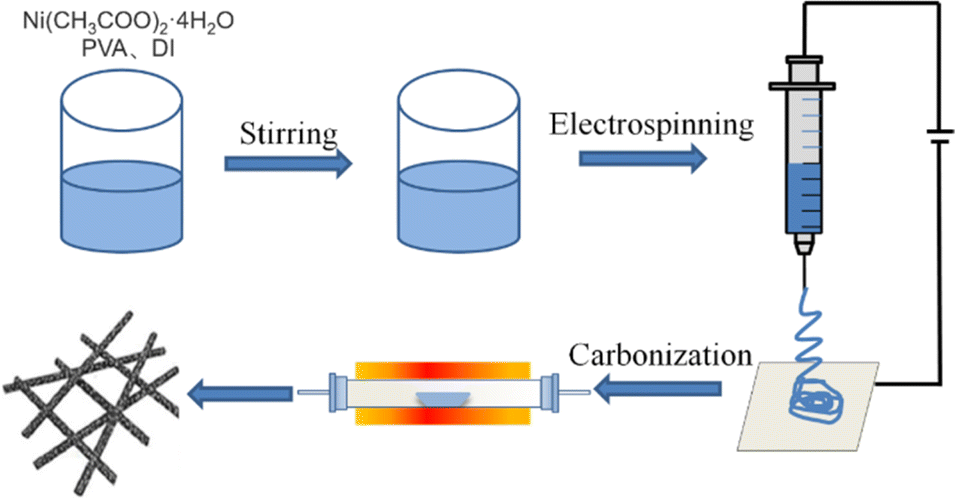 | ||
| Fig. 1 Sketch map of manufacture procedure of Ni/C nanofibers. | ||
As depicted in Fig. 2, the resulting pure PVA fibers have a smooth surface and relatively uniform thickness. After high-temperature carbonization, the fibers melt slightly, which causes some fusion of the carbon nanofibers. The high magnification SEM illustrates that the exterior of the carbon nanofibers remains glossy, and the average diameter is about 300 nm. The addition of metal salts led to a slight unevenness in the electrospinning film's thickness, potentially due to an unstable electrospinning process as the solution's concentration increased. After being carbonized at 600 °C, the fibers become tangled in a way that isn't uniform, and they form a structure that looks like a network. This makes it easier for electrons to pass through, which is good for conducting losses. The high magnification SEM in Fig. 2(d) reveal that after carbonization, the surface of Ni/C nanofibers becomes extremely rough, with some nanoparticles dispersed throughout the fibers. Fig. 3 demonstrates the TEM images of the Ni/C nanofibers. Ni nanoparticles are spread out evenly on the outside and inside of C nanofibers because Ni salts mix with PVA to make a uniform precursor solution. During electrospinning, the precursor forms a jet due to voltage while the solvent evaporates, resulting in fibers that maintain the uniformity of their original chemical composition.
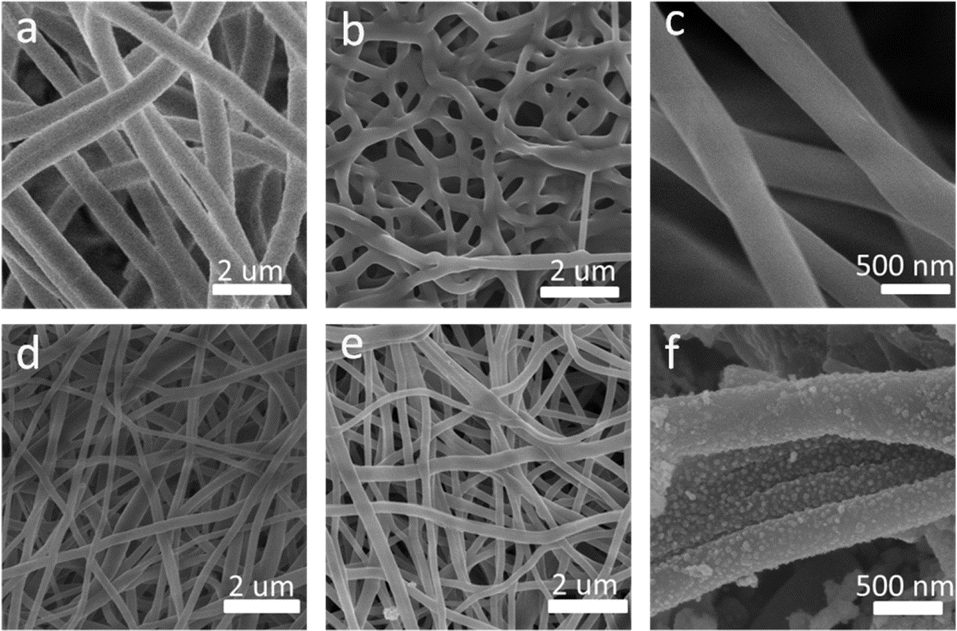 | ||
| Fig. 2 SEM images of pure PVA fibers (a); carbon nanofibers carbonized at 600 °C for 2 h (b and c); uncarbonized Ni/PVA-based fibres (d); Ni/C nanofibers carbonized at 600 °C for 2 h (e and f). | ||
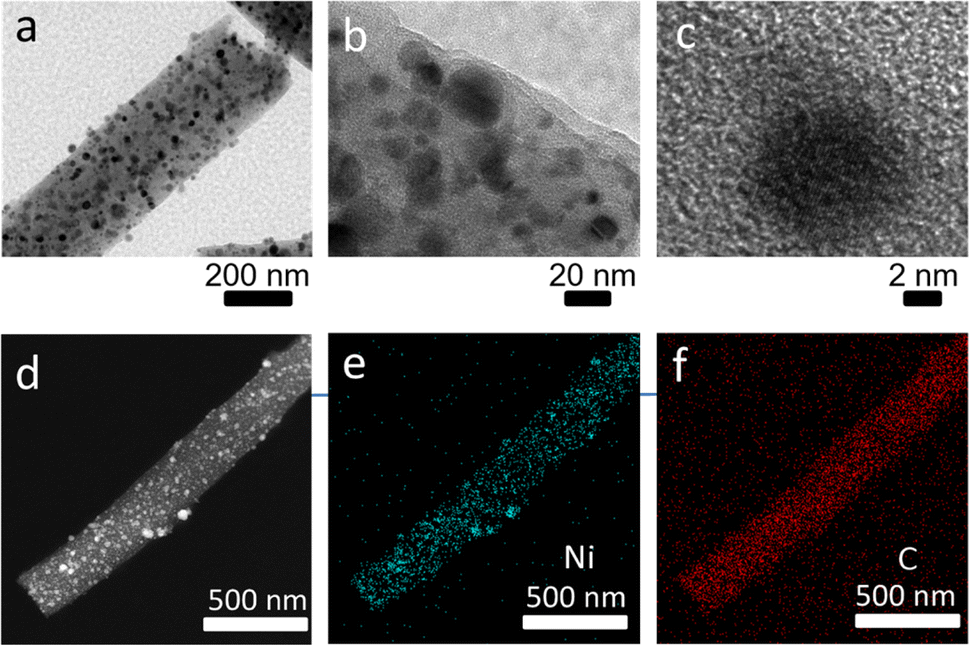 | ||
| Fig. 3 TEM images of Ni/C nanofibers (a–c); elemental mapping images of fibrous nano-Ni/C composites (d–f). | ||
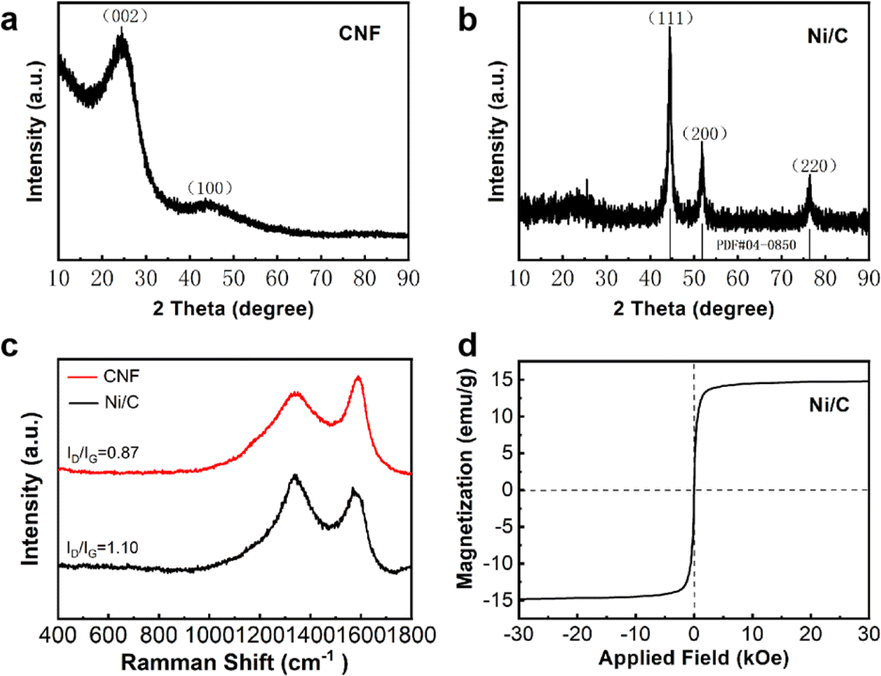
Fig. 3(b and c) display the HRTEM images. The carbon layer wraps Ni nanoparticles in the fiber, and the Ni nanoparticles have a size of approximately 8–10 nm. Fig. 3(d–f) presents the elemental mapping of Ni/C nanofibers under TEM. The nanofiber exhibits homogeneous scattering of the C and Ni elements. This result is in accordance with the later XPS analysis. Ni/C nanocomposites were characterized by X-ray diffraction instrument for their crystalline structures. The XRD image of pure carbon nanofibers is in Fig. 4(a).
 | ||
| Fig. 4 XRD image of carbon nanofibers (a); XRD image (b), Raman spectra (c) and hysteresis loops (d) of Ni/C nanofibers. | ||
We can organize two diffraction peaks at 23.5° and 43.7°, which correspond to the (002) and (100) crystallographic planes of amorphous carbon. Furthermore, the identification of no other diffraction peaks suggests the absence of any impurities in the prepared carbon nanofibers. Fig. 4(b) illustrates the XRD image of Ni/C nanofibers. Three distinct diffraction peaks at 2θ = 44.51°, 50.85°, and 76.37° are identified as the (111), (200), and (220) crystal surfaces of Ni (PDF#04-0850), indicating that nickel acetate was successfully reduced to Ni in H2/Ar during carbonization. Due to the relatively small amount of crystalline carbon in the composite, the diffraction peaks of carbon are not very distinct.
The Raman spectra of CNF and Ni/C nanofibers are displayed in Fig. 4(c). Two diffraction peaks are found at 1337 cm−1 and 1571 cm−1, corresponding to the D and G bands of sp3 amorphous carbon and sp2 graphite carbon, respectively. These two peaks demonstrate the successful conversion of PVA into carbon fiber during carbonization. Generally, the ratio of ID/IG can express the crystallinity of materials after carbonization, and the lower the ratio, the higher the crystallinity.14 The ratio of ID to IG for CNF is 0.87, whereas for Ni/C it is 1.10. This suggests an increase in material defects, favoring polarization loss. In addition, the hysteresis curves of the samples were analyzed using a vibrating sample magnetometer. The saturation magnetization (Ms) and coercivity of Ni/C nanofibers are 14.78 emu g−1 and 80 Oe from Fig. 4(d). The Ms value of 58.6 emu g−1 for bulk nickel far exceeds the counterpart of Ni/C nanofibers.15 It is due to two reasons: First, non-magnetic carbon makes the saturation magnetization of Ni/C nanofibers smaller. Secondly, Ni/C nanofibers have more crystal defects, leading to lower saturation magnetization. Furthermore, the coercivity of massive nickel is approximately 0.7 Oe, which is lower than that of Ni/C nanofibers. This difference is primarily due to surface anisotropy, which is a result of the small size effect.16 Therefore, grain size closely influences coercivity. The magnetic component Ni provides adequate magnetic loss for composite materials, making it more diverse in loss mechanisms and better in impedance matching compared to pure CNF.
The elemental composition and valence states of Ni/C nanofibers were characterized using XPS, and the results are demonstrated in Fig. 5. Fig. 5(a) displays the characteristic peaks of Ni 2p, Ni Auger, and C 1s in the composite, while Fig. 5(b)'s Ni 2p characteristic peak splits into two parts at 873.2 eV and 855.4 eV, corresponding to Ni 2p3/2 and Ni 2p1/2. Moreover, we assign the peaks with combined energies of 869.0 eV and 851.9 eV to the 2p3/2 and 2p1/2 of Ni2+ states. As seen in Fig. 5(c), the binding energies of the three fitted peaks of the C 1s spectrum are 284.8 eV, 286.3 eV, and 289 eV, allocated to C–C/C![[double bond, length as m-dash]](https://www.rsc.org/images/entities/char_e001.gif) C, C–O, and O–CO, respectively.
C, C–O, and O–CO, respectively.
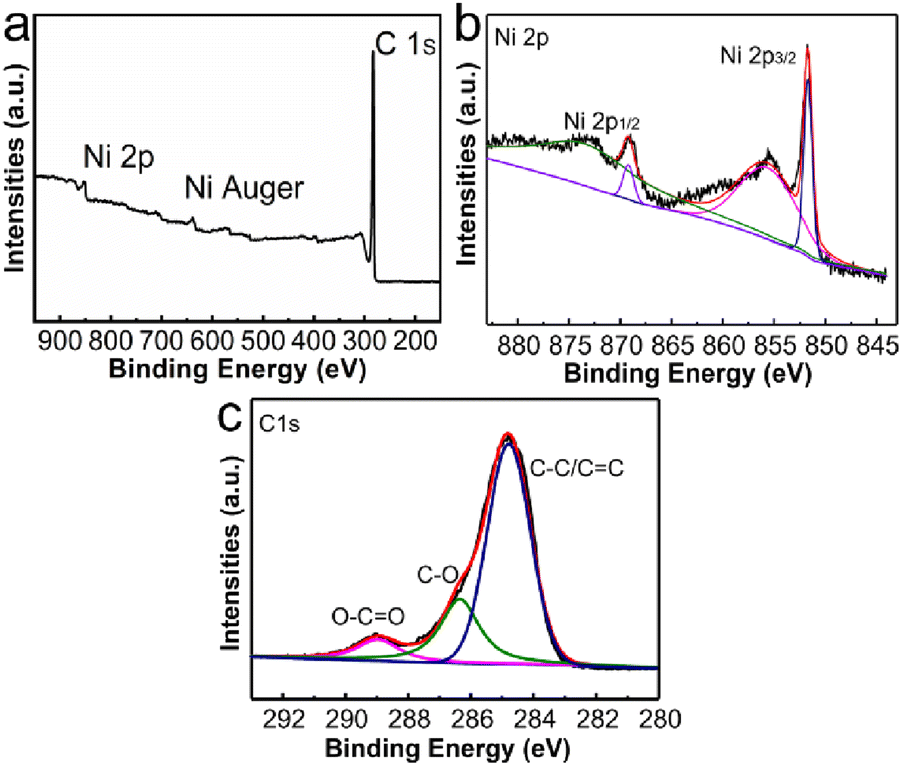 | ||
| Fig. 5 XPS spectra of Ni/C nanofibers: the survey scans (a), Ni 2p spectrum (b) and C 1s spectrum (c) of Ni/C nanofibers. | ||
The reflection loss (RL) generally expresses the simulated microwave absorption performance. RL can be simulated using the formula below.
 | (1) |
 | (2) |
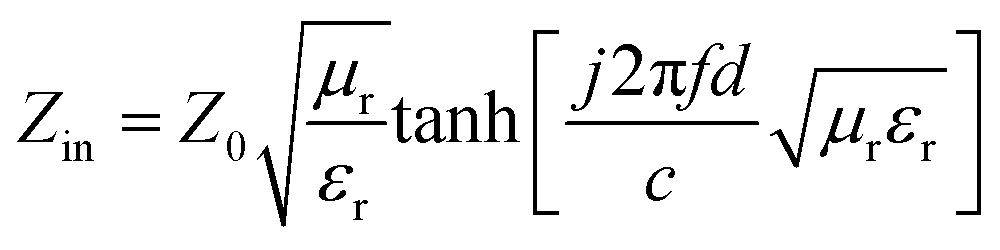
Fig. 6 presents RL curves and a 3D RL map for CNF-50%, Ni/C-30%, Ni/C-50%, and Ni/C-70%. The figure clearly shows, at a thickness of 2.5 mm, the RL of CNF-50% at 13.44 GHz is −26 dB, and the effective absorption bandwidth (EAB) is 6.52 GHz. The minimum RL value of Ni/C nanofibers is −23 dB with a 30 wt% filling ratio, which corresponds to a simulated thickness of 4.5 mm, and the overall absorption performance of Ni/C nanofibers is not very satisfactory at lower filling levels.
 | ||
| Fig. 6 The RL curves, and 3D RL map between thickness of 2–4.5 mm of CNF-50% (a and b), Ni/C-30% (c and d), Ni/C-50% (e and f) and Ni/C-70% (g and h). | ||
When the filling ratio is 50 wt% with a 3 mm thickness, the smallest RL value reaches −30.6 dB, and EAB approaches 5.96 GHz, which performs better. When we further increase the Ni/C nanofiber filling ratio to 70 wt%, we find the minimum RL value (−22.8 dB) at 4 mm thickness for an effective absorption bandwidth of 1.76 GHz, and the widest EAB (5.72 GHz) at 2 mm thickness. Besides, the minimal reflection loss peak shifts from high to lower frequencies with simulated thickness increasing, which is in agreement with other reports.19,20 It could be illustrated in terms of the quarter-wavelength match model:21
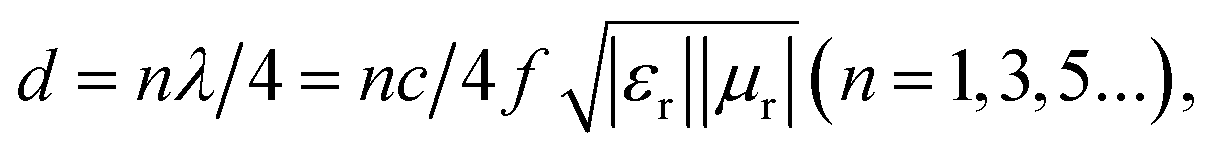 | (3) |
Complex permittivity (εr = ε′ − jε′′) and complex permeability (μr = μ′ − jμ′′) are used to calculate simulated microwave absorption performance. In general, the real part (ε′, μ′) is relevant to the storage capacity of electromagnetic energy, while the imaginary part (ε′′, μ′′) represents the electromagnetic energy dissipation capacity.22 As the proportion of Ni/C nanofiber in paraffin wax increases, ε′ value and ε′′ value and dielectric loss tangent (tanδε = ε′′/ε′) increase overall, as shown in Fig. 7. Resonance peaks appear at multiple μ′ and μ′′ values at different frequencies, and the filling amount does not affect the μ′ and μ′′ values and magnetic loss tangent (tanδμ = μ′′/μ′) of the samples much, probably owing to the low Ni concentration of the prepared Ni/C nanofibers. In comparison, ε′, ε′′, and tanδε of pure carbon fibers are slightly larger than Ni/C nanofibers, while μ′, μ′′ and tanδμ are slightly smaller than Ni/C nanofibers. Better electrical conductivity and, subsequently, stronger dielectric loss, as well as the introduction of the magnetic components, will reduce the dielectric loss and increase magnetic loss capability. It is interesting to note that μ′′ of CNF-50%, Ni/C-70%, and part of Ni/C-30% and Ni/C-50% become negative from around 8–9 GHz because the carbon fibers exhibit good electrical conductivity, and some of the magnetic energy liberated by the magnetic field that was induced internally in the fibres in alternating electric fields cannot be offset by the magnetic loss.23 On the basis of the free electron theory and the Debye theory, the dielectric loss capacity generally comes primarily from the conductivity loss and the polarization relaxation process.24,25
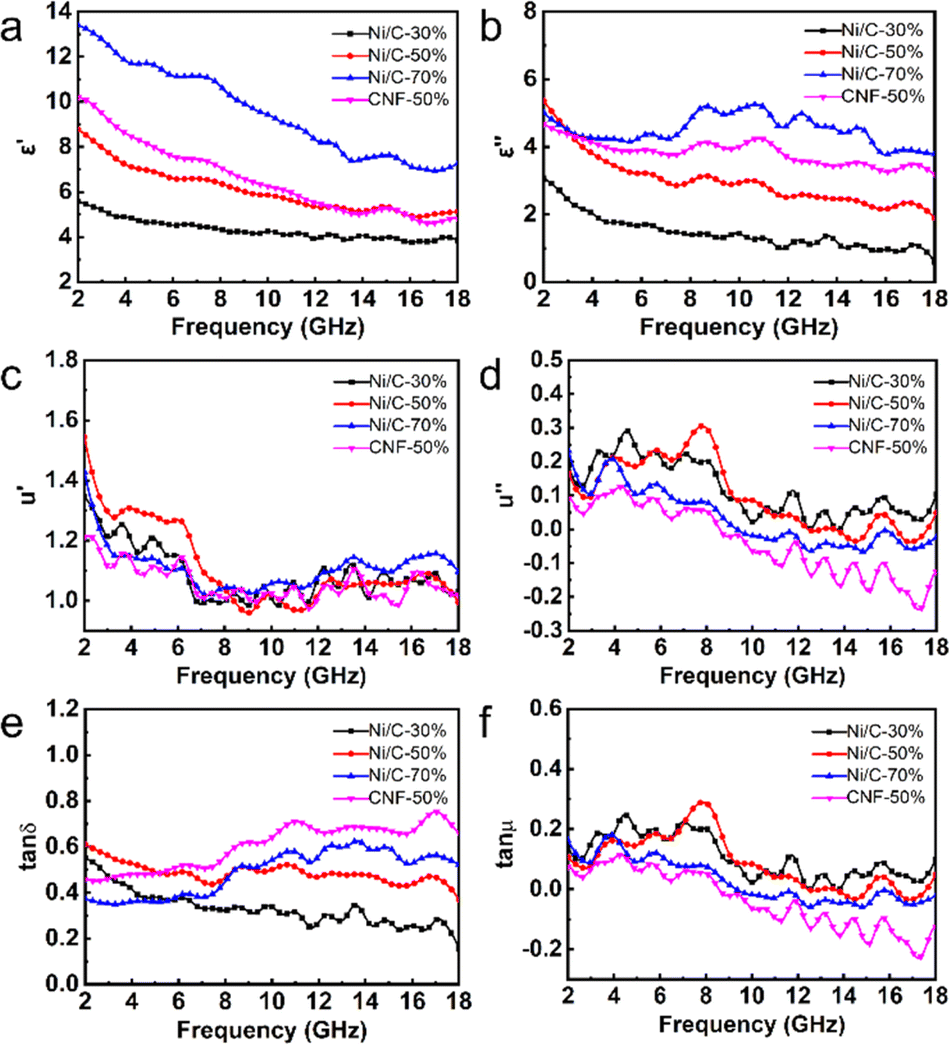 | ||
| Fig. 7 Real (a) and imaginary (b) parts of complex permittivity, real (c) and imaginary (d) parts of complex permeability, dielectric loss tangents (e) and magnetic loss tangents (f) of Ni/C-30%, Ni/C-50%, Ni/C-70%, and CNF-50%. | ||
The electromagnetic field of electromagnetic waves causes induced currents due to the migration of free electrons within the material. When the induced currents pass through the material, the absorbing material produces the Joule effect, which consumes the energy of electromagnetic waves in the form of thermal energy, which is known as conductive loss.26 Conductivity loss benefits from the three-dimensional cross-linked network results from the PVA-based carbon fibers since the electrons can hop between fibers.27 Polarization relaxation processes could be generally divided into four types of modes. Since ion polarization and electron polarization usually take place in a high range of frequency, they are not considered in our paper.28 What is more likely to occur in Ni/C nanofibers is dipole polarization and interfacial polarization. Usually confined to defects, dipoles cannot freely move like electrons in an external electric field. Under high-frequency alternating electric fields, dipoles cannot reorient quickly enough to respond to the applied electric field. Therefore, dipoles must absorb energy from the external environment to reorient and polarize, resulting in a loss of electromagnetic wave energy.29 The appearance of dipole polarization can lead to frequency dispersion behavior on ε′ and ε′′ curve, manifested as a decrease in ε′ and ε′′ with increasing frequency, as shown in Fig. 7(a and b).30 Interface polarization is the result of the accumulation and uneven distribution of space charges caused by the different dielectric properties of the electromagnetic components on both sides of the interface. The different dielectric properties of the electromagnetic components on both sides of the interface lead to the accumulation and uneven distribution of space charges, resulting in electromagnetic wave energy loss, which is called interface polarization.31
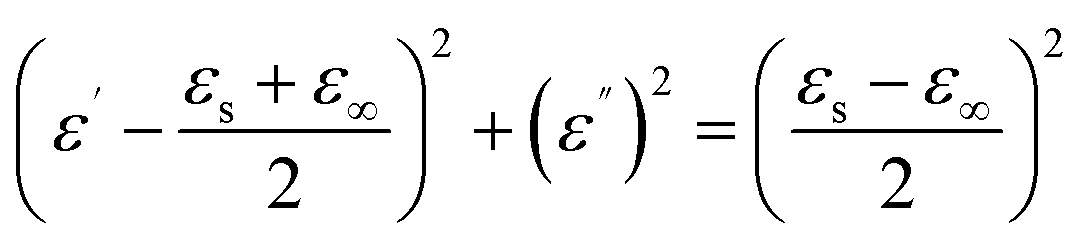
In order to further illustrate the dielectric loss mechanism, the ε′ – ε′′ diagram is shown in Fig. 8. ε′ and ε′′ have the following relationship according to the Debye theory:32
 | (4) |
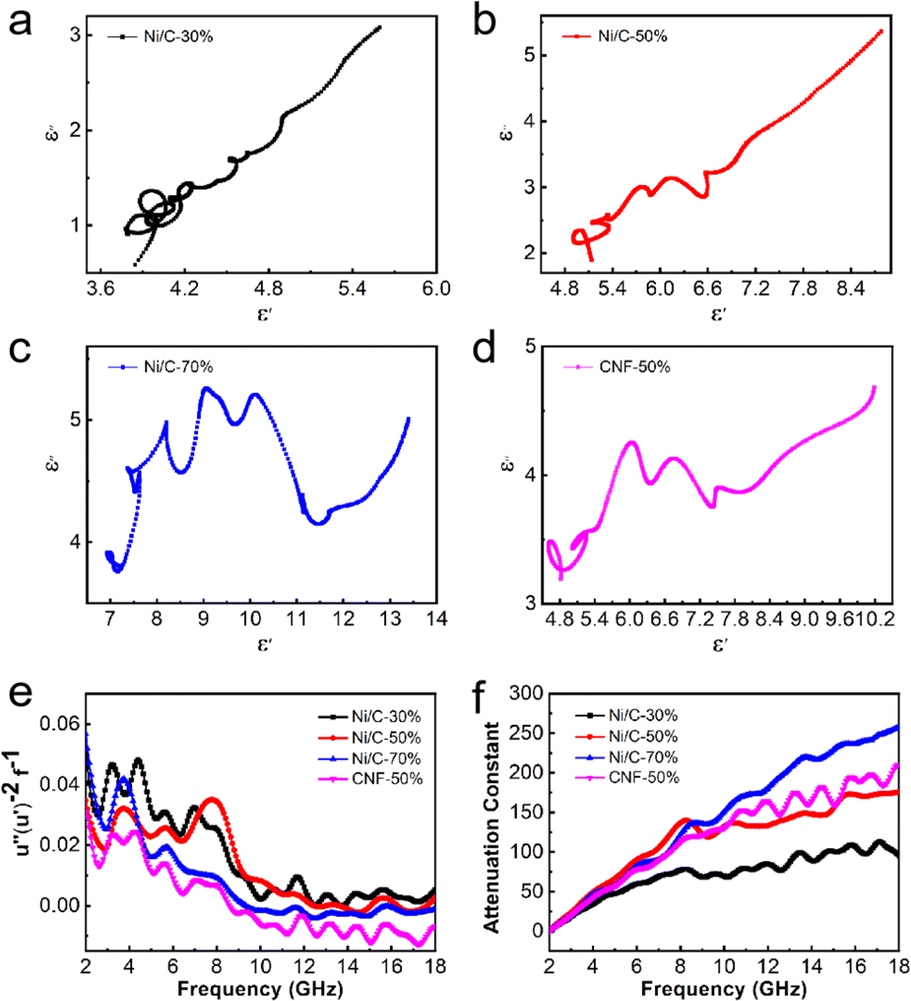 | ||
| Fig. 8 Curves of ε′ versus ε′′ (Cole–Cole semicircles) for Ni/C-30% (a), Ni/C-50% (b), Ni/C-70% (c), and CNF-50% (d). Frequency dependences of μ′′ (μ′)−2f−1 for 30%, 50% and 70% of Ni/C nanofibers (e). Attenuation constant (f) for Ni/C-30%, Ni/C-50%, Ni/C-70%, and CNF-50%. | ||
In addition to dielectric loss, Ni nanoparticles absorb electromagnetic waves through a magnetic loss mechanism. At low frequencies, the magnetic losses are primarily eddy current losses as well as natural resonance. Magnetic materials can respond to external magnetic field changes and form eddy currents. The corresponding loss is called eddy current loss, and eddy current losses may be evaluated by the formula below:34 C0 = μ′′ (μ′)−2f−1. When eddy current loss is dominant, C0 should not vary with f.35 Natural resonance directly describes the energy absorption of ferromagnetic materials with high magnetization under an external anisotropic magnetic field.36
As shown in Fig. 8(e), C0 fluctuates over the entire frequency range, but there is still a relatively constant in a small range. The low-frequency vibration peaks correspond to natural resonances, while the high-frequency vibration peaks correspond to exchange resonances.
The attenuation constant visually quantifies the intrinsic loss capability of materials to incident microwave, and its value can be calculated according to the following equation:37
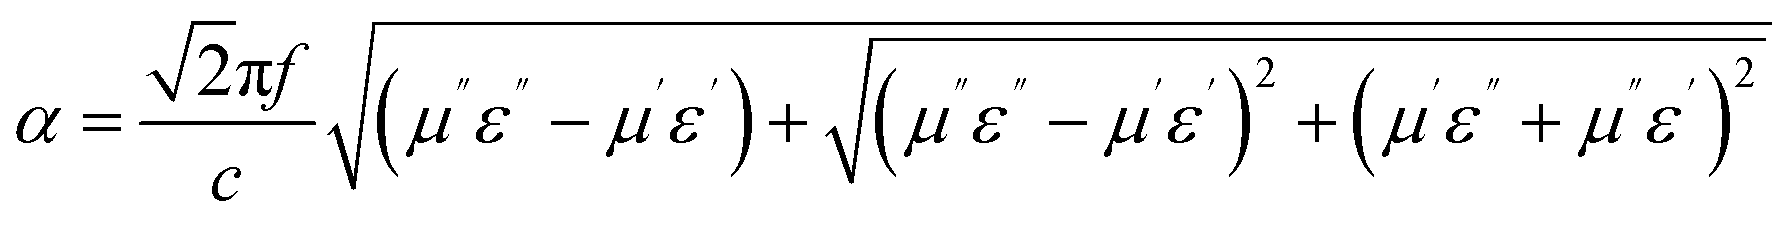 | (5) |
As shown in Fig. 8(f), with the increasing filling ratio of Ni/C nanofibers, the attenuation constant gradually gets greater overall, which is consistent with tanδε and tanδμ. In the range of 2–6 GHz, samples of Ni/C nanofibers and pure carbon fibers have an approximate value. However, α values of Ni/C-30%, Ni/C-50%, Ni/C-70%, and CNF-50% increase from 60, 91, 82 and 78 to 95, 176, 258 and 210 at 6–18 GHz respectively.
Though Ni/C-70% exhibits the best attenuation capacity, its reflection loss is similar to or worse than Ni/C-50%, which could be attributed to another significant factor: impedance matching.38 Impedance matching affects the capacity of a microwave to penetrate the absorber instead of reflecting. It can be measured by the value of |Zin/Z0|. When |Zin/Z0| value is close to 1, it indicates that more microwaves are accessing the absorber to be faded. As shown in Fig. 8, the |Zin/Z0| peak of Ni/C-30%, Ni/C-50%,Ni/C-70%, and CNF-50% are in the range of 1.23–2.58, 0.85–1.33, 0.84–0.92, and 0.90–1.25, respectively. Compared with Ni/C-30% and Ni/C-70%, the |Zin/Z0| value of Ni/50% approaches 1 over a wider frequency range.
Even though the attenuation constant is not optimal, it explains why we achieve the best absorption performance. The reflection loss achieves a minimum in the corresponding range when the value of |Zin/Z0| approaches 1, which is consistent with our analysis in Fig. 9. As the filling amount of the fibrous Ni/C composite goes up, the minimum reflection loss value first goes down and then up. This is because the structure gradually becomes more conductive, which makes dielectric loss worse and makes impedance matching worse. The dual loss mechanism of dielectric loss and magnetic loss makes Ni/C-50% better at absorbing microwaves than CNF-50%. This is because it can better match impedance and absorb microwaves. Table 1 illustrates that while Ni/C nanofibers do not significantly outperform similar types of magnetic carbon nanofiber composites in terms of minimum RL, their wider EAB indicates a greater potential for use in microwave absorption. Compared with previously reported work on porous Ni/C nanofibers, this work achieved significant improvement in EAB due to the smaller size of Ni nanoparticles.47 The interface between more Ni nanoparticles and carbon fibers enhances interface polarization and increases the material's loss capacity.
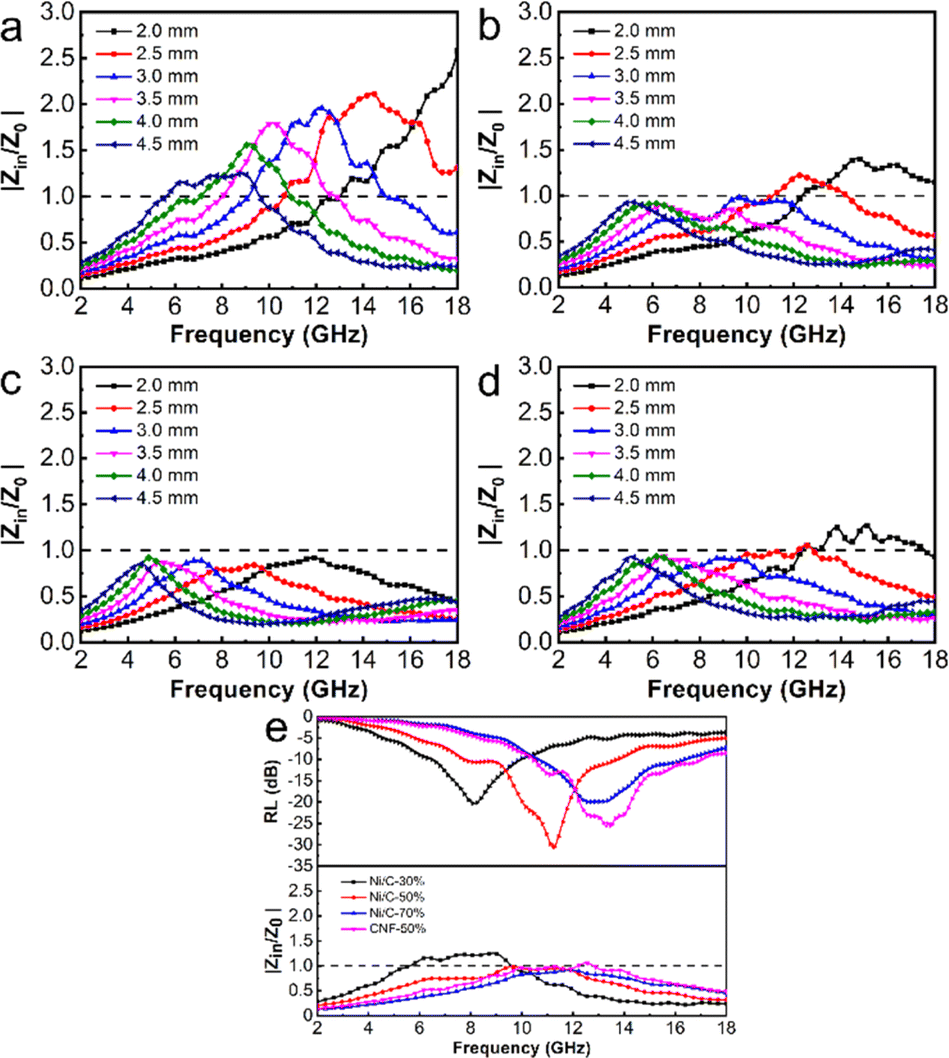 | ||
| Fig. 9 The values of |Zin/Z0| as a function of frequency for various thicknesses for Ni/C-30% (a), Ni/C-50% (b), Ni/C-70% (c), and CNF-50% (d). Reflection loss and impedance matching for optimal microwave absorption performance over all samples (e). | ||
As a result, the competent microwave absorption performance of Ni/C nanofibers is largely due to the collaboration of Ni nanoparticles and carbon fibers. Fig. 10 illustrates the absorption mechanism. Firstly, one-dimensional Ni/C nanofibers have a high specific surface area, which can enhance the multiple scattering effects of electromagnetic waves. Multiple reflections of incident electromagnetic waves between the fibers can produce interference phase cancellation, thereby enhancing the loss. Secondly, the interconnection of Ni/C nanofibers forms a three-dimensional conductive network, and the long and abundant transport paths facilitate electron transfer, thereby enhancing the conduction loss. Thirdly, the defects on Ni/C nanofibers bind charges, forming polarization centers and causing more energy loss in electromagnetic waves. Lastly, the incorporation of magnetic Ni nanoparticles not only enhances the magnetic loss and improves the impedance matching of the composites compared to pure C nanofibers but also generates interfacial polarization at the rich interface between the Ni nanoparticles and the C fibers, which facilitates the microwave absorption performance.
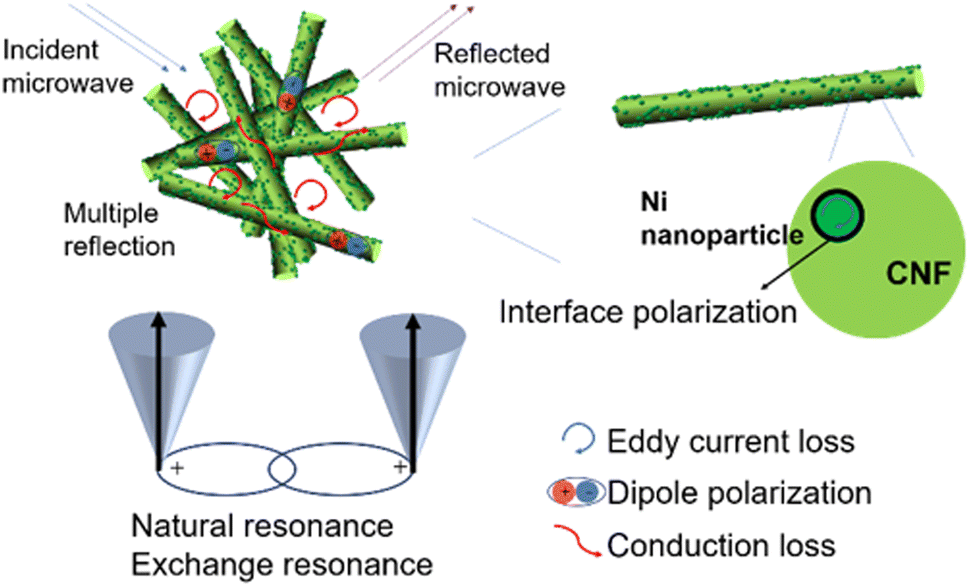 | ||
| Fig. 10 Microwave absorption mechanism of Ni/C nanofibers. | ||
4 Conclusion
In brief, Ni/C nanofibers were successfully manufactured via the integration of electrospinning and high-temperature carbonization. The fiber diameter is about 300 nm, and Ni nanoparticles are homogeneously dispersed throughout the carbon fiber, improving impedance matching. The electromagnetic parameters and microwave absorption properties were investigated by regulating the filling amount of the composite with paraffin wax. The results indicate that when the filling ratio is 50 wt%, there is optimal microwave absorption performance. The RL is as low as −30.6 dB and the EAB is 5.96 GHz. This is because of the combination of magnetic and dielectric losses, as well as the network-like structure created by the Ni/C nanofibers weaving together. It may suggest ideas for future microwave absorbers.Data availability
The data supporting this article have been included as part of the ESI.†Conflicts of interest
There are no conflicts to declare.Acknowledgements
This work is supported by the Guangzhou Municipal Science and Technology Project of China (Grant No. 2024A04J3836).References
- X. M. Guan, Z. H. Yang, M. Zhou, L. Yang, R. Peymanfar, B. Aslibeiki and G. B. Ji, Small Struct., 2022, 3, 23 CrossRef.
- B. Li, F. L. Wang, K. J. Wang, J. Qiao, D. M. Xu, Y. F. Yang, X. Zhang, L. F. Lyu, W. Liu and J. R. Liu, J. Mater. Sci. Technol., 2022, 104, 244–268 CrossRef CAS.
- S. N. Ren, H. J. Yu, L. Wang, Z. K. Huang, T. F. Lin, Y. D. Huang, J. Yang, Y. C. Hong and J. Y. Liu, Nano-Micro Lett., 2022, 14, 39 CrossRef PubMed.
- S. J. Zhang, B. Cheng, Z. G. Gao, D. Lan, Z. W. Zhao, F. C. Wei, Q. S. Zhu, X. P. Lu and G. L. Wu, J. Alloys Compd., 2022, 893, 32 Search PubMed.
- J. L. Liu, L. M. Zhang and H. J. Wu, J. Phys. D Appl. Phys., 2021, 54, 37 Search PubMed.
- B. L. Wang, Q. Wu, Y. G. Fu and T. Liu, J. Mater. Sci. Technol., 2021, 86, 91–109 CrossRef CAS.
- N. N. Wu, Q. Hu, R. B. Wei, X. M. Mai, N. Naik, D. Pan, Z. H. Guo and Z. J. Shi, Carbon, 2021, 176, 88–105 CrossRef CAS.
- D. D. Zhi, T. Li, J. Z. Li, H. S. Ren and F. B. Meng, Compos. B Eng., 2021, 211, 20 CrossRef.
- H. Q. Zhao, Y. Cheng, W. Liu, L. J. Yang, B. S. Zhang, L. P. Wang, G. B. Ji and Z. C. J. Xu, Nano-Micro Lett., 2019, 11, 17 CrossRef PubMed.
- Z. G. Jiao, M. L. Ma, Y. X. Bi, C. G. Lu, C. Feng, P. Lyu, J. D. Zhao and Y. Ma, J. Mater. Sci., 2022, 57, 18243–18265 CrossRef CAS.
- C. Han, M. Zhang, W. Q. Cao and M. S. Cao, Carbon, 2021, 171, 953–962 CrossRef CAS.
- F. Y. Wang, Y. Q. Sun, D. R. Li, B. Zhong, Z. G. Wu, S. Y. Zuo, D. Yan, R. F. Zhuo, J. J. Feng and P. X. Yan, Carbon, 2018, 134, 264–273 CrossRef CAS.
- Z. Xiang, C. Huang, Y. M. Song, B. W. Deng, X. Zhang, X. J. Zhu, D. Batalu, O. Tutunaru and W. Lu, Carbon, 2020, 167, 364–377 CrossRef CAS.
- J. He, D. Y. Shan, J. Ling, H. Luo and S. Q. Yan, J. Electron. Mater., 2022, 51, 7134–7142 CrossRef CAS.
- Y. Q. Shen, Y. P. Wei, J. Q. Ma, Q. L. Li, J. Li, W. J. Shao, P. Z. Yan, G. W. Huang and X. Y. Du, Ceram. Int., 2019, 45, 3313–3324 CrossRef CAS.
- N. A. M. Barakat, B. Kim and H. Y. Kim, J. Phys. Chem. C, 2009, 113, 531–536 CrossRef CAS.
- Q. M. Hu, R. L. Yang, Z. C. Mo, D. W. Lu, L. L. Yang, Z. F. He, H. Zhu, Z. K. Tang and X. C. Gui, Carbon, 2019, 153, 737–744 CrossRef CAS.
- Q. C. Zhang, Z. J. Du, M. M. Hou, Z. Z. Ding, X. Z. Huang, A. L. Chen, Y. T. Ma, S. J. Lu and X. Z. Tang, Carbon, 2022, 188, 442–452 CrossRef CAS.
- J. Q. Tao, J. T. Zhou, Z. J. Yao, Z. B. Jiao, B. Wei, R. Y. Tan and Z. Li, Carbon, 2021, 172, 542–555 CrossRef CAS.
- Y. L. Zhang, X. X. Wang and M. S. Cao, Nano Res., 2018, 11, 1426–1436 CrossRef CAS.
- X. Y. Fu, Q. Zheng, L. Li and M. S. Cao, Carbon, 2022, 197, 324–333 CrossRef CAS.
- N. Wang, Y. Wang, Z. Lu, R. R. Cheng, L. Q. Yang and Y. F. Li, Carbon, 2023, 202, 254–264 CrossRef CAS.
- S. X. Dong, J. Li, S. Zhang, N. Li, B. Li, Q. L. Zhang and L. Q. Ge, Colloids Surf., A, 2022, 655, 14 CrossRef.
- J. Qiao, X. Zhang, D. M. Xu, L. X. Kong, L. F. Lv, F. Yang, F. L. Wang, W. Liu and J. R. Liu, Chem. Eng. J., 2020, 380, 9 CrossRef.
- Z. Y. Zhang, Y. H. Zhao, Z. H. Li, L. J. Zhang, Z. X. Liu, Z. K. Long, Y. J. Li, Y. Liu, R. H. Fan, K. Sun and Z. D. Zhang, Adv. Compos. Hybrid Mater., 2022, 5, 513–524 CrossRef CAS.
- F. Meng, H. Wang, F. Huang, Y. Guo, Z. Wang, D. Hui and Z. Zhou, Composites, Part B, 2018, 137, 260–277 CrossRef CAS.
- J. X. Chen, Y. R. Wang, Y. F. Liu, Y. Tan, J. Zhang, P. B. Liu and J. Kong, Carbon, 2023, 208, 82–91 CrossRef CAS.
- C. H. Tian, Y. C. Du, P. Xu, R. Qiang, Y. Wang, D. Ding, J. L. Xue, J. Ma, H. T. Zhao and X. J. Han, ACS Appl. Mater. Interfaces, 2015, 7, 20090–20099 CrossRef CAS PubMed.
- B. Quan, X. Liang, G. Ji, Y. Cheng, W. Liu, J. Ma, Y. Zhang, D. Li and G. Xu, J. Alloys Compd., 2017, 728, 1065–1075 CrossRef CAS.
- L. Gai, H. Zhao, F. Wang, P. Wang, Y. Liu, X. Han and Y. Du, Nano Res., 2022, 15, 9410–9439 CrossRef.
- H. Lv, Z. Yang, H. Pan and R. Wu, Prog. Mater. Sci., 2022, 127, 100946 CrossRef CAS.
- H. Y. Wang, X. B. Sun, Y. Xin, S. H. Yang, P. F. Hu and G. S. Wang, J. Mater. Sci. Technol., 2023, 134, 132–141 CrossRef CAS.
- P. Z. Liu, T. D. Gao, W. J. He and P. B. Liu, Carbon, 2023, 202, 244–253 CrossRef CAS.
- S. S. Li, X. W. Tang, X. Zhao, S. J. Lu, J. T. Luo, Z. Y. Chai, T. T. Ma, Q. Q. Lan, P. M. Ma, W. F. Dong, Z. C. Wang and T. X. Liu, J. Mater. Sci. Technol., 2023, 133, 238–248 CrossRef CAS.
- L. L. Ma, Z. F. Dou, D. G. Li, J. Liu, Y. Xu and G. Z. Wang, Carbon, 2023, 201, 587–598 CrossRef CAS.
- X. Zeng, X. Cheng, R. Yu and G. D. Stucky, Carbon, 2020, 168, 606–623 CrossRef CAS.
- Z. N. Xiang, Y. Q. Wang, X. M. Yin and Q. C. He, Chem. Eng. J., 2023, 451, 10 Search PubMed.
- S. W. Song, A. T. Zhang, L. Chen, Q. Jia, C. L. Zhou, J. Q. Liu and X. X. Wang, Carbon, 2021, 176, 279–289 CrossRef CAS.
- T. Wang, H. Wang, X. Chi, R. Li and J. Wang, Carbon, 2014, 74, 312–318 CrossRef CAS.
- J. Lv, X. Liang, G. Ji, B. Quan, W. Liu and Y. Du, ACS Sustainable Chem. Eng., 2018, 6, 7239–7249 CrossRef CAS.
- C. Li, H. Song, X. Jiang, Z. Zhang and L. Yu, J. Alloys Compd., 2020, 814, 152171 CrossRef CAS.
- Y. Wan, J. Xiao, C. Li, G. Xiong, R. Guo, L. Li, M. Han and H. Luo, J. Magn. Magn. Mater., 2016, 399, 252–259 CrossRef CAS.
- D. Liu, R. Qiang, Y. Du, Y. Wang, C. Tian and X. Han, J. Colloid Interface Sci., 2018, 514, 10–20 CrossRef CAS PubMed.
- X. Zuo, P. Xu, C. Zhang, M. Li, X. Jiang and X. Yue, Ceram. Int., 2019, 45, 4474–4481 CrossRef CAS.
- H. Liu, Y. Li, M. Yuan, G. Sun, H. Li, S. Ma, Q. Liao and Y. Zhang, ACS Appl. Mater. Interfaces, 2018, 10, 22591–22601 CrossRef CAS PubMed.
- H. Liu, Y. Li, M. Yuan, G. Sun, Q. Liao and Y. Zhang, Sci. Rep., 2018, 8, 16832 CrossRef PubMed.
- J. N. Yang, G. G. Guan, J. Xiang, L. Yan, Y. M. Zhang, J. H. Xu and K. Y. Zhang, J. Alloys Compd., 2022, 891, 9 Search PubMed.
Footnote |
| † Electronic supplementary information (ESI) available. See DOI: https://doi.org/10.1039/d4ra03367a |
| This journal is © The Royal Society of Chemistry 2024 |