
 Open Access Article
 This Open Access Article is licensed under a
 Creative Commons Attribution 3.0 Unported Licence
Modulating the effective ionic radii of trivalent dopants in ceria using a combination of dopants to improve catalytic efficiency for the oxygen evolution reaction†
Debarati Dasab,
Jyoti Prakash bc,
Anisha Bandyopadhyaybd,
Annu Balharaab,
U. K. Goutame,
Raghunath Acharyaab,
Santosh K. Gupta*ab and
Kathi Sudarshan*ab
bc,
Anisha Bandyopadhyaybd,
Annu Balharaab,
U. K. Goutame,
Raghunath Acharyaab,
Santosh K. Gupta*ab and
Kathi Sudarshan*ab
aRadiochemistry Division, Bhabha Atomic Research Centre, Mumbai-400085, India. E-mail: kathis@barc.gov.in; santoshg@barc.gov.in
bHomi Bhabha National Institute, Anushaktinagar, Mumbai – 400094, India
cMaterials Group, Bhabha Atomic Research Centre, Mumbai-400085, India
dRadiation and Photochemistry Division, Bhabha Atomic Research Centre, Mumbai-400085, India
eTechnical Physics Division, Bhabha Atomic Research Centre, Mumbai-400085, India
First published on 3rd June 2024
Abstract
Aliovalent doping in ceria and defect engineering are important aspects in tuning the properties of ceria for advanced technological applications, especially in the emerging field of electrocatalytic water-splitting for harvesting renewable energy. However, the ambiguity regarding the choice of dopants/co-dopants and ways to deal with the size difference between dopants and lattice hosts remains a long-standing problem. In this study, ceria was aliovalently codoped with Sc3+ and La3+ while keeping the total concentration of dopants constant; the ionic radius of the former is smaller and that of the latter is larger than Ce4+. Variations in the relative amounts of these dopants helped to modulate the effective ionic radii and match that of the host. A systematic study on the role of these aliovalent dopants in defect evolution in ceria and in modulating the Ce3+ fraction using powder XRD, Rietveld refinement, positron annihilation lifetime spectroscopy, X-ray photoelectron spectroscopy, Eu3+ photoluminescence, and Raman spectroscopy is presented here. The evolved defects and their dependence on subtle factors other than charge compensation are further correlated with their electrocatalytic activity towards oxygen evolution reaction (OER) in alkaline medium. The catalyst with an optimum defect density, maximum Ce3+ fraction at the surface and the least effective ionic radius difference between the dopants and the host demonstrated the best performance towards the OER. This study demonstrates how effective ionic radius modulation in defect-engineered ceria through a judicious choice of codopants can enhance the catalytic property of ceria and provides immensely helpful information for designing ceria-based heterogeneous catalysts with desired functionalities.
1. Introduction
Defects are known to play a pivotal role in determining the optical, electrical, catalytic, magnetic and various other properties of importance to the technological applications of advanced functional materials. Accordingly, engineering defects to tailor or improve the properties of interest has gained prominence.1–3 Ceria (CeO2) is one such system on which numerous studies have been carried out to explore its potential in diverse technological applications such as redox catalysis, photocatalysis, organic transformation, gas sensing and thermal barrier coatings owing to its remarkable structural stability, superior oxygen storage capability, surface activity and transport properties.2,4,5 In the last several decades, water-splitting reactions, viz. the oxygen evolution reaction (OER) and hydrogen evolution reaction (HER), using electrocatalysis have acquired great importance in the fabrication of renewable energy devices such as rechargeable batteries, supercapacitors and regenerative solid-oxide fuel cells for sustainable energy applications.6–8 Being a low-cost and earth-abundant rare-earth oxide with outstanding mechanical stability and exceptionally high corrosion resistance, ceria has been used as a catalyst for water splitting.9–11 Aliovalent doping is a well-known strategy to introduce desired defects in ceria by exploiting charge and size mismatch between the host and dopant ions to accelerate its catalytic response.11–13 Doping not only impacts the active sites of adsorption such as oxygen vacancies but also promotes the ion-transport mechanism through vacancies and the readily switchable Ce3+/Ce4+ redox pair. However, tailoring defects in ceria to improve catalytic efficiency depends on the judicious choice of aliovalent dopants that particularly promote water-splitting reactions. Trivalent lanthanide dopant incorporated ceria has been investigated for enhanced water-splitting activity for solar thermochemical hydrogen generation,13–15 electrochemical water splitting16,17 and other catalytic reactions.18,19 Despite many studies on defect evolution in ceria with different dopants for various technological applications, a clear picture is still to emerge regarding various factors that dictate the overall properties of the doped ceria. Therefore, it is imperative to gain a further understanding of the various factors influencing electrocatalytic efficiency and draw a systematic correlation between the dopants and desired outcomes.In the simplest case, doping of two trivalent ions at the tetravalent Ce cation site would lead to an oxygen vacancy but the easy reducibility of Ce4+ to Ce3+, differences in the ionic radii of the dopants with respect to the host lattice and the relative distributions of oxygen vacancies and dopants, as well as their mutual association in the matrix, make the situation more complex. For example, some studies have reported increased Ce3+ concentration and oxygen vacancy concentration with smaller trivalent ion doping20 due to their ability to accommodate larger Ce3+ without much lattice distortion; other groups have shown lower Ce3+ concentrations with smaller dopants because their strong association with oxygen vacancies does not aid the reduction of Ce4+ to Ce3+.17,21 Vinothkumar et al.19 reported an enhancement in oxygen vacancy (VO) concentration with increasing ionic radii of the lanthanide dopants; however, Ke et al.22 suggested an initial increase in oxygen vacancy concentration with the size of the trivalent lanthanide dopant followed by a reduction with larger lanthanides. A decrease in Ce3+ concentration at higher La doping levels is also reported and is attributed to the change in the defect structure from La3+-VO-Ce3+ to La3+-VO-La3+ with increased doping.23
The studies so far show the complexities and intricacies in understanding the factors influencing the evolution of defects in trivalent-ion-doped ceria. This study is aimed at gaining a better understanding of the factors that influence the defect evolution other than the concentration of trivalent dopants and their role in governing its reactivity towards electrocatalytic water splitting. For this purpose, ceria was doped with Sc3+ and La3+, which have ionic radii smaller and larger than Ce4+, respectively, to modulate the effective ionic radii of the trivalent dopants and understand their influence on OER reaction catalysis. The total concentration of the trivalent dopant was kept constant at 20 mole% with respect to Ce to unravel subtle factors governing defect evolution, their distribution, and Ce3+ content other than charge compensation. The ceria catalysts were synthesized by a gel-combustion method, and doping was confirmed by powder X-ray Diffraction (XRD), Rietveld refinement and neutron activation analysis. The crystallite size and strain were further determined using the Williamson–Hall method, and the morphology was investigated using Transmission-Electron Microscopy. The evolution of oxygen vacancies was examined using Positron Annihilation Lifetime Spectroscopy (PALS) and Raman spectroscopy. The surface oxygen vacancy concentration and Ce3+ fraction were determined using X-ray photoelectron spectroscopy (XPS). Photoluminescence (PL) was employed to extract information about the distribution of oxygen vacancies using the hypersensitivity of electric dipole transitions in Eu3+ manifesting the features of the local surroundings. The ceria catalysts were explored for OER in alkaline media, and their catalytic activity was further correlated with effective ionic radii modulation, evolved defects, lattice strain and reducibility to Ce3+. The findings from this study will be extremely useful in further designing ceria-based composite catalysts with enhanced activity of the ceria counterpart.
2. Experimental methods
2.1. Synthesis of powder ceria catalysts
All the samples were synthesized by the gel-combustion method reported in our earlier studies using urea as the fuel.17,24 Cerium nitrate hexahydrate (Ce (NO3)3·6H2O) and urea were used in a 1![[thin space (1/6-em)]](https://www.rsc.org/images/entities/char_2009.gif) :2 molar ratio as the starting materials. La2O3, Sc2O3 and Eu2O3 were dissolved individually in concentrated nitric acid to prepare stock solutions. Appropriate volumes of these dopant solutions were added to the aqueous solutions of precursors so that the total concentration of Sc3+ and La3+ was 20 mole% of cerium nitrate. The concentration of Eu3+ was kept fixed at 4 mol% of Ce in all the doped samples. The solution was heated until it converted to a gel under an IR lamp and then heated in a tubular furnace initially for a few minutes at 250 °C for the combustion of urea, which was followed by crushing, further heating for three hours at 500 °C and finally, annealing at 800 °C for four hours. Ambient air flow was used in the tubular furnace during heat treatment.
:2 molar ratio as the starting materials. La2O3, Sc2O3 and Eu2O3 were dissolved individually in concentrated nitric acid to prepare stock solutions. Appropriate volumes of these dopant solutions were added to the aqueous solutions of precursors so that the total concentration of Sc3+ and La3+ was 20 mole% of cerium nitrate. The concentration of Eu3+ was kept fixed at 4 mol% of Ce in all the doped samples. The solution was heated until it converted to a gel under an IR lamp and then heated in a tubular furnace initially for a few minutes at 250 °C for the combustion of urea, which was followed by crushing, further heating for three hours at 500 °C and finally, annealing at 800 °C for four hours. Ambient air flow was used in the tubular furnace during heat treatment.
2.2. Structural, morphological and compositional characterization of as-synthesized ceria
The calcined ceria powders were characterised by the powder XRD technique using a benchtop XRD (Proto Make) in the 2θ range of 20 to 80 degrees at 2 degrees per minute. The experimentally acquired XRD patterns were further subjected to Rietveld refinement using FullProf software, and a Williamson–Hall analysis was carried out to calculate lattice strain and crystallite size from the XRD pattern. The morphology of a representative codoped ceria catalyst was investigated by employing High-Resolution Transmission Emission Microscopy (HRTEM) using a FEI Talos F200S instrument at 200 kV. To determine the dopant concentration, Neutron Activation Analysis (NAA) was carried out with approximately 10–15 mg of each sample along with standards made up of homogeneous mixtures of CeO2 and the individual dopant oxides, namely La2O3, Sc2O3 and Eu2O3. The samples along with the standards were irradiated in the ‘self-serve’ irradiation facility of Dhruva research reactor, Bhabha Atomic Research Centre, Mumbai for two hours. The irradiated samples were assayed by gamma spectrometry with a 30% relative efficiency HPGe detector with an energy resolution of 2 keV at 1333 keV of 60Co.25 The concentration of the dopants was estimated based on the specific activity of the standard oxides irradiated under the same condition.2.3. Defect spectroscopy of the ceria catalysts
To understand defect evolution in the ceria catalysts, Positron Annihilation Lifetime Spectroscopic (PALS) studies were carried out using a fast–fast coincidence positron lifetime spectrometer equipped with two fast-timing BaF2 scintillation detectors with an overall time resolution of ∼173 ps. Carrier-free 22Na (∼15 μCi), which was used as the positron source, was immersed in a sufficient quantity of the powder samples in a sandwich configuration, and acquisition was done for ∼1 million counts. The experimental lifetime spectra were convoluted using the instrumental resolution function and fitted using the PALSFit3 software to extract the different lifetime components.26 The PAL spectrum of Si was used as the reference to evaluate the fraction of positron annihilating within the source. To further obtain insights into the surface distribution of defects and Ce3+, XPS measurements were carried out at the synchrotron radiation facility using hard X-ray photoelectron spectroscopy (HAXPES) beamline BL-14, Indus-2 (ref. 27) equipped with a double-crystal monochromator [Si (111)] with an excitation energy of 4.359 keV and a hemispherical analyzer and detector system (Phoibos 225, Specs make). The typical pressure in the experimental station was maintained at 5 × 10⁻⁹ mbar.Photoluminescence (PL) measurements were carried out on an FLS1000 spectrometer (Edinburgh Instruments) equipped with 450 W steady-state xenon lamps. Raman spectra were recorded on a home-built Raman spectrometer that utilized a continuous-wave 532 nm Nd:YAG laser of 50 mW power, and further details of instrumentation are given elsewhere.28
2.4. Electrochemical measurements
To evaluate the catalytic activity of the ceria catalysts towards OER, electrochemical studies were performed in N2-saturated 1 M KOH solution (pH 14) using a CHI760 galvanostat/potentiostat electrochemical workstation. A glassy carbon electrode (3 mm diameter) was used as the working electrode, while an Ag/AgCl (3 M KCl) electrode and Pt wire were used as the reference and counter electrodes, respectively, in the three-electrode set-up. The catalyst ink was prepared by dispersing 5 mg of each catalyst in a mixed solution of 250 μL of iso-propanol, 750 μL of water and 50 μL of 5 wt% Nafion, which acted as the binder. The catalyst ink was homogenized by ultrasonication for 30–45 minutes, and 10 μL (5 μL at a time) of the ink was drop-casted over the clean surface of the GCE with a geometrical area of 0.0706 cm2. The electrode was kept within a closed enclosure for 45 minutes for drying. To evaluate the OER activity, Linear Sweep Voltammograms (LSV) were recorded in the potential range of 0 to 1.5 V vs. Ag/AgCl at a scan rate of 2 mV s−1. Impedance measurements were carried in the frequency range of 1 Hz to 100 kHz at a fixed potential of +1.0 V vs. Ag/AgCl electrode. The potentials were converted with respect to the reversible hydrogen electrode using the following equation.| E(RHE) = E(Ag/AgCl) + E0(Ag/AgCl) + 0.0591pH | (1) |
The EIS data were analysed using the EC Lab software to model the equivalent circuit and extract the charge transfer resistance.29 Chronopotentiometric measurement was performed with the best-performing catalyst to check the stability of the catalyst.
3. Results and discussion
3.1. Powder X-ray diffraction
The powder XRD patterns of all the samples prepared are given in Fig. 1a. The standard pattern of CeO2 (ICSD no. 01-080-5547) is also shown at the bottom. The XRD patterns of all the samples match quite well with the standard pattern of CeO2 corresponding to the fluorite structure with the space group Fm![[3 with combining macron]](https://www.rsc.org/images/entities/char_0033_0304.gif) m. No additional unidentified peaks were observed, indicating the phase purity of the samples, and the shifts in peak positions further assure the incorporation of dopants in the lattice. The ionic radii of La3+, Sc3+, Ce3+ and Ce4+ in 8 coordination were 1.16, 0.87, 1.14, and 0.97 Å respectively. It was also noted that the XRD peaks of the La-rich sample were shifted to lower angles compared with the undoped sample due to the larger size of the La3+ dopant than Ce4+. Similarly, the XRD patterns of the Sc-rich samples were shifted to higher angles due to the smaller ionic radii of Sc3+, and both these suggest the incorporation of dopants in the lattice of Ce4+.
m. No additional unidentified peaks were observed, indicating the phase purity of the samples, and the shifts in peak positions further assure the incorporation of dopants in the lattice. The ionic radii of La3+, Sc3+, Ce3+ and Ce4+ in 8 coordination were 1.16, 0.87, 1.14, and 0.97 Å respectively. It was also noted that the XRD peaks of the La-rich sample were shifted to lower angles compared with the undoped sample due to the larger size of the La3+ dopant than Ce4+. Similarly, the XRD patterns of the Sc-rich samples were shifted to higher angles due to the smaller ionic radii of Sc3+, and both these suggest the incorporation of dopants in the lattice of Ce4+.
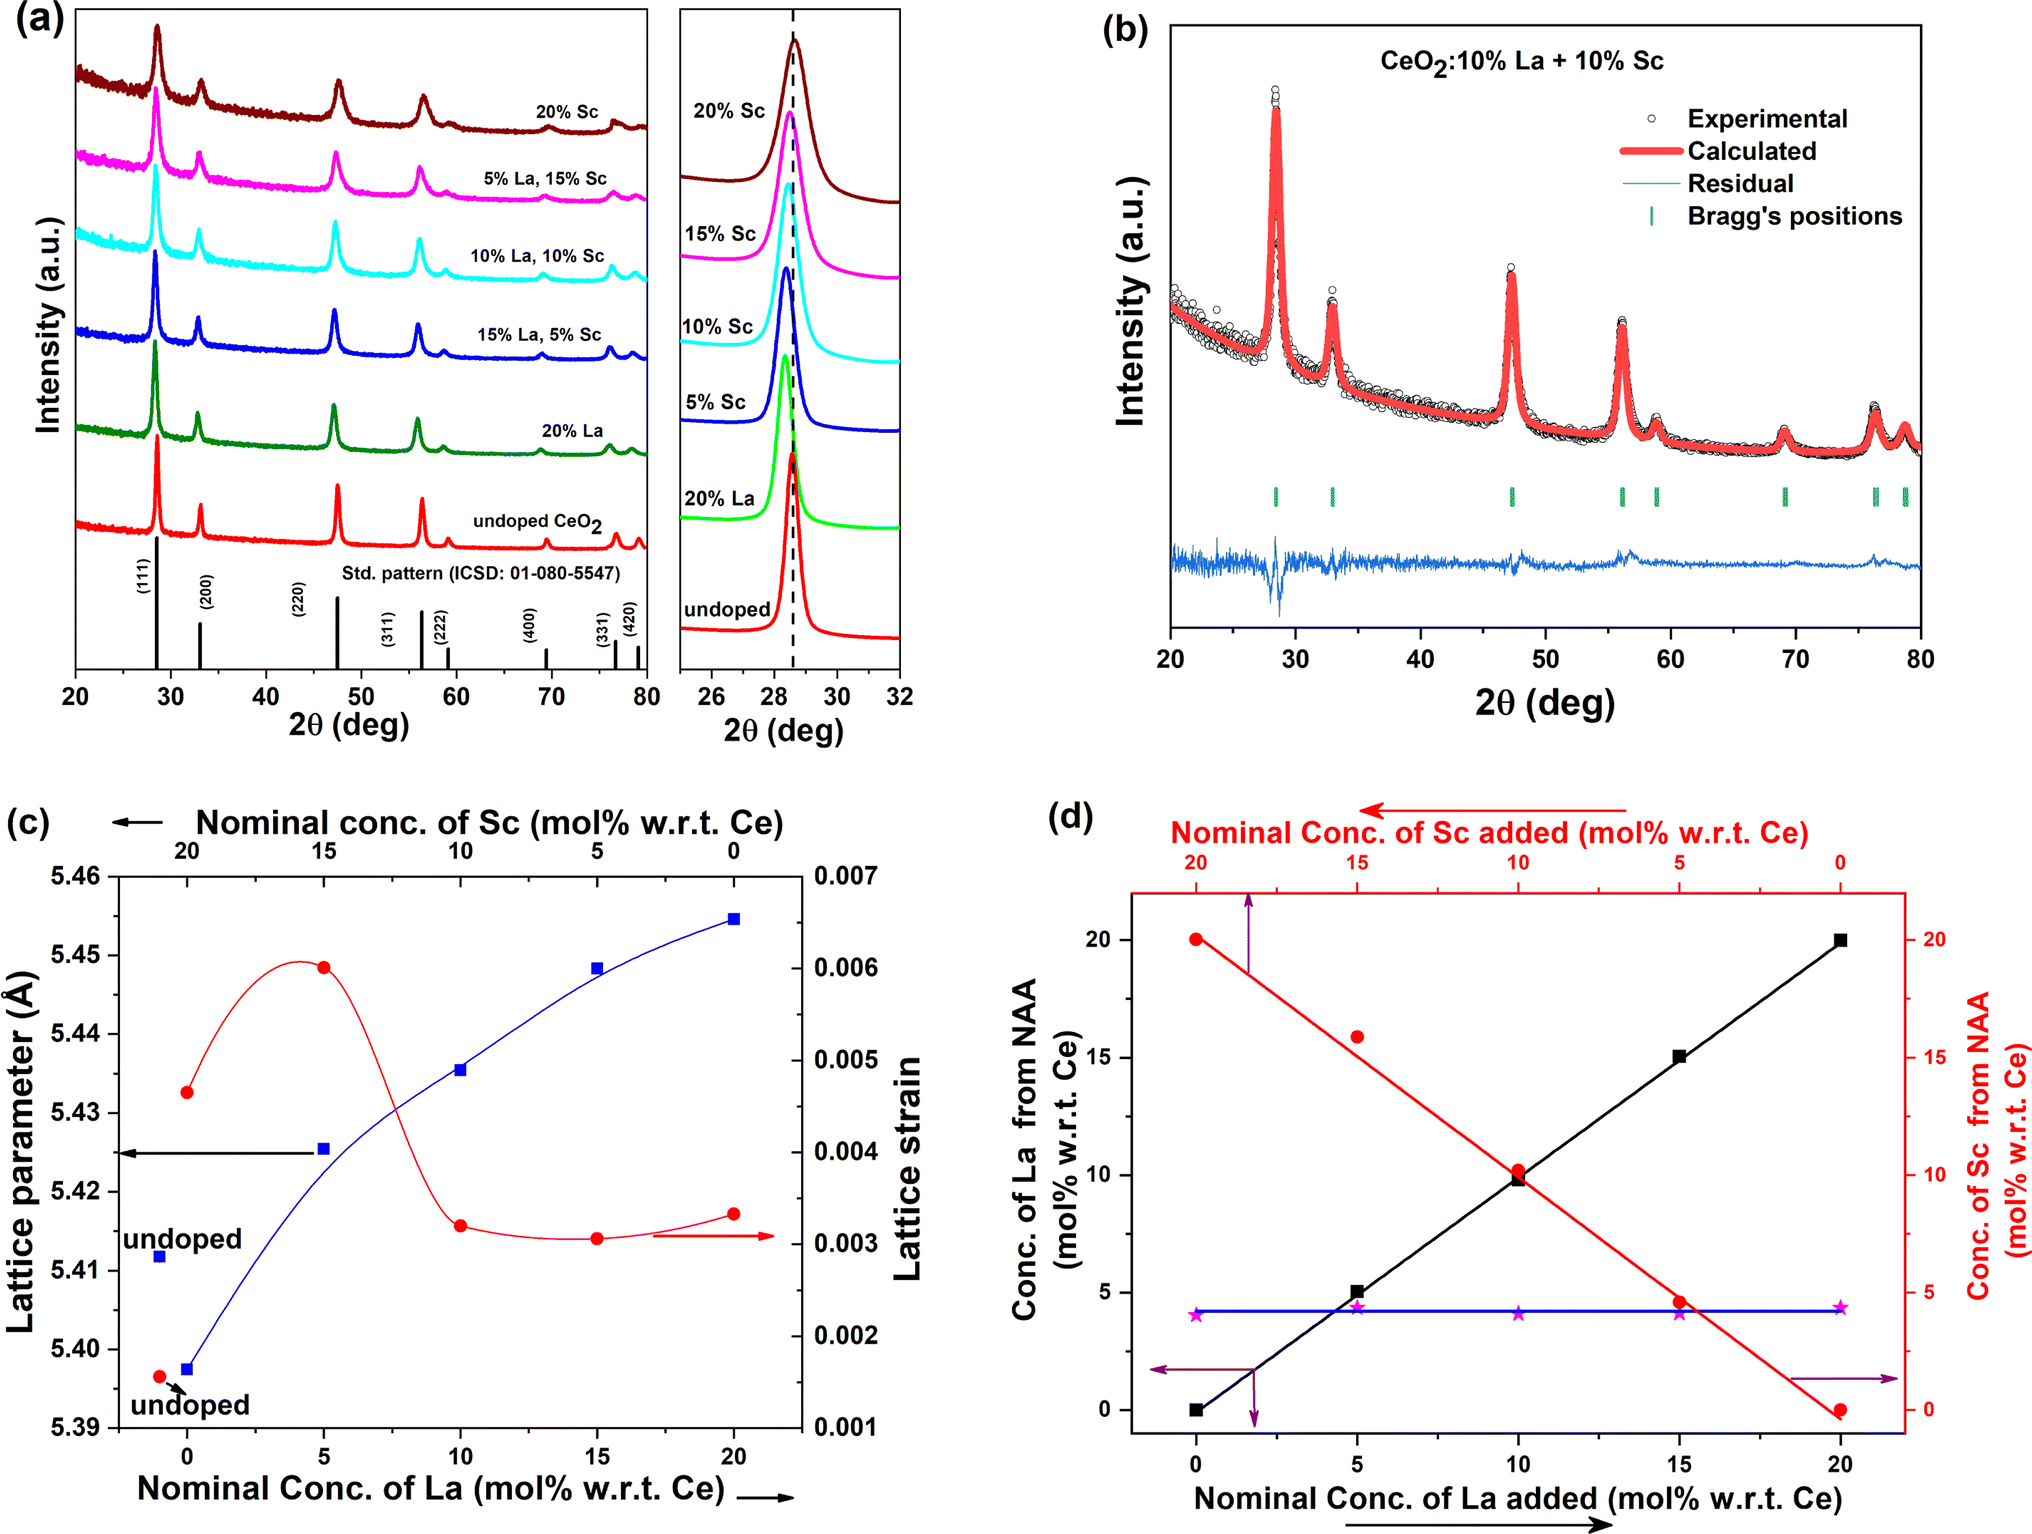 | ||
| Fig. 1 (a) Powder XRD patterns of Sc3+ and La3+ codoped CeO2 samples. (b) A typical Rietveld-refined XRD pattern. (c) Variations in the lattice parameter and lattice strain upon codoping (the lines shown are eye-guides only). (d) Dopant concentrations in the doped ceria samples determined using neutron activation analysis. | ||
To determine the lattice strain and crystallite size of the ceria samples, Williamson–Hall analysis was carried out with the experimentally acquired patterns. The details of the methodology are elaborated in the ESI along with the calculated crystallite size in Table S1.† The crystallite sizes of the doped catalysts were found to be lower than that of undoped ceria. This is quite similar to our previous finding that trivalent ion doping restricts crystallite growth. The variation in lattice strain is demonstrated in Fig. 1c. The maximum lattice strain was observed in the case of 15% Sc + 5% La codoped CeO2. The strain decreased with the gradual incorporation of the larger dopant La3+, possibly due to lattice expansion, and the strain was marginally higher in the 20% La-doped sample.
3.2. Neutron activation analysis and morphological studies
To further validate the presence of dopants in ceria, the neutron-irradiated samples were assayed using gamma-ray spectroscopy. The typical gamma-ray spectrum from a codoped sample is shown in Fig. S3.† The gamma rays corresponding to each of the dopants could be identified in the spectrum. The measured peak areas (PA) were corrected for decay during counting and cooling time to get the relative activity (not corrected for detector efficiency) at the time of the end of irradiation (AEoI), as shown below:
 | (2) |
 | (3) |
The TEM micrographs of the 15% Sc + 5% La codoped CeO2 nanoparticles at two different magnifications are shown in Fig. 2a and b, and the selected area electron diffraction pattern is shown in Fig. 2c. The micrograph in Fig. 2a shows agglomeration of the smaller nanoparticles, which is frequently observed in the case of ceramic nanopowders synthesized via a sol–gel or gel-combustion route. The uniform elemental distribution of the dopants in the ceria matrix was further confirmed by the High-Angle Annular Dark-Field (HAADF) images of the ceria nanoparticles, as depicted in Fig. 2d.
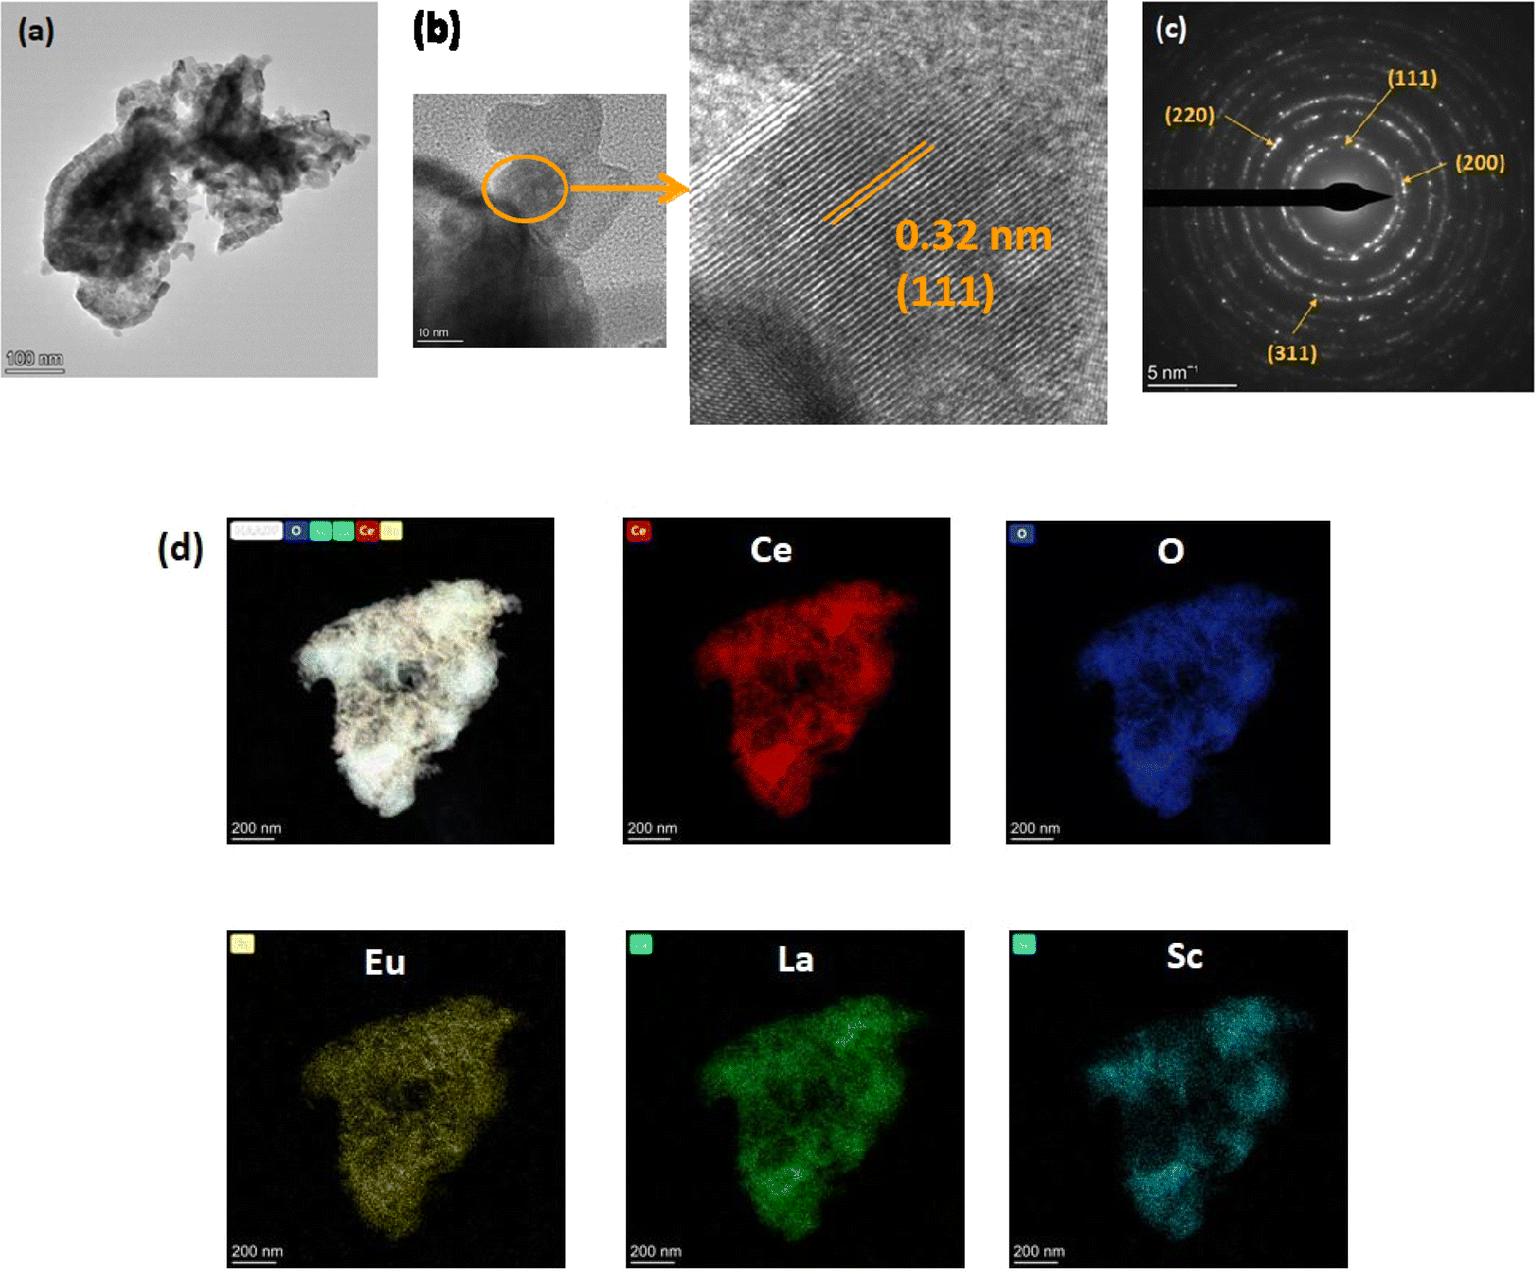 | ||
| Fig. 2 (a and b) TEM images at two different magnifications. (c) SAED pattern and (d) STEM-HAADF elemental mapping of 15% Sc and 5% La codoped CeO2 nanoparticles. | ||
3.3. Positron annihilation lifetime spectroscopy
The PAL spectra of the undoped and doped CeO2 catalysts were fitted as the sum of three lifetime components, of which the third component (τ3) in the range of 1–2 ns was attributed to o-Ps pick-off annihilation at the surface and inter-grain boundaries. This τ3 does not bear much relevance in our present study, and therefore, subsequent discussions are centred around the first two lifetime components and their corresponding intensities only. A typical fitting of the lifetime spectrum is shown in Fig. S4.†The first lifetime component (τ1) of undoped ceria was obtained as 192 ps, which is slightly higher than the previously reported experimental bulk lifetime of 184 ps, as well as the theoretically calculated lifetime of 172 ps.30 This enhancement in τ1 can be attributed to the presence of inherent oxygen vacancies that as shallow positron traps in ceria, quite similar to our previous works.24,31 As evident from Fig. 3a, τ1 increased upon doping, indicating the creation of a greater number of oxygen vacancies. With an increase in the relative concentration of La3+ (or decrease in Sc3+), both τ1 and I1 initially decreased (Fig. 3a and c) and showed minima around CeO2:10% Sc, 10% La and later increased. τ1 is usually ascribed to positron annihilation from the delocalised bulk, and its lifetime is indistinguishable from the lifetime of positrons from shallow positron traps like oxygen vacancies. The variations in τ1 and I1 suggest that the smaller oxygen vacancies, such as monovacancy and neutral Ce3+-VO or Ln3+-VO vacancy, reduce initially with an increase in the La3+ dopant fraction. The second lifetime component τ2 is ascribed to the presence of oxygen vacancy aggregates that act as large vacancy clusters near the surface. This lifetime also showed minima with maxima in its corresponding intensity when both Sc3+ and La3+ were doped equally (Fig. 3b and c). The positron data together suggest that the vacancy aggregates grow in number initially and in cluster size at higher La concentrations. The smaller crystallite size of the codoped catalysts could be another auxiliary factor responsible for high I2, thereby allowing a greater fraction of positrons to diffuse to the surface of the crystallites. The average positron lifetime, which was calculated as the intensity-weighted average of the two positron lifetimes (Fig. 3d), increased monotonically with the increase in La3+ fraction, showing an overall increase in defect concentration with increasing La fraction, which is in agreement with previous studies.17,19,22 The growth of vacancy clusters near the surface, as shown by an increase in τ2, might be responsible for the reduction in lattice strain despite the La3+ dopant being larger in size than Ce4+. The weaker association of charge-compensating vacancies with the dopant in the case of large La dopant as compared to in the case of a high Sc content might be responsible for the formation of larger vacancy clusters in the former.32,33
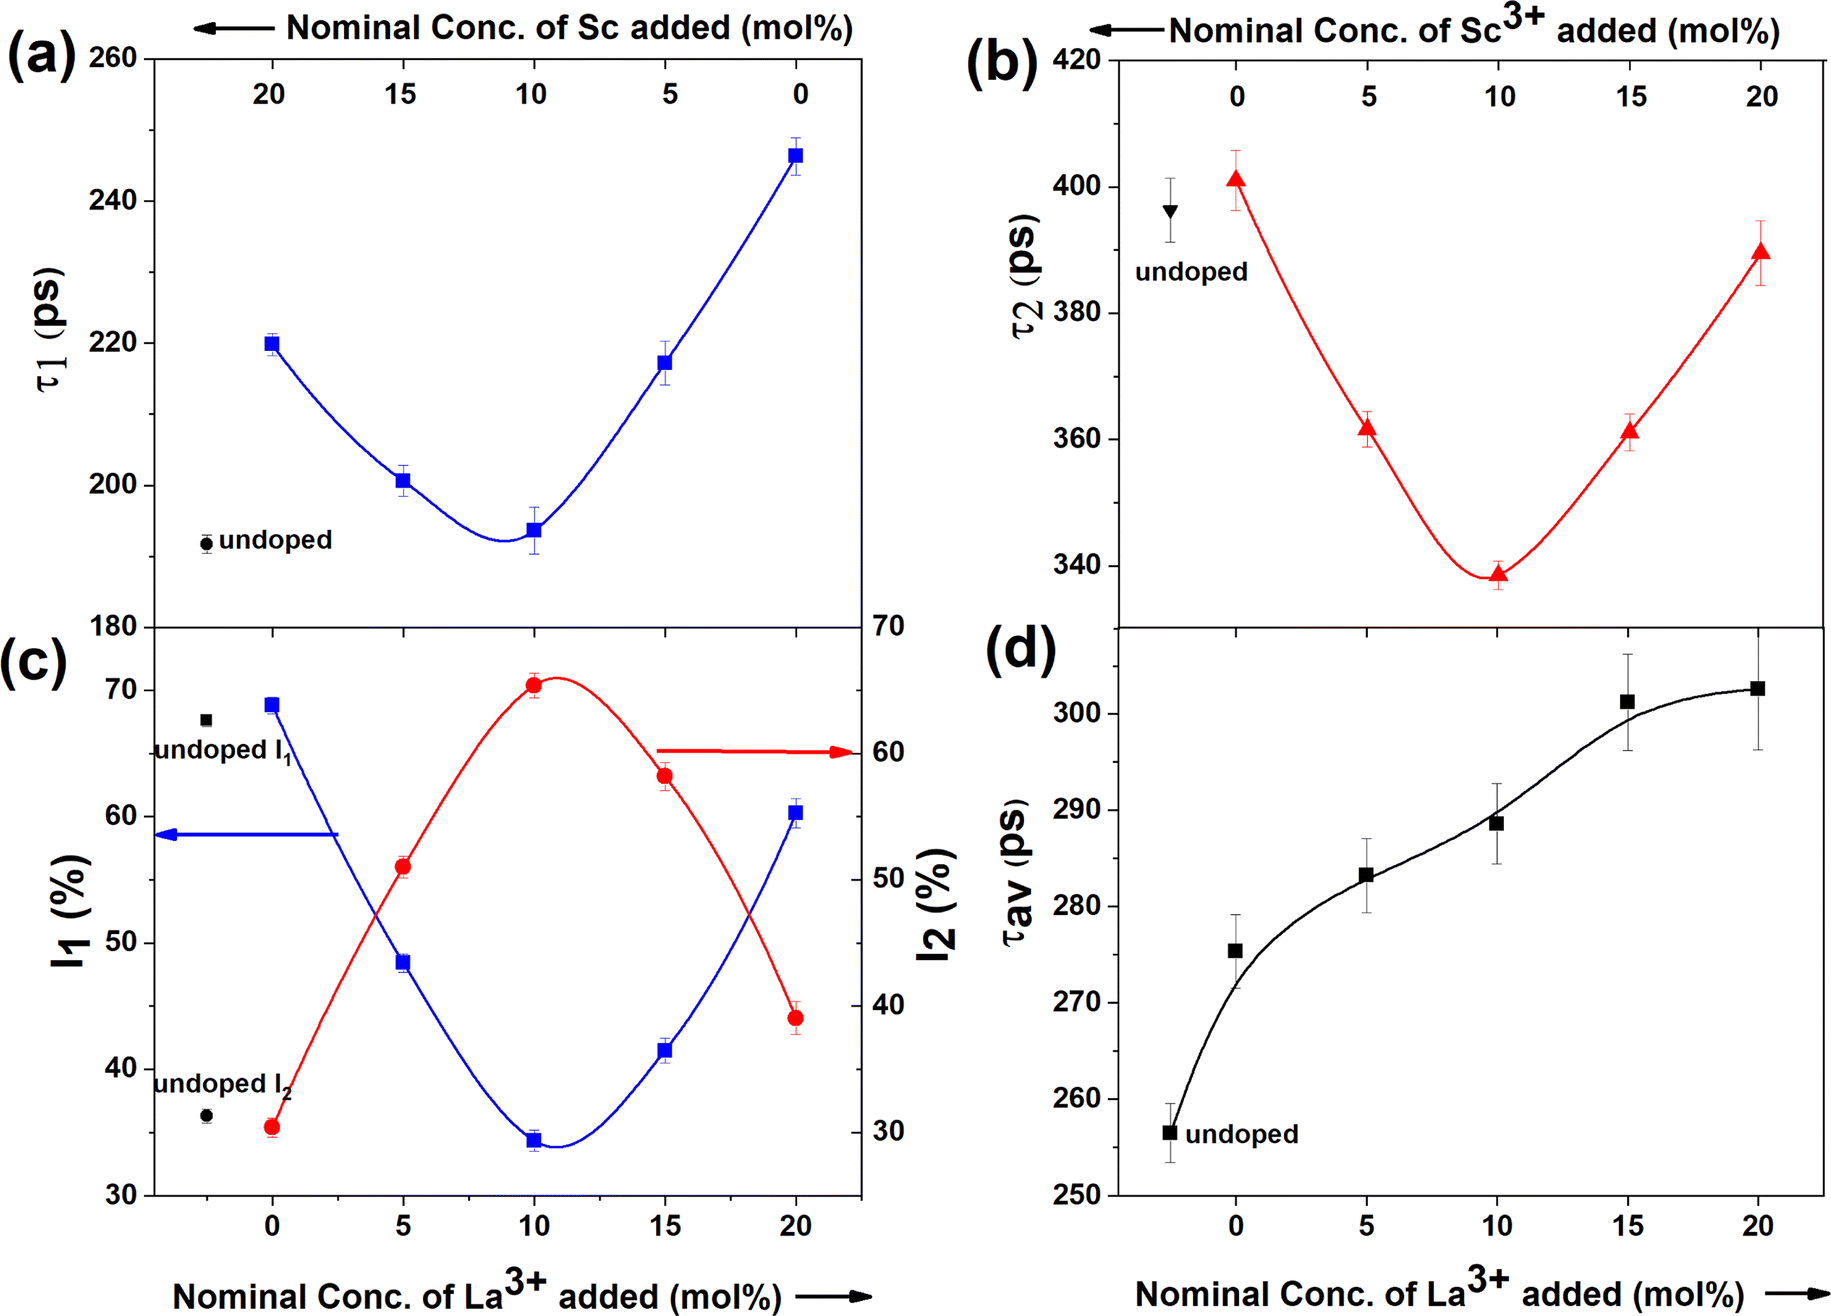 | ||
| Fig. 3 (a and b) Variations in the first and second positron lifetime components; (c) their corresponding intensities and (d) intensity-weighted average positron lifetimes of the ceria catalysts. The lines in the figures are guides to the eye. | ||
3.4. X-ray photoelectron spectroscopy (XPS)
To extract information about the Ce3+ fraction and changes in oxygen vacancy concentration at the surface upon doping, XPS measurements were carried out. The survey scans did not show any impurity peaks for the samples.Due to the coexistence of both Ce3+ and Ce4+ and their possible mixtures in the final state configurations, the XPS spectrum from cerium in ceria appeared to be quite complex. The Ce-3d XPS spectra could be deconvoluted to ten peaks due to the splitting originating from spin–orbit coupling, giving rise to the Ce 3d5/2 and Ce 3d3/2 regions, and each further consisted of five peaks due to the presence of Ce3+, Ce4+ and other possible configurations.34 Because of the intrinsic complexity of the spectra and to minimize the number of variables to be fitted, the widths of the corresponding peaks in the Ce 3d5/2 and Ce 3d3/2 regions were taken equal, and the relative intensity was also fixed as 3:2. The spectra showed six peaks located at 885.9 eV (ν), 896.2 eV (ν′′), 901.5 eV (ν′′′), 905.3 eV (u), 914.3 (u′′) and 919.3 (u′′′) related to Ce4+ and four components at 880.9 eV (ν0), 890.4 eV (ν′), 900.8 eV (u0) and 909.9 eV (u′) corresponding to the main and satellite peaks of Ce3+. The nomenclature of the peaks is based on the literature, and the positions of the peaks are in good agreement with the previously reported results.35 The typical XPS spectra from Ce-3d fitted to different components are shown in Fig. 4a. The fraction of Ce3+ on the surface was determined as the ratio of the total fractional area under the peaks ν0, u0, ν′ and u′ to the total area of all the peaks given above. The percentage of Ce3+ on the surface of the samples thus evaluated is given in Fig. 4b.
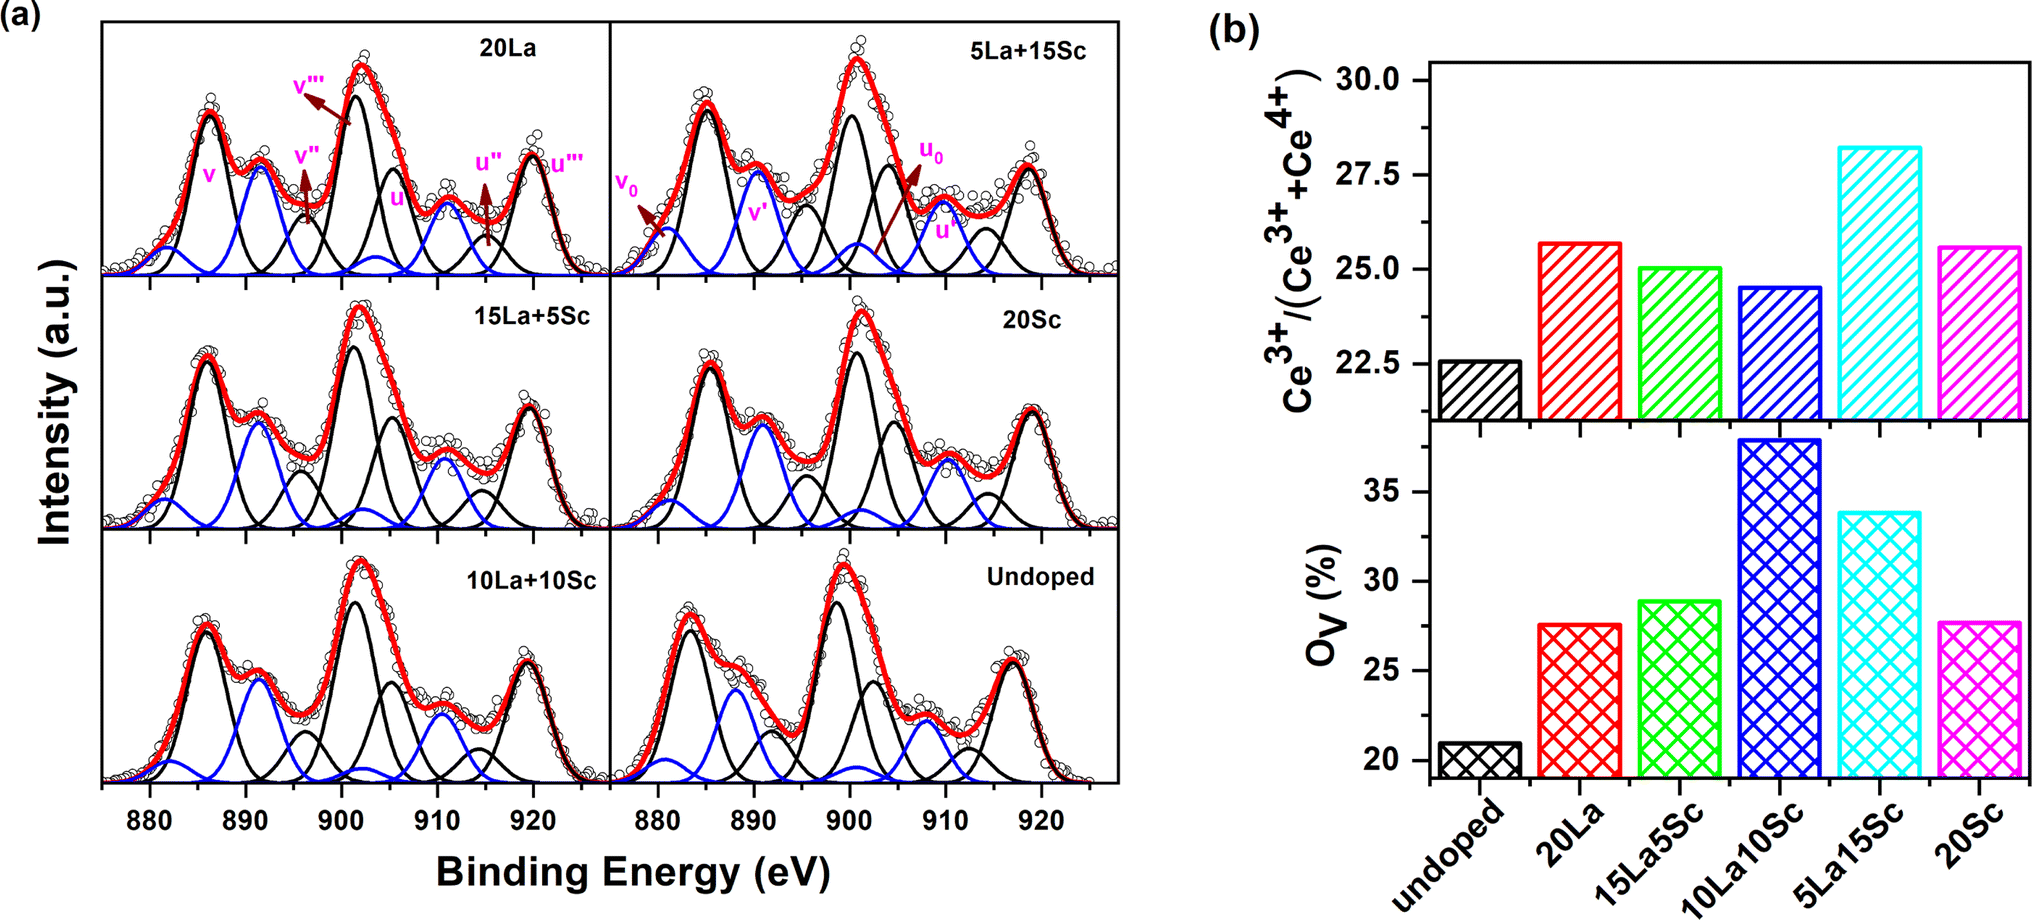 | ||
| Fig. 4 (a) Fitted Ce-3d XPS spectra of the ceria catalysts; (b) Ce3+ and oxygen vacancy concentrations on the surface of the ceria catalysts, as calculated from the Ce-3d and O-1s XPS spectra, respectively. | ||
Similarly, the O-1s XPS spectra (as shown in Fig. S5, ESI†) could be deconvoluted into three components located at binding energies ∼529.8 eV, ∼533.1 eV and ∼535.6 eV. Based on the literature, the peak at 529.8 eV is attributed to lattice oxygen bound to Ce4+ (OL), while the peak at 533.1 eV corresponds to oxygen bound to Ce3+ or the signature of oxygen vacancies (Ov) and the third peak at 535.6 eV arises due to adsorbed oxygen (OA).36 The fractional areas under the peaks at ∼533.1 eV were evaluated as the relative oxygen vacancy concentrations on the surface of ceria and are given in Fig. 4b. As evident from Fig. S5,† there was a shift in the peak maximum of the peak corresponding to Ov and the intensity of both ∼533.1 and ∼535.6 eV peaks were higher in the doped samples compared with undoped ceria.
It can be seen from Fig. 4b that undoped ceria showed a Ce3+ fraction of about 22.5%, which increased with trivalent ion doping in all cases. Moreover, the Ce3+ concentration was higher when ceria was codoped with 15% Sc and 5% La than in the case of single doping with either 20% Sc or 20% La.
On the other hand, the surface oxygen vacancy concentration was also observed to be higher in all the doped samples than in undoped ceria, for which the Ov concentration (under coordinated oxygen) was calculated as 20.95%. The variation in oxygen vacancy concentration at the surface is also quite similar to the trend of the intensity (I2) variation of the second positron lifetime component pertaining to surface defects. In other words, it can be suggested that the abundance of oxygen vacancy clusters is the highest at the surface when the two codopants are doped in an equal stoichiometric ratio.
Some studies in the literature have reported that the proportion of trivalent cerium positively correlates with the concentration of oxygen vacancies.37,38 In the studies referred to above, CeO2 was singly doped with one particular heteroatom from the same row of transition metals at a time, and they were lower in ionic size than that of Ce. Therefore, it can be suggested that, in this study, the simultaneous doping of multiple trivalent ions with appreciable differences in ionic radii with respect to Ce might lead to the evolution of oxygen vacancies to varied extents. The oxygen vacancies also have varied tendencies of association with different-sized dopants besides forming vacancy clusters among themselves. Therefore, identifying a one-to-one correlation between Ov and trivalent Ce is hard in this case. A similar scenario has also been manifested in our previous study on a similar ceria system.17
3.5. Time-resolved photoluminescence
As discussed earlier, all the samples were spiked with Eu3+ in order to use the luminescence emission from Eu3+ to probe the local structure around the dopants. It is well-known that the emission from Eu3+ is highly sensitive to its surroundings due to the presence of hypersensitive electric dipole transitions (EDT). The photoluminescence emission spectra of all the doped samples were recorded in the region corresponding to Eu3+ emission with excitation at 394 nm and are shown in Fig. 5a. The prominent transitions are marked in the spectra. The most intense transitions found in the spectra are 5D0 → 7F1 and 5D0 → 7F2. It is well-known that the magnetic dipole transition (MDT) 5D0 → 7F1 is dominant when Eu3+ is present at a site with inversion symmetry, while the electric dipole transition (EDT) 5D0 → 7F2 is dominant when Eu3+ is present at a site with non-inversion symmetry. The Ce4+ site in CeO2 is of cubic symmetry with an inversion centre. To understand the symmetry around Eu3+, asymmetry in the emission signal was calculated as the ratio of areas under the emission peaks corresponding to EDT/MDT. The calculated asymmetry ratios are shown in Fig. 5b. The asymmetry ratio initially increased with the La3+ fraction and reached the maximum for the 15% La + 5% Sc codoped sample. An increase in asymmetry with the variation in trivalent dopant concentration in ceria is well-known due to the increase in oxygen vacancy concentration.31,39,40 However, it may be noted that the trivalent ion content in all the samples studied here was constant, and only the relative fraction of Sc3+ (smaller trivalent) to La3+ (larger trivalent) was changed. Based on the charge balance, the oxygen vacancy concentration should remain constant. The increase in asymmetry with an increase in La3+ or lowering of asymmetry at high Sc3+ fractions shows that Eu3+ is in a more symmetric environment when the Sc3+ fraction is high. This may be attributed to the strong association of oxygen vacancies with smaller trivalent ions, which enhances the symmetry around Eu3+ due to the removal of oxygen vacancies, as reported by various theoretical studies.33,41 Thus, in Sc3+-rich doped samples, the dominant vacancies seem to be Sc3+-VO-Sc3+ and Sc3+-VO-Ce4+.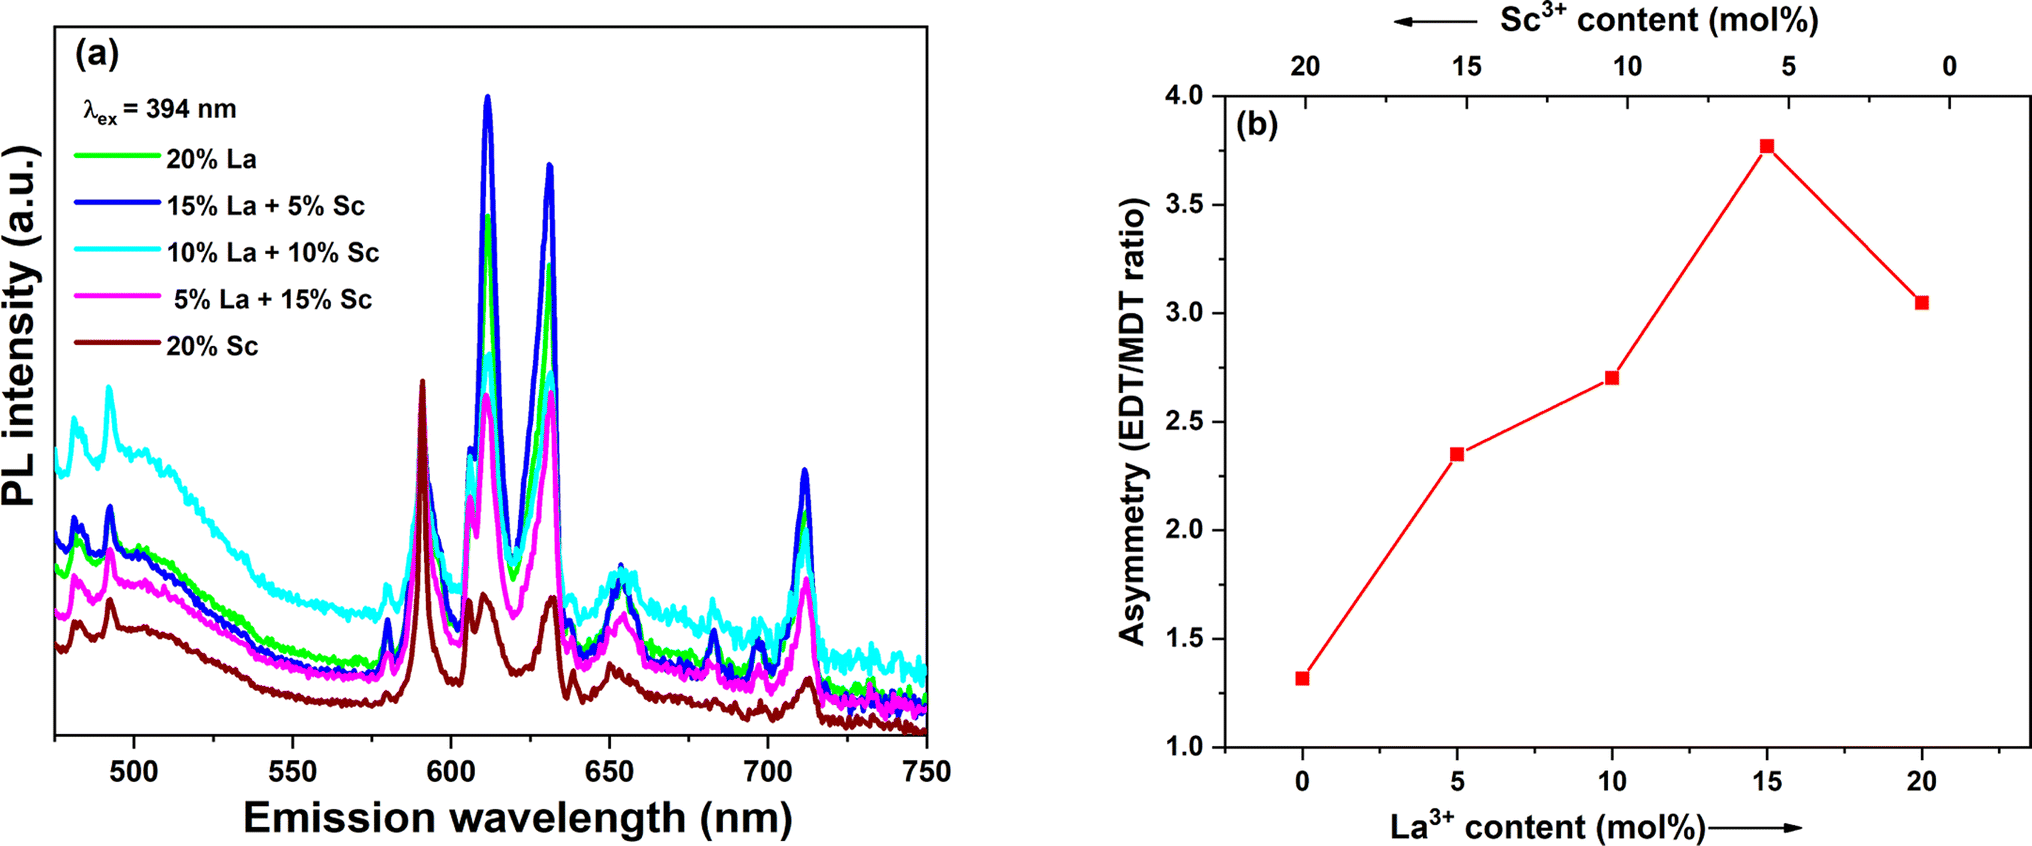 | ||
| Fig. 5 (a) Emission spectra with λex at 394 nm, and (b) asymmetry ratios calculated from Eu3+ emissions of the trivalent-ion-doped samples. | ||
3.6. Raman spectroscopy
Raman spectroscopy is another technique used to understand defects in trivalent-ion-doped samples. The Raman spectra of the doped samples are shown in Fig. 6a. Undoped ceria shows a single prominent peak at 469 cm−1 (denoted as P1), which can be attributed to the F2g symmetry mode in the CeO2 lattice arising due to the symmetric breathing mode of the oxygen atoms around Ce4+.42,43 Upon doping with Sc and La, the F2g band becomes broader and red-shifts (moves to a lower wavenumber) with an increase in the fraction dopant La. Similar broadening and shift in La-doped ceria with increasing doping levels has also been reported in earlier studies.44 The shift was observed to be higher in La- and Nd-doped samples compared with Eu- and Pr-doped ceria, though the size of Nd is less than Pr and more than Eu.19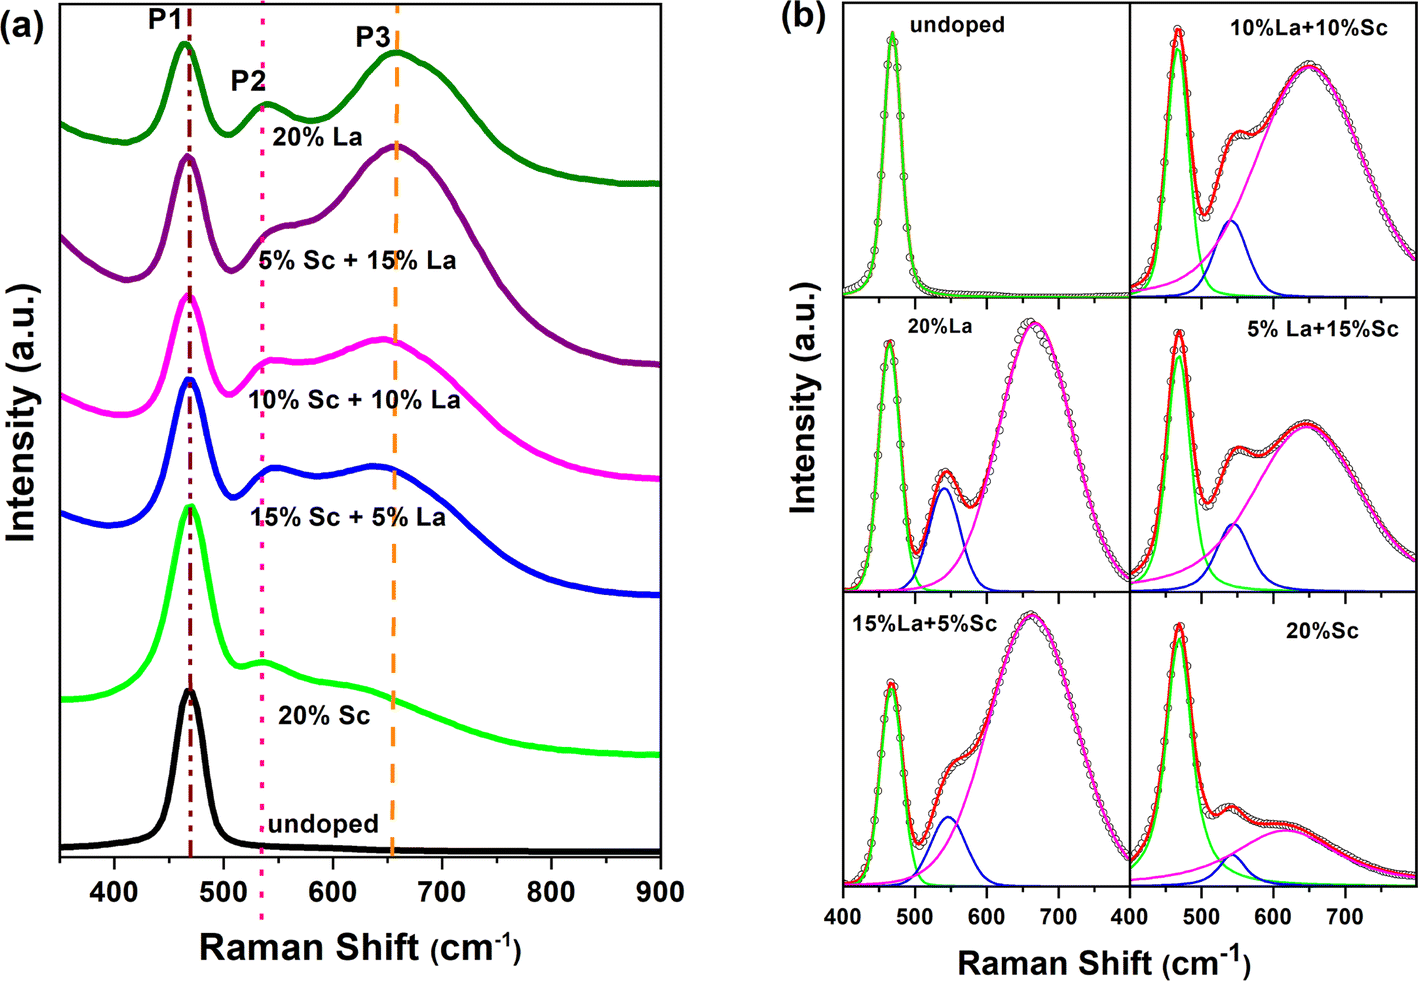 | ||
| Fig. 6 (a) Raman spectra and (b) deconvoluted Raman spectra of La- and Sc-doped CeO2. | ||
In addition to the broader F2g band, two other bands, one around 540–550 cm−1 and an even broader band around 625–675 cm−1, were also observed for all the samples. The defect bands at around 560 cm−1 (denoted as P2) were observed for all trivalent-ion-doped ceria but were absent in tetravalent-ion-doped ceria.45 The relative area under the peak at ∼560 cm−1 with respect to the F2g band intensity can be taken as the relative concentration of oxygen vacancies. The band beyond 600 cm−1 (denoted as P3) has been attributed to Ce3+ in the CeO2 lattice, and its relative area with respect to F2g can be used as the measure of Ce3+ in the doped samples.42 The same has also been attributed to the presence of dopant ions of different ionic radii and the distortions caused by them in the oxygen lattice positions.44,46 This peak was absent in undoped ceria though Ce3+ content is seen from XPS studies. This may mean that Ce3+ is less in the surface regions, where Raman is sensitive, or this peak is seen mainly due to distortions caused by the presence of ions of different ionic radii, as suggested by Chen et al.46 The Raman spectra demonstrating the shift in the region of 400–800 cm−1 have been deconvoluted and shown in Fig. 6b. The different parameters obtained from the deconvoluted spectra are shown in Fig. 7.
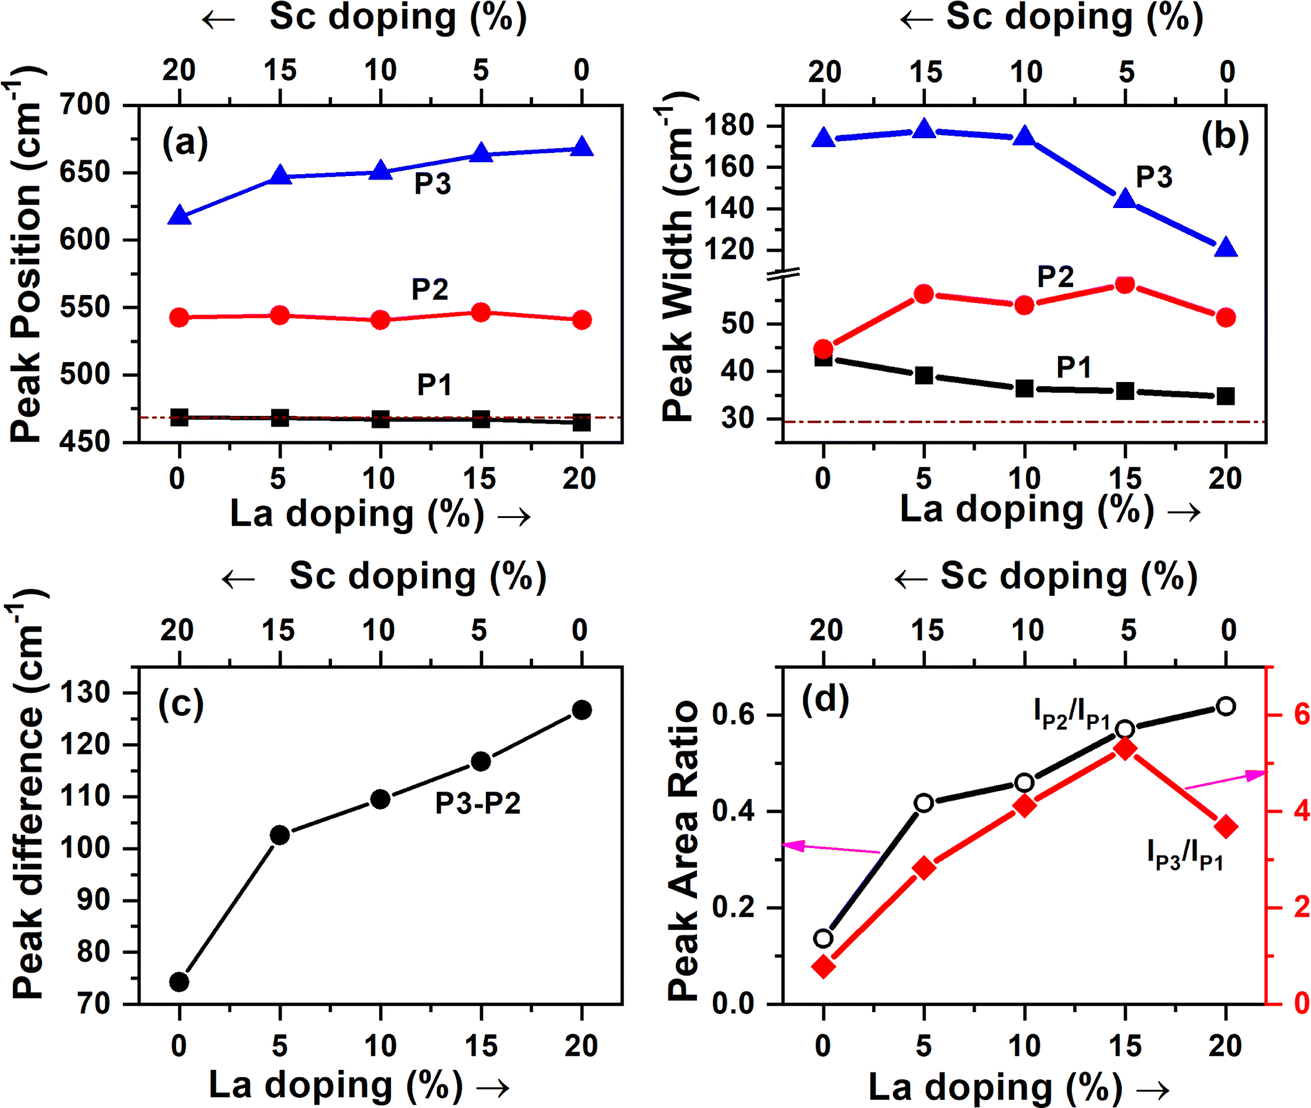 | ||
| Fig. 7 (a–d) Different parameters obtained from the deconvoluted Raman spectra shown in Fig. 6. The dotted lines in (a and b) correspond to the F2g peak in undoped ceria. | ||
It is seen from Fig. 7 that the position of the F2g peak is slightly redshifted with an increase in the La3+ dopant fraction besides peak broadening (Fig. 7a, P1), but the width lowers when the La3+ fraction is much higher (Fig. 7b, P1). The redshift of the F2g Raman peak is reported whenever the lattice constant of ceria increases with the doping of larger trivalent ions than Ce4+ (ref. 19 and 44) or under temperature and pressure.47 Lesser redshifts with smaller dopants are also reported by Pikalova et al. using various trivalent dopants.48 The lesser width of the F2g peak is attributed to better crystallinity and lower lattice strain in the samples, and the current data suggests that when the La3+ dopant fraction is higher, the strain is lower or crystallinity is better.49,50 The position of the peak of oxygen vacancy defect (P2) did not vary monotonically but was lower when an equal fraction of Sc3+ and La3+ was doped than individual doping. The width of this peak was higher, and the variation in width showed an opposite trend to that of F2g. The third band attributed to Ce3+-related vacancies was blue-shifted, and the width was reduced with an increase in La3+ dopant fraction; consequently, the difference in peak positions of P2 and P3 increased with increasing La3+ fraction. The ratios of the areas (intensities) under the defect peaks with respect to the F2g peak area are shown in Fig. 7d. The ratio of the peak corresponding to oxygen vacancies increased monotonically with the La3+ fraction. From the photoluminescence studies, which show a weak association of oxygen vacancies with La3+ and is also supported by theoretical studies in the literature, it can be concluded that in the samples with a higher Sc3+ fraction, the oxygen vacancies are associated with Sc and are distributed more in the bulk, while they are more on the surface when the La3+ fraction is high. The Ce3+ fraction (IP3/IP1) increased with the La fraction and reached the maximum in the 5% Sc + 15% La-doped sample but was found to be lower in the pure La-doped sample.
With an increase in the fraction of larger trivalent ions (La3+), the oxygen vacancies created are weakly associated with the dopant and aid Ce3+ formation. However, the ionic radius of Ce3+ is larger, and doping a larger trivalent ion may not favour reduction. The competing effects seem to have resulted in the higher concentration of Ce3+ in the sample codoped with La3+ and Sc3+, which have ionic radii that lie on either side of Ce4+. The positron annihilation lifetime spectroscopy, XPS, photoluminescence and Raman studies suggest that the mix and match of dopants with different ionic radii may be another option for tuning the oxygen vacancy concentration and distribution in ceria. It may also be noted that besides the changing relative fractions of the smaller and larger trivalent dopants, the concentration of the dopants is another factor that requires further attention.
3.7. Electrochemical studies
The linear sweep voltammograms of the catalyst-modified GC electrodes used for OER in a 1 M KOH medium are shown in Fig. 8a. From the figure, it is clear that all the doped ceria catalysts showed superior catalytic activity in terms of current density compared with undoped ceria. Out of these, the catalyst codoped with 15% Sc and 5% La showed the highest current density. The oxidation reaction overpotential, which arises from various factors like activation barrier, concentration polarisation and ohmic drop, was calculated for all the catalysts at 10 mA cm−2 current density with respect to the thermodynamic potential of 1.23 V. The calculated values are listed in Table 1, and it is evident that aliovalent doping successfully lowered the overpotential of the OER process. Similar to the trend of the current density, the catalyst with 15% Sc and 5% La loading also showed the lowest overpotential of 1144 mV. The spectroscopic studies discussed above reveal that the Ce3+ fraction at the surface was the highest in the 15% Sc + 5% La codoped catalyst along with a substantial surface oxygen vacancy concentration and stronger association of the vacancies with Sc. Hence, it can be predicted that the synergistic effect of these factors may subsequently tune the covalency of the metal–oxygen (Ce–O) bond and facilitate oxygen evolution through a lattice oxygen evolution mechanism (LOM).51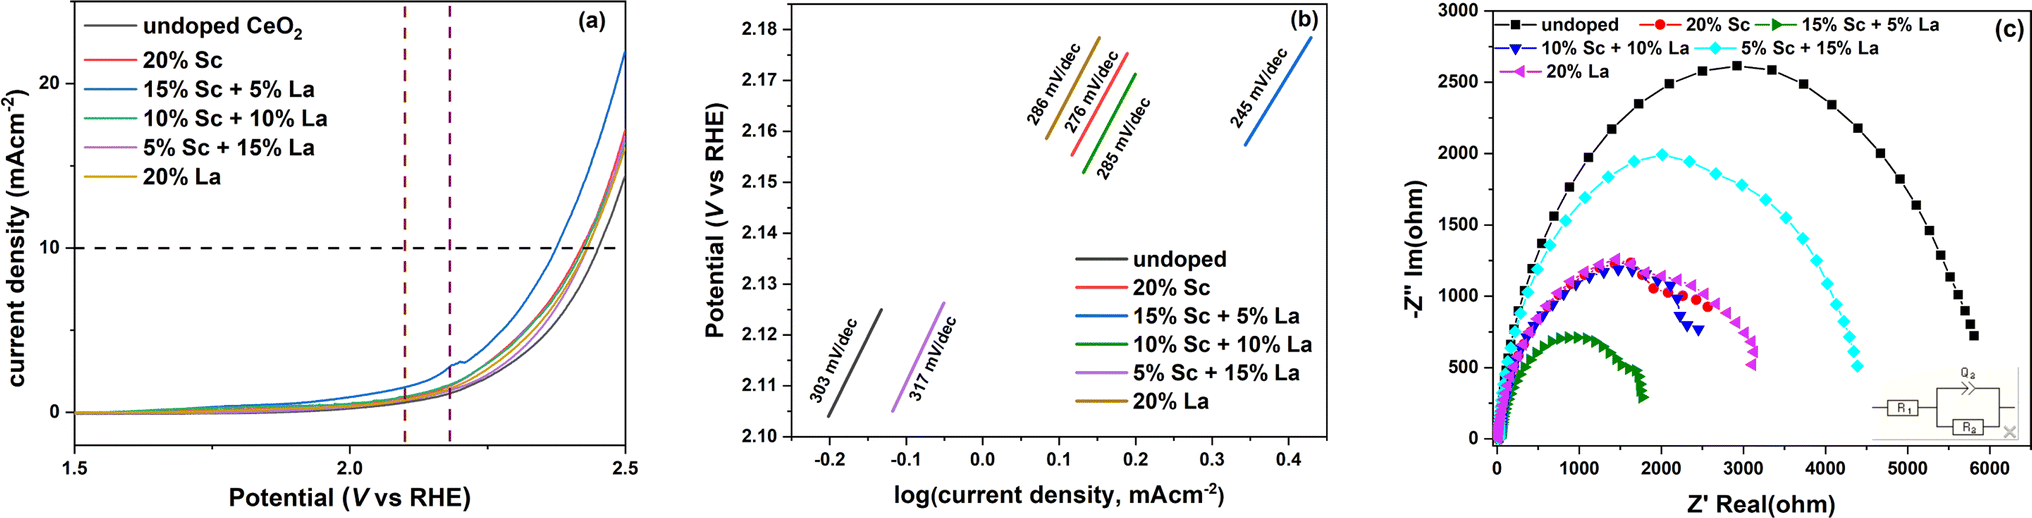 | ||
| Fig. 8 (a) Linear sweep voltammograms and (b) the corresponding Tafel plots (within the marked region) of the ceria catalysts for the OER in 1 M KOH solution. (c) Nyquist impedance plots of the various ceria catalysts for the OER. The inset figure shows the equivalent circuit used for fitting the impedance spectra. | ||
| Dopant (s) | Overpotential (mV) | Q1 (μF) | a1 | Rct (ohm) |
|---|---|---|---|---|
| Undoped CeO2 | 1220 | 3.01 | 0.88 | 6079 |
| 20% Sc | 1189 | 5.22 | 0.92 | 2342 |
| 15% Sc + 5% La | 1144 | 11.36 | 0.80 | 1930 |
| 10% Sc + 10% La | 1194 | 4.15 | 0.85 | 2912 |
| 5% Sc + 15% La | 1200 | 3.74 | 0.95 | 4318 |
| 20% La | 1199 | 5.48 | 0.93 | 2943 |
To further elucidate the crucial role of the aliovalent dopants on the kinetics and mechanism of the OER process, the Tafel plots of the catalysts were examined. The region selected for calculating the Tafel slope is marked by vertical lines in Fig. 8a based on the range of potential near the onset of the OER process. From the calculated values of Tafel slopes depicted in Fig. 8b, it is evident that the OER process is highly facile on the 15% Sc + 5% La codoped catalyst as it shows a substantially lower Tafel slope of 245 mV per decade than that of undoped ceria. The Tafel slope values are quite comparable to those reported in other aliovalent-ion-doped ceria catalysts.16 However, the catalyst codoped with 15% La and 5% Sc showed significantly slower kinetics with a relatively higher value of Tafel slope, which is contradictory to the response observed in terms of overpotential and current density. The possible reason for this anomaly is the presence of a greater number of larger defect traps, as reflected by the highest average defect density, as well as the preferential distribution of Ce3+ in the bulk, for this particular dopant composition.
To further gain insights into the charge transfer process, electrochemical impedance spectroscopy (EIS) was carried out, and the fitted Nyquist impedance plots are shown in Fig. 8c. The equivalent circuit used for analysing the spectra is shown in the inset, which is similar to the simplest Randles circuit, one of the most common equivalent circuits used for metal-oxide electrodes. In this circuit, R1 denotes Rsol, which refers to the resistance of the electrolyte, connectors, wires and leads between the reference and working electrodes. Q1 denotes a constant phase element, which signifies the double layer capacitance at the electrode–electrolyte interface here. R2 represents the faradaic electron transfer or charge transfer resistance towards the OER process.52 The equivalent circuit not only takes into account the changes occurring at the working electrode–electrolyte interface but also the contribution of the solution resistance between the reference and working electrodes and effectively represents our experimentally observed results. The value of Rsol was evaluated to be around 26 ohms, and the fitted values of Rct and double-layer capacitance are listed in Table 1. From Table 1, it is quite evident that the 15% Sc and 5% La-doped catalyst not only shows the best response in LSV and Tafel measurements but also exhibits an appreciably low resistance towards the charge transfer phenomenon during the oxidation process. This lowering of Rct can be attributed to the faster electron flow through the catalyst surface via hydroxyl ions.16 Interestingly, it may be further noted here that this particular codoped catalyst has the closest match of effective ionic radii between the dopants and the host. To further check the stability of the best-performing 15% Sc and 5% La codoped catalyst, a chronopotentiometric test was carried out, and the catalyst exhibited excellent stability, as depicted in Fig. S6 (ESI†).
Therefore, it can be summarised that effective ionic radius modulation using a combination of dopants can be a smart strategy to introduce optimum defects and tune the surface Ce3+ concentration, which altogether can influence and improve the catalytic activity of metal-oxide-based catalysts. Moreover, such tuning of the effective ionic radii via aliovalent doping of metals with higher conductivity can be further advantageous in this regard.38,53
4. Conclusions
Defect engineering via aliovalent doping was carried out in ceria catalysts to improve the electrocatalytic activity in water-splitting reactions. Effective ionic radii modulation was achieved by the incorporation of a smaller (Sc3+) and a larger dopant (La3+), and the ceria catalysts were also spiked with Eu3+ to utilize its emission features for understanding the association between defects and dopants. The catalysts were synthesized using a gel-combustion method, and doping was confirmed by XRD, Rietveld refinement and neutron activation analysis. The combined effect of defect evolution and Ce3+ content on the properties of the doped ceria catalysts were investigated by Positron Annihilation Lifetime Spectroscopy (PALS), X-ray Photoelectron Spectroscopy (XPS), Photoluminescence (PL) spectroscopy and Raman spectroscopy. Electrochemical studies were performed to explore their efficacy in catalysing OER in alkaline medium. These studies indicate that the catalyst with optimum defect density, the maximum Ce3+ fraction at the surface of the catalyst, and the least difference in effective ionic radii between the dopants and the host exhibited exceptional performance towards OER. These findings pave the way for designing efficient defect-engineered ceria catalysts based on the rational choice of co-dopants, cheap and effective synthesis strategy and defect concentration tuning.Conflicts of interest
There are no conflicts to declare.Acknowledgements
The authors are grateful to Dr H. S. S. Ramakrishna Matte and Dr Vijay Kumar, Centre for Nano and Soft Matter Sciences, Bangalore, for their kind support in the TEM measurements. The authors thank Dr J. A. Mondal, Radiation and Photochemistry Division, Bhabha Atomic Research Centre for his help in Raman spectroscopic measurements. The research reported is funded by Government of India through Bhabha Atomic Research Centre.References
- F. Liu and Z. Fan, Defect engineering of two-dimensional materials for advanced energy conversion and storage, Chem. Soc. Rev., 2023, 52, 1723–1772 RSC.
- C. Yang, Y. Lu, L. Zhang, Z. Kong, T. Yang, L. Tao, Y. Zou and S. Wang, Defect engineering on CeO2-based catalysts for heterogeneous catalytic applications, Small Struct., 2021, 2(12), 2100058 CrossRef CAS.
- C. Xie, D. Yan, H. Li, S. Du, W. Chen, Y. Wang, Y. Zou, R. Chen and S. Wang, Defect Chemistry in Heterogeneous Catalysis: Recognition, Understanding, and Utilization, ACS Catal., 2020, 10(19), 11082–11098 CrossRef CAS.
- K. Chang, H. Zhang, M.-j. Cheng and Q. Lu, Application of ceria in CO2 conversion catalysis, ACS Catal., 2019, 10(1), 613–631 CrossRef.
- B. Choudhury, P. Chetri and A. Choudhury, Oxygen defects and formation of Ce3+ affecting the photocatalytic performance of CeO2 nanoparticles, RSC Adv., 2014, 4(9), 4663–4671 RSC.
- N.-T. Suen, S.-F. Hung, Q. Quan, N. Zhang, Y.-J. Xu and H. M. Chen, Electrocatalysis for the oxygen evolution reaction: recent development and future perspectives, Chem. Soc. Rev., 2017, 46, 337–365 RSC.
- M. Tahir, L. Pan, F. Idrees, X. Zhang, L. Wang, J.-J. Zou and Z. L. Wang, Electrocatalytic oxygen evolution reaction for energy conversion and storage: A comprehensive review, Nano Energy, 2017, 37, 136–157 CrossRef CAS.
- B. You and Y. Sun, Innovative Strategies for Electrocatalytic Water Splitting, Acc. Chem. Res., 2018, 51(7), 1571–1580 CrossRef CAS PubMed.
- H. P. Dasari, K. Ahn, S.-Y. Park, H.-I. Ji, K. J. Yoon, B.-K. Kim, H.-J. Je, H.-W. Lee and J.-H. Lee, Hydrogen production from water-splitting reaction based on RE-doped ceria–zirconia solid-solutions, Int. J. Hydrogen Energy, 2013, 38, 6097–6103 CrossRef CAS.
- J. Yu, X. Du, H. Liu, C. Qiu, R. Yu, S. Li, J. Ren and S. Yang, Mini Review on Active Sites in Ce-Based Electrocatalysts for Alkaline Water Splitting, Energy Fuels, 2021, 35, 19000–19011 CrossRef CAS.
- S. Jiang, R. Zhang, H. Liu, Y. Rao, Y. Yu, S. Chen, Q. Yue, Y. Zhang and Y. Kang, Promoting Formation of Oxygen Vacancies in Two-Dimensional Cobalt-Doped Ceria Nanosheets for Efficient Hydrogen Evolution, J. Am. Chem. Soc., 2020, 142(14), 6461–6466 CrossRef CAS PubMed.
- H. Wang, M. Kottwitz, N. Rui, S. D. Senanayake, N. Marinkovic, Y. Li, R. G. Nuzzo and A. I. Frenkel, Aliovalent Doping of CeO2 Improves the Stability of Atomically Dispersed Pt, ACS Appl. Mater. Interfaces, 2021, 13(44), 52736–52742 CrossRef CAS PubMed.
- S. Kurajica, K. Mužina, G. Dražić, G. Matijašić, M. Duplančić, V. Mandić, M. Župančić and I. K. Munda, A comparative study of hydrothermally derived Mn, Fe, Co, Ni, Cu and Zn doped ceria nanocatalysts, Mater. Chem. Phys., 2020, 244, 122689 CrossRef CAS.
- A. L. Gal and S. p. Abanades, Dopant Incorporation in Ceria for Enhanced Water-Splitting Activity during Solar Thermochemical Hydrogen Generation, J. Phys. Chem. C, 2012, 116, 13516–13523 CrossRef.
- D. Arifin, A. Ambrosini, S. A. Wilson, B. Mandal, C. L. Muhich and A. W. Weimer, Investigation of Zr, Gd/Zr, and Pr/Zr – doped ceria for the redox splitting of water, Int. J. Hydrogen Energy, 2020, 45, 160–174 CrossRef CAS.
- S. Mathew, E. Hosseinirad, K. C. Kim, W. S. Chung and O. L. Li, Young-Rae Cho, Enhanced electrocatalytic water splitting by Sm and Gd-doped ceria electrocatalysts on Ni foam substrate, Electrochim. Acta, 2022, 435, 141382 CrossRef CAS.
- D. Das, J. Prakash, U. K. Goutam, S. Manna, S. K. Gupta and K. Sudarshan, Oxygen vacancy and valence engineering in CeO2 through distinct sized ion doping and their impact on oxygen reduction reaction catalysis, Dalton Trans., 2022, 51(48), 18572–18582 RSC.
- K.-J. Noh, K. Kim, H. J. Kim, D. Shin and J. W. Han, Improved CO Oxidation via Surface Stabilization of Ceria Nanoparticles Induced by Rare-Earth Metal Dopants, ACS Appl. Nano Mater., 2019, 2(10), 6473–6481 CrossRef CAS.
- G. Vinothkumar, S. Rengaraj, P. Arunkumar, S. W. Cha and K. S. Babu, Ionic radii and concentration dependency of RE3+ (Eu3+, Nd3+, Pr3+, and La3+)- doped cerium oxide nanoparticles for enhanced multienzyme-mimetic and hydroxyl radical scavenging activity, J. Phys. Chem. C, 2018, 123(1), 541–553 CrossRef.
- N. Yang, P. Orgiani, E. D. Bartolomeo, V. Foglietti, P. Torelli, A. V. Ievlev, G. Rossi, S. Licoccia, G. Balestrino and S. V. Kalinin, Effects of dopant ionic radius on cerium reduction in epitaxial cerium oxide thin films, J. Phys. Chem. C, 2017, 121(16), 8841–8849 CrossRef CAS.
- A. K. Raj, P. P. Rao, T. Sreena and T. A. Thara, Influence of local structure on photoluminescence properties of Eu3+ doped CeO2 red phosphors through induced oxygen vacancies by contrasting rare earth substitutions, Phys. Chem. Chem. Phys., 2017, 19(30), 20110–20120 RSC.
- J. Ke, J.-W. Xiao, W. Zhu, H. Liu, R. Si, Y.-W. Zhang and C.-H. Yan, Dopant-induced modification of active site structure and surface bonding mode for high-performance nanocatalysts: CO oxidation on capping-free (110)-oriented CeO2: Ln (Ln= La–Lu) nanowires, J. Am. Chem. Soc., 2013, 135(40), 15191–15200 CrossRef CAS PubMed.
- W. Lee, S.-Y. Chen, E. Tseng, A. Gloter and C.-L. Chen, Study of defect structure in ferromagnetic nanocrystalline CeO2: effect of ionic radius, J. Phys. Chem. C, 2016, 120(27), 14874–14882 CrossRef CAS.
- D. Das, S. K. Gupta, M. Mohapatra and K. Sudarshan, Defect engineering in trivalent ion doped ceria through vanadium assisted charge compensation: insight using photoluminescence, positron annihilation and electron spin resonance spectroscopy, Dalton Trans., 2021, 50, 17378–17389 RSC.
- Y. Rana, A. Mishra, T. Singh, P. Varde, S. Bhattacharya, S. Samanta, R. Kumar, A. K. Mallick, K. Deo and U. Kannan, Thermal neutron flux measurements in self-serve and tray rod facilities of Dhruva reactor, Life Cycle Reliability and Safety Engineering, 2017, 6, 149–166 CrossRef.
- J. V. Olsen, P. Kirkegaard, N. J. Pedersen and M. Eldrup, PALSfit: a new program for the evaluation of positron lifetime spectra, Phys. Status Solidi C, 2007, 4, 4004–4006 CrossRef CAS.
- Jagannath, U. K. Goutam, R. K. Sharma, J. Singh, K. Dutta, U. S. Sule, R. Pradeep and S. C. Gadkari, HAXPES beamline PES-BL14 at the Indus-2 synchrotron radiation source, J. Synchrotron Radiat., 2018, 25, 1541–1547 CrossRef CAS PubMed.
- N. Ghosh, S. Roy, M. Ahmed and J. A. Mondal, Water in the hydration shell of cryoprotectants and their non-cryoprotecting structural analogues as observed by Raman-MCR spectroscopy, J. Mol. Liq., 2018, 266, 118–121 CrossRef CAS.
- EC-Lab, Version 10.40, Biologic Science Instruments Search PubMed.
- B. Barbiellini and J. Kuriplach, Proposed parameter-free model for interpreting the measured positron annihilation spectra of materials using a generalized gradient approximation, Phys. Rev. Lett., 2015, 114, 147401 CrossRef PubMed.
- K. Sudarshan, V. Tiwari, P. Utpalla and S. K. Gupta, Defect evolution in Eu3+, Nb5+ doped and co-doped CeO2: X-ray diffraction, positron annihilation lifetime and photoluminescence studies, Inorg. Chem. Front., 2019, 6, 2167 RSC.
- A. Pandiyan, A. Uthayakumar, C. Lim, V. Ganesan, W. Yu, A. Das, S. Lee, M. N. Tsampas, S. Omar and J. W. Han, Validation of defect association energy on modulating oxygen ionic conductivity in low temperature solid oxide fuel cell, J. Power Sources, 2020, 480, 229106 CrossRef CAS.
- M. Nakayama and M. Martin, First-principles study on defect chemistry and migration of oxide ions in ceria doped with rare-earth cations, Phys. Chem. Chem. Phys., 2009, 11(17), 3241–3249 RSC.
- T. Hasegawa, S. M. F. Shahed, Y. Sainoo, A. Beniya, N. Isomura, Y. Watanabe and T. Komeda, Epitaxial growth of CeO2 (111) film on Ru (0001): Scanning tunnelling microscopy (STM) and x-ray photoemission spectroscopy (XPS) study, J. Chem. Phys., 2014, 140, 044711 CrossRef PubMed.
- G. Vinothkumar, A. I. Lalitha and K. S. Babu, Cerium phosphate–cerium oxide heterogeneous composite Nanozymes with enhanced peroxidase-like biomimetic activity for glucose and hydrogen peroxide sensing, Inorg. Chem., 2018, 58, 349–358 CrossRef PubMed.
- C. Barth, C. Laffon, R. Olbrich, A. Ranguis, Ph. Parent and M. Reichling, A perfectly stoichiometric and flat CeO2 (111) surface on a bulk-like ceria film, Sci. Rep., 2016, 6, 21165 CrossRef CAS PubMed.
- S. Jiang, R. Zhang, H. Liu, Y. Rao, Y. Yu, S. Chen, Q. Yue, Y. Zhang and Y. Kang, Promoting Formation of Oxygen Vacancies in Two-Dimensional Cobalt-Doped Ceria Nanosheets for Efficient Hydrogen Evolution, J. Am. Chem. Soc., 2020, 142(14), 6461–6466 CrossRef CAS PubMed.
- K. Nie, Y. Yuan, X. Qu, B. Li, Y. Zhang, L. Yi, X. Chen and Z. Liu, Ultrathin heteroatom-doped CeO2 nanosheet assemblies for durable oxygen evolution: Oxygen vacancy engineering to trigger deprotonation, J. Colloid Interface Sci., 2024, 656, 168–176 CrossRef CAS PubMed.
- L. Li, H. K. Yang, B. K. Moon, Z. Fu, C. Guo, J. H. Jeong, S. S. Yi, K. Jang and H. S. Lee, Photoluminescence Properties of CeO2:Eu3+ Nanoparticles Synthesized by a Sol-Gel Method, J. Phys. Chem. C, 2009, 113(2), 610–617 CrossRef CAS.
- A. Sharma, M. Varshney, J. Park, T. K. Ha, K. H. Chae and H. J. Shin, Bifunctional Ce1−x EuxO2 (0 ≤ x ≤ 0.3) nanoparticles for photoluminescence and photocatalyst applications: an X-ray absorption spectroscopy study, Phys. Chem. Chem. Phys., 2015, 17(44), 30065–30075 RSC.
- M. Nolan, Charge compensation and Ce3+ formation in trivalent doping of the CeO2 (110) surface: the key role of dopant ionic radius, J. Phys. Chem. C, 2011, 115(14), 6671–6681 CrossRef CAS.
- S. Li, X. Lu, S. Shi, L. Chen, Z. Wang and Y. Zhao, Europium-doped ceria nanowires as anode for solid oxide fuel cells, Front. Chem., 2020, 8, 348 CrossRef CAS PubMed.
- V. V. Pushkarev, V. I. Kovalchuk and J. L. d'Itri, Probing Defect Sites on the CeO2 Surface with Dioxygen, J. Phys. Chem. B, 2004, 108(17), 5341–5348 CrossRef CAS.
- D. Avram, M. Sanchez-Dominguez, B. Cojocaru, M. Florea, V. Parvulescu and C. Tiseanu, Toward a unified description of luminescence–local structure correlation in Ln doped CeO2 nanoparticles: roles of Ln ionic radius, Ln concentration, and oxygen vacancies, J. Phys. Chem. C, 2015, 119(28), 16303–16313 CrossRef CAS.
- P. Cop, R. Maile, Y. Sun, O. Khalid, I. Djerdj, P. Esch, S. Heiles, H. Over and B. M. Smarsly, Impact of Aliovalent/Isovalent Ions (Gd, Zr, Pr, and Tb) on the Catalytic Stability of Mesoporous Ceria in the HCl Oxidation Reaction, ACS Appl. Nano Mater., 2020, 3(8), 7406–7419 CrossRef CAS.
- L. Li, F. Chen, J.-Q. Lu and M.-F. Luo, Study of defect sites in Ce1–xMxO2−δ(x= 0.2) solid solutions using Raman spectroscopy, J. Phys. Chem. B, 2011, 115(27), 7972–7977 CrossRef CAS PubMed.
- H. Li, P. Zhang, G. Li, J. Lu, Q. Wu and Y. Gu, Stress measurement for nonstoichiometric ceria films based on Raman spectroscopy, J. Alloys Compd., 2016, 682, 132–137 CrossRef CAS.
- E. Y. Pikalova, A. Murashkina, V. Maragou, A. Demin, V. Strekalovsky and P. Tsiakaras, CeO2 based materials doped with lanthanides for applications in intermediate temperature electrochemical devices, Int. J. Hydrogen Energy, 2011, 36(10), 6175–6183 CrossRef CAS.
- Z. V. Popović, Z. Dohčević-Mitrović, A. Cros and A. Cantarero, Raman scattering study of the anharmonic effects in CeO2−y nanocrystals, J. Phys.: Condens. Matter, 2007, 19(49), 496209 CrossRef.
- S. Loridant, Raman spectroscopy as a powerful tool to characterize ceria-based catalysts, Catal. Today, 2021, 373, 98–111 CrossRef CAS.
- X. Xie, L. Du, L. Yan, S. Park, Y. Qiu, J. Sokolowski, W. Wang and Y. Shao, Oxygen Evolution Reaction in Alkaline Environment: Material Challenges and Solutions, Adv. Funct. Mater., 2022, 32, 2110036 CrossRef CAS.
- A. R. C. Bredar, A. L. Chown, A. R. Burton and B. H. Farnum, Electrochemical Impedance Spectroscopy of Metal Oxide Electrodes for Energy Applications, ACS Appl. Energy Mater., 2020, 3(1), 66–98 CrossRef CAS.
- K. Nie, X. Qu, D. Gao, B. Li, Y. Yuan, Q. Liu, X. Li, S. Chong and Z. Liu, Engineering Phase Stability of Semimetallic MoS2 Monolayers for Sustainable Electrocatalytic Hydrogen Production, ACS Appl. Mater. Interfaces, 2022, 14(17), 19847–19856 CrossRef CAS PubMed.
Footnote |
| † Electronic supplementary information (ESI) available. See DOI: https://doi.org/10.1039/d4ra03360d |
| This journal is © The Royal Society of Chemistry 2024 |