DOI:
10.1039/D4RA03287J
(Paper)
RSC Adv., 2024,
14, 20093-20104
Inner-filter effect of nitrogen-doped carbon quantum dots–MnO2 nanotubes for smartphone-integrated dual-mode sensing of glutathione and captopril†
Received
4th May 2024
, Accepted 15th June 2024
First published on 24th June 2024
Abstract
Nitrogen-doped carbon quantum dots (N-CQDs) exhibit unique fluorescence properties and are considered one of the best candidates for the development of fluorescence-based sensors for the detection of many analytes. In this work, a smartphone-assisted fluorescent sensor has been developed using N-CQDs and MnO2 nanotubes (MnO2 NTs) for the detection of glutathione (GSH) and captopril (CAP). N-CQDs were facilely synthesized via the solvothermal method, where o-phenylenediamine (o-PD) and urea were used as nitrogen precursors. Likewise, MnO2 NTs were synthesized using the hydrothermal method. Relying on the excellent fluorescence quenching ability of MnO2 NTs, a nanocomposite of N-CQDs and MnO2 NTs is prepared, wherein the fluorescence intensity of N-CQDs was effectively quenched in the presence of MnO2 NTs via the inner-filter effect (IFE). The addition of thiolated compounds (GSH and CAP) helped in the recovery of the fluorescence of N-CQDs by triggering the redox reaction and decomposing the MnO2 NTs. An investigation of fluorescence along with smartphone-based studies by evaluating the gray measurement using Image J software showed a great response towards GSH and CAP providing LODs of 4.70 μM and 5.22 μM (fluorometrically) and 5.76 μM and 2.81 μM (smartphone-based), respectively. The practical applicability of the sensing system has been verified using human blood plasma samples.
1 Introduction
After their discovery, carbon quantum dots (CQDs) have massively gained attention and been studied by researchers. In contrast to conventional semiconductor quantum dots, they are easy to synthesize using low-cost precursors. Their synthesis also includes some green and environmental friendly approaches.1,2 In addition to this, they possess many properties like good photostability,3 high quantum yield,4 water solubility,5 low toxicity,6 good biocompatibility.7 Enhancement of the photoluminescence of the CQDs is assisted by nitrogen doping. The decision to choose nitrogen as a dopant over other heteroatoms (phosphorus, sulphur, nitrogen-phosphorus co-doped, nitrogen-sulphur co-doped)8–11 in the core of the carbon quantum dot is that it offers a suitable atomic size for doping into the carbon framework and the electronegativity assists in the favourable interaction with carbon atoms and the accessible lone pair of electrons of the nitrogen atom enhances the electronic properties.12 Functional groups such as the amino group act as reactive sites for controlled nucleation and growth of carbon dots.13 Nitrogen atoms participating in the cyclic core of carbon dots also influence their PL properties. For instance, the pyrrolic N can alone participate in protonation and enhance the fluorescence.14 Moreover, pyridinic N leads to an increase in the cyclic imines which enhance the conjugated system and improve the PL intensity.15 It is the only N atom capable of transferring protons to the conjugated system because its lone pair electrons can pair with protons. This proton transfer benefits radiative recombination.16 The graphitic N alters the electronic energy level which corresponds to optical transitions.17 It aids in surface functionalization as well as in improving quantum yield.18 Many electro-photochemical applications of CQDs such as light-driven water splitting and electrocatalytic oxygen reduction reactions are also enhanced by nitrogen doping.19
Fluorescence measurements have been widely accepted for sensing applications. Many sensing is based on fluorescence quenching mechanisms such as static quenching effect (SQE), dynamic quenching effect (DQE), photo-induced electron transfer (PET), Förster resonance energy transfer (FRET), surface energy transfer (SET) and intramolecular charge transfer (ICT).20,21 In fluorescence spectrometry, IFE (inner filter effect) is an important non-irradiation energy conversion process used for sensing purposes. It occurs from the absorption of excitation and/or emission light by the absorber in the detection system. IFE decreases the fluorescence intensity due to light absorption. Generally, in IFE-based sensors, the fluorescence of fluorescent material is reduced in the presence of an absorber which is then enhanced by the analyte along with chemical reactions such as redox reactions, complexation etc.
There have been some reports on fluorescence-based sensors for the detection of glutathione and captopril. Hormozi-Nezhad et al. developed fluorescein isothiocyanate and gold nanoparticle as fluorescence resonance energy transfer (FRET) pair for detection of captopril.22 However, photobleaching and its great reactivity towards nitrogen-containing nucleophiles are major concern of the applicability of fluorescent dyes.23,24 Xiao et al. designed molybdenum oxide quantum dots as a fluorescence turn off-sensor for detection of captopril.25 Nevertheless, the applicability of sensor has not been tested using human blood plasma samples. Similarly, Tang et al. investigated molybdenum sulfide quantum dot and MnO2 nanosheet inner-filter effect pair for detection of glutathione.26 However, low quantum yield and blue emissive quantum dots limits the usefulness of this sensor. Wong et al. integrated gold nanoclusters, folic acid and reduced graphene oxide for development of fluorescence turn-off sensor for the detection of glutathione.27 Compared to these fluorescent sensors, N-CQDs are non-toxic, easy to synthesize, biocompatible, cost-effective and eco-friendly.
Carbon quantum dots are paired with MnO2 nanostructures for fluorometric sensing because MnO2 has excellent electron transfer characteristics, strong oxidation ability, and good catalytic activity. Its broad absorption band between 200–700 nm ensures strong fluorescence quenching ability.28,29 In our work, IFE-based sensing system is developed and applied for the detection of glutathione (GSH) and captopril (CAP). To the best of our knowledge, no work has been reported utilizing the same nanostructure materials as an IFE pair for the detection of GSH and CAP, claiming this work's novelty in the field of sensing. The fluorescence intensity of N-CQDs is effectively quenched in the presence of MnO2 NTs. The energy transfer that occurred from IFE enables the ‘turn-off’ mechanism of the probe. On addition of thiolated compounds like GSH and CAP, Mn4+ is reduced to Mn2+ eliminating it from the sensing system which leads to FL recovery of N-CQDs.
In continuing the interest of developing our probe, a strategy for visual determination of the quenched and recovered FL intensity of N-CQDs in the presence of quencher and thiolated compounds has also been studied through smartphone-based sensing along with fluorometric analysis. This approach makes the present study a dual-mode sensing strategy for GSH and CAP. In the essence of developing a portable platform for detection purposes, the images of the gradual decrease and recovery of FL intensity of N-CQDs were captured using a smartphone which were later analysed using the Image J software (Scheme 1). It is noteworthy to mention that our probe produced good and promising results in both modes of sensing.
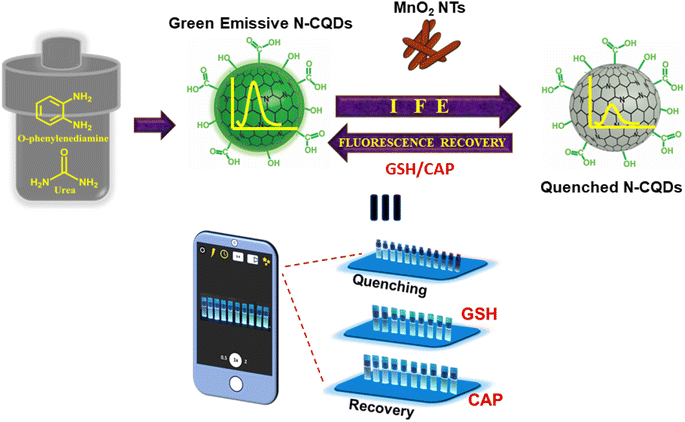 |
| | Scheme 1 Schematic representation of detection of glutathione and captopril. | |
2 Experimental
2.1 Reagents and instruments
Ortho-phenylenediamine (o-PD), urea, N,N-Dimethylformamide (DMF), tris(hydroxymethyl) aminomethane, potassium permanganate (KMnO4), glutathione (GSH) and captopril (CAP) were purchased from Sigma-Aldrich Corporation. Millipore water was used for the preparation of all standard solutions. The UV absorption spectra were recorded using Thermo Scientific 300-Evolution UV-Visible spectrophotometer. The fluorescence spectra were recorded by Varian Eclipse fluorescence spectrophotometer (G9800AA). SEM images were obtained from ZEISS EVO 18 with accelerating voltage of 30 kV. TEM images were recorded using Philips CM 200 with an operating voltage of 200 kV. FTIR analysis was made using Bruker Alpha model FTIR spectrometer accompanying KBr palettes. The fluorescence lifetime was measured by DeltaFlex TCSPC Lifetime Fluorimeter comprising the Mai Tai laser source and PPD detection module. The sample was excited at 420 nm for the FL measurements. The XPS analysis was computed using Physical Electronics PHI 5000 VersaProbe III.
2.2 Synthesis of nitrogen-doped carbon quantum dots (N-CQDs)
N-CQDs were synthesized using the hydrothermal method. Typically, 0.1 g o-PD and 0.05 g urea were dissolved in 25 mL DMF by stirring for 20 min. The prepared solution was transferred into the teflon-coated autoclave and heated at 180 °C for 24 h. The obtained solution was cooled at room temperature and dialysed against DMF for 12 h.
2.3 Measurement of quantum yield (QY)
The QY of N-CQDs in DMF was calculated according to the previously reported method using quinine sulfate as the standard material (reference) and the following equation (eqn (1))30| | |
ϕu = ϕs(Yu/Ys) (As/Au) (ηs/ηu)2
| (1) |
where ϕ, Y, A, and η are quantum yield, integrated emission intensity, absorbance and refractive index, respectively. The subscript “u” and “s” refer to the N-CQDs (dissolved in DMF, ηu = 1.43) and the reference of known quantum yield (quinine sulphate dissolved in 0.1 M H2SO4 solution, ϕs = 54%, ηs = 1.33). The calculated QY of N-CQDs was 43.20%.
2.4 Synthesis of MnO2 nanotubes and preparation of N-CQDs–MnO2 nanocomposites
The MnO2 NTs were synthesized using the hydrothermal method. Firstly, 1.052 g KMnO4 was dissolved in 120 mL millipore water and stirred for 30 min. Concentrated HCl (4 mL) was added to the vigorously stirring solution dropwise. The obtained solution was hydrothermally treated at 140 °C for 16 h. The obtained black precipitate was centrifuged and washed with Millipore water to remove impurities and finally dried at 60 °C for 6 h. The dried product is crushed using a mortar and pestle. About 10 mg of obtained MnO2 NTs is dispersed in 25 mL Millipore water using a sonicator for 20 min at room temperature. The nanocomposite was prepared by diluting N-CQDs (700 μL) and MnO2 NTs (440 μg, 1000 μL) using Tris buffer in a 3 mL sample holder.
2.5 Fluorescence sensing of glutathione
Typically, a stock solution of glutathione is prepared using millipore water. Various concentrations of glutathione (3.3–23.3 μM) were taken from the stock solution and added to N-CQDs–MnO2 nanocomposite in Tris buffer (0.01 M) of pH 7.4. The fluorescence spectra were recorded at 420 nm excitation wavelength after shaking the solutions for 5 min at room temperature.
2.6 Fluorescence sensing of captopril
Firstly, the stock solution of captopril was prepared using millipore water. Then, various concentrations of captopril (3.3–30 μM) were added to the N-CQDs–MnO2 nanocomposite with Tris buffer (0.01 M) at pH 7.4. The fluorescence spectra were recorded at 420 nm excitation at room temperature.
2.7 Arrangements for smartphone sensing platform
The same samples prepared for the fluorescence sensing were transferred to clean glass vials and placed on the UV Transilluminator. Photographs of the same were taken using an android smartphone and the gray measurement of the intensity of fluorescence observed from the samples was calculated using Image J software.
3 Results and discussion
3.1 Characterization of the N-CQDs
The as-synthesized N-CQDs showed UV-Visible peaks (Fig. 1(A)) at 274 nm which is attributed to π–π* transition of C![[double bond, length as m-dash]](https://www.rsc.org/images/entities/char_e001.gif) C of sp2 carbon network.31 The sp2 hybridized carbon atoms are believed to be either bonded with neighbouring carbon atoms or oxygen atoms directing the formation of carboxyl and carbonyl groups, which mostly decorate the surface of N-CQDs.32 The presence of these groups is confirmed by spectroscopic techniques such as FTIR and XPS.33 Another shoulder peak at 426 nm is attributed to n–π* transitions of C
C of sp2 carbon network.31 The sp2 hybridized carbon atoms are believed to be either bonded with neighbouring carbon atoms or oxygen atoms directing the formation of carboxyl and carbonyl groups, which mostly decorate the surface of N-CQDs.32 The presence of these groups is confirmed by spectroscopic techniques such as FTIR and XPS.33 Another shoulder peak at 426 nm is attributed to n–π* transitions of C![[double bond, length as m-dash]](https://www.rsc.org/images/entities/char_e001.gif) O/–C
O/–C![[double bond, length as m-dash]](https://www.rsc.org/images/entities/char_e001.gif) N and NH2 group.34 These peaks reveal that the usage of urea is responsible for the generation of nitrogen-rich functional groups and providing green emissions.35 A slight excitation-dependent behaviour of FL spectra of green N-CQDs is observed in the excitation wavelength ranges from 390–470 nm with maximum emission at 520 nm (Fig. 1(B)). The excitation wavelength for maximum emission was 420 nm (Fig. S1†). Surface passivation plays an important role in the FL emission of N-CQDs. If the surface is completely passivated then emission occurs only due to π–π* radiative transition of sp2 carbon. This single transition process leads to excitation independent emission.36 But as observed in Fig. 1(B), the little dependency of emission on the excitation wavelength is due to the availability of the surface traps at different energies, arising from non-uniform structures.37 Additionally, the calculated QY was 43.20% which might be due to the effective doping of nitrogen. The extent of doping can also be confirmed from the X-ray Photon Spectroscopy which showed 4.83% of nitrogen content in as-synthesized N-CQDs.
N and NH2 group.34 These peaks reveal that the usage of urea is responsible for the generation of nitrogen-rich functional groups and providing green emissions.35 A slight excitation-dependent behaviour of FL spectra of green N-CQDs is observed in the excitation wavelength ranges from 390–470 nm with maximum emission at 520 nm (Fig. 1(B)). The excitation wavelength for maximum emission was 420 nm (Fig. S1†). Surface passivation plays an important role in the FL emission of N-CQDs. If the surface is completely passivated then emission occurs only due to π–π* radiative transition of sp2 carbon. This single transition process leads to excitation independent emission.36 But as observed in Fig. 1(B), the little dependency of emission on the excitation wavelength is due to the availability of the surface traps at different energies, arising from non-uniform structures.37 Additionally, the calculated QY was 43.20% which might be due to the effective doping of nitrogen. The extent of doping can also be confirmed from the X-ray Photon Spectroscopy which showed 4.83% of nitrogen content in as-synthesized N-CQDs.
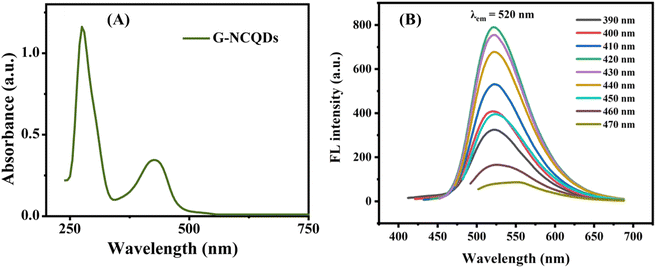 |
| | Fig. 1 (A) UV-Vis absorption spectrum and (B) fluorescence spectra at various excitation wavelengths of N-CQD. | |
The HR-TEM analysis of N-CQDs reveals that N-CQDs are predominately spherical, monodispersed and uniform in size (Fig. 2(A) and (B)). The average diameter of N-CQDs is 3.4 nm. The lattice fringes distance was calculated using a fast Fourier transform (FFT) and spacing was found to be 0.27 nm. This spacing corresponds to the [020] graphitic plane (Fig. 2(C)).38 Being close to the pure graphitic plane value, it can be concluded that there is an alteration due to the doping of nitrogen which disordered the lattice.18,39 The FTIR analysis shows the decoration of nitrogen and oxygen-containing groups on the surface of N-CQDs (Fig. 3(A). The presence of N–H stretching vibration (3359 cm−1), C![[double bond, length as m-dash]](https://www.rsc.org/images/entities/char_e001.gif) N stretching vibration (1517 cm−1), N–H/C–H bending vibration (670 cm−1), N–H bending vibration (due to the presence of primary amine, 1652 cm−1), C–N–C asymmetric stretching due to secondary amine (1360 cm−1), C–O–C stretching vibration (1200 cm−1), shows the efficient existence of nitrogen and oxygen atoms into the carbonous framework of CQDs.40,41 The presence of O–H stretching vibration (3680 cm−1) and N–H stretching vibration (3359 cm−1) shows the hydrophilic nature of N-CQDs.42 The XPS spectra show the composition of C, N and O atoms in the lattice of N-CQDs. The typical peaks at 285 eV, 400 eV, and 530 eV correspond to the C 1s, N 1s and O 1s respectively (Fig. 3(B)). Deconvolution of C 1s shows four peaks of C–C/C
N stretching vibration (1517 cm−1), N–H/C–H bending vibration (670 cm−1), N–H bending vibration (due to the presence of primary amine, 1652 cm−1), C–N–C asymmetric stretching due to secondary amine (1360 cm−1), C–O–C stretching vibration (1200 cm−1), shows the efficient existence of nitrogen and oxygen atoms into the carbonous framework of CQDs.40,41 The presence of O–H stretching vibration (3680 cm−1) and N–H stretching vibration (3359 cm−1) shows the hydrophilic nature of N-CQDs.42 The XPS spectra show the composition of C, N and O atoms in the lattice of N-CQDs. The typical peaks at 285 eV, 400 eV, and 530 eV correspond to the C 1s, N 1s and O 1s respectively (Fig. 3(B)). Deconvolution of C 1s shows four peaks of C–C/C![[double bond, length as m-dash]](https://www.rsc.org/images/entities/char_e001.gif) C at 284.8 eV, C–N at 285.9 eV, C–O at 286.7 eV and C
C at 284.8 eV, C–N at 285.9 eV, C–O at 286.7 eV and C![[double bond, length as m-dash]](https://www.rsc.org/images/entities/char_e001.gif) O at 288.6 eV (Fig. S2(A)†).43 Similarly, the deconvolution of N 1s shows three major peaks of pyridinic N at 398.9 eV, pyrrolic N at 400.5 eV, and quaternary N at 403.2 eV ((Fig. S2(B)†).44 The deconvolution of O1s corresponds to C
O at 288.6 eV (Fig. S2(A)†).43 Similarly, the deconvolution of N 1s shows three major peaks of pyridinic N at 398.9 eV, pyrrolic N at 400.5 eV, and quaternary N at 403.2 eV ((Fig. S2(B)†).44 The deconvolution of O1s corresponds to C![[double bond, length as m-dash]](https://www.rsc.org/images/entities/char_e001.gif) O bond at 532.5 eV (Fig. S2(C)†).45 The survey of XPS reveals that 36.88% C, 4.83% N and 58.29% O are present in N-CQDs. In general, FTIR and XPS analyses hold an agreement in terms of the types of bonds obtained. Both techniques assured the presence of nitrogen doping along with oxygen-containing moieties embedded in the synthesized N-CQDs.
O bond at 532.5 eV (Fig. S2(C)†).45 The survey of XPS reveals that 36.88% C, 4.83% N and 58.29% O are present in N-CQDs. In general, FTIR and XPS analyses hold an agreement in terms of the types of bonds obtained. Both techniques assured the presence of nitrogen doping along with oxygen-containing moieties embedded in the synthesized N-CQDs.
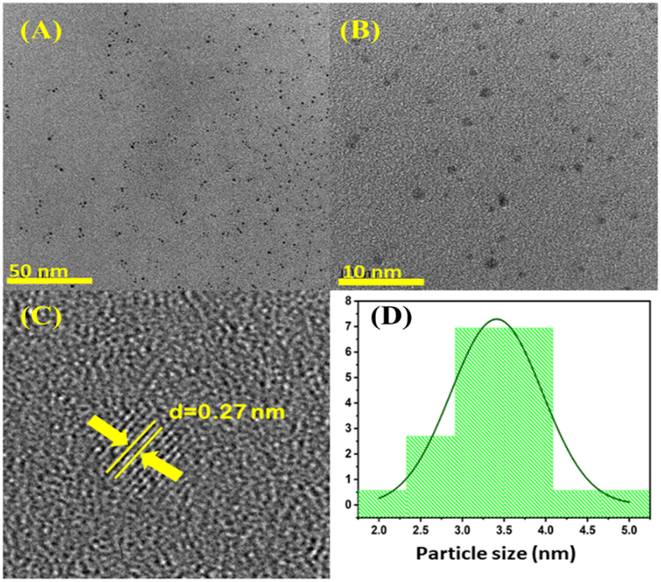 |
| | Fig. 2 (A) HR-TEM images at a scale of 50 nm, (B) 10 nm, (C) showing the interplanar distance (d spacing) and (D) size distribution histogram of N-CQDs. | |
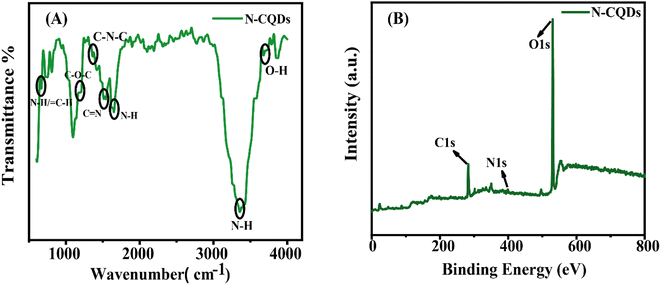 |
| | Fig. 3 (A) FTIR and (B) XPS spectra of N-CQDs. | |
3.2 Characterization of MnO2 NTs
The synthesized MnO2-NTs gave a broad absorption peak at around 300–600 nm which arises from d–d electronic transition of Mn (Fig. 4(A)).46,47 SEM and HR-TEM analysis of MnO2 NTs demonstrates that the nanotubes have uniform lattice fringes (Fig. 4(B) and (C)). It is reported that the synthesis of tetragonal α-MnO2 NTs depends on the reaction time and chemical etching of tetragonal MnO2 Nanorods (MnO2 NRs). The formation of nanotubes occurs from the growth of nanorods with solid ends and prolonged hydrothermal treatment transforms nanorods into hollow nanotubes48 which can be easily observed through HR-TEM images (Fig. 4(D)). The selected area electron diffraction (SAED) pattern at 5 nm−1 shows the mono-crystalline nature of the synthesized MnO2 NTs (Fig. 4(E)). The lattice spacing of 0.25 nm corresponds to [211] plane of tetragonal α-MnO2 (Fig. 4(F)).
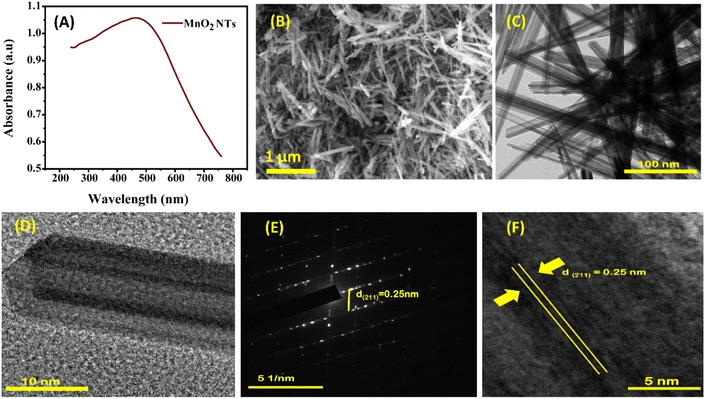 |
| | Fig. 4 (A) UV-Vis spectrum; (B) SEM image at the scale of 1 μm; HR-TEM image at the scale of 100 nm (C), at 10 nm (D); (E) SAED pattern and (F) interplanar distance (d-spacing) of MnO2 NTs. | |
The FTIR spectra of MnO2 NTs (Fig. 5(A)) depict the intense peak of Mn–O stretching vibration (550 cm−1), O–H bending vibrations near 1414.7 cm−1, 1469 cm−1 due to the absorbed water molecules. The broadband near 2900 cm−1 to 3100 cm−1 is attributed to the stretching vibration O–H in the lattice of MnO2 NTs.49 The high-resolution X-ray photon spectroscopy reveals the elemental and electronic properties of MnO2 NTs (Fig. 5(B) and (C)). The presence of two prominent peaks at 640.2 eV and 652.1 eV at a difference of 11.9 eV shows that Mn is present in Mn 2p3/2 and Mn 2p1/2 spin–orbit doublet, respectively. The Mn 2p3/2 peak is further separated into two peaks at about 640.8 and 643.0 eV, and the Mn 2p1/2 peak can also be separated into two peaks at about 652.0 and 652.4 eV. These peaks show the presence of Mn3+ and Mn4+.50,51 Similarly, the three deconvolution peaks of O 1s (Fig. 5(C)) are associated with Mn–O–Mn (529.6 eV) as lattice oxygen (Olatt), Mn–OH (530.9 eV), and H2O adsorption (533.3 eV).52
 |
| | Fig. 5 (A) FTIR spectra of MnO2 NTs; (B) XPS spectra of Mn 2p; (C) XPS spectra of O 1s. | |
3.3 Energy transfer mechanism between N-CQDs and MnO2 NTs
To study the energy transfer mechanism, the spectral overlap of the absorption spectra of MnO2 NTs and the emission spectra of N-CQDs was investigated. A large spectral overlap was observed for this pair (Fig. 6(A)) which indicates the possibility of energy transfer from N-CQDs to MnO2 NTs. The fluorometric observations reveal the quenching of FL intensity of N-CQDs in the presence of MnO2 NTs. The FL intensities of N-CQDs decrease with increasing concentration of MnO2 NTs in the range of 0–440 μg (Fig. 6(B)). A good linearity is observed between the FL intensity of N-CQDs and the concentration of MnO2 NTs with R2 = 0.97 (Fig. 6(C). MnO2 is the best candidate for application in the electrochemical field due to its low cost, high natural abundance and non-toxicity. Among all the nanostructures of MnO2, nanotubes can be considered as best candidates for the electron transfer mechanism because they provide high surface area and a large surface-to-volume ratio which allow effective contact with electrons and fast kinetics.53 Thus, it holds novelty of this work by applying MnO2 NTs as acceptor for the electron transfer mechanism.
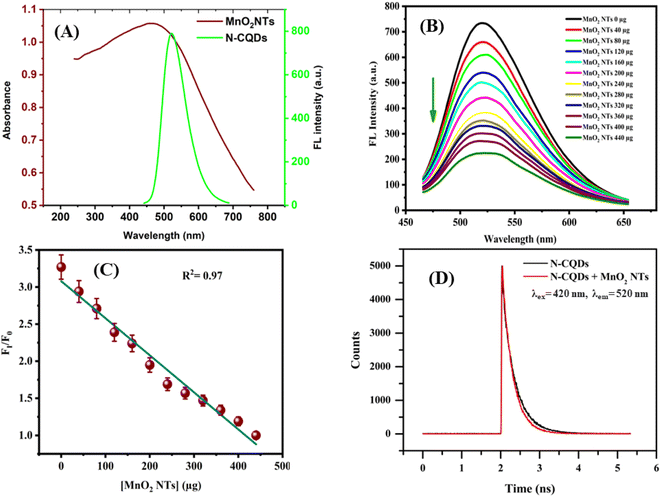 |
| | Fig. 6 (A) UV-Visible absorption spectrum of MnO2 NTs and the FL spectrum of N-CQDs, (B) fluorescence spectra of N-CQDs in the presence of different concentrations of MnO2 NTs. (C) Plot of FI/FI0 vs. concentration of MnO2 NTs, (D) FL decay curve of the N-CQDs and N-CQDs-MnO2 NTs. | |
The possible reason behind the FL quenching of N-CQD may be due to Förster Resonance Energy Transfer (FRET) or the Inner Filter Effect (IFE) (secondary IFE). FRET involves the spectral overlap of the emission spectrum of the donor and the absorption spectrum of the acceptor. Whereas, IFE involves the spectral overlap of the acceptor's absorption spectrum and the excitation spectrum (primary IFE) or the emission spectrum (secondary IFE) of the donor.54 This might be a bit confusing which can be resolved by the Time-correlated single photon count (TCSPC) analysis. The difference lies between the lifetime decay measurements of both mechanisms. Fig. 6(D) shows there is a slight change in the lifetime measurement of the N-CQDs after the addition of MnO2 NTs. The average lifetime of N-CQDs is 2.70 ± 0.33 ns which decreases to 2.39 ± 0.19 ns in the presence of MnO2 NTs due to the inner filter effect. The Stern–Volmer plot showing linear relationship between the concentration of MnO2 NTs and fluorescence intensity of N-CQDs with Stern–Volmer quenching constant, Ksv = 0.011 × 10³ M−1 and bimolecular quenching constant, Kq = 0.46 × 10¹⁰ M−1 s−1 also suggest that the quenching mechanism is Inner Filter Effect (Fig. S3†).55,56 To further verify the IFE-induced quenching mechanism, the observed fluorescence intensity was corrected via the mathematical formula given by Parker and Barnes.54,57 This formula includes the correction for the IFE-induced deviation in the fluorescence intensity in consideration of geometry and fluorescence observed54,58
| |
 | (2) |
| |
 | (3) |
where
fp is the factor for primary IFE and
fs is the factor for secondary IFE. The suggested geometry parameters given for the Cary Eclipse fluorescence spectrophotometer,
x1,
x2,
y1,
y2 are 0.207, 1.085, 0.258 and 0.727 respectively.
54,59–61
Lakowicz also suggested a correction for the IFE-induced deviation which follows as:62
| |
 | (4) |
Fcorr is the corrected fluorescence intensity and Fobs is the observed fluorescence intensity. Aem is the absorbance at the emission wavelength of N-CQDs and Aex is the absorbance at the excitation wavelength of N-CQDs. The parameters for the validation of IFE were studied using the eqn (2)–(4). Tables 1 and 2 summarize the parameters for the IFE corrections. Correction factor (CF) is the ratio of Fcorr/Fobs. CF values increase with the increase in the concentration of MnO2 NTs (Fig. 7(A)). It can be observed from Tables 1, 2 and Fig. 7(B) that there is no linear relationship between Fcorr, 0/Fcorr, which concludes that the inner filter is operating in the sensing system.54,59,60
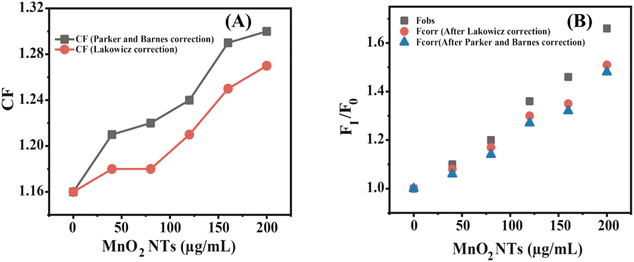 |
| | Fig. 7 (A) Inner filter effect (IFE)-corrected fluorescence; (B) plot among the correction factor (CF) and various concentrations of MnO2 NTs. | |
Table 1 Parker and Barnes correction parameter
| MnO2 NTs (μg mL−1) |
fp |
fs |
Correction factor |
Fobs |
Fcorr |
Fobs, 0/Fobs |
Fcorr, 0/Fcorr |
| 0 |
1.17 |
1 |
1.16 |
734.06 |
858.85 |
1 |
1 |
| 40 |
1.18 |
1.03 |
1.21 |
661.63 |
804.14 |
1.1 |
1.06 |
| 80 |
1.18 |
1.04 |
1.22 |
610.33 |
748.99 |
1.2 |
1.14 |
| 120 |
1.19 |
1.05 |
1.24 |
537.89 |
672.09 |
1.36 |
1.27 |
| 160 |
1.199 |
1.08 |
1.29 |
501.68 |
649.63 |
1.46 |
1.32 |
| 200 |
1.2 |
1.09 |
1.3 |
441.32 |
577.25 |
1.66 |
1.48 |
Table 2 Parker and Barnes correction parameter
| MnO2 NTs (μg mL−1) |
Aex |
Aem |
Correction factor |
Fobs |
Fcorr |
Fobs, 0/Fobs |
Fcorr, 0/Fcorr |
| 0 |
0.109 |
0.02 |
1.16 |
734.06 |
851.59 |
1 |
1 |
| 40 |
0.116 |
0.03 |
1.18 |
661.63 |
782.73 |
1.1 |
1.08 |
| 80 |
0.117 |
0.035 |
1.18 |
610.33 |
726.18 |
1.2 |
1.17 |
| 120 |
0.12 |
0.05 |
1.21 |
537.89 |
654.17 |
1.36 |
1.30 |
| 160 |
0.124 |
0.07 |
1.25 |
501.68 |
627.22 |
1.46 |
1.35 |
| 200 |
0.127 |
0.082 |
1.27 |
441.32 |
561.37 |
1.66 |
1.51 |
3.4 Fluorescence sensing of glutathione
Under the optimal conditions, the N-CQDs–MnO2 NT nanocomposites were added to different concentrations of GSH (3.3–23.3 μM) and the solutions were incubated for 10 min at room temperature. An increase in the fluorescence intensity of N-CQD–MnO2 NTs is observed with the increasing concentration of glutathione (Fig. 8(A)). Due to its reducing property, glutathione reduces the MnO2 NTs to Mn2+ and oxidises itself into glutathione disulfide (eqn (5)).63 Therefore, the transfer of energy from electron-rich N-CQDs to electron-deficient MnO2 NTs was interrupted due to the formation of Mn2+. The established probe showed a good linear relationship with the concentration range from 3.3 to 23.3 μM with a linear regression of 0.98 with LOD and LOQ of 4.70 μM and 14.25 μM (Fig. 8(B)). A comparison of developed N-CQDs-MnO2 NTs sensor for the detection of glutathione with previously reported sensors (Table S1†) shows that our developed sensor is more sensitive towards glutathione.| | |
2GSH + MnO2 + 2H+ → GSSG + Mn2+ + 2H2O
| (5) |
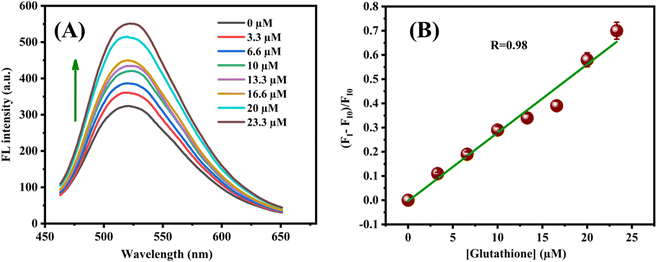 |
| | Fig. 8 (A) Fluorescence recovery of the N-CQD-MnO2 NTs system with increasing concentration of glutathione; (B) plot of (FI–FI0)/FI0 vs. glutathione concentrations. Error bars denote the standard deviation of three independent measurements. | |
3.5 Fluorescence sensing of captopril
Under the optimal conditions, the N-CQDs–MnO2 NT nanocomposites were added to different concentrations of CAP (3.3–30.0 μM) and the solutions were incubated for 10 min at room temperature. Additionally, CAP when kept in an oxidation environment, tend to form a disulphide bond (S–S).46,64,65 Thus, when CAP is introduced to the N-CQDs-MnO2 NTs, the thiol present in CAP reacts with MnO2 NTs and forms a disulphide bond. Further, the MnO2 NTs decompose to Mn2+ and lose the light absorption ability, which was formerly quenching the fluorescence of N-CQDs. As a result, there is an increase in the FL intensity of quenched N-CQDs, remarking the above-mentioned fact (Fig. 9(A)).66 Thus, the established probe showed good linearity in the concentration range from 3.3 to 30.0 μM with a linear regression of 0.98 (Fig. 9(B)) with LOD and LOQ of 5.22 μM and 15.84 μM respectively. A comparison table (Table S2†) has been given for comparing the LODs of various previously reported works.
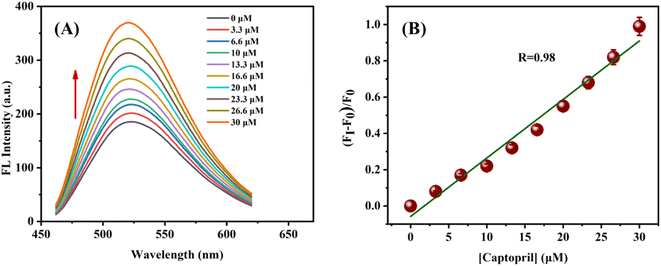 |
| | Fig. 9 (A) Fluorescence recovery of the N-CQD-MnO2 NTs system with increasing concentration of captopril; (B) plot of (FI–F0)/F0 vs. captopril concentrations. Error bars denote the standard deviation of three independent measurements. | |
3.6 Smartphone-based sensing of GSH and CAP
Smartphone-based detection of glutathione and captopril was achieved by placing the samples prepared for fluorescence sensing on the UV Transilluminator. The quenching phenomenon caused by the MnO2 NTs was also explored visibly. The fluorescence intensity of the as-prepared nanocomposite was visibly seen as decreasing due to the quenching effect. Whereas, the samples prepared for the detection of GSH and CAP have renewed fluorescence intensities due to the redox reactions of thiolated compounds. Most of the studies focus only on the analysis of the results which are visible through the naked eye. However, these analyses are limited to semi-quantitative monitoring and cannot have high accuracy because it is difficult to produce results merely by looking at the colour variation. Moreover, for more accuracy, the samples are kept on the UV Transilluminator rather than in the conventional UV illumination chamber. The change in the fluorescence intensity of the N-CQDs in the presence of quencher and thiolated compounds could be seen clearly as it was observed fluorimetrically establishing a good relationship between the instrumental and manual analysis. Further, the visible changes in the fluorescence of the N-CQDS were analysed using a smartphone. The photographs of the samples were captured using an Android phone and the intensity of fluorescent light was measured with the help of Image J software via gray measurement. When the linear plots of the measured gray values were plotted against the concentration of quencher and thiolated compounds, they showed good linear relationships. The R2 value for the linear plot of the quenching phenomenon is 0.98 (Fig. 10(A)). Similarly, the correlation coefficient, R values for the recovery processes are 0.98 and 0.99 for Glutathione (Fig. 10(B)) and Captopril (Fig. 10(C)), respectively. The calculated LODs of the smartphone-based sensing are 5.44 μM and 2.81 μM for glutathione and captopril, respectively.
 |
| | Fig. 10 (A) Plot of gray measurement vs. concentration of MnO2 NTs, (B) plot of gray measurement vs. concentration of glutathione and (C) plot of Gray measurement vs. concentration of captopril. | |
3.7 Interference and selectivity investigation
The interference study with different analytes such as KCl, NaCl, ascorbic acid, urea, glycine, glucose, oxalic acid, citric acid, sucrose and uric acid was performed with the 10 fold concentration of glutathione (23.3 μM) and captopril (30.0 μM). The obtained results confirm that the co-existence of other analytes did not affect the fluorescence probe (Fig. 11). Selectivity of the sensor has also been studied in the presence of other thiol compounds such as N-Acetyl-L-Cysteine (NAC), L-cysteine and L-cysteine methyl ester hydrochloride (L-cys MEH) with the same concentration of GSH (23.3 μM) and CAP (30.0 μM). The sensor showed neglible recovery with the addition of the thiols abovementioned (Fig. 12).
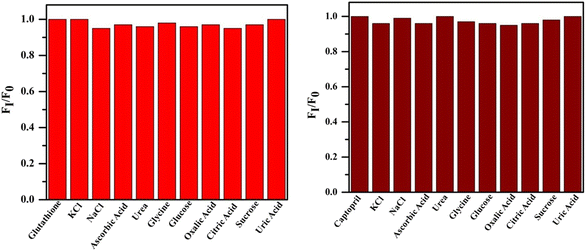 |
| | Fig. 11 Fluorescence response of the sensor to GSH and CAP in the presence of analytes. | |
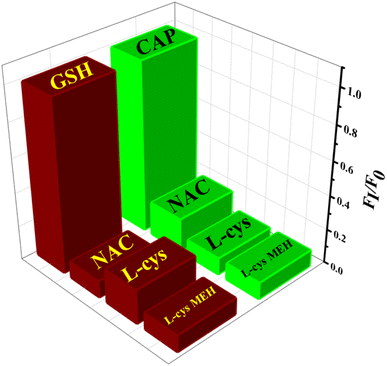 |
| | Fig. 12 Selectivity of the developed sensor for GSH and CAP. Conditions (i) N-CQDs-MnO2 NTs with thiols (23.3 μM) for glutathione, (ii) N-CQDs-MnO2 NTs with thiols (30.0 μM) for captopril. | |
3.8 Real sample analysis
To confirm the practicability of the proposed probe investigated for the detection of glutathione and captopril, the analysis was performed in the real sample. The glutathione and captopril were evaluated in human plasma. For the detection of both thiolated compounds, human plasma was diluted in Tris buffer. An aliquot of 60 μL of human plasma was added into the N-CQDs-MnO2 NTs solution, making a final volume of 3 mL. Further, different concentrations of glutathione were spiked into the prepared solution. The concentrations of GSH in human plasma were determined as 6.5–23.2 μM and we also observed excellent recoveries from 98.48 to 99.57% with good RSD, lower than 1.5%. For the detection of captopril, the determined concentrations were 6.5–26.5 μM in the above-prepared human plasma and the obtained recovery is from 99.09 to 99.81% with a good relative standard deviation, lower than 0.19% (Table 3). The as-synthesized probe shows its applicability in real samples and is feasible and capable of detecting the GSH and CAP in the biological environment also.
Table 3 Detection of glutathione and captopril in real sample
| Sample |
Spiked (μM) |
Found (μM) |
Recovery % |
RSD (n = 3) |
| Human blood plasma |
Glutathione |
| 6.6 |
6.5 |
98.48 |
1.5 |
| 23.3 |
23.2 |
99.57 |
0.18 |
| Captopril |
| 6.6 |
6.5 |
99.09 |
0.19 |
| 26.6 |
26.5 |
99.81 |
0.13 |
4 Conclusion
In summary, N-CQDs-MnO2 NTs nanocomposite was synthesized for the detection of thiolated compounds i.e. GSH and CAP based on the “On-Off-On” fluorescence strategy. The fluorescence intensity of N-CQDs was quenched in the presence of MnO2 NTs due to the inner filter effect. The transfer of energy from N-CQDS to MnO2 NTs was confirmed by the lifetime measurement of N-CQDs in the presence of MnO2 NTs. The fluorescence intensities of N-CQDs were used as analytical signals and MnO2 NTs were used as nano recognizer and quencher. Destruction of MnO2 NTs to Mn2+ via GSH and CAP, within the system enables fluorescence recovery which corresponds to the quantitive detection of these thiolated compounds. The probe was also tested for its applicability in the real sample (Human Blood Plasma). This probe was also employed for smartphone-based sensing. The samples prepared for the fluorometric detection were kept on the UV transilluminator. The samples exhibited their respective fluorescence intensities according to the concentrations of the quencher (MnO2 NTs), glutathione and captopril. The dual-mode probe also furnishes good LOD and LOQ values for both the analytes i.e. 4.70 μM, 14.25 μM and 5.22 μM, 15.84 μM for GSH and CAP respectively, fluorimetrically and 5.44 μM, 16.49 μM and 2.81 μM, 8.53 μM via smartphone analysis.
Data availability
The data supporting this article have been included as part of the ESI.†
Conflicts of interest
There are no conflicts to declare.
Acknowledgements
The authors are grateful to SERB/EEQ/2022/000967 and DST-PURSE (SR/PURSE/2022/145), for the financial support provided for this work. One of the co-authors, A. B. K. is thankful to CSIR-UGC for providing the NET-Junior Research fellowship. Another co-author, Y. C. is thankful to DST-INSPIRE for providing Inspire Fellowship. The authors are thankful to the SAIF Indian Institute of Technology, Bombay, for HRTEM and TCSPC analysis; the Indian Institute of Technology, Roorkee, for XPS analysis and NCNR, Pt. Ravishankar Shukla University, Raipur for providing FTIR facility. The authors are also thankful to NIT, Raipur for SEM facility. The authors are extremely thankful to Dr Satyajit Gupta, Assistant Professor, IIT Bhilai for the TCSPC analysis.
References
- J. Guo, H. Li, L. Ling, G. Li, R. Cheng, X. Lu, A. Q. Xie, Q. Li, C. F. Wang and S. Chen, ACS Sustainable Chem. Eng., 2020, 8, 1566–1572 CrossRef CAS.
- Q. Zhao, H. H Mao, M. Xue, X. Z. Feng, G. C. Han, Z. Chen and H. B. Kraatz, J. Lumin., 2023, 263, 120091 CrossRef CAS.
- N. Xin, D. Gao, B. Su, T. Zhou, Y. Zhu, C. Wu, D. Wei, J. Sun and H. Fan, ACS Sens., 2023, 3, 1161–1172 CrossRef PubMed.
- P. Siahcheshm and P. Heiden, J. Photochem. Photobiol., A, 2023, 435, 114284 CrossRef CAS.
- H. Li, X. He, J. Kang, H. Huang, Y. Liu, J. Liu, S. Lian, C. H. A. Tsang, X. Yang and S. T. Lee, Angew. Chem., Int. Ed., 2010, 49, 4430–4434 CrossRef CAS PubMed.
- P. Ezati, R. Priyadarshi and J. W. Rhim, SM&T, 2022, 33, e00494 Search PubMed.
- A. Khan, P. Ezati and J. T. Kim, Mater. Today Sustain., 2023, 21, 100306 CrossRef.
- S. Prakash, S. Sahu, B. Patra and A. K. Mishra, Spectrochim. Acta, Part A, 2023, 290, 122257 CrossRef CAS PubMed.
- Q. Xu, P. Pu, J. Zhao, C. Dong, C. Gao, Y. Chen, J. Chen, Y. Liu and H. Zhou, J. Mater. Chem. A, 2015, 3, 542–546 RSC.
- D. G. Babar and S. S. Garje, ACS omega, 2020, 5, 2710–2717 CrossRef CAS PubMed.
- G. Magdy, S. Ebrahim, F. Belal, R. A. El-Domany and A. M. Abdel-Megied, Sci. Rep., 2023, 13, 5502 CrossRef CAS PubMed.
- S. Munusamy, T. R. Mandlimath, P. Swetha, A. G. Al-Sehemi, M. Pannipara, S. Koppala, P. Shanmugam, S. Boonyuen, R. Pothu and R. Boddula, Environ. Res., 2023, 231, 116046 CrossRef CAS PubMed.
- K. G. Nguyen, M. Huš, I. A. Baragau, J. Bowen, T. Heil, A. Nicolaev, L. E. Abramiuc, A. Sapelkin, M. T. Sajjad and S. Kellici, Small, 2024, 2310587 CrossRef CAS PubMed.
- L. Dewangan, Y. Chawre, J. Korram, I. Karbhal, R. Nagwanshi, V. Jain and M. L. Satnami, Microchem. J., 2022, 182, 107867 CrossRef CAS.
- J. Wang, P. Zhang, C. Huang, G. Liu, K. C. F. Leung and Y. X. J. Wáng, Langmuir, 2015, 31, 8063–8073 CrossRef CAS PubMed.
- R. Hu, L. Li and W. J. Jin, Carbon, 2017, 111, 133–141 CrossRef CAS.
- S. Sarkar, M. Sudolska, M. Dubecky, C. J. Reckmeier, A. L. Rogach, R. Zboril and M. Otyepka, J. Phys. Chem. C, 2016, 120, 1303–1308 CrossRef CAS.
- S. D. Dsouza, M. Bruekle, P. Brunet, C. Maddi, D. B. Padmanaban, A. Morelli, A. F. Payam, P. Maguire, D. Mariotti and V. Svrcek, Carbon, 2021, 183, 1–11 CrossRef CAS.
- K. Hola, M. Sudolska, S. Kalytchuk, D. Nachtigallova, A. L. Rogach, M. Otyepka and R. Zboril, ACS Nano, 2017, 11, 12402–12410 CrossRef CAS PubMed.
- S. Chen, Y. L. Yu and J. H. Wang, Anal. Chim. Acta, 2018, 999, 13–26 CrossRef CAS PubMed.
- T. Wietner, T. Friganović and D. Šaki, Anal. Chem., 2022, 19, 7107–7114 CrossRef PubMed.
- M. R. Hormozi-Nezhad, H. Bagheri, A. Bohloul, N. Taheri and H. Robatjazi, J. Lumin., 2013, 134, 874–879 CrossRef CAS.
- C. J. Watson, D. L. Overbeek, G. Allegri-Machado, M. D. Kellogg, A. Patterson, J. B. McAlvin and M. M. Burns, Clin. Toxicol., 2022, 60, 876–881 CrossRef PubMed.
- D. Broadwater, M. Bates, M. Jayaram, M. Young, J. He, A. L. Raithel, T. W. Hamann, W. Zhang, B. Borhan, R. R. Lunt and S. Y. Lunt, Sci. Rep., 2019, 9, 15288 CrossRef PubMed.
- S. J. Xiao, X. J. Zhao, Z. J. Chu, H. Xu, G. Q. Liu, C. Z. Huang and L. Zhang, ACS Omega, 2017, 2, 1666–1671 CrossRef CAS PubMed.
- S. Tang, X. You, Q. Fang, X. Li, G. Li, J. Chen and W. Chen, Sensors, 2019, 19, 228 CrossRef PubMed.
- X. Y. Wong, D. Quesada-González, S. Manickam, S. Y. New, K. Muthoosamy and A. Merkoçi, Sci. Rep., 2021, 11, 2375 CrossRef CAS PubMed.
- F. Liu, T. Lei, Y. Zhang, Y. Wang and Y. He, Anal. Chim. Acta, 2021, 1184, 339026 CrossRef CAS PubMed .s.
- K. Kai, Y. Yoshida, H. Kageyama, G. Saito, T. Ishigaki, Y. Furukawa and J. Kawamata, J. Am. Chem. Soc., 2008, 47, 15938–15943 CrossRef PubMed.
- S. Sahu, B. Behera, T. K. Maiti and S. Mohapatra, Chem. Commun., 2012, 48, 8835–8837 RSC.
- Y. Song, N. Qi, K. Li, D. Cheng, D. Wang and Y. Li, RSC Adv., 2022, 12, 8108–8118 RSC.
- G. Eda, Y. Y. Lin, C. Mattevi, H. Yamaguchi, H. A. Chen, I. S. Chen, C. W. Chen and M. Chhowalla, Adv. Mater., 2010, 22, 505–509 CrossRef CAS PubMed.
- Z. Liu, W. Hou, H. Guo, Z. Wang, L. Wang and M. Wu, ACS Appl. Mater. Interfaces, 2023, 15, 33868–33877 CrossRef CAS PubMed.
- P. Wu, W. Lia, Q. Wua, Y. Liua and S. Liu, RSC Adv., 2017, 7, 44144–44153 RSC.
- E. F. Simões, J. M. Leitão and J. C. E. da Silva, Microchim. Acta, 2016, 183, 1769–1777 CrossRef.
- X. Li, S. Zhang, S. A. Kulinich, Y. Liu and H. Zeng, Sci. Rep., 2014, 4, 1–8 CAS.
- G. E. LeCroy, F. Messina, A. Sciortino, C. E. Bunker, P. Wang, K. S. Fernando and Y. P. Sun, J. Phys. Chem. C, 2017, 50, 28180–28186 CrossRef.
- L. Guo, J. Ge, W. Liu, G. Niu, Q. Jia, H. Wang and P. Wang, Nanoscale, 2016, 2, 729–734 RSC.
- N. Papaioannou, A. Marinovic, N. Yoshizawa, A. E. Goode, M. Fay, A. Khlobystov, M. M. Titirici and A. Sapelkin, Sci. Rep., 2018, 8, 1–10 CAS.
- R. Atchudan, T. N. J. I. Edison, S. Perumal, N. C. S. Selvam and Y. R. Lee, J. Photochem. Photobiol., A, 2019, 372, 99–107 CrossRef CAS.
- K. H. H. Aziz, K. M. Omer and R. F. Hamarawfa, New J. Chem., 2019, 43, 8677–8683 RSC.
- W. J. Niu, Y. Li, R. H. Zhu, D. Shan, Y. R. Fan and X. J. Zhang, Sens. Actuators, B, 2015, 218, 229–236 CrossRef CAS.
- X. Miao, D. Qu, D. Yang, B. Nie, Y. Zhao, H. Fan and Z. Sun, Adv. Mater., 2017, 30, 1–8 Search PubMed.
- Q. Zhou, W. Chen, X. Jiang, H. Liu, S. Ma and B. Wang, Sci. Rep., 2020, 10, 1353–1368 CrossRef CAS PubMed.
- N. K. R. Bogireddy, R. C. Silva, M. A. Valenzuela and V. Agarwal, J. Hazard. Mater., 2020, 386, 1–27 CrossRef PubMed.
- Q. Wang, Z. Zhang, T. Yang, Y. Han, Y. Cheng, J. Wu, J. Bai, C. Ma, Y. Niu and S. Shuang, Spectrochim. Acta, Part A, 2022, 269, 120742 CrossRef CAS PubMed.
- S. Shah, I. Zulfiqar, T. Khan, R. Khan, S. A. Khan, S. A. Khattar and G. Khan, J. Mater. Sci.: Mater. Electron., 2019, 30, 19199–19205 CrossRef CAS.
- J. Luo, H. T. Zhu, H. M. Fan, J. K. Liang, H. L. Shi, G. H. Rao, J. B. Li, Z. M. Du and Z. X. Shen, J. Phys. Chem. C, 2008, 112, 12594–12598 CrossRef CAS.
- L. Dewangan, J. Korram, I. Karbhal, R. Nagwansi and M. L. Satnami, ACS Appl. Nano Mater., 2021, 12, 13612–13624 CrossRef.
- G. Xie, X. Liu, Q. Li, H. Lin, Y. Li, M. Nie and L. Qin, J. Mater. Sci., 2017, 52, 10915–10926 CrossRef CAS.
- Y. Xue, H. Miao, S. Sun, Q. Wang, S. Li and Z. Liu, J. Power Sources, 2017, 342, 192–201 CrossRef CAS.
- X. Shi, H. Zheng, A. M. Kannan, K. Pérez-Salcedo and B. Escobar, Inorg. Chem., 2019, 8, 5335–5344 CrossRef PubMed.
- M. Huang, Y. Zhang, F. Li, L. Zhang, R. S. Ruoff, Z. Wen and Q. Liu, Sci. Rep., 2014, 4, 1–8 Search PubMed.
- H. J. Lee, J. Jana, J. S. Chung and S. H. Hur, Spectrochim. Acta, Part A, 2020, 236, 118342 CrossRef CAS PubMed.
- J. Tang, Y. Zhang, Y. Liu, D. Liu, H. Qin and N. Lian, RSC Adv., 2019, 9, 38174–38182 RSC.
- M. S. Ali and H. A. Al-Lohedan, Spectrochim. Acta, Part A, 2018, 203, 434–442 CrossRef CAS PubMed.
- C. A Parker and W. J. Barnes, Analyst, 1957, 82, 606–618 RSC.
- S. K. Panigrahi and A. K. Mishra, J. Photochem. Photobiol., C, 2019, 41, 100318 CrossRef.
- N. Sohal, B. Maity and S. Basu, ACS Appl. Bio Mater., 2022, 5, 2355–2364 CrossRef CAS PubMed.
- J. Liu, Y. Chen, W. Wang, J. Feng, M. Liang, S. Ma and X. Chen, J. Agric. Food Chem., 2016, 64, 371–380 CrossRef CAS PubMed.
- A. Kaspare and Smyk, Spectrochim. Acta, Part A, 2018, 198, 297–303 CrossRef PubMed.
- C. Albrecht and J. R. Lakowicz, Principles of Fluorescence Spectroscopy, Springer, 3rd edn, 2007 Search PubMed.
- Q. Cai, J. Li, J. Ge, L. Zhang, Y. Hu, Z. Li and L. Qu, Biosens. Bioelectron., 2015, 72, 31–36 CrossRef CAS PubMed.
- C. Xu, G. Zhou, H. Cai, Y. Chen, L. Huang, L. Cai, J. Gong and Z. Yan, ACS Omega, 2022, 7, 20383–20389 CrossRef CAS PubMed.
- S. Hillaert and W. Van den Bossche, J. Pharm. Biomed. Anal., 1999, 21, 65–73 CrossRef CAS PubMed.
- E. M. Eitel, S. Zhao, Y. Tang and M. Taillefert, Environ. Sci. Technol., 2018, 52, 13202–13211 CrossRef CAS PubMed.
Footnote |
| † Electronic supplementary information (ESI) available: Normalized excitation and emission spectra of N-CQDs, deconvoluted XPS spectra of N-CQDs, Stern–Volmer plot for MnO2 NTs quenching N-CQDs and comparison tables of GSH and CAP with previously reported work. See DOI: https://doi.org/10.1039/d4ra03287j |
|
| This journal is © The Royal Society of Chemistry 2024 |
Click here to see how this site uses Cookies. View our privacy policy here.  Open Access Article
 *a,
Yogyata Chawrea,
Pinki Mirib,
Akash Sinhaab,
Rekha Nagwanshic,
Indrapal Karbhala,
Kallol K. Ghosh
 a,
Shamsh Pervez
 a and
Manas Kanti Deb
 a
a
![[double bond, length as m-dash]](https://www.rsc.org/images/entities/char_e001.gif) C of sp2 carbon network.31 The sp2 hybridized carbon atoms are believed to be either bonded with neighbouring carbon atoms or oxygen atoms directing the formation of carboxyl and carbonyl groups, which mostly decorate the surface of N-CQDs.32 The presence of these groups is confirmed by spectroscopic techniques such as FTIR and XPS.33 Another shoulder peak at 426 nm is attributed to n–π* transitions of C
C of sp2 carbon network.31 The sp2 hybridized carbon atoms are believed to be either bonded with neighbouring carbon atoms or oxygen atoms directing the formation of carboxyl and carbonyl groups, which mostly decorate the surface of N-CQDs.32 The presence of these groups is confirmed by spectroscopic techniques such as FTIR and XPS.33 Another shoulder peak at 426 nm is attributed to n–π* transitions of C![[double bond, length as m-dash]](https://www.rsc.org/images/entities/char_e001.gif) O/–C
O/–C![[double bond, length as m-dash]](https://www.rsc.org/images/entities/char_e001.gif) N and NH2 group.34 These peaks reveal that the usage of urea is responsible for the generation of nitrogen-rich functional groups and providing green emissions.35 A slight excitation-dependent behaviour of FL spectra of green N-CQDs is observed in the excitation wavelength ranges from 390–470 nm with maximum emission at 520 nm (Fig. 1(B)). The excitation wavelength for maximum emission was 420 nm (Fig. S1†). Surface passivation plays an important role in the FL emission of N-CQDs. If the surface is completely passivated then emission occurs only due to π–π* radiative transition of sp2 carbon. This single transition process leads to excitation independent emission.36 But as observed in Fig. 1(B), the little dependency of emission on the excitation wavelength is due to the availability of the surface traps at different energies, arising from non-uniform structures.37 Additionally, the calculated QY was 43.20% which might be due to the effective doping of nitrogen. The extent of doping can also be confirmed from the X-ray Photon Spectroscopy which showed 4.83% of nitrogen content in as-synthesized N-CQDs.
N and NH2 group.34 These peaks reveal that the usage of urea is responsible for the generation of nitrogen-rich functional groups and providing green emissions.35 A slight excitation-dependent behaviour of FL spectra of green N-CQDs is observed in the excitation wavelength ranges from 390–470 nm with maximum emission at 520 nm (Fig. 1(B)). The excitation wavelength for maximum emission was 420 nm (Fig. S1†). Surface passivation plays an important role in the FL emission of N-CQDs. If the surface is completely passivated then emission occurs only due to π–π* radiative transition of sp2 carbon. This single transition process leads to excitation independent emission.36 But as observed in Fig. 1(B), the little dependency of emission on the excitation wavelength is due to the availability of the surface traps at different energies, arising from non-uniform structures.37 Additionally, the calculated QY was 43.20% which might be due to the effective doping of nitrogen. The extent of doping can also be confirmed from the X-ray Photon Spectroscopy which showed 4.83% of nitrogen content in as-synthesized N-CQDs.

![[double bond, length as m-dash]](https://www.rsc.org/images/entities/char_e001.gif) N stretching vibration (1517 cm−1), N–H/C–H bending vibration (670 cm−1), N–H bending vibration (due to the presence of primary amine, 1652 cm−1), C–N–C asymmetric stretching due to secondary amine (1360 cm−1), C–O–C stretching vibration (1200 cm−1), shows the efficient existence of nitrogen and oxygen atoms into the carbonous framework of CQDs.40,41 The presence of O–H stretching vibration (3680 cm−1) and N–H stretching vibration (3359 cm−1) shows the hydrophilic nature of N-CQDs.42 The XPS spectra show the composition of C, N and O atoms in the lattice of N-CQDs. The typical peaks at 285 eV, 400 eV, and 530 eV correspond to the C 1s, N 1s and O 1s respectively (Fig. 3(B)). Deconvolution of C 1s shows four peaks of C–C/C
N stretching vibration (1517 cm−1), N–H/C–H bending vibration (670 cm−1), N–H bending vibration (due to the presence of primary amine, 1652 cm−1), C–N–C asymmetric stretching due to secondary amine (1360 cm−1), C–O–C stretching vibration (1200 cm−1), shows the efficient existence of nitrogen and oxygen atoms into the carbonous framework of CQDs.40,41 The presence of O–H stretching vibration (3680 cm−1) and N–H stretching vibration (3359 cm−1) shows the hydrophilic nature of N-CQDs.42 The XPS spectra show the composition of C, N and O atoms in the lattice of N-CQDs. The typical peaks at 285 eV, 400 eV, and 530 eV correspond to the C 1s, N 1s and O 1s respectively (Fig. 3(B)). Deconvolution of C 1s shows four peaks of C–C/C![[double bond, length as m-dash]](https://www.rsc.org/images/entities/char_e001.gif) C at 284.8 eV, C–N at 285.9 eV, C–O at 286.7 eV and C
C at 284.8 eV, C–N at 285.9 eV, C–O at 286.7 eV and C![[double bond, length as m-dash]](https://www.rsc.org/images/entities/char_e001.gif) O at 288.6 eV (Fig. S2(A)†).43 Similarly, the deconvolution of N 1s shows three major peaks of pyridinic N at 398.9 eV, pyrrolic N at 400.5 eV, and quaternary N at 403.2 eV ((Fig. S2(B)†).44 The deconvolution of O1s corresponds to C
O at 288.6 eV (Fig. S2(A)†).43 Similarly, the deconvolution of N 1s shows three major peaks of pyridinic N at 398.9 eV, pyrrolic N at 400.5 eV, and quaternary N at 403.2 eV ((Fig. S2(B)†).44 The deconvolution of O1s corresponds to C![[double bond, length as m-dash]](https://www.rsc.org/images/entities/char_e001.gif) O bond at 532.5 eV (Fig. S2(C)†).45 The survey of XPS reveals that 36.88% C, 4.83% N and 58.29% O are present in N-CQDs. In general, FTIR and XPS analyses hold an agreement in terms of the types of bonds obtained. Both techniques assured the presence of nitrogen doping along with oxygen-containing moieties embedded in the synthesized N-CQDs.
O bond at 532.5 eV (Fig. S2(C)†).45 The survey of XPS reveals that 36.88% C, 4.83% N and 58.29% O are present in N-CQDs. In general, FTIR and XPS analyses hold an agreement in terms of the types of bonds obtained. Both techniques assured the presence of nitrogen doping along with oxygen-containing moieties embedded in the synthesized N-CQDs.


