 Open Access Article
Green catalyst of cobalt ferrite magnetic nanoparticles using petai peel extract for the synthesis of thiazolidinedione-based chalcone 4H-thiopyran as an antioxidant†
Aida Nadia a,
Antonius Herry Cahyana
 *a,
Dicky Annas
 *b,
Mohammad Jihad Madiabu
 c and
Bayu Ardiansah
 a
a
aDepartment of Chemistry, Faculty of Mathematics and Natural Sciences, Universitas Indonesia, Depok 16242, Indonesia. E-mail: herrykim@sci.ui.ac.id
bResearch Center for Chemistry, National Research and Innovation Agency (BRIN), B. J. Habibie Science and Technology Area, South Tangerang 15314, Indonesia. E-mail: dick015@brin.go.id
cDepartment of Analytical Chemistry, Politeknik AKA Bogor, Bogor 16154, Indonesia
First published on 5th August 2024
Abstract
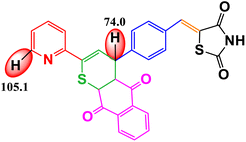
CoFe2O4 magnetic nanoparticles were successfully synthesized using the green synthesis method with petai peel extract (PPE) as the capping and reducing agent. These nanoparticles were characterized using various techniques, including XRD, VSM, FTIR spectroscopy, UV-DRS, FESEM, EDX, TEM, HR-TEM, and SAED. The synthesized nanoparticles possess cubic morphology with an average size of 37.67 nm. CoFe2O4 magnetic nanoparticles were used as a catalyst for the synthesis of organic compounds, namely, chalcones. The synthesized organic compounds were characterized using FTIR, UV-Vis, LC-HRMS, and melting point test. The best result for chalcone synthesis was 62.26% using CoFe2O4 magnetic nanoparticles (5 mol%) in ethanol at reflux condition for 2 h. The nanocatalyst could be used for 5 cycles without any significant loss of yields. The synthesized organic compounds were further examined for their antioxidant activity. The 4H-thiopyran 2-acetyl pyridine variant (product 2) exhibited the highest antioxidant activity with an IC50 value of 90.80 μg mL−1. This was supported by the bond dissociation enthalpy (BDE) values of the C–H groups of benzo[g]thiochromene and pyridine, which were 74.0 kcal mol−1 and 105.1 kcal mol−1, respectively. The objective of this study is to develop a method for synthesizing organic compounds using green catalysts in order to reduce the adverse environmental impact. Furthermore, this research also aims to investigate the antioxidant potential of the thiazolidinedione-based chalcone 4H-thiopyran compounds in order to overcome oxidative stress.
Introduction
Magnetic nanoparticles (MNPs) are of great interest to researchers due to their unique properties, such as high magnetisation values and uniform physical and chemical properties, as well as their small size (less than 100 nm).1 MNPs are abundant and easy to synthesize, and their magnetic moment and anisotropy constant can be controlled by their size.2 Magnetic nanoparticles have a wide range of applications in various fields such as energy, environmental science, agriculture, biomedicine, biosensing, catalysis, cancer research, drug delivery, bioimaging, and bioseparation.3,4Magnetic nanoparticles are considered attractive catalysts because they can be separated from the reaction medium through magnetization by an external magnet.4 Magnetic nanoparticles can be classified into four categories: alloys (Au/Fe, Fe/Co), oxides (γ-Fe2O3, Fe3O4, NiO), metal nanoparticles (Fe–Co), and ferrites (CoFe2O4, NiFe2O4, MnFe2O4, ZnFe2O4).5 Ferrite nanostructures are a type of magnetic material that have received significant attention due to their exceptional electrical and magnetic properties.6 Spinel-type ferrite nanomaterials have gained significant importance due to their unique and useful properties in various fields.7
The face-centered cubic structure formula for spinel ferrite is MFe2O4, where M represents divalent metal ions such as Zn, Ni, Mn, or Co.8 Cobalt ferrite (CoFe2O4) is particularly noteworthy among all spinel ferrites due to its exceptional physical properties.9 Cobalt ferrite is a spinel ferrite with unique magnetic properties, such as high coercivity, mechanical hardness, and chemical stability.10,11
Magnetic nanoparticles can be synthesized through physical (top-down), chemical (bottom-up), and biological (bottom-up) methods.12 Chemically synthesized ferrite nanoparticles can have toxic effects on the environment while physical synthesis methods can result in non-uniform particle sizes and voids. To address these challenges, biological methods provide environmentally acceptable alternatives.13 Biological methods utilize green chemistry philosophies,14 which employ chemical principles to reduce or eliminate the use of toxic reagents.15 Green synthesis is widely regarded as the optimal technique for preparing nanoparticles due to its numerous advantages, including simplicity, scalability for large-scale synthesis, affordability, short production time, the ability to produce highly stable nanoparticles, and generation of non-toxic byproducts.16,17 For instance, previous studies have reported on the green synthesis of cobalt ferrite magnetic nanoparticles using extracts of pulp, grape peel, and honey-mediated synthesis of cobalt–zinc ferrite nanoparticles.18
This research utilized the peel of petai (Parkia speciosa) due to its potential benefits, despite being often discarded and underutilized.19 Parkia speciosa Hassk is a tropical leguminous tree in the Leguminosae family, commonly found in Southeast Asia.20 The peels of petai extracts (PPE) contain a variety of phytochemicals, such as phenolic compounds, flavonoids, saponins, alkaloids, steroids, triterpenoids, and tannin compounds.21–24 These active compounds act as potent reducing, stabilizing, and chelating agents. They provide prevent agglomeration, stability, and aid in controlling the shape and size of the nanoparticles.25–27
Spinel ferrites are commonly used as reusable heterogeneous catalysts in various organic reactions.28 Studies have shown that spinel ferrites, such as ZnFe2O4 synthesized by the sol–gel method with glycine chelator, can be used as nanocatalysts in the synthesis of solvent-free chalcone compounds under microwave irradiation. The yields were reported to be as high as 95% at 5 mol% catalyst.29 Mostaghni (2020) synthesized multisubstituted imidazoles using CoFe2O4 as a catalyst with the co-precipitation method and achieved a yield of 99%.30 Senapati and Phukan (2011) synthesized cobalt ferrite spinel magnetic nanoparticles using a combined technique of sonochemistry and co-precipitation.31 The average size of the nanoparticles was in the range of 40–50 nm. The catalyst was utilized in the aldol condensation reaction in ethanol on aldehydes and ketones to produce chalcone compounds with yields ranging from 60% to 76%.
Heterocyclic compounds play an important role in biological and medicinal chemistry as versatile building blocks of organic molecules.32 According to Kumar et al. (2022), thiazolidinediones (TZD) are heterocyclic compounds that have been shown to be important in a variety of biological activities, including those of antioxidant, antimicrobial, and antihyperglycemic agents.33 Antioxidants (AO) are pharmaceuticals that provide resistance against oxidative stress by limiting the production of peroxides that harm cellular and subcellular membranes and preventing the development of free-radical reactions. Nowadays, one of the most important tasks for scientists is to find new, effective AO to treat a variety of diseases.34
To create novel antioxidant compounds, one can synthesize derivatives of TZD compounds, such as the chalcone compound. The synthesis of various chalcone derivatives is obtained by the reaction of aromatic aldehydes with ketones via the Claisen–Schmidt condensation reaction supported by solid base or Lewis acid catalysts,29,35 and they are reported to have effective antioxidant activity.36 The chalcone compound can be converted into its derivative, thiochalcone.37 Thiochalcone can be cyclized through the thia-Diels–Alder reaction to form heterocycles, which have various medical applications.38
This study aims to expand on previous research utilizing environment-friendly methods and natural materials. The research will investigate the synthesis, characterization, and evaluation of CoFe2O4 magnetic nanoparticles, which was synthesized using the green synthesis method and applied as a nanocatalyst for thiazolidinedione-based chalcone 4H-thiopyran. The synthesized organic compounds were further tested as antioxidants. Various techniques were used to characterize the CoFe2O4 magnetic nanoparticles, including FTIR, XRD, VSM, UV-DRS, FESEM, EDX, TEM, SAED, and HR-TEM imaging. The organic compounds underwent characterization using FTIR, UV-Vis, and LC-HRMS techniques as well as a melting point test. The antioxidant activity of organic compounds was evaluated by the DPPH method, also considering the BDE value of each H-bonding atom. The use of CoFe2O4 as an eco-friendly catalyst ensures both a good yield of the product and exceptional long-term durability, which allows for its repeated use during the process of synthesis.
Experimental
Materials
The materials used in the study were obtained from petai peel (Parkia speciosa Hassk) sourced from household waste in Tangerang district, Banten province, Indonesia. Analytical grade chemicals, such as iron(III) nitrate nonahydrate (Fe(NO3)3·9H2O) (purity: 99.99%), cobalt(II) nitrate hexahydrate (Co(NO3)2·6H2O) (purity: 99.99%), 2,4-thiazolidinediones (C3H3NO2S; CAS 2295-31-0; purity: 99%), terephthalaldehyde (C6H4(CHO)2; CAS 623-27-8; purity: 99%), glacial acetic acid (CH3CO2H; CAS 64-19-7; purity: 99.9%), sodium acetate (CH3COONa; CAS 127-09-3; purity: 99%), acetophenone (CH3COC6H5; CAS 98-86-2; purity: 98%), 2-acetyl pyridine (C7H7NO; CAS 1122-62-9; purity: 99%), 1,4-naphthoquinone (C10H6O2; CAS 130-15-4; purity: 98%), Lawesson's reagent (C14H14O2P2S4; CAS 19172-47-5; purity: 99%), nitrogen gas (N2; CAS 7727-37-9; purity: 99.99%), and DPPH (1,1-diphenyl-2-picrylhydrazyl) (C18H12N5O6; CAS 1898-66-4; purity: 95%), were purchased from Sigma-Aldrich. The solvents used were distilled water, n-hexane (CH3(CH2)4CH3; CAS 110-54-3; purity: 95%), ethyl acetate (CH3COOC2H5; CAS 141-78-6; purity: 99.8%), ethanol (CH3CH2OH; CAS 64-17-5; purity: 99%), tetrahydrofuran (THF) (C4H8O; CAS 109-99-9; purity: 99.5%), and methanol (CH3OH; CAS 67-56-1; purity: 99.9%).Preparation of petai peel extract (PPE)
The extract of petai peel was obtained by cutting it into small pieces, drying it under indirect sunlight for 5 days and crushing it into a dry powder. Then, 40 grams of petai peel powder was dissolved in 500 mL of pure water. The mixture was stirred and heated at 50 °C for 2 hours. Finally, the resulting extract was cooled at room temperature, filtered, and the filtrate was stored in a cooler for further use.23,39,40Green synthesis of CoFe2O4 magnetic nanoparticles
CoFe2O4 magnetic nanoparticles were synthesized using the green synthetic method. Co(NO3)2·6H2O (1.746 grams, 0.006 mol) was reacted with Fe(NO3)3·9H2O (5.125 grams, 0.012 mol) in the presence of 50 mL of petai (Parkia speciosa) peel extract solution. The mixture was stirred using a magnetic stirrer for 1 hour at room temperature while it was tightly covered with aluminum foil. Subsequently, it was then left in a dark room at room temperature for 18 hours and then oven-dried at 100 °C for 24 hours to remove the water content. The product was synthesized by calcination in a furnace at 700 °C for 2 hours. Finally, the product was cooled, weighed, and stored for further use.40–42Characterization of CoFe2O4 magnetic nanoparticles and organic compounds
CoFe2O4 magnetic nanoparticles were characterized using various techniques, including XRD, VSM, FTIR, UV-DRS, FESEM, EDX, and TEM. The Fourier transform infrared (FTIR) spectra of selected samples were obtained using KBr disks and recorded in the range from 4000 cm−1 to 400 cm−1. The FTIR spectrophotometer used for infrared spectrum analysis was a Prestige-21 Shimadzu. The crystal phase structure and crystallite size of the catalysts were analyzed using X-ray diffraction (XRD) Smartlab Rigaku with Cu-Kα radiation (λ = 1.541862 Å). The scanning angle ranged from 10° to 120° with a step of 0.01°.The magnetic properties at room temperature can be determined using a vibrating sample magnetometer (VSM). The catalyst's band gap energy was determined using a Shimadzu UV-2450 ultraviolet visible-diffuse reflectance spectrophotometer (UV-DRS). The surface morphology of the catalyst was analyzed using field emission scanning electron microscopy (FESEM) on a JEOL JIB-4610F Multi-Beam System. Additionally, the elemental composition was determined using energy dispersive X-ray (EDX) spectroscopy. The average particle size and surface morphology of the catalyst were analyzed using transmission electron microscopy (TEM) with a Talos F200X. High-resolution transmission electron microscopy (HR-TEM) images and selected area electron diffraction (SAED) patterns were used to examine the crystalline structure, shape, and size of the synthesized CoFe2O4 magnetic nanoparticles using a Talos F200X.
The synthesized organic compounds were characterized using FTIR, UV-Vis, LC-HRMS, and melting point test. A Prestige-21 Shimadzu was used as the FTIR spectrophotometer for infrared spectrum analysis. Absorbance spectra were measured using a Shimadzu UV-2450 ultraviolet-visible (UV-Vis) spectrophotometer. The Indonesia National Police Forensic Laboratory Centre obtained high-resolution mass spectra (HRMS) using a Xevo G2-XS QTof (Waters, USA) in the detection mode with ESI-TOF. The melting point was tested using an Electrothermal Melting Point Apparatus IA9100.
Evaluation of thiazolidinedione-based chalcone 4H-thiopyran
An overview of the reaction scheme for the formation of thiazolidinedione-based chalcone 4H-thiopyran compounds is presented in Fig. 1.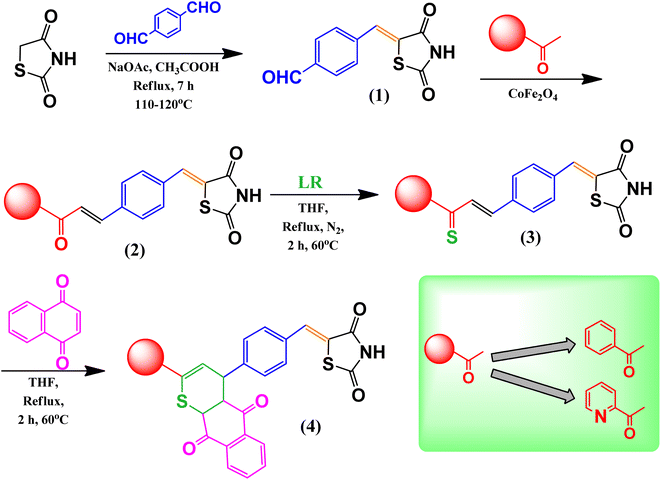 | ||
| Fig. 1 Reaction scheme of thiazolidinedione-based chalcone 4H-thiopyran, (1) intermediate 1, (2) intermediate 2 or 2′, (3) intermediate 3 or 3′, (4) product 1 or 2. | ||
Synthesis of intermediate 1
The synthesis of the compound (Z)-4-((2,4-dioxothiazolidine-5-ylidene)methyl)benzaldehyde refers to research presented by Kredy et al. (2020).43 The synthesis was carried out by reacting 2,4-thiazolidinedione (468 mg, 4 mmol) with terephthalaldehyde (536 mg, 4 mmol) in 20 mL of glacial acetic acid solvent. Sodium acetate (328 mg, 4 mmol) was then added, and the mixture was stirred for 15 minutes before being refluxed for 7 hours at (110–120)°C.![[double bond, length as m-dash]](https://www.rsc.org/images/entities/char_e001.gif) O), 1703 (C
O), 1703 (C![[double bond, length as m-dash]](https://www.rsc.org/images/entities/char_e001.gif) C), 1602 (C
C), 1602 (C![[double bond, length as m-dash]](https://www.rsc.org/images/entities/char_e001.gif) C aromatic), 1302 (C–N), and 673 (C–S). UV-Vis (nm): 334.
C aromatic), 1302 (C–N), and 673 (C–S). UV-Vis (nm): 334.Synthesis of intermediate 2 and 2′
The synthesis of chalcone compounds from acetophenone and thiazolidinedione (TZD) derivatives refers to research presented by Borade et al. (2020); Narwanti & Aisyah (2022).29,44 The synthesized intermediate 1 (1165 mg, 5 mmol) was reacted with acetophenone (0.58 mL, 5 mmol), CoFe2O4 magnetic nanoparticle catalyst was added with various variations of solvent, reaction time, and catalyst amounts (mol%), and the mixture was homogenized using a magnetic stirrer. The condition for the product with the highest yield was used as the optimal condition for this reaction, which was used for the reaction of other derivatives. The reaction optimization for the synthesis of chalcone-derived compounds is shown in Table 2.![[double bond, length as m-dash]](https://www.rsc.org/images/entities/char_e001.gif) O), 1700 (C
O), 1700 (C![[double bond, length as m-dash]](https://www.rsc.org/images/entities/char_e001.gif) C), 1606 (C
C), 1606 (C![[double bond, length as m-dash]](https://www.rsc.org/images/entities/char_e001.gif) C aromatic), 1302 (C–N), and 673 (C–S). UV-Vis (nm): 347.
C aromatic), 1302 (C–N), and 673 (C–S). UV-Vis (nm): 347.The synthesis of chalcone compounds from 2-acetyl pyridine and thiazolidine (TZD) derivatives refers to research presented by Borade et al. (2020).29 The synthesis of intermediate 1 (1165 mg, 5 mmol) was done with 2-acetyl pyridine (0.56 mL, 5 mmol) added with CoFe2O4 magnetic nanoparticle catalyst under the condition of the highest yields, and the mixture was homogenised using a magnetic stirrer for 2 hours.
![[double bond, length as m-dash]](https://www.rsc.org/images/entities/char_e001.gif) O), 1706 (C
O), 1706 (C![[double bond, length as m-dash]](https://www.rsc.org/images/entities/char_e001.gif) C), 1605 (C
C), 1605 (C![[double bond, length as m-dash]](https://www.rsc.org/images/entities/char_e001.gif) C aromatic), 1562 (C
C aromatic), 1562 (C![[double bond, length as m-dash]](https://www.rsc.org/images/entities/char_e001.gif) N), 1300 (C–N), and 672 (C–S). UV-Vis (nm): 343.
N), 1300 (C–N), and 672 (C–S). UV-Vis (nm): 343.Synthesis of intermediate 3 and 3′
The synthesis of chalcone derivatives through a thionation reaction using Lawesson's reagent will produce thiochalcone compounds referred to in the method used by Durowoju (2018).45 The chalcone derivative of 0.005 mol was added with 0.005 mol (2.02 g) Lawesson's reagent and dissolved in 30 mL anhydrous THF in a round bottom flask and stirred under nitrogen while refluxing at 60 °C. The solution was allowed to be stirred for 2 hours.![[double bond, length as m-dash]](https://www.rsc.org/images/entities/char_e001.gif) O), 1699 (C
O), 1699 (C![[double bond, length as m-dash]](https://www.rsc.org/images/entities/char_e001.gif) C), 1604 (C
C), 1604 (C![[double bond, length as m-dash]](https://www.rsc.org/images/entities/char_e001.gif) C aromatic), 1188 (C–N), 998 (C
C aromatic), 1188 (C–N), 998 (C![[double bond, length as m-dash]](https://www.rsc.org/images/entities/char_e001.gif) S), and 576 (C–S). UV-Vis (nm): 220.
S), and 576 (C–S). UV-Vis (nm): 220.![[double bond, length as m-dash]](https://www.rsc.org/images/entities/char_e001.gif) O), 1702 (C
O), 1702 (C![[double bond, length as m-dash]](https://www.rsc.org/images/entities/char_e001.gif) C), 1601 (C
C), 1601 (C![[double bond, length as m-dash]](https://www.rsc.org/images/entities/char_e001.gif) C aromatic), 1507 (C
C aromatic), 1507 (C![[double bond, length as m-dash]](https://www.rsc.org/images/entities/char_e001.gif) N), 1176 (C–N), 999 (C
N), 1176 (C–N), 999 (C![[double bond, length as m-dash]](https://www.rsc.org/images/entities/char_e001.gif) S), and 557 (C–S). UV-Vis (nm): 225.
S), and 557 (C–S). UV-Vis (nm): 225.Synthesis of product 1 and 2
The synthesis of 4H-thiopyran-derived compounds via the thia-Diels–Alder reaction done referring to the method used by Mlostoń et al. (2018).38 Firstly, 0.005 mol of the synthesised thiochalcone-derived compound was reacted with 0.005 mol of 1,4-naphthoquinone dissolved in 15 mL of anhydrous THF in a round bottom flask. After that, the mixture was refluxed at 60 °C for 2 hours.![[double bond, length as m-dash]](https://www.rsc.org/images/entities/char_e001.gif) O), 1700 (C
O), 1700 (C![[double bond, length as m-dash]](https://www.rsc.org/images/entities/char_e001.gif) C), 1606 (C
C), 1606 (C![[double bond, length as m-dash]](https://www.rsc.org/images/entities/char_e001.gif) C aromatic), 1184 (C–N), and 555 (C–S). UV-Vis (nm): 331. LC (minute): 17.255. HRMS (ESI-TOF) calcd for C29H19NO4S2 [M + H]+: 510.0834, found 510.0879.
C aromatic), 1184 (C–N), and 555 (C–S). UV-Vis (nm): 331. LC (minute): 17.255. HRMS (ESI-TOF) calcd for C29H19NO4S2 [M + H]+: 510.0834, found 510.0879.![[double bond, length as m-dash]](https://www.rsc.org/images/entities/char_e001.gif) O), 1700 (C
O), 1700 (C![[double bond, length as m-dash]](https://www.rsc.org/images/entities/char_e001.gif) C), 1600 (C
C), 1600 (C![[double bond, length as m-dash]](https://www.rsc.org/images/entities/char_e001.gif) C aromatic), 1505 (C
C aromatic), 1505 (C![[double bond, length as m-dash]](https://www.rsc.org/images/entities/char_e001.gif) N), 1180 (C–N), and 554 (C–S). UV-Vis (nm): 332. LC (minute): 16.397. HRMS (ESI-TOF) calcd for C29H19NO4S2 [M + H]+: 511.0786, found 511.0721.
N), 1180 (C–N), and 554 (C–S). UV-Vis (nm): 332. LC (minute): 16.397. HRMS (ESI-TOF) calcd for C29H19NO4S2 [M + H]+: 511.0786, found 511.0721.Recyclability tests of catalyst
The catalyst was extracted from the mixture using an external magnet and subsequently rinsed multiple times with ethyl acetate. The catalyst was subsequently isolated, filtered, dried using evaporation, and reused for five cycles.Antioxidant activity test
![[thin space (1/6-em)]](https://www.rsc.org/images/entities/char_2009.gif) :
:![[thin space (1/6-em)]](https://www.rsc.org/images/entities/char_2009.gif) 1
1![[thin space (1/6-em)]](https://www.rsc.org/images/entities/char_2009.gif) :
:![[thin space (1/6-em)]](https://www.rsc.org/images/entities/char_2009.gif) 1, resulting in a homogeneous mixture. The mixture was incubated in a dark room for 30 minutes, followed by the evaluation of the absorbance using a UV-Vis spectrophotometer at 517 nm. The percentage of inhibition (%) was calculated using the provided equation.46
1, resulting in a homogeneous mixture. The mixture was incubated in a dark room for 30 minutes, followed by the evaluation of the absorbance using a UV-Vis spectrophotometer at 517 nm. The percentage of inhibition (%) was calculated using the provided equation.46
 | (1) |
The regression equation derived from extrapolating the extract concentrations (X-axis) against the percentage of radical scavenging activities (Y-axis) was utilized to determine the 50% inhibitory concentration (IC50).47 Table 1 categorizes the intensity of antioxidant activity based on the IC50 values.48
| Intensity of IC50 | Value (μg mL−1) |
|---|---|
| Very active | <50 |
| Strong | 50–100 |
| Moderate | 101–250 |
| Weak | 250–500 |
| Inactive | >500 |
BDE (bond dissociation enthalpy) parameter
In this study, we used a machine-learning derived, fast, accurate bond dissociation enthalpy tool (ALFABET) to predict homolytic BDEs with sub-second computational cost and close to chemical accuracy. The tool replicates the results of much more expensive DFT calculations and is used to predict the dominant radicals. ALFABET successfully predicted the bond dissociation energies (BDEs) for all the bonds in the molecule in less than 1 millisecond per molecule.49ALFABET is a machine learning tool that accurately calculates the bond dissociation enthalpy. It uses a 2D graph representation of molecules, encoding atoms and bonds as nodes and edges. The tool achieved an MAE of 0.58 kcal mol−1 (vs. an M06-2X/def2-TZVPP oracle) for BDEs of organic molecules with H, O, C, and N atoms using a message-passing graph-convolutional neural network (GNN). It has found utility in multiple applications. The use of rapid and accurate predictions of bond dissociation energies (BDEs) has facilitated the application of machine learning (ML) to various domains of chemistry, such as biological metabolism and combustion chemistry. This package provides a command-line interface to access web-based model predictions at https://bde.ml.nrel.gov. For most compounds, mean absolute errors (MAE) are typically less than 1 kcal mol−1. The neighbors link can display the reference DFT-calculated bond dissociation energies (BDEs) used for training of any predicted bond.50
Results and discussion
Phytochemical test of petai peel extract (PPE)
The PPE showed significant positive phytochemical results (Fig. 2). These results were confirmed by color changes or the presence of foam. The extracts contained secondary metabolites such as alkaloids, saponins, polyphenols, and tannins.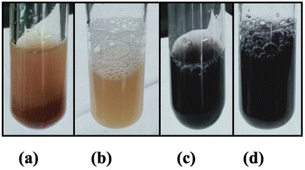 | ||
| Fig. 2 Phytochemical test of petai peel extract, (a) alkaloids (+), (b) saponins (+), (c) polyphenols (+), (d) tannins (+). | ||
On metal surfaces, the current compounds exhibit steric hindrance effects and hydrophobic properties. The surface hydrophobicity of the material is primarily influenced by the following factors: materials with low surface energy exhibit a hydrophobic character and repel water.51 Furthermore, the surface roughness can enhance the hydrophobic properties.52 During the synthesis process, metal particle agglomeration can be avoided, and particle growth can be regulated with the use of steric exclusion.53 The active compounds in plant extracts can function as capping and reducing agents to generate nanoparticles with a small size.54
FTIR spectroscopy of nanoparticles
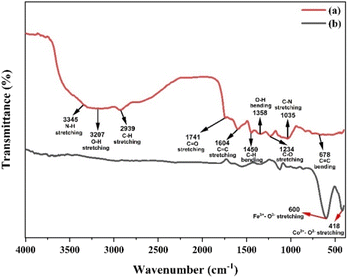
Fig. 3 illustrates the FTIR vibration bands of petai peel extract and CoFe2O4 magnetic nanoparticles. The identification of functional groups in Fig. 3(a) is based on the wavenumber range adapted from Parajuli et al. (2022).55 Fig. 3(a) illustrates the functional groups of the FTIR spectra, which have been identified as constituents of secondary metabolites, including alkaloids, saponins, flavonoids, tannins, and polyphenols. Fig. 3(b) illustrates a shift in the wavenumber from the petai peel extract to CoFe2O4 magnetic nanoparticles, with some of the petai peel extract peaks disappearing in the nanoparticles.The presence of –OH stretching suggests the existence of adsorbed ligands on the nanoparticle surface through non-covalent forces, electrostatic interactions, hydrogen bonds, and hydrophobic interactions. The interaction between the –OH functional group and the metal implies metal reduction due to the presence of electron pairs conjugated to the –OH functional group. The functional groups that remain also act as capping agents, preventing agglomeration and resulting in stronger particle stability and homogeneity of particle size for the CoFe2O4 magnetic nanoparticles. These findings suggest that the synthesis of CoFe2O4 magnetic nanoparticles using petai peel extract was successful.39,54,56
The FTIR spectrum of ferrite indicates the presence of a single-phase spinel structure with tetrahedral and octahedral sites. This is shown by the wavenumber in the range of 400–600 cm−1. Specifically, the wavenumber at 600 cm−1 corresponds to the vibrations of metal–oxygen bonds in the tetrahedral (Fe3+–O2−) site, while the absorption band at 418 cm−1 corresponds to the vibrations of metal–oxygen bonds in the octahedral (Co2+–O2−) site, as shown in Fig. 3(b).57
XRD pattern of nanoparticles
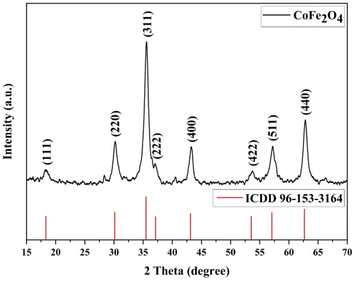
The XRD analysis results for CoFe2O4 magnetic nanoparticles are presented in Fig. 4. The CoFe2O4 magnetic nanoparticles exhibit peaks at 2θ (15–70)° with specific 2θ of 18.35°, 30.19°, 35.58°, 37.04°, 43.26°, 53.74°, 57.25°, and 62.81°. These angles correspond to the hkl values of (111), (220), (311), (222), (400), (422), (511), and (440), respectively, which match with ICDD card no. 96-153-3164.58The analysis confirms the formation of a single-phase cubic spinel structure of CoFe2O4 ferrite with the Fd![[3 with combining macron]](https://www.rsc.org/images/entities/char_0033_0304.gif) m space group.59 The crystallite size of MNPs can be calculated using the Debye–Scherrer equation as follows.
m space group.59 The crystallite size of MNPs can be calculated using the Debye–Scherrer equation as follows.
 | (2) |
The calculated average crystallite size of CoFe2O4 is 8.94 nm, confirming the nanocrystalline nature of the prepared CoFe2O4 magnetic nanoparticles. This result is consistent with Kumar et al. (2022), which reported an average crystallite size of less than 10 nm.61
VSM analysis of nanoparticles
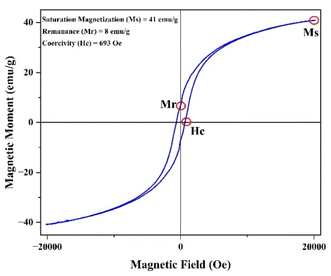
The magnetic properties of CoFe2O4 nanoparticles were studied using the pulsed field hysteresis loop tracing method at room temperature. The M–H plot for CoFe2O4 magnetic nanoparticles is shown in Fig. 5. Based on the hysteresis curve, the saturation magnetization (Ms) value is 41 emu g−1, the remanence (Mr) value is 8 emu g−1, and the coercivity (Hc) value is 693 Oe. Materials with a coercivity greater than 10 kA m−1 (126.6637 Oe) are classified as hard magnets. Therefore, the CoFe2O4 magnetic nanoparticles are also classified as hard magnets due to their coercivity value of 693 Oe, which is greater than 10 kA m−1.62According to the data on M–H loops, the squareness ratio value (SQR) is 0.2, the magnetic moment (nB) is 1.7 μb, and the anisotropy constant (K) is 2.96 × 10⁴. These values were calculated using the equation as follows.63,64
 | (3) |
 | (4) |
 | (5) |
UV-DRS data of nanoparticles
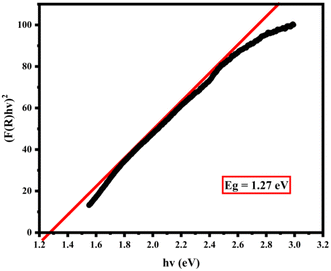
The energy band gap reveals the optical and electrical properties of a nanoparticle. Fig. 6 shows the results of the energy band gap in the CoFe2O4 magnetic nanoparticles. The results indicate that the CoFe2O4 magnetic nanoparticles are semiconductors as they possess a value of 1.27 eV. This statement is consistent with the results of Benlembarek et al. (2022), which suggests that the semiconductor band gap is 1.27 eV.65FESEM image of nanoparticles
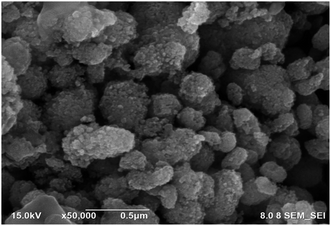
Fig. 7 shows the surface morphology of a CoFe2O4 magnetic nanoparticle at 500![[thin space (1/6-em)]](https://www.rsc.org/images/entities/char_2009.gif) 00× magnification, confirming its cubic shape. This is further supported by Sivagurunathan & Gibin's (2016) report on the surface morphology of nano-sized cobalt ferrite particles using the co-precipitation method, which showed a cubic structure under FESEM.66 According to Fig. 7, the FESEM images reveal the appearance of agglomerated areas due to magnetic dipole–dipole interactions67,68 as well as the natural interaction between the magnetic nanoparticles and the thermal process.64,69
00× magnification, confirming its cubic shape. This is further supported by Sivagurunathan & Gibin's (2016) report on the surface morphology of nano-sized cobalt ferrite particles using the co-precipitation method, which showed a cubic structure under FESEM.66 According to Fig. 7, the FESEM images reveal the appearance of agglomerated areas due to magnetic dipole–dipole interactions67,68 as well as the natural interaction between the magnetic nanoparticles and the thermal process.64,69
EDX analysis of nanoparticles
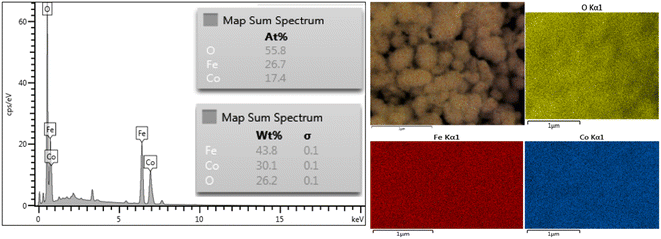
The energy dispersive X-ray (EDX) spectroscopy analysis confirms the presence of cobalt (Co), oxygen (O), and iron (Fe) elements in the samples, as shown in Fig. 8. The weight percent values of Co, Fe, and O elements are 30.1%, 43.8%, and 26.2%, respectively. Based on the atomic percent (at%) results, the composition of the nanoparticle is Co, Fe, and O. This analysis indicates that the structure of magnetic nanoparticles contains 17.4% cobalt, 26.7% iron, and 55.8% oxygen atoms. The atomic ratio of Co![[thin space (1/6-em)]](https://www.rsc.org/images/entities/char_2009.gif) :
:![[thin space (1/6-em)]](https://www.rsc.org/images/entities/char_2009.gif) Fe
Fe![[thin space (1/6-em)]](https://www.rsc.org/images/entities/char_2009.gif) :
:![[thin space (1/6-em)]](https://www.rsc.org/images/entities/char_2009.gif) O is 2.4
O is 2.4![[thin space (1/6-em)]](https://www.rsc.org/images/entities/char_2009.gif) :
:![[thin space (1/6-em)]](https://www.rsc.org/images/entities/char_2009.gif) 3.8
3.8![[thin space (1/6-em)]](https://www.rsc.org/images/entities/char_2009.gif) :
:![[thin space (1/6-em)]](https://www.rsc.org/images/entities/char_2009.gif) 7.9, which closely matches the actual ratio of 1
7.9, which closely matches the actual ratio of 1![[thin space (1/6-em)]](https://www.rsc.org/images/entities/char_2009.gif) :
:![[thin space (1/6-em)]](https://www.rsc.org/images/entities/char_2009.gif) 2
2![[thin space (1/6-em)]](https://www.rsc.org/images/entities/char_2009.gif) :
:![[thin space (1/6-em)]](https://www.rsc.org/images/entities/char_2009.gif) 4. Based on this data, it is expected that the resulting compound is CoFe2O4.
4. Based on this data, it is expected that the resulting compound is CoFe2O4.
TEM, HR-TEM, and SAED images of nanoparticles
The TEM images in Fig. 9(a) reveal that the cobalt ferrite magnetic nanoparticles have a cubic morphology70 with an average size distribution of 37.67 nm is presented in Fig. 9(b), consistent with the particle size range of 2–50 nm reported by Thakur et al. (2022) and the 20–40 nm range reported by Jayalakshmi & Jeyanthi (2018).71,72 Meanwhile, the HR-TEM results shown in Fig. 9(c) have a d-spacing value of 0.253 nm, which corresponds to the (311) plane according to ICDD card data 96-153-3164. The SAED pattern's bright circles indicate the polycrystalline nature of CoFe2O4, which closely matches the crystallographic planes (111), (220), (311), (222), (400), (422), (511), and (440). These planes have interplanar distances of 4.99, 3.06, 2.58, 2.15, 1.97, 1.81, 1.66, and 1.53 Å, respectively (Fig. 9(d)).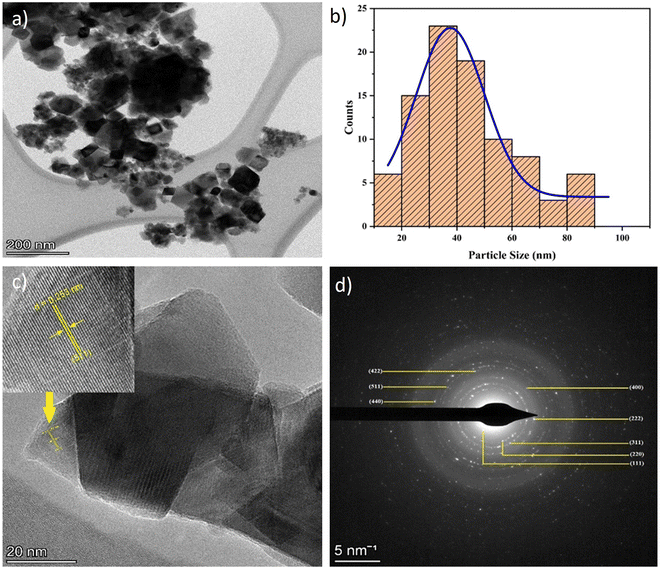 | ||
| Fig. 9 (a) TEM image, (b) particle size distribution curve, (c) HR-TEM image, and (d) SAED pattern of CoFe2O4 magnetic nanoparticles. | ||
Evaluation of the synthesis of organic compounds
Fig. S1(a)† presents the FTIR spectrum results for the synthesis of intermediate 1. Based on the acquired wavenumber data, specifically the identification of C–H sp2 aldehyde and C![[double bond, length as m-dash]](https://www.rsc.org/images/entities/char_e001.gif) C aromatic bonds at 2778 cm−1 and 1602 cm−1, respectively, it may be deduced that the synthesized molecule has been effectively synthesized. Fig. S1(b)† displays the UV-Vis characterization results for compound intermediate 1 and its reactants. The product intermediate 1 clearly demonstrates a noticeable peak in absorption, which is distinct from the absorption levels observed in its two precursors.
C aromatic bonds at 2778 cm−1 and 1602 cm−1, respectively, it may be deduced that the synthesized molecule has been effectively synthesized. Fig. S1(b)† displays the UV-Vis characterization results for compound intermediate 1 and its reactants. The product intermediate 1 clearly demonstrates a noticeable peak in absorption, which is distinct from the absorption levels observed in its two precursors.
Fig. S8† illustrates the Knoevenagel condensation reaction, which is employed in the synthesis of intermediate 1. This plausible mechanism highlights the essential steps of enolate formation, nucleophilic attack leading to the formation of an alkoxide intermediate, protonation to form a β-hydroxy thiazolidinedione intermediate, and dehydration to yield the desired Knoevenagel condensation product, which features a conjugated double bond in the thiazolidinedione moiety.73
The FTIR spectra data for the synthesis of intermediate 2 is displayed in Fig. S2(a).† By analyzing the wavenumber data, specifically the identification of C–H sp2 alkenes from α,β-unsaturated bonds at 3025 cm−1, it may be inferred that the synthesized molecule has been successfully synthesized. Fig. S2(b)† displays the UV-Vis characterization results for intermediate 2 and its reactants. Intermediate 2 product exhibits a distinct peak at 347 nm, which differs from the absorption rates reported in its two reactants.
Fig. S3(a)† displays the FTIR spectra data for the synthesis of intermediate 2′. By analyzing the wavenumber data, it can be seen that the formation of chalcone compounds is indicated by the identification of C–H sp2 alkenes from α,β-unsaturated bonds at 3028 cm−1. Furthermore, the presence of C![[double bond, length as m-dash]](https://www.rsc.org/images/entities/char_e001.gif) N groups at 1562 cm−1 indicates the presence of bound pyridine compounds. Fig. S3(b)† presents the UV-Vis characterization results for intermediate 2′ and its reactants. Intermediate 2′ product exhibits a distinct absorption peak at 343 nm, which differs from the absorption levels reported for the two reactants.
N groups at 1562 cm−1 indicates the presence of bound pyridine compounds. Fig. S3(b)† presents the UV-Vis characterization results for intermediate 2′ and its reactants. Intermediate 2′ product exhibits a distinct absorption peak at 343 nm, which differs from the absorption levels reported for the two reactants.
Fig. S9† illustrates the plausible mechanism of intermediate 2 and 2′ synthesis via Claisen–Schmidt condensation, facilitated by a Lewis acid. The Lewis acid CoFe2O4 coordinates with the carbonyl oxygen of the aldehyde, facilitating the nucleophilic attack by the enol form of acetophenone. The mechanism begins with the tautomerization of acetophenone to its enol form, which then nucleophilically attacks the activated aldehyde, resulting in the formation of an alkoxide intermediate. This subsequently undergoes dehydration to yield the chalcone product.73
Fig. S4(a)† presents the FTIR spectra data pertaining to the synthesis of intermediate 3. Upon evaluating the wavenumber data, it is evident that the compound was formed, as shown in the presence of C![[double bond, length as m-dash]](https://www.rsc.org/images/entities/char_e001.gif) S at 998 cm−1. Fig. S4(b)† presents the UV-Vis characterization data for intermediate 3 and its reactants. Intermediate 3 product has a prominent absorption peak at 220 nm, which is unique from the absorption values observed for both reactants.
S at 998 cm−1. Fig. S4(b)† presents the UV-Vis characterization data for intermediate 3 and its reactants. Intermediate 3 product has a prominent absorption peak at 220 nm, which is unique from the absorption values observed for both reactants.
Fig. S5(a)† displays the FTIR spectra data for the synthesis of intermediate 3′. By analyzing the wavenumber data, it can be seen that the formation of the thiochalcone compound is indicated by the identification of C![[double bond, length as m-dash]](https://www.rsc.org/images/entities/char_e001.gif) S at 999 cm−1. Furthermore, the presence of the C
S at 999 cm−1. Furthermore, the presence of the C![[double bond, length as m-dash]](https://www.rsc.org/images/entities/char_e001.gif) N group at 1507 cm−1 indicates the presence of the bound pyridine compound. Fig. S2(b)† presents the UV-Vis characterization results for intermediate 3′ and its reactants. The product intermediate 3′ exhibits a distinct absorption peak at 225 nm, which differs from the absorption levels reported for the two reactants.
N group at 1507 cm−1 indicates the presence of the bound pyridine compound. Fig. S2(b)† presents the UV-Vis characterization results for intermediate 3′ and its reactants. The product intermediate 3′ exhibits a distinct absorption peak at 225 nm, which differs from the absorption levels reported for the two reactants.
Fig. S10† illustrates the plausible mechanism reaction for synthesizing intermediates 3 and 3′. This reaction involves the thermal decomposition of Lawesson's reagent, which produces two reactive dithiophosphine ylides. These ylides then undergo a series of reactions, including the formation of thioketone intermediates, the replacement of oxygen atoms with sulfur, and the formation of intermediates. Finally, the intermediate eliminates the phosphorus-containing by-product, yielding thiochalcone as the final product.73
Fig. S6(a)† depicts the FTIR spectra data for the synthesis of product 1. Upon the analysis of the wavenumber data, it can be observed that the presence of a C–H sp3 peak at 2845 cm−1 indicates that cyclization has occurred, resulting in the formation of a 4H-thiopyran compound. Fig. S6 (b)† displays the UV-Vis characterization results for product 1 and its reactants. Product 1 exhibits a distinct absorption peak at a wavelength of 331 nm, which differs from the absorption levels reported for the two reactants. In addition, Fig. S6(c)† demonstrates the presence of an LC chromatogram peak at a retention time of 17.255 minutes. The corresponding mass spectrum shows an m/z value of 510.0879, which is present in the area with the highest abundance, accounting for 48.05% of the whole area. Theoretically, the product compound 1 (C29H20NO4S2) has a [M + H]+ value of 510.0834. Given that the m/z value recorded in the HRMS spectrum is in close proximity to the theoretical value, it can be posited that product compound 1 was indeed formed.
Fig. S7(a)† displays the FTIR spectra data for the synthesis of product 2. By analyzing the wavenumber data, it can be seen that cyclization has occurred to form a 4H-thiopyran compound, as indicated by the identification of C–H sp3 at 2841 cm−1. Additionally, the presence of a C![[double bond, length as m-dash]](https://www.rsc.org/images/entities/char_e001.gif) N group at 1505 cm−1 indicates the presence of a bound pyridine compound. Fig. S7(b)† displays the UV-Vis characterization results for product 2 and its reactants. Product 2 exhibits a distinct absorption peak at a wavelength of 332 nm, which differs from the absorption levels observed for both reactants. Fig. S7(c)† illustrates the presence of an LC chromatogram peak at a retention time of 16.397 minutes with an m/z value in the mass spectrum of 511.0721, which is observed in the largest abundance region (% area) of 46.05%. Theoretically, the product compound 2 (C28H19N2O4S2) has an [M + H]+ value of 511.0786. Given that the m/z value recorded in the mass spectrum is in close proximity to the theoretical value, it can be posited that product compound 2 was formed.
N group at 1505 cm−1 indicates the presence of a bound pyridine compound. Fig. S7(b)† displays the UV-Vis characterization results for product 2 and its reactants. Product 2 exhibits a distinct absorption peak at a wavelength of 332 nm, which differs from the absorption levels observed for both reactants. Fig. S7(c)† illustrates the presence of an LC chromatogram peak at a retention time of 16.397 minutes with an m/z value in the mass spectrum of 511.0721, which is observed in the largest abundance region (% area) of 46.05%. Theoretically, the product compound 2 (C28H19N2O4S2) has an [M + H]+ value of 511.0786. Given that the m/z value recorded in the mass spectrum is in close proximity to the theoretical value, it can be posited that product compound 2 was formed.
Fig. S11† shows that the plausible mechanism of the thia-Diels–Alder reaction, which results in the formation of product 1 and 2, involves the cyclic movement of electron pairs. This process entails the breaking of three π bonds and the formation of two σ bonds and one π bond (specifically, the π electrons of the conjugated diene system in thiochalcone interaction with the π electrons of the 1,4-naphthoquinone, leading to a [4 + 2] cycloaddition reaction).73
The catalytic performance of green catalyst CoFe2O4 for the synthesis of chalcone
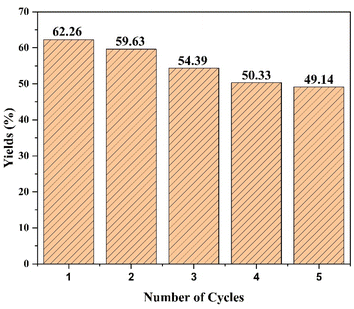
The catalytic performance of CoFe2O4 magnetic nanoparticles using PPE was evaluated in the synthesis of chalcone. Several parameters were adjusted to optimize the yield, including the type of solvent, reaction time, and catalyst amount of CoFe2O4, as outlined in Table 2. The optimum conditions for the reaction were obtained applying ethanol as the solvent, 2 hours reaction time, and 5 mol% of catalyst amounts, resulting in a yield of 62.26%. Ethanol solvent is the most appropriate choice compared to other solvent variations because it offers effective solvation, moderate polarity (allowing interaction with both polar and non-polar groups), and a lower reflux temperature than water, ensuring superior thermal stability.74,75 Under the same conditions, the yield achieved with the catalyst was nearly two times greater than that obtained without it, which yielded only 36.5%.| Entry | Solvent type | Reaction time (h) | Catalyst amounts of CoFe2O4 (mol%) | Yields (%) |
|---|---|---|---|---|
| 1 | Solvent-free | 2 | 5 | 45.56 |
| 2 | Water | 2 | 5 | 58.20 |
| 3 | Ethanol![[thin space (1/6-em)]](https://www.rsc.org/images/entities/char_2009.gif) : :![[thin space (1/6-em)]](https://www.rsc.org/images/entities/char_2009.gif) water (1 water (1![[thin space (1/6-em)]](https://www.rsc.org/images/entities/char_2009.gif) : :![[thin space (1/6-em)]](https://www.rsc.org/images/entities/char_2009.gif) 1) 1) |
2 | 5 | 59.40 |
| 4 | Ethanol | 1 | 5 | 47.95 |
| 5 | Ethanol | 2 | 5 | 62.26 |
| 6 | Ethanol | 4 | 5 | 55.58 |
| 7 | Ethanol | 6 | 5 | 57.01 |
| 8 | Ethanol | 8 | 5 | 43.17 |
| 9 | Ethanol | 2 | — | 36.50 |
| 10 | Ethanol | 2 | 2.5 | 58.44 |
| 11 | Ethanol | 2 | 7.5 | 51.29 |
| 12 | Ethanol | 2 | 10 | 58.68 |
The evaluation of the stability, repeatability, and ease of catalyst recovery from a reaction of a heterogeneous catalyst is contingent upon its frequency of reuse. The cobalt ferrite catalyst has been reused through the synthesis of the chalcone compound under optimal conditions, involving 5 mol% of catalyst at reflux condition for two hours with ethanol as the solvent. After each run of reactions, the catalyst was washed using ethyl acetate, extracted, and filtered. Finally, it was dried by evaporation. The product yield over five consecutive reaction runs is displayed in Fig. 10, which shows that cobalt ferrite maintained its high catalytic activity. The yield decrease was insignificant, demonstrating the stability of the catalyst. This is supported by the XRD results shown in Fig. 11, which demonstrate the structural stability after the reuse of CoFe2O4 magnetic nanoparticles for 5 cycles. The decrease in the yield observed during the reaction may be due to the minimal loss of cobalt ferrite during the washing and separation steps.
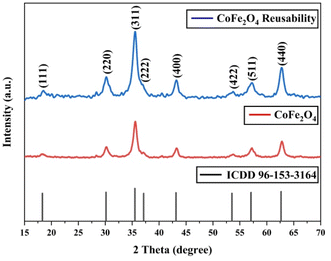 | ||
| Fig. 11 XRD patterns for CoFe2O4 reusability, CoFe2O4 magnetic nanoparticles, and reference of ICDD card 96-153-3164. | ||
The antioxidant activity of organic compounds
Table 3 shows the antioxidant activity data obtained from the DPPH method and the BDE parameter. The sample's donation of antioxidant proton reduced the violet appearance of DPPH, producing 1,1-diphenyl-2-picrylhydrazine with a yellow appearance.47 The results showed that all compounds had antioxidant ability but at different inhibition percentages, as shown in Table 3. The regression equation determined from the curves was used to calculate the IC50 value that represents the sample concentration needed to reduce DPPH by 50%. The IC50 value of each compound is shown in Table 3. The order of antioxidant activities progressed as follows: product 2 > product 1 > intermediate 2′ > intermediate 2 > reactant, as suggested by the IC50 values in the order of reactant > intermediate 2 > intermediate 2′ > product 1 > product 2. Based on the IC50 values, product 2 was categorized as a strong antioxidant, while product 1, intermediate 2′, and intermediate 2 showed moderate antioxidant activity, and the reactant showed weak antioxidant activity.Based on the results of the DPPH test, it can be concluded that all organic compounds in Table 3 exhibit antioxidant activity due to the presence of secondary N–H groups, which act as proton or hydrogen (H) donors. However, both product 1 and product 2 demonstrate superior antioxidant activity compared to the intermediate compounds and their reactants. The final product compound has a carbon atom located between the sulfur atom and the carbonyl group of the 1,4-naphthoquinone compound, also known as the benzo[g]chromene group. This positioning causes an induction effect, attracting the electron density on the carbon atom towards the carbonyl group and sulfur atom. As a result, the hydrogen atom on the carbon atom is easily broken by the oxidation reaction with DPPH.38 According to Smith (2011), product 2 is superior to product 1 due to the presence of pyridine groups, which have a stronger electron donor activation strength than phenyl groups.73
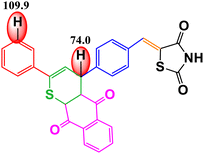
The DPPH method was used to measure the antioxidant activity, and the results were supported by the BDE value (enthalpy of bond dissociation), which is another parameter for measuring the antioxidant activity, as shown in Table 3. Trung et al. (2022) define BDE as the change in the enthalpy resulting from the homolytic cleavage of a particular bond.76 This characteristic is important for assessing the reactivity of compounds, such as their antioxidant activity. Almehizia et al. (2019) also reported that BDE is a crucial parameter for evaluating the ability of molecules to lose hydrogen atoms.77 Compounds with lower bond dissociation energy (BDE) break the X–H bonds more easily, making them strong antioxidants. The primary antioxidant activity is determined by the compound's ability to donate hydrogen to free radicals. Therefore, there is a relationship between antioxidant activity and BDE. The results of this study show that the BDE energy values follow the order: product 2 < product 1 < intermediate 2′ < intermediate 2 < reactant. Therefore, it can be concluded that product 2 has the strongest antioxidant activity due to its lowest BDE value, which is also supported by the lowest IC50 value in the DPPH method. This proves that the BDE parameter can be used to predict antioxidant activity in a new compound.78
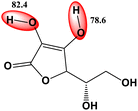
As positive controls, ascorbic acid (vitamin C) and vitamin E, both well-known antioxidants, were used. Table 4 shows that vitamins C and E have very active antioxidant intensity, with an IC50 value of less than 50. This is due to the presence of OH groups, and the more groups there are, the stronger the antioxidant activity, in accordance with the statement by Lončarić et al. (2022).79 Therefore, the IC50 value of vitamin C is much lower than that of all other compounds, because it has more hydroxyl groups.
Conclusions
The research results indicate that petai peel extract (Parkia speciosa Hassk) can serve as a reducing and capping agent in the synthesis of CoFe2O4 magnetic nanoparticles. This is supported by the FTIR results, which exhibit peaks for Co2+–O2− stretching (418 cm−1) and Fe3+–O2− stretching (600 cm−1). Furthermore, all characterization results demonstrate that the synthesized CoFe2O4 has nanoparticle size and possesses magnetic, optical, and electrical properties. The nanoparticles synthesized exhibit a cubic morphology with an average particle size of 37.67 nm. The XRD characterization results confirm that the crystal structure is cubic, with an average crystallite size of 8.94 nm. The VSM characterization results demonstrate the existence of magnetic properties with Ms (41 emu g−1), Mr (8 emu g−1), and Hc (693 Oe). The UV-DRS results demonstrate the existence of optical and electrical properties, indicating that the material is a semiconductor with a band gap value of approximately 1.27 eV. The optimal conditions for chalcone synthesis were achieved using 5 mol% of CoFe2O4 catalyst in ethanol at reflux conditions for 2 hours, resulting in a catalytic activity with yields of 62.26%. This magnetic nanoparticle catalyst can be used for 5 cycles without a significant loss of yield. The 4H-thiopyran 2-acetyl pyridine variant (product 2), exhibited the strongest antioxidant activity with an IC50 value of 90.80 μg mL−1, placing it in the strong antioxidant category. This is supported by the low bond dissociation enthalpy (BDE) energy values of the C–H groups of benzo[g]thiochromene and pyridine, which are 74.0 kcal mol−1 and 105.1 kcal mol−1, respectively, indicating superior antioxidant properties when the BDE energy values are low. This study successfully developed an environment-friendly synthesis method using a green catalyst. The results demonstrated that the synthesized organic compounds exhibited significant antioxidant potential in overcoming oxidative stress, indicating its potential as an effective and sustainable therapeutic agent.Data availability
The authors confirm that the data supporting the findings of this study are available within the article and its ESI.†Authors contribution
Aida Nadia: main contributor in this manuscript who did data curation, formal analysis, investigation, methodology, validation, visualization, and writing (original draft). Antonius Herry Cahyana: main contributor in this manuscript who did conceptualization, funding acquisition, project administration, resources, supervision, validation, visualization, writing (original draft), and writing (review & editing). Dicky Annas: main contributor in this manuscript who did conceptualization, funding acquisition, project administration, resources, supervision, validation, visualization, writing (original draft), and writing (review & editing). Mohammad Jihad Madiabu: data curation and validation. Bayu Ardiansah: validation and writing (review & editing).Conflicts of interest
There are no conflicts to declare.Acknowledgements
The authors acknowledge financial support from Universitas Indonesia through the grant of Program Hibah Publikasi Terindeks Internasional (PUTI) Q1 Tahun Anggaran 2024–2025 [contract number: NKB-383/UN2.RST/HKP.05.00/2024]. We also would like to express our gratitude to Professor Sang Kook Woo from Department of Chemistry, Pusan National University for his invaluable contribution as a scientific consultant for the catalyst in this study.References
- L. Horev-Azaria, G. Baldi, D. Beno, D. Bonacchi, U. Golla-Schindler, J. C. Kirkpatrick, S. Kolle, R. Landsiedel, O. Maimon, P. N. Marche, J. Ponti, R. Romano, F. Rossi, D. Sommer, C. Uboldi, R. E. Unger, C. Villiers and R. Korenstein, Part. Fibre Toxicol., 2013, 10, 1–17 CrossRef PubMed.
- N. Senthilkumar, P. K. Sharma, N. Sood and N. Bhalla, Coord. Chem. Rev., 2021, 445, 1–23 CrossRef.
- A. Ali, T. Shah, R. Ullah, P. Zhou, M. Guo, M. Ovais, Z. Tan and Y. K. Rui, Front. Chem., 2021, 9, 1–25 CAS.
- M. A. El Aleem Ali El-Remaily, A. M. Abu-Dief and R. M. El-Khatib, Appl. Organomet. Chem., 2016, 30, 1022–1029 CrossRef.
- T. I. Shabatina, O. I. Vernaya, V. P. Shabatin and M. Y. Melnikov, Magnetochemistry, 2020, 6, 1–18 CrossRef.
- M. Qayoom, R. Bhat, K. Asokan, M. A. Shah and G. N. Dar, J. Mater. Sci. Mater. Electron., 2020, 31, 8268–8282 CrossRef CAS.
- S. B. Kale, S. B. Somvanshi, M. N. Sarnaik, S. D. More, S. J. Shukla and K. M. Jadhav, AIP Conf. Proc., 2018, 1953, 030193 CrossRef.
- E. Fitriyanti, Utari and B. Purnama, J. Phys.: Conf. Ser., 2017, 909, 1–5 CrossRef.
- P. D. Prasad and J. Hemalatha, J. Magn. Magn. Mater., 2019, 484, 225–233 CrossRef.
- M. Demirelli, E. Karaoǧlu, A. Baykal, H. Sozeri and E. Uysal, J. Alloys Compd., 2014, 582, 201–207 CrossRef CAS.
- T. Tatarchuk, M. Liaskovska, V. Kotsyubynsky and M. Bououdina, Mol. Cryst. Liq. Cryst., 2018, 672, 54–66 CrossRef CAS.
- S. R. Mokhosi, W. Mdlalose, A. Nhlapo and M. Singh, Pharmaceutics, 2022, 14, 1–26 CrossRef PubMed.
- A. Makofane, P. J. Maake, M. M. Mathipa, N. Matinise, F. R. Cummings, D. E. Motaung and N. C. Hintsho-Mbita, Inorg. Chem. Commun., 2022, 139, 1–16 CrossRef.
- N. K. Sharma, J. Vishwakarma, S. Rai, T. S. Alomar, N. Almasoud and A. Bhattarai, ACS Omega, 2022, 7, 27004–27020 CrossRef CAS PubMed.
- M. Mohammadlou, H. Maghsoudi and H. Jafarizadeh-Malmiri, Int. Food Res. J., 2016, 23, 446–463 CAS.
- F. M. Aldakheel, M. M. E. Sayed, D. Mohsen, M. H. Fagir and D. K. El Dein, Gels, 2023, 9, 1–21 Search PubMed.
- K. A. Altammar, Front. Microbiol., 2023, 14, 01–20 Search PubMed.
- P. B. Santhosh, J. Genova and H. Chamati, Chem, 2022, 4, 345–369 CAS.
- R. Tambun, D. H. Sidabutar and V. Alexander, Int. J. Corros. Scale Inhib., 2020, 9, 929–940 CAS.
- N. N. N. A. Rahman, S. Zhari, M. Z. I. Sarker, S. Ferdosh, M. A. C. Yunus and M. O. A. Kadir, J. Chin. Chem. Soc., 2012, 59, 507–514 CrossRef.
- H. Hasim, D. N. Faridah, D. N. Faridah and D. A. Kurniawati, J. Chem. Pharm. Res., 2015, 7, 239–243 Search PubMed , https://www.jocpr.com.
- P. M. Octasari, O. R. S. Hastuti and F. A. Widyastani, Atl. Press Adv. Soc. Sci. Educ. Humanit. Res., 2021, 535, 643–646 Search PubMed.
- M. Rahmayanti, A. N. Syakina, T. Sulistyaningsih and B. Hastuti, J. Kim. Sains Apl., 2023, 26, 125–132 CrossRef CAS.
- J. R. Sihombing, A. Dharma, Z. Chaidir, Almahdy, E. Fachrial and E. Munaf, J. Chem. Pharm. Res., 2015, 7, 190–196 CAS.
- R. Javed, M. Zia, S. Naz, S. O. Aisida, N. ul Ain and Q. Ao, J. Nanobiotechnol., 2020, 18, 1–15 CrossRef PubMed.
- S. U. R. Qamar and J. N. Ahmad, J. Mol. Liq., 2021, 334, 1–12 CrossRef.
- A. K. Sidhu, N. Verma and P. Kaushal, Front. Nanotechnol., 2022, 3, 1–17 Search PubMed.
- N. Maji and H. S. Dosanjh, Magnetochemistry, 2023, 9, 1–40 CrossRef.
- R. M. Borade, S. B. Somvanshi, S. B. Kale, R. P. Pawar and K. M. Jadhav, Mater. Res. Express, 2020, 7, 1–21 Search PubMed.
- F. Mostaghni and F. Taat, Eurasian Chem. Commun., 2020, 2, 427–432 CrossRef CAS.
- K. K. Senapati and P. Phukan, Bulletin of the Catalysis Society of India, 2011, 9, 1–8 Search PubMed.
- R. Dubey, V. K. Singh, L. K. Sharma, A. Upadhyay, N. Kumar and R. K. P. Singh, New J. Chem., 2017, 41, 7836–7839 RSC.
- H. Kumar, N. Aggarwal, M. G. Marwaha, A. Deep, H. Chopra, M. M. Matin, A. Roy, T. Bin Emran, Y. K. Mohanta, R. Ahmed, T. K. Mohanta, M. Saravanan, R. K. Marwaha and A. Al-Harrasi, Molecules, 2022, 27, 1–40 Search PubMed.
- N. Polish, O. Yaremkevych, N. Marintsova, L. Zhurakhivska, N. Koretska, T. Pokynbroda, N. Liubas, V. Lubenets and E. Karpenko, J. Microbiol. Biotechnol. Food Sci., 2023, 13, 1–5 Search PubMed.
- X. F. Liu, C. J. Zheng, L. P. Sun, X. K. Liu and H. R. Piao, Eur. J. Med. Chem., 2011, 46, 3469–3473 CrossRef CAS PubMed.
- S. A. Lahsasni, F. H. Al Korbi and N. A. A. Aljaber, Chem. Cent. J., 2014, 8, 1–10 CrossRef PubMed.
- E. Elhefny, Phosphorus, Sulfur Silicon Relat. Elem., 2013, 188, 804–811 CrossRef CAS.
- G. Mlostoń, K. Urbaniak, P. Urbaniak, A. Marko, A. Linden and H. Heimgartner, Beilstein J. Org. Chem., 2018, 14, 1834–1839 CrossRef PubMed.
- I. Fatimah, E. Z. Pratiwi and W. P. Wicaksono, Egypt. J. Aquat. Res., 2020, 46, 35–40 CrossRef.
- N. Matinise, K. Kaviyarasu, N. Mongwaketsi, S. Khamlich, L. Kotsedi, N. Mayedwa and M. Maaza, Appl. Surf. Sci., 2018, 446, 66–73 CrossRef CAS.
- N. T. T. Nguyen, L. M. Nguyen, T. T. T. Nguyen, N. H. Nguyen, D. H. Nguyen, D. T. C. Nguyen and T. V. Tran, J. Environ. Manag., 2023, 326, 1–16 Search PubMed.
- V. A. Fabiani, H. Aldila, Anggraeni and Nur'aini, IOP Conf. Ser. Earth Environ. Sci., 2020, 599, 1–6 Search PubMed.
- H. M. Kredy, Z. S. Hassan and M. S. Maqtoof, J. Global Pharma Technol., 2020, 11, 543–549 Search PubMed.
- I. Narwanti and H. A. N. Aisyah, Jurnal Kimia dan Pendidikan Kimia, 2022, 7, 346–358 CrossRef.
- G. Durowoju, Synthesis of Chalcones for Analysis as Anti-microbial Agents, PhD dissertation, Kingston University, 2018.
- A. H. Cahyana, A. R. Liandi, Y. Safitri and R. T. Yunarti, Rasayan J. Chem., 2020, 13, 1491–1497 CrossRef CAS.
- A. Itam, M. S. Wati, V. Agustin, N. Sabri, R. A. Jumanah and M. Efdi, Sci. World J., 2021, 2021, 1–9 CrossRef PubMed.
- Fatmawaty, N. G. M. Anggreni, N. Fadhil and V. D. Prasasty, Biomed. Pharmacol. J., 2019, 12, 661–667 CAS.
- P. C. S. John, Y. Guan, Y. Kim, S. Kim and R. S. Paton, Nat. Commun., 2020, 11, 1–12 CrossRef PubMed.
- S. V. S. Sowndarya, Y. Kim, S. Kim, P. C. S. John and R. S. Paton, Digital Discovery, 2023, 2, 1900–1910 RSC.
- C. Desmet, A. Valsesia, A. Oddo, G. Ceccone, V. Spampinato, F. Rossi and P. Colpo, J. Nanoparticle Res., 2017, 19, 1–17 CrossRef CAS PubMed.
- D. Ponnamma, S. S. Nair, H. Parangusan, M. K. Hassan, S. Adham, A. Karim and M. A. A. Al-Maadeed, Polymers, 2020, 12, 1–15 CrossRef PubMed.
- M. Rahmayanti, A. N. Syakina, I. Fatimah and T. Sulistyaningsih, Chem. Phys. Lett., 2022, 803, 1–8 CrossRef.
- I. S. Saputra, A. H. Saputro, D. O. B. Apriandanu, Y. N. Permana and Y. Yulizar, Chem. Pap., 2022, 76, 4733–4742 CrossRef CAS.
- D. Parajuli, S. Sharma, H. B. Oli, D. S. Bohara, D. P. Bhattarai, A. P. Tiwari and A. P. Yadav, Electrochem, 2022, 3, 416–433 CrossRef CAS.
- K. N. Yusof, S. S. Alias, Z. Harun, H. Basri and F. H. Azhar, ChemistrySelect, 2018, 3, 8881–8885 CrossRef CAS.
- M. Kurian, S. Thankachan, D. S. Nair, A. E. K, A. Babu, A. Thomas and B. K. K. T, J. Adv. Ceram., 2015, 4, 199–205 CrossRef CAS.
- T. A. S. Ferreira, J. C. Waerenborgh, M. H. R. M. Mendonça, M. R. Nunes and F. M. Costa, Solid State Sci., 2003, 5, 383–392 CrossRef CAS.
- A. Franco, P. Banerjee and R. J. S. Lima, J. Mater. Sci. Mater. Electron., 2018, 29, 4357–4364 CrossRef CAS.
- P. K. Dhar, P. Saha, M. K. Hasan, M. K. Amin and M. R. Haque, Clean. Eng. Technol., 2021, 3, 1–8 CrossRef.
- S. Kumar, F. Ahmed, N. M. Shaalan, R. Kumar, A. Alshoaibi, N. Arshi, S. Dalela, F. Sayeed, S. Dwivedi and K. Kumari, Materials, 2022, 15, 1–11 Search PubMed.
- A. A. Paul, Estimation of Magnetic Anisotropy in Ferromagnetic Elements and Their Alloy Powders by the Law of Approach to Saturation (LAS), MSc thesis, University of Michigan-Dearborn, 2020 Search PubMed.
- N. Jahan, M. M. Uddin, M. N. I. Khan, F.-U.-Z. Chowdhury, M. R. Hasan, H. N. Das and M. M. Hossain, J. Mater. Sci. Mater. Electron., 2021, 32, 16528–16543 CrossRef CAS.
- A. M. Mohammad, S. M. A. Ridha and T. H. Mubarak, Dig. J. Nanomater. Biostruct., 2018, 13, 615–623 Search PubMed.
- M. Benlembarek, N. Salhi, R. Benrabaa, A. M. Djaballah, A. Boulahouache and M. Trari, Int. J. Hydrogen Energy, 2022, 47, 9239–9247 CrossRef CAS.
- P. Sivagurunathan and S. R. Gibin, J. Mater. Sci. Mater. Electron., 2016, 27, 8891–8898 CrossRef CAS.
- S. Günter, Nanoparticles: From Theory to Application, Wiley-VCH Verlag, 1st edn, 2004 Search PubMed.
- S. Laurent, S. Dutz, U. O. Häfeli and M. Mahmoudi, Adv. Colloid Interface Sci., 2011, 166, 8–23 CrossRef CAS PubMed.
- Q. A. Pankhurst, J. Connolly, S. K. Jones and J. Dobson, J. Phys. D Appl. Phys, 2003, 36, R167–R181 CrossRef CAS.
- N. Song, S. Gu, Q. Wu, C. Li, J. Zhou, P. Zhang, W. Wang and M. Yue, J. Magn. Magn. Mater., 2018, 451, 793–798 CrossRef CAS.
- P. Thakur, N. Gahlawat, P. Punia, S. Kharbanda, B. Ravelo and A. Thakur, J. Supercond. Nov. Magnetism, 2022, 35, 2639–2669 CrossRef CAS.
- R. Jayalakshmi and J. Jeyanthi, J. Inorg. Organomet. Polym. Mater., 2018, 28, 1286–1293 CrossRef CAS.
- J. G. Smith, Organic Chemistry, McGraw-Hill, New York, 3rd edn, 2011 Search PubMed.
- J. March, Advanced Organic Chemistry: Reactions, Mechanisms, and Structure, Wiley, New York, 1992 Search PubMed.
- F. A. Carey and R. J. Sundberg, Advanced Organic Chemistry: Part A: Structure and Mechanisms, Springer, 2007 Search PubMed.
- N. Q. Trung, A. Mechler, N. T. Hoa and Q. V. Vo, R. Soc. Open Sci., 2022, 9, 1–12 Search PubMed.
- A. A. Almehizia, H. A. Abuelizz, H. A. A. Taie, A. ElHassane, M. Marzouk and R. Al-Salahi, Saudi Pharm. J., 2019, 27, 133–137 CrossRef PubMed.
- S. Handayani, presented in part at The 2nd International Conference on Research, Implementation and Education of Mathematics and Science (2nd ICRIEMS), Yogyakarta State University, 2015 Search PubMed.
- M. Lončarić, I. Strelec, V. Pavić, V. Rastija, M. Karnaš and M. Molnar, Front. Chem., 2022, 10, 1–15 Search PubMed.
Footnote |
| † Electronic supplementary information (ESI) available. See DOI: https://doi.org/10.1039/d4ra03077j |
| This journal is © The Royal Society of Chemistry 2024 |

