DOI:
10.1039/D4RA03060E
(Paper)
RSC Adv., 2024,
14, 19550-19559
Simultaneous quantification of co-administered trastuzumab and pertuzumab in serum based on nano-surface and molecular-orientation limited (nSMOL) proteolysis
Received
25th April 2024
, Accepted 4th June 2024
First published on 18th June 2024
Abstract
Monoclonal antibodies (mAbs) are pivotal therapeutic agents for various diseases, and effective treatment hinges on attaining a specific threshold concentration of mAbs in patients. With the rising adoption of combination therapy involving multiple mAbs, there arises a clinical demand for multiplexing assays capable of measuring the concentrations of these mAbs. However, minimizing the complexity of serum samples while achieving rapid and accurate quantification is difficult. In this work, we introduced a novel method termed nano-surface and molecular orientation limited (nSMOL) proteolysis for the fragment of antigen binding (Fab) region-selective proteolysis of co-administered trastuzumab and pertuzumab based on the pore size difference between the protease nanoparticles (∼200 nm) and the resin-captured antibody (∼100 nm). The hydrolyzed peptide fragments were then quantified using liquid chromatography-tandem mass spectrometry (LC-MS/MS). In this process, the digestion time is shortened, and the produced digestive peptides are greatly reduced, thereby minimizing sample complexity and increasing detection accuracy. Assay linearity was confirmed within the ranges of 0.200–200 μg mL−1 for trastuzumab and 0.300–200 μg mL−1 for pertuzumab. The intra- and inter-day precision was within 9.52% and 8.32%, except for 12.5% and 10.8% for the lower limit of quantitation, and the accuracy (bias%) was within 6.3%. Additionally, other validation parameters were evaluated, and all the results met the acceptance criteria of the guiding principles. Our method demonstrated accuracy and selectivity for the simultaneous determination of trastuzumab and pertuzumab in clinical samples, addressing the limitation of ligand binding assays incapable of simultaneously quantifying mAbs targeting the same receptor. This proposed assay provides a promising technical approach for realizing clinical individualized precise treatment, especially for co-administered mAbs.
1 Introduction
In recent decades, therapeutic monoclonal antibodies (mAbs) have emerged as a cornerstone in the treatment of various diseases, including tumors and autoimmune disorders. With over 130 mAbs approved for various treatments, their efficacy has been notably impressive.1 However, ensuring optimal therapy requires maintaining mAbs serum concentrations within a specific range. Elevated concentrations may result in adverse effects, while insufficient levels may render treatments ineffective. Studies have revealed significant variability in the serum levels of therapeutic mAbs among patients, with levels varying by up to 10-fold within the same timeframe post-injection.2 Additionally, clinical research has demonstrated the varying efficacy of infliximab in treating inflammatory bowel disease at different concentration levels.3,4 These findings underscore the importance of developing a universal method capable of rapidly and accurately quantifying serum mAbs concentrations. This is crucial for facilitating personalized medication selection and reducing the risk of overprescribing these costly drugs.
Trastuzumab, a humanized mAb targeting the human epidermal growth factor receptor-2 (HER2), is frequently employed in the management of HER2-positive breast cancer. However, its effectiveness is often hindered by the emergence of drug resistance.5–7 Studies have indicated that combining pertuzumab with trastuzumab results in enhanced activity compared to using either drug alone, and clinical evidence has showed that the co-administered schedule had dramatically improved median progression-free survival and overall survival.8–10 The co-administration of other mAbs, such as nivolumab and ipilimumab, is also prevalent in clinical practice.11,12 Given the sharp rise in co-administration of mAbs, it is crucial to develop a method capable of simultaneous quantifying the co-administered mAbs in the serum for the therapeutic drug monitoring.
Ligand binding assays (LBAs), such as enzyme-linked immunosorbent assays (ELISAs), are the predominant methods used for determining serum mAb concentrations in clinic.13 However, traditional ELISA methods often involve costly and time-consuming procedures for antibody production during method development.14 In addition, those methods display limited multiplexing capabilities due to the influence of cross-reaction, especially for mAbs targeting the same protein.15 Recently, liquid chromatography-tandem mass spectrometry (LC-MS/MS) has gradually attracted widespread attention based on its high sensitivity and specificity, high reproducibility, and capability of multiplex analysis.16–18 Typically, target proteins, including serum mAbs, are initially digested by proteolytic enzyme (e.g., trypsin) into peptide fragments. The digestion of whole serum can yield an abundance of tryptic peptides, some of which are highly prevalent. However, the resolution of triple quadrupole MS/MS systems may struggle to effectively separate these peptides from the target peptide, leading to potentially problematic interfering ion signals. A commonly employed pretreatment assay involves using protein A/G to capture IgGs since mAbs belong to the IgG class, which serves to reduce the complexity of the serum. Nonetheless, as IgGs are the second most abundant proteins in serum,19,20 the indiscriminate hydrolysis of IgGs can also result in a large number of fragment peptides through proteolytic enzymes. This process contributes to unavoidable and increased background noise and worsened ionization suppression, ultimately leading to data instability. Furthermore, this process presents challenges such as long incubation times and the use of excessive enzymatic reagents. Therefore, developing a method that can further minimize sample complexity while maintaining the specificity of the target protein sequences and reducing assay time will greatly enhance the applicability of therapeutic mAb quantitation in clinical settings.
For humanized mAbs, it is crucial that the signature peptides originate from the complementarity-determining regions (CDR) within the variable domain.21,22 This is because sequences located elsewhere are conserved in endogenous human antibodies. As a strategic approach, selective proteolysis of the CDRs in the fragment of antigen binding (Fab) portion of mAbs presents a promising method. Considering the above issues comprehensively, a novel method termed the nano-surface and molecular orientation limited (nSMOL) proteolysis was introduced for quantitative analysis of mAbs by selective proteolysis of the CDRs in the Fab of mAbs.23–25 In this design, the orientational control of the mAb and the immobilization of protease are key to success. Specifically, the nSMOL proteolysis method is characterized by several key features: (1) resin-immobilized protein G selectively binds to the fragment crystallizable (Fc) region of mAbs, facilitating the outward alignment of the Fab region; (2) the protease is immobilized on the surface of uniform spherical nanoparticles to enhance the contact area between the protease and the substrate; (3) the Fab segment-selective proteolysis is achieved through the disparity in pore sizes between the protease nanoparticles (∼200 nm) and the resin-captured antibody (∼100 nm).
In this study, taking trastuzumab and pertuzumab as an example, we employed the nSMOL proteolysis for the enrichment of co-administered therapeutic mAbs and preparation of CDR peptides, and quantified their surrogate peptides by LC-MS/MS (Fig. 1). Initially, the Fc region of the mAbs was selectively captured by resin-immobilized protein G. Subsequently, protease nanoparticles with larger pore diameters specifically targeted and hydrolyzed the Fab segments, with the resulting digested peptides being collected through centrifugation. Ultimately, the peptide fragments underwent quantification via LC-MS/MS to ascertain the concentration of therapeutic mAbs accurately.
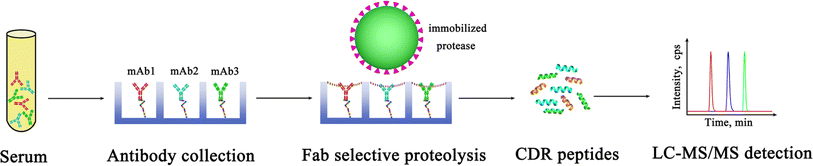 |
| | Fig. 1 Schematic illustration of simultaneous quantification of co-administered mAbs in serum based on nano-surface and molecular-orientation limited (nSMOL) proteolysis. | |
2 Materials and methods
2.1 Chemicals and materials
Trastuzumab (Basel, Switzerland) and pertuzumab (GmBH, Germany) were used to establish and verify the method. nSMOL™ Antibody BA kit for Fab-selective proteolysis was purchased from Shimadzu Co. Ltd (Tokyo, Japan). Peptides, including synthetic surrogate peptides of mAbs and their stable isotope-labeled internal standards (IS), were manufactured by ChinaPeptides Co. Ltd (Shanghai, China). Acetonitrile (ACN), methanol (MeOH), trifluoroacetic acid (TFA), and formic acid (FA) were produced by Thermo Fisher Scientific (MA, USA). Sequencing grade trypsin was purchased from Promega (WI, USA). Deionized water was supplied by Zhiang (Shanghai, China).
2.2 Blood samples collection
Blood samples of breast cancer patients treated with trastuzumab or pertuzumab were collected from Zhongnan Hospital of Wuhan University after the approval of the ethical review committee (no. 2022050K). Prior to being included in this study, all participants were signed the informed consent form voluntarily. The collected blood samples were first centrifuged at 1000g for 10 min. Then, the supernatant solution was transferred to a new tube and stored in −80 °C refrigerator until analysis.
2.3 Calibration and quality control samples
The stock solution (10 mg mL−1) of trastuzumab and pertuzumab was prepared according to the instructions and stored at 4 °C until use. After continuously diluting the storage solution with blank serum, calibration standards with concentrations of 0.2, 0.4, 2, 10, 50 and 200 μg mL−1 were obtained for trastuzumab, with concentrations of 0.3, 0.6, 2, 10, 50 and 200 μg mL−1 were obtained for pertuzumab. Quality controls (QCs) including lower limit of quantification (LLOQ), low QC (LQC), medium QC (MQC), and high QC (HQC) with corresponding concentrations of 0.2, 0.6, 80, and 160 μg mL−1 were prepared for trastuzumab, and 0.3, 0.9, 80, and 160 μg mL−1 for pertuzumab.
2.4 Sample processing procedures
A 5 μL aliquot of mixed mAb-spiked human serum underwent a 10-fold dilution in PBS (pH 7.4) 0.1% n-octyl-β-D-thioglucopyranoside (OTG) to prevent nonspecific binding. Subsequently, the IgG fraction from the serum sample was isolated using 12.5 μL of PBS-substituted AF-rprotein A resin (50% slurry) in 95 μL of PBS with OTG, with gentle vortexing at 25 °C for 5 min. The protein A resin was subsequently collected onto an Ultrafree filter and subjected to two washes with 300 μL of PBS containing OTG to eliminate other serum proteins, while preserving IgGs. This was followed by an additional wash with 300 μL of PBS to remove detergents that could interfere with column performance, minimize carryover, and optimize peptide ionization in the electrospray ionization (ESI) interface. Each wash was directly conducted through centrifugation (10![[thin space (1/6-em)]](https://www.rsc.org/images/entities/char_2009.gif) 000g for 1 minute) using filter devices. After these washing steps, the protein A resin was with 80 μL of the nSMOL reaction solution. Subsequently, proteolysis was conducted using 5 μg trypsin on FG-beads, with gentle vortexing at 50 °C for 5 h in a saturated vapor, to ensure uniform contact between the protein A resin and FG beads. Following nSMOL proteolysis, the reaction was stopped by adding formic acid to a final of 0.5%. The proteolysis solution was collected through centrifugation at 10000 × g for 1 minute and then magnetically separated to remove the protein A resin and trypsin FG-beads. These analytes were then into low protein binding polypropylene vials for analysis by LC-MS/MS.
000g for 1 minute) using filter devices. After these washing steps, the protein A resin was with 80 μL of the nSMOL reaction solution. Subsequently, proteolysis was conducted using 5 μg trypsin on FG-beads, with gentle vortexing at 50 °C for 5 h in a saturated vapor, to ensure uniform contact between the protein A resin and FG beads. Following nSMOL proteolysis, the reaction was stopped by adding formic acid to a final of 0.5%. The proteolysis solution was collected through centrifugation at 10000 × g for 1 minute and then magnetically separated to remove the protein A resin and trypsin FG-beads. These analytes were then into low protein binding polypropylene vials for analysis by LC-MS/MS.
2.5 LC-MS/MS conditions
The peptide fragments and samples were analyzed using an LC-30A UPLC system paired with an LCMS-8050 triple-quadrupole mass spectrometer (Shimadzu, Japan). The LC separation was carried out utilizing an Agilent SB C18 column (2.7 μm, 30 mm × 2.1 mm) held at 40 °C. The mobile phases comprised solvent A (0.1% formic acid in water) and solvent B (0.1% formic acid in acetonitrile). The injection volume was maintained at 5 μL, with a flow rate of 0.4 mL min−1. The elution time of peptide MRM analysis is 7 min: the initial concentration (10% solvent B) running for 1 min, followed by a gradual increase to 90% solvent B over 2 min, maintaining this level for an additional 4 min, and ultimately rapidly returning to the initial 10% solvent B concentration within 1 min. In this study, specific MS parameters were set for the MRM analysis, including an electrospray ionization desolvation temperature of 350 °C, a gas flow rate of 10 L min−1, unit resolution for both Q1 and Q3, a capillary voltage of 4 kV, and a nebulizer pressure of 35 psi. All MRM analyses were conducted in positive electrospray ionization mode, with data interpretation and processing facilitated through the utilization of the LabSolution software, ensuring accurate and comprehensive analysis of the results obtained.
2.6 Investigation of analytical performance
The method validation was meticulously conducted following the 2018 FDA bioanalytical guidance. Calibration curves for trastuzumab and pertuzumab in MRM analysis were constructed by serially diluting their stock solutions with pooled blank serum. To assess accuracy and precision, four levels of QC samples were analyzed over three separate days and runs, with each sample undergoing six repetitions. Accuracy was gauged by comparing the ratio of the average calculated concentration to the nominal value of the sample, while precision was determined by calculating the coefficient of variation from repeated measurements. Selectivity was examined by analyzing aliquots of blank serum from six individual patients without using target drugs. The result was determined by comparing the chromatograms of blank serum with the spiked LLOQ samples.
3 Results and discussion
3.1 Selection of surrogate peptide
To effectively quantify macromolecules in MS-based targeted proteomics, it is crucial to minimize sample complexity interference and ensure the specificity of target proteins. Unlike traditional proteins, antibodies consist of Fc and Fab regions, with the CDRs within the Fab playing a crucial role in antibody differentiation. An ideal surrogate peptide should meet specific criteria outlined in our previous research: it must possess a unique sequence unaffected by other proteins, have a peptide length ranging from 6 to 16 amino acids, lack specific amino acid sequences (such as KK and RR) in the tryptic digestion region, and avoid excessive hydrophobic amino acids.
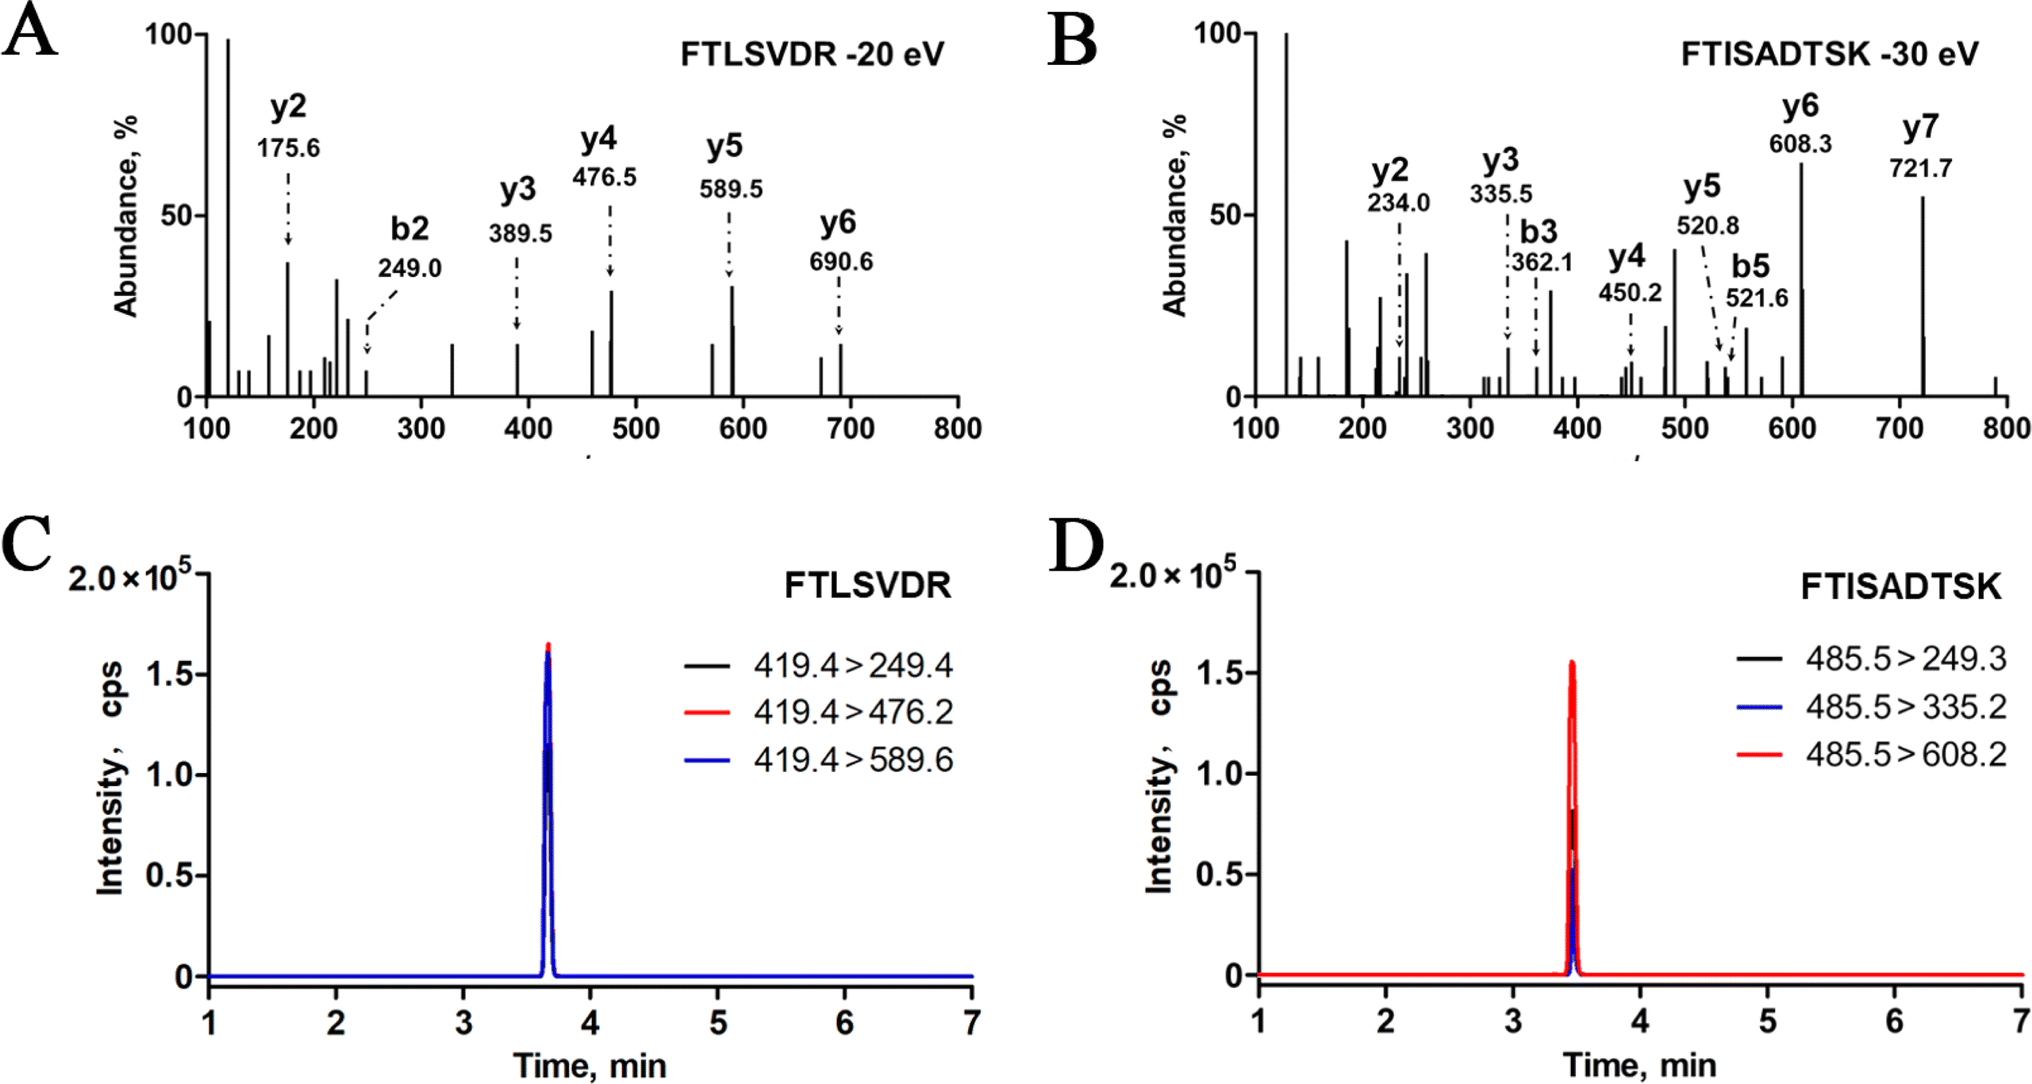
In this study, we initially predicted the enzymatic peptides of trastuzumab and pertuzumab through in silico trypsin digestion using PeptideMass. Following the stringent selection criteria for optimal surrogate peptides, several distinctive peptides from the CDRs of trastuzumab and pertuzumab were identified as potential candidates, as detailed in Table 1. Subsequently, mixed standard solutions (10 μg mL−1) of trastuzumab and pertuzumab underwent enzymatic hydrolysis following the nSMOL kit instructions and were analyzed using LC-MS/MS. Finally, FTISADTSK was chosen as the surrogate peptide for trastuzumab, while FTLSVDR was selected for pertuzumab due to their superior MRM response quality, minimal background signal, and strong correlation with target mAb concentrations. Specifically, the doubly charged ions m/z 485.5 and m/z 419.2 exhibited peak mass responses for FTISADTSK and FTLSVDR during scanning. Moreover, for enhanced sensitivity, sequence-specific b and y ions with high signal-to-noise ratios (S/N) were identified, such as b2 m/z 249.1, y3 m/z 335.0, and y6 m/z 608.2 for FTISADTSK, and b2 m/z 249.1, y3 m/z 389.2, and y6 m/z 690.3 for FTLSVDR. The product ion spectra and LC-MS/MS chromatograms are depicted in Fig. 2.
Table 1 Potential candidate peptides of trastuzumab and pertuzumab
| Drug |
Position |
Sequence |
Calculated m/z |
Domain |
| Trastuzumab |
51–59 |
IYPTNGYTR |
1084.5 |
H-chain |
| 68–76 |
FTISADTSK |
969.5 |
H-chain |
| 44–50 |
GLEWVAR |
830.5 |
H-chain |
| 60–65 |
YADSVK |
682.3 |
H-chain |
| 46–61 |
LLIYSASFLYSGVPSR |
1773.0 |
L-chain |
| Pertuzumab |
46–54 |
LLIYSASYR |
1085.6 |
L-chain |
| 55–61 |
YTGVPSR |
779.4 |
L-chain |
| 68–74 |
FTLSVDR |
837.4 |
H-chain |
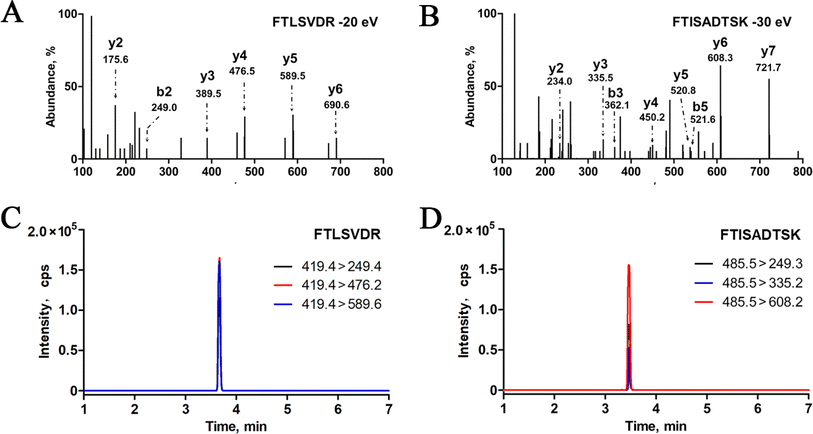 |
| | Fig. 2 Fragment ion spectrum (B) and LC-MS/MS chromatograms (D) of the surrogate peptide FTISADTSK for trastuzumab, fragment ion spectrum (A) and LC-MS/MS chromatograms (C) of the surrogate peptide FTLSVDR for pertuzumab. | |
To ensure high-precision quantitative results, the inclusion of internal standards (IS) is crucial to correct experimental variability in MS analysis. In this study, synthetic stable isotope-labeled peptide (*FTISADTSK) featuring 13C915N-labeled phenylalanine was utilized as IS peptide to mitigate detection fluctuations. Notably, the molecular mass of the stable isotope-labeled IS peptide increased by 10 Da compared to the natural surrogate peptide.
3.2 Digestion efficiency
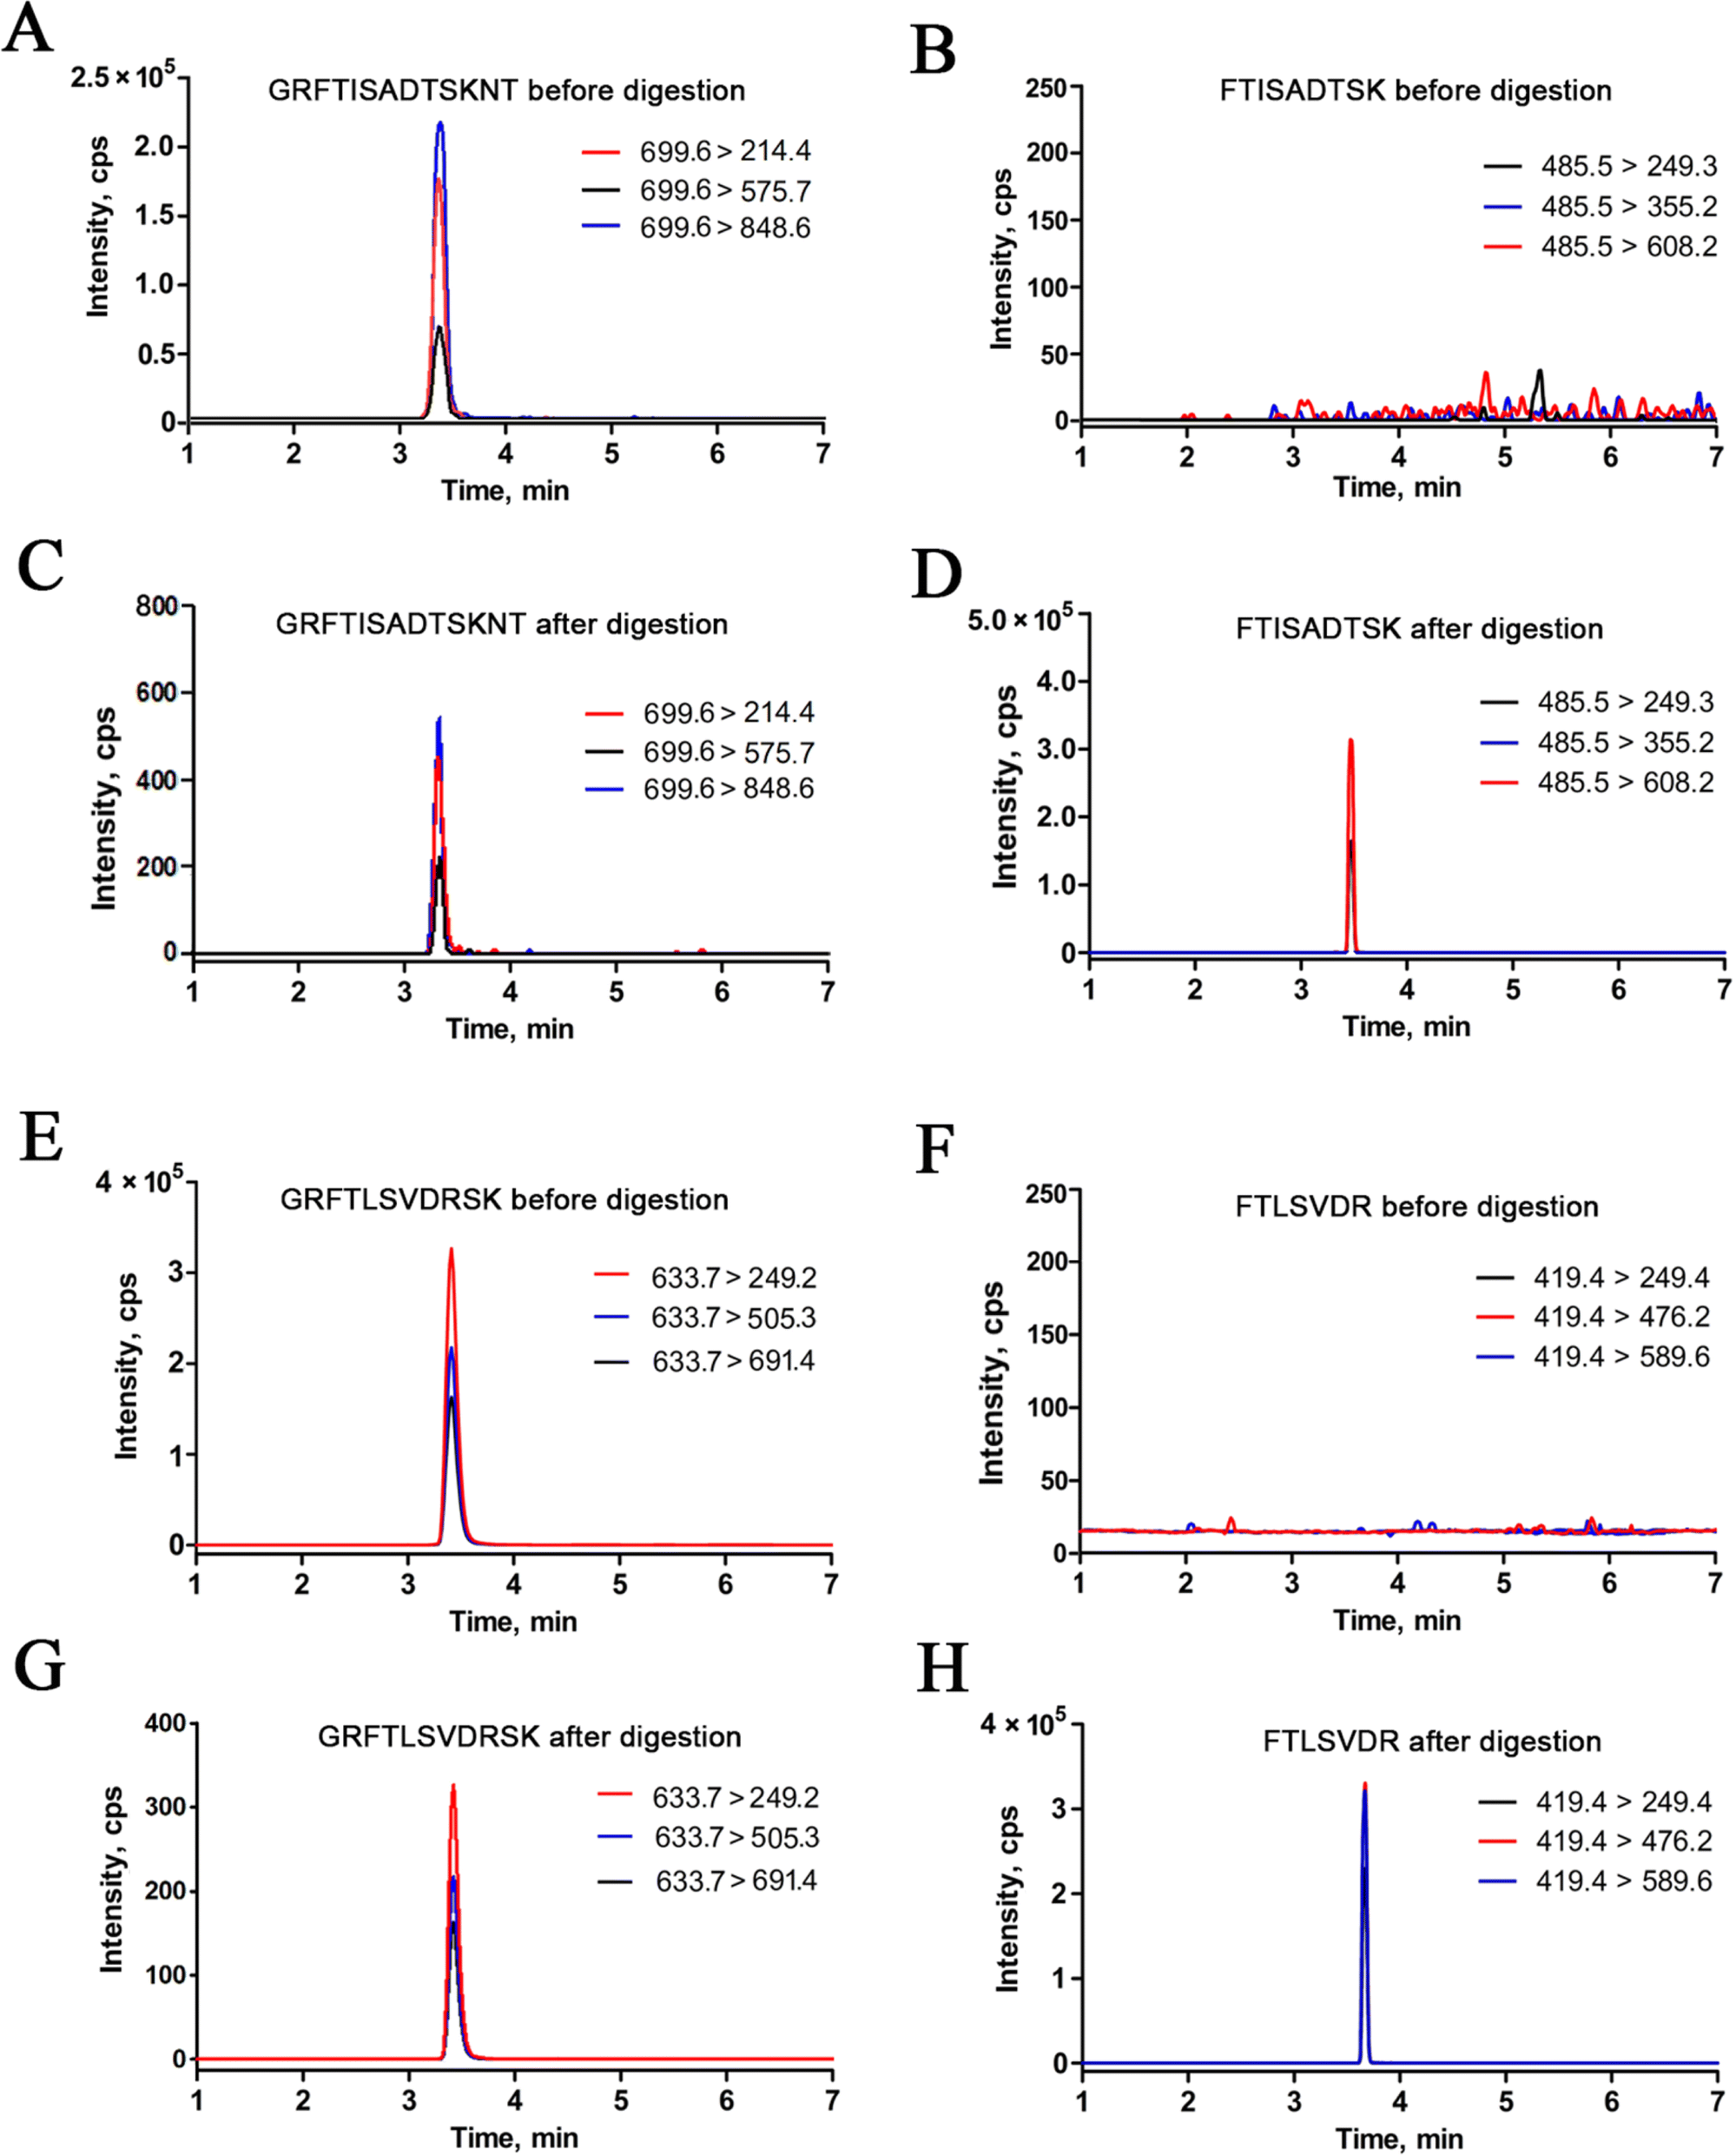
To ensure precise quantitative outcomes, optimal digestion efficiency is paramount in selecting surrogate peptides and establishing MS assays. However, assessing efficiency at the full antibody level presents challenges. Drawing from prior research, we employed substrate peptides—consisting of several amino acids extended at both ends of the surrogate peptides—to mimic the target proteins and gauge digestion efficiency. In this study, the synthesized substrate peptides 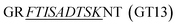 for trastuzumab and
 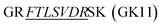 for pertuzumab were embedded in a blank matrix and subjected to trypsin digestion. As shown in Fig. 3, their digestion efficiencies were 98.23% and 98.38% by calculating the response ratio of the surrogate peptide produced by the digestion of the substrate peptide to an equimolar surrogate peptide standard, respectively. It is worth noting that this method overlooks spatial effects, which may potentially lead to slightly inflated measured digestion efficiency results compared to actual values.
 |
| | Fig. 3 Digestion efficiency of the surrogate peptide of trastuzumab and pertuzumab. In this study, we used a longer sequence containing the surrogate peptide to simulate mAbs. | |
3.3 Investigation of analytical performance
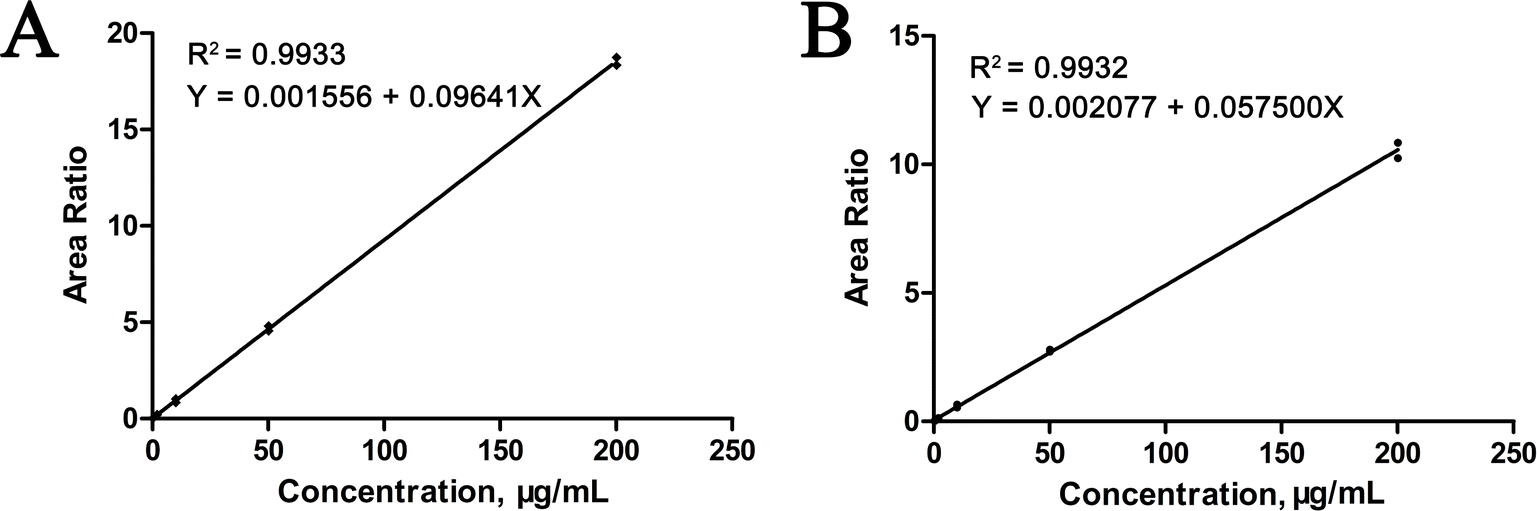
In this study, for selectivity test, no interfering peaks were detected at the retention times of the surrogate peptides in the blank human serum samples. Furthermore, spike-in selectivity was within the criteria for both trastuzumab and pertuzumab. Calibration standards and QC samples were prepared using blank serum as the matrix. Utilizing a weighted linear regression model, calibration curves were constructed by plotting the relative peak area ratio of the surrogate peptides and their internal standards (IS) against monoclonal antibody (mAbs) concentrations, applying a weighting factor of 1/x2. As depicted in Fig. 4, the calibration curves for trastuzumab and pertuzumab spanned concentration ranges from 0.2 to 200 μg mL−1 and 0.3 to 200 μg mL−1, respectively, all exhibiting strong correlation coefficients (R2 > 0.99). Moreover, the limit of quantification (LOQ) was established at 0.2 μg mL−1 for trastuzumab and 0.3 μg mL−1 for pertuzumab, as illustrated in Fig. 5.
 |
| | Fig. 4 Representative calibration curve for the (A) trastuzumab standards (0.2–200 μg mL−1) and (B) pertuzumab standards (0.3–200 μg mL−1). Relative peak area ratio of the mAb and the stable isotope-labeled internal standard was plotted against concentration. | |
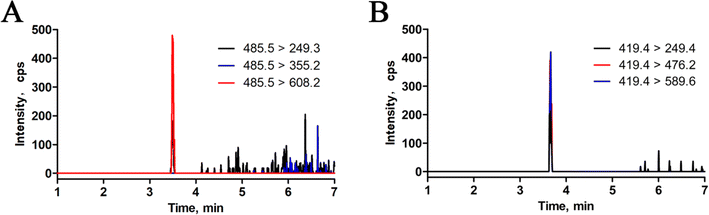 |
| | Fig. 5 The representative LLOQ chromatograms of (A) trastuzumab and (B) pertuzumab. | |
Furthermore, the assay's robustness was validated by examining the QC samples. Intra- and inter-day precision were assessed using the percent coefficient of variation (% CV), while accuracy was evaluated based on the ratio of the averaged values to their actual values (% bias). As outlined in Table 2, both precision and accuracy fell within the specified acceptance criteria ranges (≤±15%, LLOQ ≤ ±20%).
Table 2 Intra-day and inter-day accuracy and precision data for assay validation
| Pretreatment mode |
mAb |
QC |
Set (μg mL−1) |
Mean (μg mL−1) |
% Bias |
Intra-day precision (% CV) |
Inter-day precision (% CV) |
| Mixed |
Trastuzumab |
LLOQ |
0.200 |
0.206 |
2.80 |
9.46 |
10.8 |
| LQC |
0.600 |
0.619 |
3.17 |
3.69 |
5.58 |
| MQC |
40.0 |
42.5 |
6.30 |
5.29 |
7.21 |
| HQC |
160 |
159 |
−0.94 |
4.26 |
5.38 |
| Pertuzumab |
LLOQ |
0.300 |
0.293 |
−2.33 |
12.5 |
10.6 |
| LQC |
0.900 |
0.942 |
4.69 |
9.52 |
8.32 |
| MQC |
40.0 |
41.7 |
4.17 |
4.76 |
6.93 |
| HQC |
160 |
164 |
2.50 |
5.77 |
6.19 |
| Individual |
Trastuzumab |
LLOQ |
0.200 |
0.209 |
4.52 |
10.7 |
11.8 |
| LQC |
0.600 |
0.576 |
4.12 |
6.62 |
7.83 |
| MQC |
40.0 |
42.8 |
7.14 |
5.25 |
6.12 |
| HQC |
160 |
165 |
3.13 |
4.24 |
3.73 |
| Pertuzumab |
LLOQ |
0.300 |
0.311 |
3.67 |
13.2 |
11.4 |
| LQC |
0.900 |
0.962 |
6.89 |
7.21 |
6.42 |
| MQC |
40.0 |
41.2 |
3.02 |
8.36 |
7.35 |
| HQC |
160 |
163 |
1.88 |
4.81 |
3.75 |
3.4 Quantification of trastuzumab and pertuzumab in serum samples
The strategy based on nSMOL proteolysis was finally performed to quantitatively measure the levels of trastuzumab and pertuzumab in serum samples of breast cancer patients who were treated with the above two drugs. In this study, serum samples from twelve breast cancer patients were collected immediately before the next administration of trastuzumab and pertuzumab (21 days). The measurement results are shown in Fig. 6, revealing discrepancies in the concentration of mAbs among different patients at the same time point after injection. In the limited samples, the concentration difference of trastuzumab is approximately fourfold, and that of pertuzumab is about fivefold. This variation is probably attributed to the differences in patients' age, degree of illness, concomitant medication, and genetic characteristics.
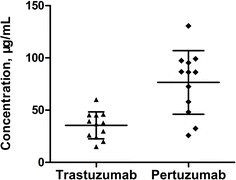 |
| | Fig. 6 Quantification of co-administered trastuzumab and pertuzumab in serum samples of 12 breast cancer patients. The graph was drawn using Graph Prism 5, the long line represents the average and the short line represents the deviation. | |
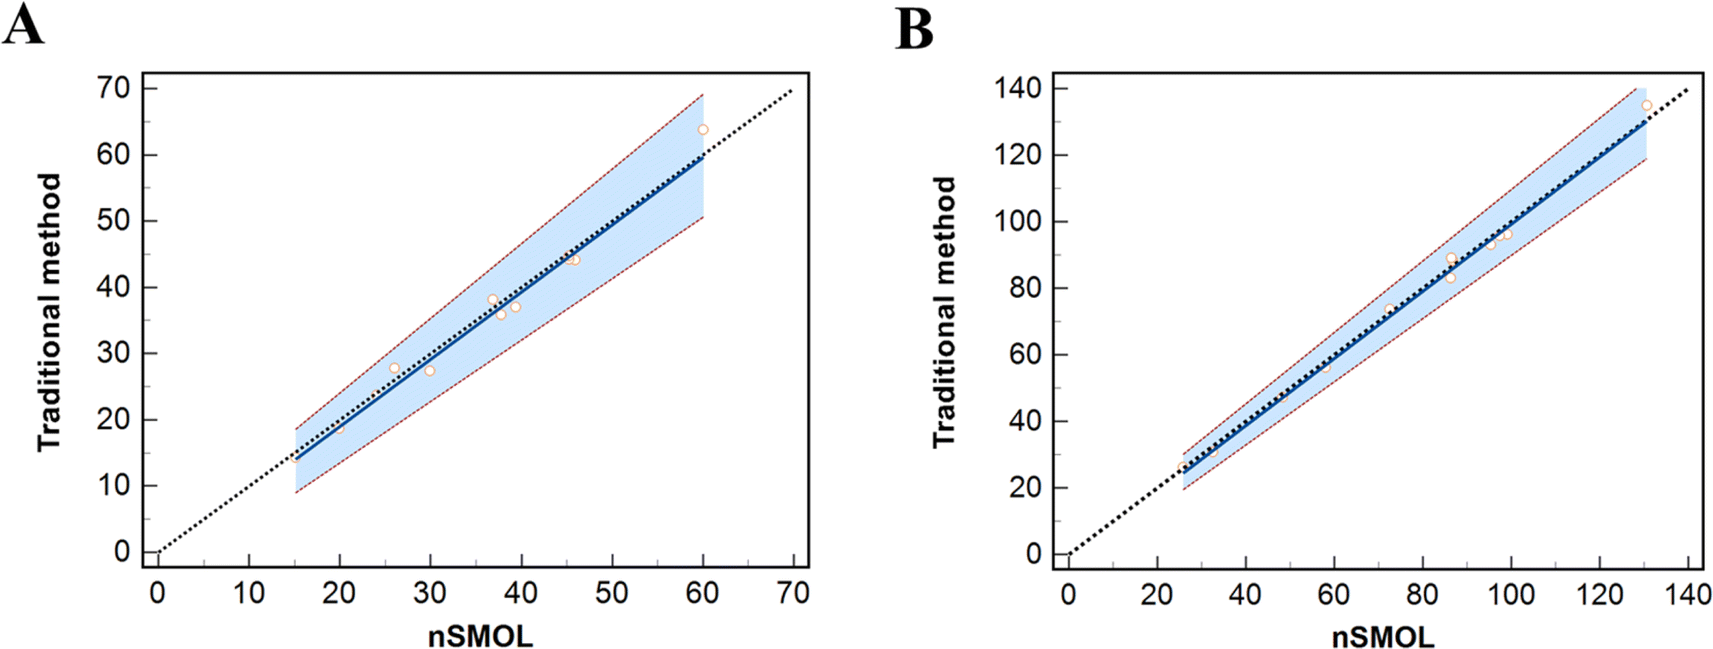
Furthermore, we employed a traditional affinity purification method as the standard method to measure the same serum samples for validation of our proposed method. Briefly, the concentrations of trastuzumab and pertuzumab were determined in 10 μL serum samples after extraction by affinity purification through protein G UltraLink resin (Thermo Fisher Scientific), followed by on-bead reduction, alkylation, and trypsin digestion.26 The LOQs were 0.5 and 0.6 μg mL−1 for trastuzumab and pertuzumab, and the calibration curves were 0.5–200 μg mL−1 and 0.6–200 μg mL−1 for trastuzumab and pertuzumab. Passing–Bablok regression analysis was performed for method comparison using MedCalc software (V20.0). As shown in Fig. 7, our assay was correlated well with the traditional method (for trastuzumab, y = −1.291 + 1.015x, r = 0.951; for pertuzumab, y = −1.620 + 1.009x, r = 0.993), indicating that our newly proposed method was feasible for quantification of trastuzumab and pertuzumab in human serum.
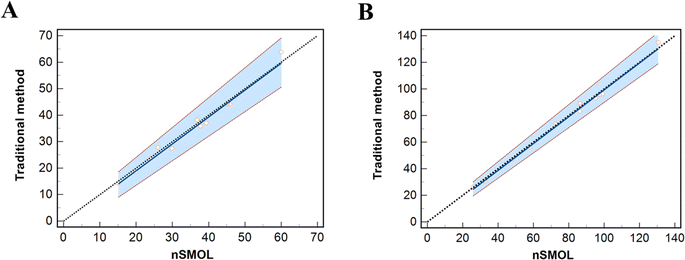 |
| | Fig. 7 Passing–Bablok regression analysis for traditional method vs. nSMOL for (A) trastuzumab and (B) pertuzumab. The solid line corresponds to the regression line, the short dashed lines represent the 95% confidence interval for the regression line, and the long dished lines represent bisector. | |
3.5 Comparison with reported methods
When developing an LC-MS/MS method for a therapeutic mAb, there are numerous available pathways and methodological considerations. A crucial factor to consider is the type of sample clean-up that will be performed. In the proposed method, the Fab segment-selective proteolysis is achieved through the disparity in pore sizes between the protease nanoparticles and the resin-captured antibody. In this process, the digestion time is shortened, and the produced digestive peptides are greatly reduced, thereby minimizing sample complexity and increasing detection accuracy. Recently, other procedures have been reported for the simultaneous determination of co-administration mAbs, as shown in Table 3. Schokker S. et al. reported a commonly used method for detecting trastuzumab and pertuzumab using on beads digestion after protein A purification.26 Gui L. L. et al. proposed an assay using methanol precipitation and ammonium bicarbonate denaturation,27 however, the process of removing the residual supernatant by placing the plate upside down on a clean and dry tissue may affect the quantitative results before IS was added. Chiu H. H. et al. reported a quantification method for five mAbs using protein G beads for affinity purification, followed by on-beads digestion,28 however, the process of thermal denaturation of mAbs at 90 °C for 25 min may lead to protein A leakage, which can reduce the sensitivity of the method. For all those reported methods, they all need a reduction and alkylation process, and our method does not require these steps and is relatively concise. What is more, given the smaller serum volume used in our method, we think our method is more sensitivity compared with those methods, which may be due to the selective proteolysis of the Fab region of mAbs resulting in minimized sample complexity.
Table 3 Comparison of different pretreatment methods for detection of co-administered mAbs using LC-MS/MS. The parameters include the serum volume, pretreatment method, internal standard, limit of quantification (LOQ), and calibration curves
| Serum volume (μL) |
Pretreatment method |
Internal standard |
Ruduction and alkylation |
LOQ (μg mL−1) |
Calibration curve (μg mL−1) |
Ref. |
| Five mAbs were measured, including bevacizumab, evolocumab, nivolumab, pembrolizumab, and trastuzumab, the LOQs were within 2.5–10 μg mL−1. T means trastuzumab and P means pertuzumab. |
| 25 |
Methanol precipitation |
Infliximab |
Need |
2.0 for T |
2.0 to 400 for T |
27 |
| 2.0 for P |
2.0 to 400 for P |
| 10 |
Affinity purification through protein A beads |
DTLMIS*R |
Need |
0.25 for T |
0.25–250 for T |
26 |
| 0.50 for P |
0.50–500 for P |
| 10 |
Affinity purification through protein G beads |
Tocilizumab |
Need |
2.5–10a |
10–200 |
28 |
| 5 |
Affinity purification through protein A resin |
*FTISADTSK |
Not need |
0.20 for T |
0.20–200 for T |
This study |
| 0.30 for P |
0.30–200 for P |
4 Conclusions
In conclusion, we have successfully developed an efficient and reproducible LC-MS/MS method for quantifying co-administered therapeutic mAbs using the nSMOL strategy. This method effectively simplifies sample complexity by selectively digesting the CDR in the Fab of mAbs, enabling rapid and precise quantification. Validation results have demonstrated that nSMOL fully meets validation criteria, even when simultaneously determining multiple co-administered mAbs in QC and clinical patient samples. The enhanced sample preparation protocol significantly improves the practicality of handling numerous clinical samples with the highly selective LC-MS/MS method. Therefore, this approach could serve as a versatile method for monitoring therapeutic drug levels of co-administered mAbs.
Data availability
The data underlying this article will be shared on reasonable request to the corresponding author.
Author contributions
Conceptualization, L. L. and J. W. (Jianhua Wu), methodology, L. L., B. S., S. C., J. C., and J. W. (Jiajun Wang); software, L. L., validation, J. W. (Jiajun Wang), J. C., and L. L.; formal analysis, B. S., J. W. (Jiajun Wang) and J. C.; investigation, L. L., H. H., W. L.; resources, L. L.; data curation, W. L.; writing—original draft preparation, L. L., B. S., W. L. and J. W. (Jianhua Wu); writing—review and editing, W. L., L. L., H. H., J. W. (Jiajun Wang), and S. C.; supervision, L. L.; project administration, L. L. and J. W. (Jiajun Wang); funding acquisition, L. L. and B. S. All authors have read and agreed to the published version of the manuscript.
Conflicts of interest
The authors declare that they have no known competing financial interests or personal relationships that could have appeared to influence the work reported in this paper.
Acknowledgements
This study was supported by the National Natural Science Foundation of China (82002252), Hubei Provincial Natural Science Foundation (2023AFB640), Hubei Province Young Science and Technology Talent Morning Light Lift Project (202303), Hubei Province Unveiling Science and Technology Projects (2022-35), the Research Fund for Clinical Pharmacy of China International Medical Foundation (Z-2021-46-2101, Z-2021-46-2101-2023), Research Project established by Chinese Pharmaceutical Association Hospital Pharmacy Department (CPA-Z05-ZC-2023002), Youth Interdisciplinary Special Fund of Zhongnan Hospital of Wuhan University (ZNQNJC2023010), Jiangsu Research Hospital Association for Precision Medication (JY202222); the Young Talents Fund of the First People's Hospital of Lianyungang (QN2308), Lianyungang health technology project (QN202301).
References
- G. Walsh and E. Walsh, Biopharmaceutical benchmarks 2022, Nat. Biotechnol., 2022, 40(12), 1722–1760 CrossRef CAS PubMed.
- J. Baselga, X. Carbonell and N. J. Castañeda-Soto, et al., Phase II study of efficacy, safety, and pharmacokinetics of trastuzumab monotherapy administered on a 3-weekly schedule, J. Clin. Oncol., 2005, 23(10), 2162–2171 CrossRef CAS PubMed.
- J. Gadsby, K. Hall and F. Shah, et al., Infliximab: a single-centre, prospective, observational evaluation of TDM data in patients with IBD, Eur. J. Hosp. Pharm., 2023, 31(1), 16–20 CrossRef PubMed.
- K. Papamichael, E. H. Vogelzang and J. Lambert, et al., Therapeutic drug monitoring with biologic agents in immune mediated inflammatory diseases, Expert Rev. Clin. Immunol., 2019, 15(8), 837–848 CrossRef CAS PubMed.
- S. Vivekanandhan and K. L. Knutson, Resistance to trastuzumab, Cancers, 2022, 14(20), 5115 CrossRef CAS PubMed.
- P. R. Pohlmann, I. A. Mayer and R. Mernaugh, Resistance to trastuzumab in breast cancer, Clin. Cancer Res., 2009, 15(24), 7479–7491 CrossRef CAS PubMed.
- A. Derakhshani, Z. Rezaei and H. Safarpour, et al., Overcoming trastuzumab resistance in HER2-positive breast cancer using combination therapy, J. Cell. Physiol., 2020, 235(4), 3142–3156 CrossRef CAS PubMed.
- B. Nami, H. Maadi and Z. Wang, Mechanisms underlying the action and synergism of trastuzumab and pertuzumab in targeting HER2-positive breast cancer, Cancers, 2018, 10(10), 342 CrossRef CAS PubMed.
- A. R. Tan, S. A. Im and A. Mattar, et al., Fixed-dose combination of pertuzumab and trastuzumab for subcutaneous injection plus chemotherapy in HER2-positive early breast cancer (FeDeriCa): a randomised, open-label, multicentre, non-inferiority, phase 3 study, Lancet Oncol., 2021, 22(1), 85–97 CrossRef CAS PubMed.
- B. DuMond, V. Patel and A. Gross, et al., Fixed-dose combination of pertuzumab and trastuzumab for subcutaneous injection in patients with HER2-positive breast cancer: a multidisciplinary approach, J. Oncol. Pharm. Pract., 2021, 27(5), 1214–1221 CrossRef CAS PubMed.
- T. K. Owonikoko, K. Park and R. Govindan, et al., Nivolumab and ipilimumab as maintenance therapy in extensive-disease small-cell lung cancer: CheckMate 451, J. Clin. Oncol., 2021, 39(12), 1349–1359 CrossRef CAS PubMed.
- P. Baas, A. Scherpereel and A. K. Nowak, et al., First-line nivolumab plus ipilimumab in unresectable malignant pleural mesothelioma (CheckMate 743): a multicentre, randomised, open-label, phase 3 trial, Lancet, 2021, 397(10272), 375–386 CrossRef CAS PubMed.
- Y. R. Luo, I. Chakraborty and E. Lazar-Molnar, et al., Development of label-free immunoassays as novel solutions for the measurement of monoclonal antibody drugs and antidrug antibodies, Clin. Chem., 2020, 66(10), 1319–1328 CrossRef PubMed.
- P. Cakir, A. Cutivet and M. Resmini, et al., Protein-size molecularly imprinted polymer nanogels as synthetic antibodies, by localized polymerization with multi-initiators, Adv. Mater., 2013, 25(7), 1048–1051 CrossRef CAS PubMed.
- H. Ahsan, Monoplex and multiplex immunoassays: approval, advancements, and alternatives, Comp. Clin. Pathol., 2022, 31(2), 333–345 CrossRef CAS PubMed.
- B. Sun, J. Liu and P. Cai, et al., Aptamer-based sample purification for mass spectrometric quantification of trastuzumab in human serum, Talanta, 2023, 257, 124349 CrossRef CAS PubMed.
- L. Liu, Y. Kuang and Z. Wang, et al., A photocleavable peptide-tagged mass probe for chemical mapping of epidermal growth factor receptor 2 (HER2) in human cancer cells, Chem. Sci., 2020, 11(41), 11298–11306 RSC.
- W. Li, Y. Li and J. Cai, et al., Simultaneous quantification of seven antifungal agents in human serum using liquid chromatography-tandem mass spectrometry, Pharmaceuticals, 2023, 16(11), 1537 CrossRef CAS PubMed.
- A. Gonzalez-Quintela, R. Alende and F. Gude, et al., Serum levels of immunoglobulins (IgG, IgA, IgM) in a general adult population and their relationship with alcohol consumption, smoking and common metabolic abnormalities, Clin. Exp. Immunol., 2008, 151(1), 42–50 CrossRef CAS PubMed.
- G. Vidarsson, G. Dekkers and T. Rispens, IgG subclasses and allotypes:
from structure to effector functions, Front. Immunol., 2014, 5, 520 Search PubMed.
- R. Russo, C. Rega and A. Caporale, et al., Ultra-performance liquid chromatography/multiple reaction monitoring mass spectrometry quantification of trastuzumab in human serum by selective monitoring of a specific peptide marker from the antibody complementarity-determining regions, Rapid Commun. Mass Spectrom., 2017, 31(14), 1184–1192 CrossRef CAS PubMed.
- D. de Costa, I. Broodman and M. M. Vanduijn, et al., Sequencing and quantifying IgG fragments and antigen-binding regions by mass spectrometry, J. Proteome Res., 2010, 9(6), 2937–2945 CrossRef CAS PubMed.
- N. Iwamoto, T. Shimada and Y. Umino, et al., Selective detection of complementarity-determining regions of monoclonal antibody by limiting protease access to the substrate: nano-surface and molecular-orientation limited proteolysis, Analyst, 2014, 139(3), 576–580 RSC.
- N. Iwamoto, Y. Umino, C. Aoki and Y. Naoe, et al., Fully validated LCMS bioanalysis of Bevacizumab in human plasma using nano-surface and molecular-orientation limited (nSMOL) proteolysis, Drug Metab. Pharmacokinet., 2016, 31(1), 46–50 CrossRef CAS PubMed.
- N. Iwamoto, T. Shimada and H. Terakado, et al., Validated LC-MS/MS analysis of immune checkpoint inhibitor Nivolumab in human plasma using a Fab peptide-selective quantitation method: nano-surface and molecular-orientation limited (nSMOL) proteolysis, J. Chromatogr. B: Anal. Technol. Biomed. Life Sci., 2016, 1023–1024, 9–16 CrossRef CAS PubMed.
- S. Schokker, F. Fusetti and F. Bonardi, et al., Development and validation of an LC-MS/MS method for simultaneous quantification of co-administered trastuzumab and pertuzumab, mAbs, 2020, 12(1), 1795492 CrossRef PubMed.
- L. L. Gui, L. Li and L. H. Dong, et al., Method development and validation of LC-MS/MS-based assay for the simultaneous quantitation of trastuzumab and pertuzumab in cynomolgus monkey serum and its application in pharmacokinetic study, Biomed. Chromatogr., 2020, 34(12), e4903 CrossRef CAS PubMed.
- H. H. Chiu, Y. J. Tsai and C. Lo, et al., Development of an efficient mAb quantification assay by LC-MS/MS using rapid on-bead digestion, Anal. Chim. Acta, 2022, 1193, 339319 CrossRef CAS PubMed.
Footnote |
| † These authors contributed equally to this work. |
|
| This journal is © The Royal Society of Chemistry 2024 |
Click here to see how this site uses Cookies. View our privacy policy here. 
 Open Access Article
 This Open Access Article is licensed under a Creative Commons Attribution-Non Commercial 3.0 Unported Licence
 a,
Bo Sun†b,
Junlong Caic,
Jiajun Wanga,
Wei Liu
a,
Bo Sun†b,
Junlong Caic,
Jiajun Wanga,
Wei Liu
 for trastuzumab and
  for pertuzumab were embedded in a blank matrix and subjected to trypsin digestion. As shown in Fig. 3, their digestion efficiencies were 98.23% and 98.38% by calculating the response ratio of the surrogate peptide produced by the digestion of the substrate peptide to an equimolar surrogate peptide standard, respectively. It is worth noting that this method overlooks spatial effects, which may potentially lead to slightly inflated measured digestion efficiency results compared to actual values.