 Open Access Article
Creative Commons Attribution 3.0 Unported Licence
Quantification of AICAR and study of metabolic markers after administration†
Jingyi Fan‡
a,
Yirang Wang‡a,
Yue Zhuoa,
Siyan Xua,
Wanggeng Zhoub and
Bing Liu *a
*a
aShanghai University of Sport, Changhai Road 399, Shanghai 200438, P. R. China. E-mail: liubing2019@sus.edu.cn
bXiamen Medical College, 1999 Guankou Road, Jimei District, Xiamen, Fujian 361023, P. R. China
First published on 13th June 2024
Abstract
Objectives: AICAR (5-amino-4-imidazolecarboxyamide ribonucleoside) was reported as the first pharmacological AMPK (adenosine 5′-monophosphate (AMP)-activated protein kinase) activator, and it has been confirmed to exhibit a significant endurance enhancement effect and prohibited for doping by the World Anti-Doping Agency. Due to the fact that the human body can produce such substances, in order to ensure fairness in sports competition, methods for rapid detection and multi-type identification of AICAR drugs taken orally should be established. Methods: to assess AICAR levels, a new rapid, sensitive, efficient, and selective method was reported for the quantitative detection of AICAR in urine using LC-MS/MS. The method was validated for quantitative purposes based on the elemental selectivity, intra- (1.0–15.6%) and inter-day precision (1.3–16.3%), accuracy (99.9–112.8%), matrix effects (88.9–103.6%), recovery (87.4–106.5%), and stability at four different concentrations. The calibration curve was linear over a wide concentration range of 10–10,000 ng mL−1 with a high coefficient of determination (R2 > 0.998). The limit of detection (LOD) and limit of quantification (LOQ) for the experiment were determined to be 1 and 10 ng mL−1, respectively. Simultaneously, metabolomics analysis was used to obtain the metabolic fingerprint of different populations and biomarkers to distinguish administration cases through partial least squares discriminant analysis (PLS-DA) and a receiver operating characteristic (ROC) curve. Results: the method enables easy quantitation for LC-MS/MS analysis with the best recovery yield maintained, and the method was applied to 122 Asian biological samples with an average concentration of 1310.5 ± 1031.4 ng mL−1. Through drug metabolism research, 734 and 294 variables were extracted for data analysis respectively in the positive and negative ion modes, and more than 100 metabolites with significant up- and down-regulation were found after the test. Conclusions: this research developed a fast, precise, effective, and specific approach for the qualitative and quantitative identification of AICAR in urine. Meanwhile, administration metabolism studies found that there were significant changes in AICAR levels and other compounds, such as PC types PC(18:1/16:0), PC(16:0/18:0), and PC(16:0/16:0), PE types PE(18:0/20:4), and LPE-type 18:1, which could better distinguish samples before and after AICAR administration. The analysis provides a multi-perspective reference for WADA to determine a positive criterion.
1 Introduction
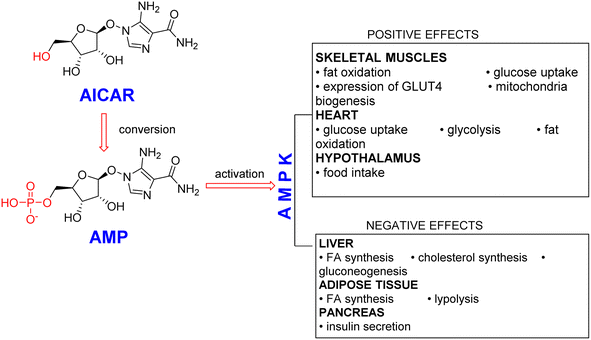
AICAR is the first reported pharmacological AMPK activator, and it has received extensive clinical attention1,2 (Fig. 1). By down-regulating the expression of adipogenic factors and activating PGC1α expression in vitro, AICAR can inhibit adipocyte differentiation and decrease the content of adipose tissue in mice with diet-induced obesity.3–5 In addition, AICAR has been reported to produce an extra benefit in preventing endoplasmic reticulum stress and protein unfolding responses,6 and the effect of AICAR on both cultured HL-1 cardiomyocytes was studied to explore the possibility of preventing cardiomyocyte injury.7 AICAR has also been used as an experimental tool to activate AMPK in vitro and in vivo.8 AICAR transforms to ZMP (AICAR monophosphate) by adenosine kinase inside a cell, and ZMP can act as an AMP analogue to activate AMPK in an LKB1-dependent manner.9Once ZMP is formed, NTPs (ribonucleoside triphosphates) produced de novo can be employed for the synthesis of certain RNA.10 Various studies on the mechanism confirmed that the transcription of such genes has a significant effect on the endurance enhancement by increasing the activity of transcriptional regulators at a genetic level and enhancing the expression of genes in skeletal muscle.11,12 As a result, doping with the substance AICAR was prohibited by the World Anti-Doping Agency (WADA)13 in 2009, and its misuse was classified via metabolic regulators after three years.
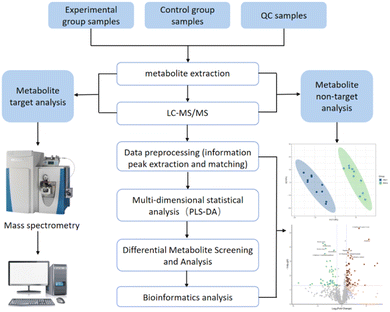
Recently, with the development of detection methods in the mass spectrometry industry,14 some cases have been reported for the qualitative and quantitative analyses of AICAR contents in vivo.15–17 Thevis' group has previously reported a detection method in which AICAR is directly dissolved and injected, and the limit of quantification (LOQ) was 100 ng mL−1 in 2010.15 Subsequently, the group proposed a new concept of “dilute-and-shoot” using a liquid chromatography (LC)-mass spectrometry (MS)/MS multi-target method for the semi-quantitation of prohibited compounds containing AICAR, which had a limit of detection (LOD) of 30 ng mL−1.16 Direct detection and analysis of urine samples brings convenience to testing personnel, but it also causes rapid contamination problems of the ion sources and analysis column due to the accumulation of inorganic salts and organic metabolites in urine. To solve the matrix interference problem, Dmitrieva et al.17 published a quantitative detection approach of AICAR through improved solid-phase extraction preprocessing, and the limit of quantification was 50 ng mL−1 with an error of quantification of less than 15% evaluated by the calibration curve. In addition to the above-mentioned matrix effects in the detection methods, current quantitative methods also ignore the concentration of the AICAR bound to enzymes in vivo.9,18 Due to the fact that the human body can produce such substances and there are also significant individual concentration differences, there is no public document that clearly indicates whether an athlete has taken the drug based on their concentration. To ensure fairness in sports competition, methods for rapid detection and multi-type identification of AICAR drugs taken orally should be established (Fig. 2).
2 Materials and methods
2.1. Materials
To diminish the potential matrix effects, an 15N, 13C2-labelled AICAR internal standard (AICAR-IS) was employed to obtain the correct quantitative results. AICAR and AICAR-IS were purchased from TRC. All the high-performance liquid chromatography (HPLC)-grade solvents and ammonium formate were obtained from Merck. β-Glucuronidase (E. coli) and formic acid were purchased from Sigma-Aldrich. Phosphates were purchased from Adamas and Energy Chemical. A Kinetex F5 column was employed (2.1 mm × 100 mm, 2.6 μm, Phenomenex, USA).A 1290 infinity high-performance liquid chromatograph (Agilent Technologies, USA) and QTRAP 6500+ mass spectrometer were used. The mass data were collected in the MRM mode with ESI polarity switching.
2.2. Instrumentation conditions
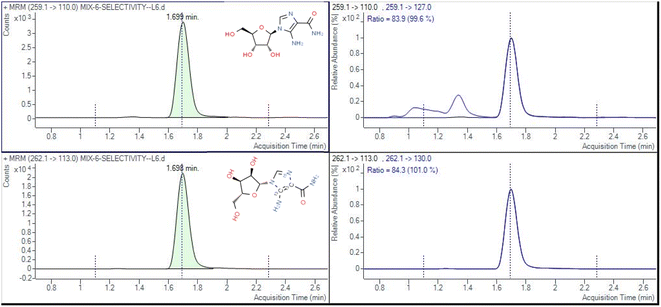
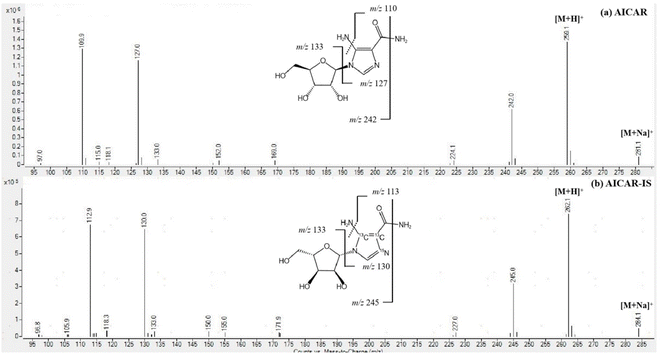
The determination of AICAR and AICAR-IS was conducted in the positive ion mode (ESI) using a QTRAP 6500+ mass spectrometer. This analytical approach allowed for accurate and reliable measurements of these compounds. In addition, N2 was utilized as the nebulizing gas (3 L min−1) and drying gas (15 L min−1), and the following gas configuration was used: collision gas (CAD) (N2) pressure = medium, curtain gas (N2) pressure = 35 a.u., ion spray voltage = 5.2 kV, and temperature = 550 °C. The mass scanning range was m/z = 100–500 in full data storage mode. The MRM transition ions identified for AICAR were at m/z = 259.1 > 110.0 and m/z = 259.1 > 127.0. Additionally, the transition ions for AICAR-IS were found at m/z = 262.1 > 113.0 and m/z = 262.1 > 130.0. Under the current LC-MS conditions, there are several notable characteristics in the chromatogram. (1) The retention time window differences are within 0.1 min (Fig. 3). (2) Both standard solutions at the same concentration have similar peak shapes and good peak intensities on the chromatograms. Thus, it was speculated that these characteristics will also be present in the labeled and unlabeled metabolites (Fig. 3). (3) AICAR and AICAR-IS have similar fragmentation patterns in mass spectrometry (Fig. 4).These specific mass-to-charge ratios provide key information for the analysis and identification of AICAR and its internal standard AICAR-IS in this study, providing strong support for subsequent verification of methodological indicators such as selectivity, LOD and LOQ, highlighting the importance of the methods used.
The samples were analyzed using UPLC-Q-Exactive Plus MS technology combined with data-dependent acquisition to perform full-spectrum analysis, obtaining both primary and secondary mass spectrometry data. UPLC-Q-Exactive Plus MS analysis was performed using a quadrupole-Orbitrap mass spectrometer (Thermo Scientific, Q-Exactive Plus) equipped with an LC-30AD ultra-high-performance liquid chromatography system (Shimadzu, Kyoto, Japan) in both positive and negative ion modes. The electrospray ionization (ESI) with positive and negative modes was applied for MS data acquisition separately. The HESI source conditions were set as follows: spray voltage = 3.8 kV (positive) and 3.2 kV (negative); capillary temperature = 320 °C; sheath gas (nitrogen) flow = 30 arb (arbitrary units); Aux gas flow = 5 arb; probe heater temp = 350 °C; S-lens RF level = 50. The instrument was set to acquire over the m/z range 70–1050 Da for full MS. The full MS scans were acquired at a resolution of 70![[thin space (1/6-em)]](https://www.rsc.org/images/entities/char_2009.gif) 000 at m/z 200, and 17
000 at m/z 200, and 17![[thin space (1/6-em)]](https://www.rsc.org/images/entities/char_2009.gif) 500 at m/z 200 for MS/MS scan. The maximum injection time was set to 100 ms for MS and 50 ms for MS/MS. The isolation window for MS2 was set to 2 m/z and the normalized collision energy (stepped) was set as 20, 30 and 40 for fragmentation.
500 at m/z 200 for MS/MS scan. The maximum injection time was set to 100 ms for MS and 50 ms for MS/MS. The isolation window for MS2 was set to 2 m/z and the normalized collision energy (stepped) was set as 20, 30 and 40 for fragmentation.
The autosampler and column temperatures were set to 4 °C and 40 °C, respectively, with an injection volume of 4 μL. The samples were run using a stratified method, with samples from different subjects placed in a random order. After every 10–12 urine samples, a QC sample and a blank vial were run.
2.3. Standard solution, calibration standard, and quality controls
Appropriate standards of AICAR and AICAR-IS were accurately weighed in bottles, after which they were dissolved in methanol to obtain a standard stock solution of 1.00 mg mL−1. They were then diluted into standard working solutions at concentrations of 100 μg mL−1 and 2 μg mL−1 and stored at −20 °C.The standard working solution was diluted with H2O to 1 ng mL−1, 10 ng mL−1, 100 ng mL−1, 100 ng mL−1, 500 ng mL−1, 1000 ng mL−1, 2000 ng mL−1, 5000 ng mL−1, and 10![[thin space (1/6-em)]](https://www.rsc.org/images/entities/char_2009.gif) 000 ng mL−1 concentrations.
000 ng mL−1 concentrations.
QC samples were prepared by spiking human urine with working solutions and stock solutions reaching concentrations at LLOQ (10 ng mL−1), LQC (100 ng mL−1), MQC (1000 ng mL−1) and HQC (5000 ng mL−1) levels.
2.4. Sample pre-treatment
To start the quantification experiment, a total of 100 μL of internal standard (2 μg mL−1, solvent PBS), 10 μL of MeOH, and 10 μL of enzyme (β-glucuronidase) were carefully combined with 200 μL of urine in a thorough mixing process. The solution was enzymatically hydrolyzed at 55 °C in a water bath for 2 h. After the enzymatic solution was cooled to room temperature, 200 μL of the mixed solution was added to 200 μL of MeOH. The solution was shaken at 2500 rpm for 10 s, followed by centrifugation at a temperature of 4 °C and a rotation speed of 13![[thin space (1/6-em)]](https://www.rsc.org/images/entities/char_2009.gif) 000 rpm for 15 min. Then, 200 μL supernatant was mixed with 800 μL of water, and the resulting sample was stored for future testing. After each batch of samples were tested, the column was rinsed with an organic/water mixed mobile phase.
000 rpm for 15 min. Then, 200 μL supernatant was mixed with 800 μL of water, and the resulting sample was stored for future testing. After each batch of samples were tested, the column was rinsed with an organic/water mixed mobile phase.
For metabolomics analysis after administration of AICAR. All collected urine samples were stored at −80 °C until analysis. Prior to analysis, the samples were moved out and thawed at 4 °C. Then 100 μL of urine sample and 400 μL of pre-cooled pure methanol were taken, vortex mixed, sonicated in an ice bath for 20 minutes, allowed to stand at −20 °C for 1 hour, and centrifuged at 16![[thin space (1/6-em)]](https://www.rsc.org/images/entities/char_2009.gif) 000 g, at 4 °C for 20 minutes, and the supernatant was collected and evaporated in a high-speed vacuum concentrator. Before loading, 100 μL of methanol–water solution (1
000 g, at 4 °C for 20 minutes, and the supernatant was collected and evaporated in a high-speed vacuum concentrator. Before loading, 100 μL of methanol–water solution (1![[thin space (1/6-em)]](https://www.rsc.org/images/entities/char_2009.gif) :
:![[thin space (1/6-em)]](https://www.rsc.org/images/entities/char_2009.gif) 1, v/v) was added for reconstitution and then centrifuged at 20
1, v/v) was added for reconstitution and then centrifuged at 20![[thin space (1/6-em)]](https://www.rsc.org/images/entities/char_2009.gif) 000g, at 4 °C for 5 minutes. A blank was prepared using a 50% methanol–water solution. All samples were mixed equally to prepare a quality control (QC) sample to ensure the stability of the analysis conditions and process it using the above-mentioned method.
000g, at 4 °C for 5 minutes. A blank was prepared using a 50% methanol–water solution. All samples were mixed equally to prepare a quality control (QC) sample to ensure the stability of the analysis conditions and process it using the above-mentioned method.
2.5. Method validation
In order to ensure accurate results for the detection of AICAR in urine samples, it was necessary to validate the method for quantification purposes. The validation parameters were the selectivity, carry-over, linearity range, precision (intra/inter-day), accuracy, LOD, LOQ, matrix effect, recovery, and stability.![[thin space (1/6-em)]](https://www.rsc.org/images/entities/char_2009.gif) 000 ng mL−1) of the calibration curve during the validation.
000 ng mL−1) of the calibration curve during the validation.![[thin space (1/6-em)]](https://www.rsc.org/images/entities/char_2009.gif) 000 ng mL−1). The blank matrix was fortified with increasing amounts of target analytes. With the concentration X (ng mL−1) of each analyte as the abscissa and the ratio Y of the peak area of the target substance to the peak area of the internal standard as the ordinate, a standard curve was drawn, and the regression equation and correlation coefficient were obtained.
000 ng mL−1). The blank matrix was fortified with increasing amounts of target analytes. With the concentration X (ng mL−1) of each analyte as the abscissa and the ratio Y of the peak area of the target substance to the peak area of the internal standard as the ordinate, a standard curve was drawn, and the regression equation and correlation coefficient were obtained.2.6. Administration study
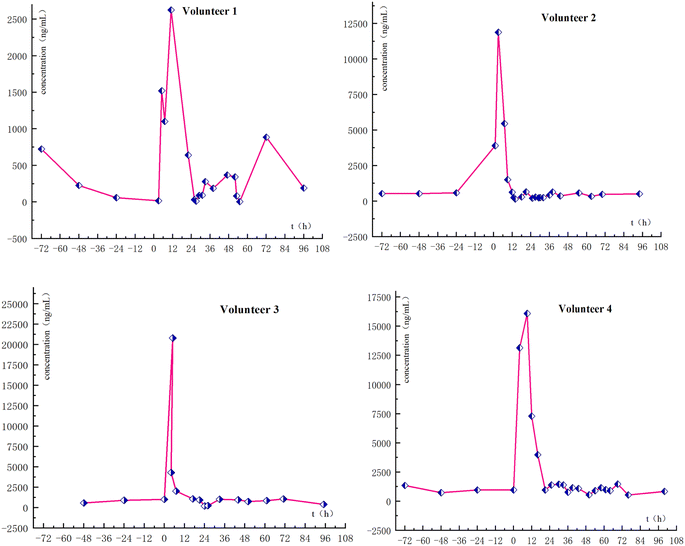
To confirm the detection capabilities of the newly developed method, urine samples were obtained from four male volunteers who had orally taken AICAR and given informed consent (Fig. 5). Several blank urine samples were collected as baseline reference values, and after that, the AICAR drug trial was conducted. All urine samples were collected within 72 h of drug administration, and only morning urine was collected on the fourth and fifth days with an approximate volume. The samples collected from the AICAR subjects were divided into three groups: the blank samples before the test were designated as Group B, the samples collected within 0–16 hours after the administration were designated as Group A1, and the samples collected after 16 hours were designated as Group A2. The metabolic analysis of the sample testing data was then performed based on a machine learning model.2.7. Statistical analysis
The entire raw dataset was processed rigorously using the MSDIA 4.9 instrument software. This involved critical preprocessing steps such as extracting peaks, correcting retention times, and aligning peaks to ensure data integrity. The key parameter settings ensured precision, with a retention time range spanning from 1 to 15 minutes, a retention time window of 0.1 minute, and a deviation tolerance of 10 PPM, while isotopic peaks were eliminated to minimize interference.To identify metabolite structures, we leveraged precise mass number matching (within 10 ppm) and second-order spectrum matching (within 0.01 Da) techniques to search through renowned public databases such as HMDB, MassBank, and GNPS, as well as our proprietary BaiPu metabolite standard library. Prior to statistical analysis, ion peaks with over 50% missing values within a group were excluded to ensure data reliability. Subsequently, total peak area normalization was applied independently to positive and negative ion data. The normalized data were then consolidated, and the Python software was utilized for pattern recognition. Following unit variance (UV) scaling preprocessing, in-depth data analysis was performed.
The comprehensive multidimensional statistical analysis of metabolomics data was performed using Python (version 3.8.10). Differential metabolites between the two athlete groups, pre- and post-exercise, were identified using the Variable Importance in Projection (VIP) value from the Partial Least Squares-Discriminant Analysis (PLS-DA) model (VIP > 1) and the p-value (<0.05) from Student's t-test on normalized peak intensities. The Fold Change (FC) was calculated by comparing the mean normalized peak intensities between the two groups. Finally, the structural identification of these differential metabolites was accomplished through comprehensive searches in public databases such as HMDB, MassBank, and GNPS.
3 Result
3.1. Quantification method validation
![[thin space (1/6-em)]](https://www.rsc.org/images/entities/char_2009.gif) 000 ng mL−1).
000 ng mL−1).| QC level | Nominal concentration (ng mL−1) | Accuracy (%) | Precision (RSD%) | Matrix effect | Recovery | |||
|---|---|---|---|---|---|---|---|---|
| Intraday (n = 4) | Interday (n = 12) | (%) | Cv (n = 4) | (%) | Cv (n = 4) | |||
| LLOQ | 10 | 112.8 | 15.6 | 16.3 | 88.9 | 4.9% | 87.4 | 1.4% |
| LQC | 100 | 104.0 | 2.6 | 2.5 | 101.8 | 3.4% | 100.8 | 2.8% |
| MQC | 1000 | 99.9 | 2.1 | 2.1 | 100.2 | 3.5% | 104 | 1.4% |
| HQC | 5000 | 100.4 | 1 | 1.3 | 103.6 | 2.2% | 106.5 | 2.4% |
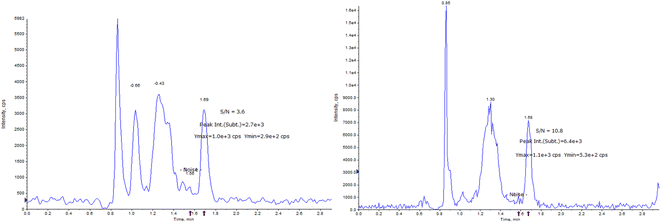
The LOD and LOQ of the detection system were estimated by measuring the analytical signals of the three blank samples. As shown in Fig. 6, the LOD and LOQ of the method were 1 ng mL−1 and 10 ng mL−1, respectively, based on the signal-to-noise ratio (SNRLOD > 3, SNRLOQ > 10).
| Period | QC level (ng mL−1) | Accuracya (%) | Precisiona (n = 8, %) |
|---|---|---|---|
| a Accuracy and precision of quality control (QC) level should be within ±15–20% (20% only for the lowest concentration point of the standard). | |||
| 0 h | 10 | 112.8 | 15.6 |
| 100 | 104 | 2.6 | |
| 1000 | 99.9 | 2.1 | |
| 5000 | 100.4 | 1 | |
| 4 h | 10 | 119.4 | 16.2 |
| 100 | 102.8 | 4.5 | |
| 1000 | 99.7 | 2.6 | |
| 5000 | 99.7 | 2.6 | |
| 12 h | 10 | 116.4 | 23.9 |
| 100 | 102.9 | 3.6 | |
| 1000 | 101 | 2.4 | |
| 5000 | 99 | 2.1 | |
| 7 d | 10 | 94.8 | 26.5 |
| 100 | 102.1 | 8.2 | |
| 1000 | 100 | 2.6 | |
| 5000 | 100 | 1 | |
3.2. Population quantitative analysis
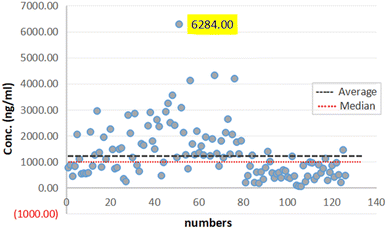
The protocol of this study was approved by the ethics committee of Shanghai University of Sport, China. Ethics no 102772023RT110.In this work, samples form 122 participants were analyzed to assess the method accuracy (64 males and 58 females). Fig. 7 summarizes the AICAR concentrations. Based on the results, the population can be divided into three parts based on the concentration: the maximum concentration was 6284 ng mL−1 and the minimum was 53.2 ng mL−1. Meanwhile, the calculated average concentration of the samples was 1310.5 ng mL−1, and the standard deviation was 1031.4 ng mL−1. The findings indicated a notable disparity in the levels of concentrations between male and female participants with values of 1719.5 ± 1122.2 ng mL−1 and 859.1 ± 686.2 ng mL−1, respectively. This difference was deemed statistically significant, highlighting potential gender-related variations in the studied parameters, and the trends of the results were consistent with those in the literature.22
3.3. Metabolomics profiling results
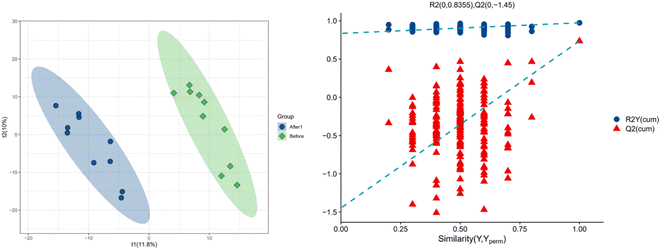
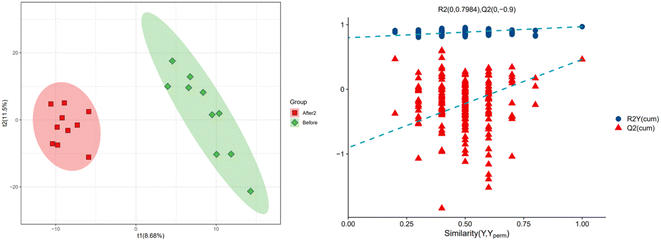
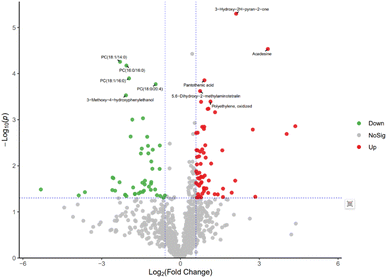
In order to further explore the impact on human body metabolites of AICAR administration, metabolomics analysis was performed to determine the different metabolites in urine and screen the biomarkers of consumption.23 In the positive and negative ion modes, 734 and 294 variables were extracted for data analysis, respectively, and over 100 differential metabolites were screened out (see ESI†). Due to the multidimensional characteristics of metabolomics data, it is necessary to “simplify and reduce the dimensionality” of multidimensional complex data on the basis of maximizing the retention of original information and establish reliable mathematical models to summarize the metabolic profile characteristics of research objects. Partial Least Squares Discriminant Analysis (PLS-DA) is a common multivariate statistical analysis method that can maximize the differences between groups according to predefined classifications. The PLS-DA results of urine samples in group A1 and group B are shown in Fig. 10 (left). It can be seen that the data within the groups are closely related, indicating good repeatability during sample testing, and the data between the groups are separated. This indicates that there are significant differences between the two sets of metabolomics data, and the metabolites in the urine of the AICAR-treated samples have undergone some changes compared to the pre-treated samples within 0–16 hours after treatment. The R2 and Q2 values are 0.974 and 0.736, respectively, indicating good stability and predictive ability of the model. Fig. 10 (right) shows the model validation of PLS-DA, which was tested 200 times with the permutation test. The horizontal axis represents the correlation between randomly grouped Y and original grouped Y, and the vertical axis represents the scores of R2 and Q2. The quality of the multivariate statistical analysis model should ultimately be based on the permutation test results. The Q2 value shown in the figure is −1.45, indicating that the model is very reliable and the PLS-DA model established from the experimental data has not been overfitted. The PLS-DA results of urine samples in group A2 and group B are shown in Fig. 11 (left). It can be seen that the data within the groups are closely related, while the data between the groups are separated. R2 and Q2 are 0.970 and 0.463, respectively, indicating that the model has good stability but general predictive ability. Fig. 11 (right) shows the model validation of PLS-DA. The figure shows that Q2 = −0.9, indicating that the model is very reliable and the PLS-DA model established from the experimental data has not been overfitted.The volcano plot integrates the univariate analysis method t-test, which can visually display the significance of metabolite changes between two groups of samples, thereby enabling the screening of potential marker metabolites. The volcano plot is shown in Fig. 12. The screening of differential metabolites is based on the criteria of VIP > 1, p < 0.05, and FC < 1/1.5 or FC > 1.5. Red represents metabolites up-regulated in group A1 compared to group B, and green represents metabolites down-regulated in group A1 compared to group B. The results show that there are a total of 143 significant metabolites, including 52 significantly down-regulated metabolites (47 in the positive ion mode and 5 in the negative ion mode) and 91 significantly up-regulated metabolites (58 in the positive ion mode and 33 in the negative ion mode). Lipid components after AICAR administration showed significant down-regulation compared to those before administration, including phosphatidylcholine (PC), phosphatidyl ethanolamine (PE), and lysophosphatidyl ethanolamine (LPE). PC, also known as lecithin, is abundantly present in the human brain, nervous system, circulatory system, immune system, and internal organs.24 PC is the most abundant phospholipid in the human body, particularly accounting for 70–80% of its dry weight in brain cells. It is one of the most important nutrients for the human body.25,26 PE, also known as cerebroside, is the second most abundant phospholipid in the body and mainly exists in the brain and spinal cord. In animals, it is generated through the pathway of CDP ethanolamine followed by phospholipase A, which then produces LPE. In addition, PC can also be converted from PE obtained through CDP ethanolamine or decarboxylation pathways. The types of PC involved in this study include PC(18:1/16:0), PC(16:0/18:0), and PC(16:0/16:0), PE type is PE18:0/20:4, and LPE type is 18:1.
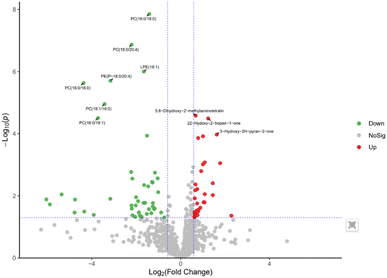
The volcanic plot of group A2 compared with group B is shown in Fig. 13. Differential metabolites were screened based on VIP > 1, p < 0.05, FC < 1/1.5 or FC > 1.5. Red represents metabolites up-regulated in group A2 compared with group B, and green represents metabolites down-regulated in group A2 compared with group B. The results showed that there were 103 significant metabolites, of which 50 were significantly down-regulated metabolites, including 46 in the positive ion mode and 4 in the negative ion mode; 53 were significantly up-regulated metabolites, including 46 in the positive ion mode and 7 in the negative ion mode. By comparing with the volcanic plots of group A1 and group B, it was observed that the differential metabolites were significantly reduced, but the differential metabolites of phospholipids were significantly down-regulated.
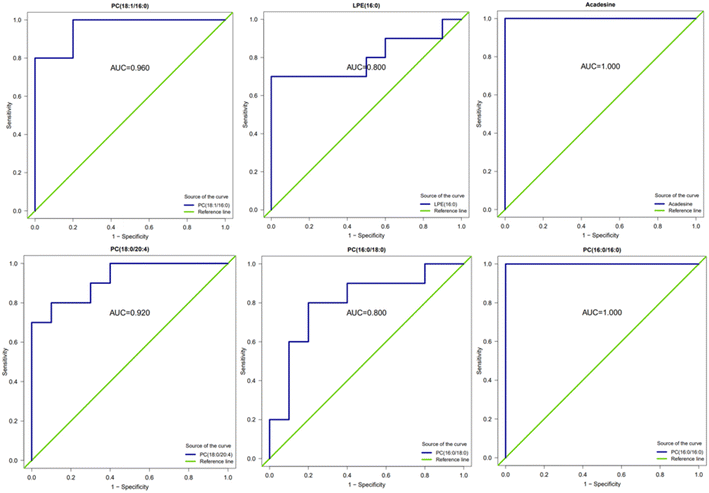
Receiver operating characteristic (ROC) curve analysis is a method that combines sensitivity and specificity to comprehensively evaluate the diagnostic accuracy or discrimination effect. The higher the area under the curve (AUC), the better the ability of such substances to distinguish between the comparison groups, which can be used as potential analytical markers. In this study, ROC analysis was performed on several substances with significant up- and down-regulation of differential metabolites between group A1 and group B (Fig. 14). The results showed that the area under the curve (AUC) was above 0.8 for all substances.
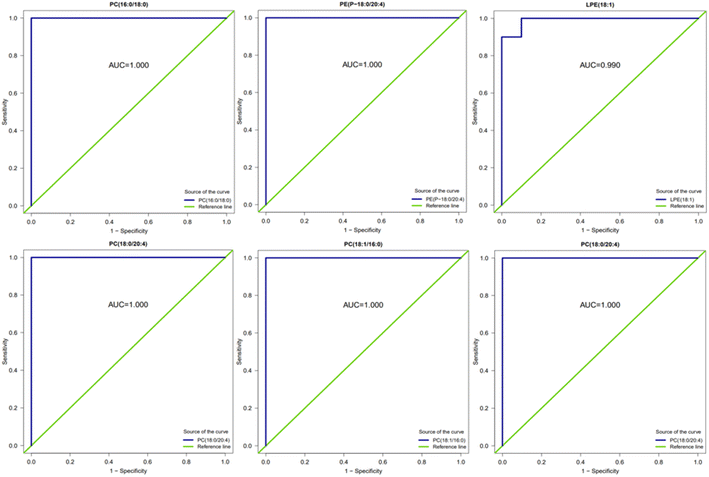
The ROC analysis was conducted for several substances with significant up- and down-regulation of differential metabolites in group A2 and group B, and the AUC results were almost 1. Fig. 15 shows that these substances can effectively distinguish between samples taken after 16 hours of AICAR administration and pre-administration samples. The results are also consistent with the ROC analysis of differential metabolites in group A1 and group B. Previous studies have shown that the AICAR affects the Kennedy pathway of PE synthesis. The incubation of AICAR with hepatocytes in vitro showed an increase in intracellular CDP ethanolamine,27 which was later confirmed by other researchers' experimental results.28 AICAR reduces the effect of glucose on fat production and fat decomposition. By culturing cells with AICAR and glucose separately and measuring the level of LPE, it was found that the level of LPE increased in glucose-treated cells, while the level of LPE decreased in AICAR-treated cells. PC, PE, and LPE can effectively distinguish between samples taken before and after administration of AICAR, and are expected to become potential biomarkers for detecting AICAR administration.
4 Conclusion
The quantitative detection method for the AICAR content in biological samples proposed in this study demonstrates extremely high sensitivity at a LLOQ concentration of 10 ng mL−1, which not only provides reliable technical support for the accurate detection of AICAR, but also demonstrates the profound strength and innovation ability of the research team in the field of biomedical analysis. The economic and environmental protection characteristics of this method indicate that in future applications, it can greatly reduce detection costs and environmental impact, contributing to the sustainable development of the biomedical industry.In the study of human populations, we have revealed the differences in AICAR levels among normal people, professional athletes, and drug users. This finding not only has profound scientific value, but also provides important reference for the World Anti-Doping Agency (WADA) to develop more scientific and reasonable positive standards. By gaining a deeper understanding of the abuse of AICAR in the athlete population, we can more effectively maintain the fairness and purity of sports competitions and protect the physical and mental health of athletes.
In the study of drug metabolism, we found metabolites that were significantly up- and down-regulated after the administration of AICAR. Combining PLS-DA model validation and ROC curve analysis, it was found that there were significant changes in AICAR levels and other compounds such as PC-type PCs (18:1/16:0), PC(16:0/18:0), PC(16:0/16:0), PE-type PE18:0/20:4, and LPE-type 18:1. These findings enable us to not only better understand the efficacy and metabolic pathways of AICAR, but also successfully screen a series of phospholipids with significant discriminatory power as potential biomarkers. These biomarkers provide new ideas and methods for detecting AICAR administration.
In summary, the application of LC-MS/MS targeted quantitative and non-target omics analysis methods proposed in this study in the detection of AICAR provides powerful technical support for the fight against doping and promotes the fairness and healthy development of sports. In the future, we will further study and apply this method.
Abbreviations
| AICAR | 5-Amino-4-imidazolecarboxyamide ribonucleoside |
| AMPK | Adenosine 5′-monophosphate (AMP)-activated protein kinase |
| LC-MS/MS | Liquid chromatography-mass spectrometry |
| LOD | Limit of detection |
| LOQ | Limit of quantification |
| PLS-DA | Partial least squares discriminant analysis |
| ROC | Receiver operating characteristic |
| PC | Phosphatidylcholine |
| PE | Phosphatidyl ethanolamine |
| LPE | Lysophosphatidyl ethanolamine |
| WADA | World Anti-Doping Agency |
| PGC1α | Peroxisome proliferator activated receptor gamma coactivator 1 alpha |
| ZMP | AICAR-monophosphate |
| LKB1 | Liver kinase B1 |
| NTPs | Ribonucleoside triphosphates |
| MRM | Multiple reaction monitoring |
| ESI | Electrospray ionization |
| RT | Retention time |
| FA | Formic acid |
| UPLC | Ultra-performance liquid chromatography |
| QC | Quality control |
| VIP | Variable importance in the projection |
| FC | Fold change |
| AUC | Area under the curve |
| LLOQ | Lower limit of quantification |
| MQC | Middle quality control |
| LQC | Low quality control |
| HQC | High quality control |
Conflicts of interest
There are no conflicts to declare.Acknowledgements
We are grateful to the Postdoctoral Research Foundation of China (CN) (2020M681357). We are also grateful to the Special Project (Key Technologies R&D Program for Winter Olympic Games from Ministry of Science and Technology of the People’s Republic of China, 2020YFF0304504).References
- T. Dite, C. Langendorf and A. Hoque, et al., AMP-activated protein kinase selectively inhibited by the type II inhibitor SBI-0206965, J. Biol. Chem., 2018, 293, 8874–8885 CrossRef CAS PubMed.
- V. Tripathi, P. Jaiswal and A. Assaiya, et al., Curr. Cancer Drug Targets, 2022, 22, 245–256, DOI:10.2174/1568009622666220207101212.
- S. Giri, R. Rattan and E. Haq, et al., AICAR inhibits adipocyte differentiation in 3T3L1 and restores metabolic alterations in diet-induced obesity mice model, Nutr. Metabol., 2006, 3, 31 CrossRef PubMed.
- J. Gao, R. Xiong and D. Xiong, et al., The Adenosine Monophosphate (AMP) Analog, 5-Aminoimidazole-4-Carboxamide Ribonucleotide (AICAR) Inhibits Hepatosteatosis and Liver Tumorigenesis in a High-Fat Diet Murine Model Treated with Diethylnitrosamine (DEN), Med. Sci. Mon., 2018, 24, 8533–8543, DOI:10.12659/MSM.910544.
- U. Krishnan, P. Viswanathan and A. Venkataraman, AMPK activation by AICAR reduces diet induced fatty liver in C57BL/6 mice, Tissue Cell, 2023, 82, 102054 CrossRef PubMed , https://www.sciencedirect.com/science/article/pii/S0040816623000423?via%3Dihub.
- K. Terai, Y. Hiramoto and M. Masaki, et al, AMP-activated protein kinase protects cardiomyocytes against hypoxic injury through attenuation of endoplasmic reticulum stress, Mol. Cell. Biol., 2005, 25, 9554–9575, DOI:10.1128/MCB.25.21.9554-9575.2005.
- M. V. Samsonov, N. V. Podkuychenko and A. Y. Khapchaev, et al., Int. J. Mol. Sci., 2021, 23, 211, DOI:10.3390/ijms23010211.
- L. Wang and L.-J. Di, Wnt/β-catenin mediates AICAR effect to increase GATA3 expression and inhibit adipogenesis, J. Biol. Chem., 2015, 290, 19458–19468, DOI:10.1074/jbc.M115.641332.
- W. Zhou, J. Zhang and A. I. Marcus, LKB1 tumor suppressor: Therapeutic opportunities knock when LKB1 is inactivated, Genes Dis., 2014, 1, 64–74, DOI:10.1016/j.gendis.2014.06.002.
- E. Villa, E. S. Ali, U. Sahu and I. Ben-Sahra, Cancer cells tune the signaling pathways to empower de novo synthesis of nucleotides, Cancers, 2019, 11, 688, DOI:10.3390/cancers11050688.
- A. Gonzalez-Franquesa, L. Peijs and D. T. Cervone, et al., Proteomes, 2021, 9, 37, DOI:10.3390/proteomes9030037.
- M. Thevis, A. Thomas and M. Kohler, et al., Emerging drugs: mechanism of action, mass spectrometry and doping control analysis, J. Mass Spectrom., 2009, 44, 442–460 CrossRef CAS PubMed.
- World Anti-Doping Agency (WADA), The world anti-doping code: the 2009 prohibited list international standard, http://www.wada-ama.org/rtecontent/document/2009_List_En.pdf, 2009, accessed April 22, 2021 Search PubMed.
- V. D'Atri, S. Fekete, A. Clarke, J.-L. Veuthey and D. Guillarme, Recent advances in chromatography for pharmaceutical analysis, Anal. Chem., 2019, 91, 210–239, DOI:10.1021/acs.analchem8b05026.
- A. Thomas, S. Beuck, J. C. Eickhoff, S. Guddat, O. Krug, M. Kamber, W. Schänzer and M. Thevis, Quantification of urinary AICAR concentrations as a matter of doping controls, Anal. Bioanal. Chem., 2010, 396, 2899–2908 CrossRef CAS PubMed.
- S. Guddat, E. Solymos and A. Orlovius, et al., Drug Test. Anal., 2011, 3, 836–850 CrossRef CAS PubMed.
- E. V. Dmitrieva, A. Z. Temerdashev, A. A. Azaryan and E. M. Gashimova, Application of solid-phase extraction for the quantification of urinary AICAR by ultra-high performance liquid chromatography–tandem mass-spectrometry, J. Anal. Chem., 2019, 74, 861–864, DOI:10.1134/s1061934819090041.
- N. Kohyama, T. Hayashi and Y. Yamamoto, Synthesis of a methylene analog of 5-Amino-1-β-D-ribofuranosylimidazole-4-carboxamide monophosphate (ZMP), Biosci. Biotechnol. Biochem., 2005, 69, 836–838, DOI:10.1271/bbb.69.836.
- WADA Laboratory Expert Group, WADA Technical Document TD2015IDCR, 2015, http://www.wada-ama.org/sites/default/files/resources/files/td2015idcr_-_eng.pdf Search PubMed.
- E. Houghton and S. Maynard, Some aspects of doping and medication control in equine sports, in, Handbook of Experimental Pharmacology, ed. D. Thieme and P. Hemmersbach, Springer, Berlin, Heidelberg, 195, 2010, pp. 369–409 Search PubMed.
- T. Sobolevsky and B. Ahrens, Urinary concentrations of AICAR and mannitol in athlete population, Drug Test. Anal., 2019, 11, 530–535 CrossRef CAS PubMed.
- Y. Hong and Y. Xu, The detection method establishment and application for LC-MS/MS, Chin. J. Sports Med., 2016, 35, 274–278, DOI:10.16038/j.1000-6710.2016.03.013.
- S. Hashempour, N. Shahabadi and A. Adewoye, et al., Binding Studies of AICAR and Human Serum Albumin by Spectroscopic, Theoretical, and Computational Methodologies, Molecules, 2020, 25, 5410, DOI:10.3390/molecules25225410.
- L. K. Cole, J. E. Vance and D. E. Vance, Phosphatidylcholine biosynthesis and lipoprotein metabolism, Biochim. Biophys. Acta, 2012, 1821(5), 754–761 CrossRef CAS PubMed.
- J. N. van der Veen, J. P. Kennelly and S. Wan, et al., The critical role of phosphatidylcholine and phosphatidylethanolamine metabolism in health and disease, Biochim. Biophys. Acta Biomembr., 2017, 1859(9 Pt B), 1558–1572 CrossRef CAS PubMed.
- E. Calzada, O. Onguka and S. M. Claypool, Phosphatidylethanolamine Metabolism in Health and Disease, Int. Rev. Cell Mol. Biol., 2016, 321, 29–88 CAS.
- M. Houweling, W. Klein and M. J. Geelen, Regulation of phosphatidylcholine and phosphatidylethanolamine synthesis in rat hepatocytes by 5-aminoimidazole-4-carboxamide ribonucleoside (AICAR), Biochem. J., 2002, 362(Pt 1), 97–104 CrossRef CAS PubMed.
- M. A. ElAzzouny, C. R. Evans, C. F. Burant and R. T. Kennedy, Metabolomics Analysis Reveals that AICAR Affects Glycerolipid, Ceramide and Nucleotide Synthesis Pathways in INS-1 Cells, PLoS One, 2015, 10(6), e0129029 CrossRef PubMed.
Footnotes |
| † Electronic supplementary information (ESI) available. See DOI: https://doi.org/10.1039/d4ra02878c |
| ‡ These authors contributed equally to this work. |
| This journal is © The Royal Society of Chemistry 2024 |

